 Open Access Article
Creative Commons Attribution 3.0 Unported Licence
Metastability and polymorphism in dihydroxybenzenes – implications for thermal energy storage†
Tomas S.
Northam de la Fuente‡
 a,
Mattia
Gaboardi‡
ab,
Kalith M.
Ismail
a,
Valerio
Di Lisio
c,
Daniele
Cangialosi
a,
Mattia
Gaboardi‡
ab,
Kalith M.
Ismail
a,
Valerio
Di Lisio
c,
Daniele
Cangialosi
 ac,
Alberto
Otero-de-la-Roza
 d,
Pedro B.
Coto
 *ac and
Felix
Fernandez-Alonso
 *ace
*ace
aMaterials Physics Center, CSIC-UPV/EHU, Paseo Manuel de Lardizabal 5, 20018 Donostia – San Sebastian, Spain. E-mail: pedro.brana@csic.es; felix.fernandez@ehu.eus; Tel: +34 943 01 8836
bChemistry Department, University of Pavia & C.S.G.I., 27100 Pavia, Italy
cDonostia International Physics Center (DIPC), Paseo Manuel de Lardizabal 4, 20018 Donostia – San Sebastian, Spain
dDepartamento de Química Física y Analítica, Facultad de Química, Universidad de Oviedo, 33006 Oviedo, Spain
eIKERBASQUE, Basque Foundation for Science, Plaza Euskadi 5, 48009 Bilbao, Spain
First published on 5th January 2024
Abstract
State-of-the-art calorimetric techniques have been used to explore the effects of molecular isomerism on the phase behaviour of the three dihydroxybenzenes catechol, resorcinol, and hydroquinone. Within the broader remit of the search and rational design of phase-change materials for thermal-energy storage, these data reveal a surprisingly rich (and hitherto unappreciated) behaviour, ranging from an unavoidable propensity to crystallize (hydroquinone) to the emergence of both disordered and ordered metastable phases well below the range of stability of the normal liquid (resorcinol and catechol). Catechol exhibits the most complex thermophysical response, and ab initio calculations evince a subtle interplay between intramolecular and intermolecular interactions, ultimately leading to the formation of new crystal phases.
A significant fraction of the energy that we produce for industrial and domestic use is lost in the form of heat, in some cases amounting to as much as one-half of the total energy input.1,2 Finding ways of avoiding this rather unfavorable situation constitutes an important ingredient to attain a sustainable future. In this context, the need for the rational design of new thermal energy storage (TES) materials is receiving increasing attention, particularly those based on the use of the latent heat associated with well-defined phase transformations.3,4 For these so-called phase change materials (PCMs), the latent heat per unit mass or volume is the primary figure of merit, in order to ensure a more compact and efficient design relative to more traditional routes to TES, such as those solely relying on the heat capacity of the material over a wide temperature range.5 Carbon-based molecular PCMs are particularly attractive for industrial applications, owing to their broad range of melting temperatures, high tunability, and compatibility with construction materials.6 Notwithstanding these merits and strengths, the “chemical space” accessible and to be explored when considering carbon-based PCMs is incredibly vast and, as such, the development of robust physico-chemical criteria to guide materials design has remained quite elusive to date. These must necessarily take into account equally important factors beyond the sheer latent heat per unit mass or the operating temperature, including the kinetics and reversibility of phase transformations.7 Physico-chemical studies to examine these from the point of view of the underlying mechanisms at the molecular level remain quite sparse in the literature.8 One notable exception to the above is the case of linear sugar alcohols, where computer simulations have been able to reproduce known experimental trends in fusion enthalpies, as well as to identify subtle effects associated with the specific topology of hydroxyl (OH) groups along the carbon chains.9–12 Notwithstanding their quite favourable melting enthalpies, linear sugar alcohols exhibit a strong propensity to enter glassy (amorphous) phases, arising from the conformational flexibility of the sp3-hybridised carbon chains and the ensuing entropic barriers that need to be surmounted to enter a well-defined crystalline phase upon cooling from the melt.
Motivated by the above, the present work places a fresh focus on the diHydroxyBenZenes (hereafter dHBZs). These intermediate-weight organic molecules all conform to the general formula C6H4(OH)2, and are characterized by the presence of two OH functional groups covalently bonded to a rigid benzene ring. At the molecular level, there are three possible isomers associated with the occupation of the ortho, meta or para positions around the ring by the second OH group: o-dHBZ, catechol; m-dHBZ, resorcinol; and p-dHBZ, hydroquinone or quinol. Fig. S1 in the ESI† shows these three isomers along with the conformers that result from a change in the relative orientation of the OH hydrogens on the plane of the benzene ring. Table S1 in the ESI† provides a summary of the known properties of the three dHBZ isomers. In their solid phases, only m-dHBZ and p-dHBZ are known to exhibit polymorphism.13,14 In particular, the ambient-temperature α-phase of m-dHBZ undergoes a weak transition into a β phase just before melting at ca. 369 K, involving a subtle rearrangement of intermolecular HBs.15,16 The α-phase of p-dHBZ crystallizes in a more complex rhombohedral unit cell, giving rise to an extended network of HB double helices. Furthermore, the β and γ phases of p-dHBZ are metastable and have only been accessed via crystallization in ethanol (β)17 or sublimation (γ).18 In contrast with the above two cases, the only known structure of o-dHBZ is a P21/c crystal, characterized by chains of molecules tilted by ninety degrees in an alternating fashion.19–21 These observations alone are a strong indicator of the importance and impact of molecular isomerism and the underlying conformational landscape on the phase behaviour of dHBZs, as already hinted by the molecular structures shown in Fig. S1 (ESI†). Exploring the consequences of these three very different scenarios and the implications for the use of dHBZs as PCMs constitutes the primary driver behind this work. To this end, we deploy state-of-the-art calorimetric techniques, and supplement these experimental efforts with ab initio computational materials modelling.
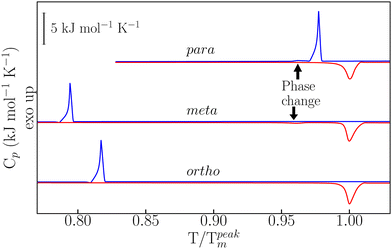
Details on sample preparation and experimental protocols are given in the ESI† and in ref. 22–24. As reported in Fig. 1, temperature-modulated differential scanning calorimetry (TM-DSC) was used in the first instance to assess the heat-storage capacity and melting-crystallization kinetics of the three dHBZ isomers under typical conditions of PCM operation – see also Fig. S3 in the ESI.† All measurements were performed using the “modulated” mode of the instrument. Using in-built instrument-specific functions, this mode enables access to both reversing and non-reversing contributions to the heat flow and heat capacities associated with phase changes.25 The measured enthalpies are in line with reported values – see Tables S1 and S2 in the ESI.† On the basis of these results, there appears to be a correlation between latent heats of crystallization and crystal densities. Specifically, m-dHBZ corresponds to the lowest density and enthalpy of melting, whereas the tighter molecular packing of o-dHBZ and p-dHBZ leads to an overall increase in the latent heat. This trend becomes less clear-cut when considering o-dHBZ vs. p-dHBZ. These two systems exhibit very close densities, with o-dHBZ showing a slightly larger value than p-dHBZ, yet at the same time the latter displays the largest melting enthalpy. These results highlight the complex interplay among the different intermolecular interactions (HBs, stacking, etc.) in a closely packed system, which ultimately dictate the crystal structure. A weak endothermic event was observed in m-dHBZ, with an onset temperature of 367 ± 1 K and an enthalpy of 0.96 ± 0.04 kJ mol−1. These figures are in agreement with those of Ebisuzaki et al.15 In the case of p-dHBZ, the markedly asymmetric shape of the melting peak is suggestive of a similar scenario as this phase change is approached from below. Upon cooling from the melt, p-dHBZ also undergoes a weak exothermic event at 433 ± 1 K with an average enthalpy of 0.16 ± 0.06 kJ mol−1 shortly after the primary crystallization. We tentatively assign this feature to a phase change between two p-dHBZ polymorphs. Molecular isomerism also appears to have pronounced effects on the observed hysteresis between melting and crystallization under these (relatively mild) heating–cooling conditions. In the case of p-dHBZ, hysteresis is relatively small at around 10 K, and the liquid readily crystallizes from the melt. o-dHBZ and m-dHBZ exhibit a much wider stability range of over 60 K for the supercooled liquid, and this behaviour is highly reproducible over consecutive runs within the range of rates accessible with TM-DSC.
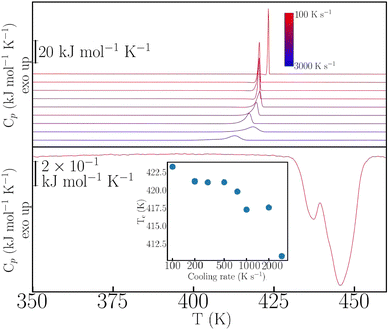
This rich phenomenology calls for further investigation under more extreme thermophysical conditions. To this end, we have performed fast-scanning calorimetry (FSC) experiments up to heating–cooling rates of 3000 K s−1 – for further experimental details, see also the ESI.† The case of p-dHBZ is shown in Fig. 2, recalling that its TM-DSC response exhibits the narrowest hysteresis between melting and crystallization. In this particular instance, crystallization from the melt cannot be avoided at all, and the observed hysteresis upon cooling never exceeds 35 K below the melting point. In addition, the phase transition is invariably observed at around 432 K upon heating, in agreement with the TM-DSC data. The crystallization temperature shows a monotonic decrease with cooling rate. Notwithstanding, the widening of the hysteresis loop in p-dHBZ at the highest-attainable cooling rates is nowhere close to what can be achieved for the other two isomers under the more standard conditions accessible with TM-DSC. Contrary to this extreme tendency to crystallize, m-dHBZ represents the opposite behaviour. For FSC at cooling rates above 0.1 K s−1, it is possible to enter a glassy state, as shown in Fig. S4 and S5 in the ESI.† The emergence of this metastable phase is very reproducible and independent of the specific cooling rate above the aforementioned threshold. From the vitrification-kinetics data shown in Fig. S5 (ESI†), one can track the evolution of the so-called fictive temperature. This quantity corresponds to the point at which the enthalpies of glass and liquid are the same and it represents a measure of how far the glass is away from equilibrium.26,27 For m-dHBZ, it clearly follows a super-Arrhenius behaviour associated with a single characteristic timescale – see also the accompanying discussion in the ESI.†
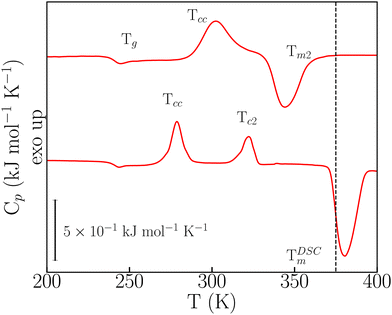
In the FSC regime, o-dHBZ does not conform to any of these two extremes of either unavoidable crystallization (p-dHBZ) or unavoidable vitrification (m-dHBZ). When cooled from the melt at rates greater than 180 K s−1, o-dHBZ vitrifies below 250 K, that is, over 130 K below its normal melting point – see Fig. S6 in the ESI.† Of all three isomers, o-dHBZ exhibits the widest temperature range of extreme supercooling. Heating o-dHBZ above the glass transition leads to a distinct cold crystallization at an onset temperature Tcc. And the position of Tcc depends on both cooling and heating histories. Following Tcc, the FSC data shown in Fig. 3 can be used further to identify two distinct pathways to melting. For heating rates below 1000 K s−1, Tcc is followed by a second cold-crystallization event Tc2 and then by melting at the expected temperature TDSCm of around 380 K – cf. Tables S1 and S2 in the ESI.† As the heating rate from the glass is increased above 1000 K s−1, Tc2 can be avoided entirely following Tcc, and the resulting solid phase exhibits melting at 345 K (Tm2), that is, about 30 K below TDSCm. These FSC results provide unambiguous evidence for the existence of a hitherto unknown crystalline phase of o-dHBZ. Furthermore, the two melting events reported in Fig. 3 are also quite different. The lower value of Tm2 goes hand in hand with a reduction in its associated latent heat by a factor of two relative to that seen for TDSCm, a clear sign of a significant suppression of stabilizing interactions in this new crystalline phase. To gain further insights into this new phase, FSC was used to track the evolution of vitrification, crystallization and melting. To this end, cooling rates were successively lowered from 1500 K s−1 to 250 K s−1, followed by heating from the glass at a constant (maximal) heating rate of 3000 K s−1. Cooling at different rates gives access to different metastable states that can affect Tm2, Tg and Tcc. As shown in Fig. S7 (ESI†), we observe that Tm2 increases with increasing cooling rate. These trends translate into an overall widening of the temperature window over which the supercooled liquid and the resulting ordered metastable phase can be sustained. Finally, Tcc exhibits an overall increase with cooling rate, similar to the one observed in the (unavoidable) crystallization of p-dHBZ.
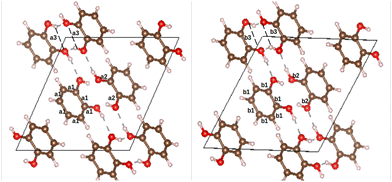
o-dHBZ certainly exhibits the most complex thermophysical behaviour, as evidenced by the emergence of both disordered and ordered metastable phases. To gain new insights into their origin, we have performed ab initio density-functional-theory calculations on the catechol crystal structure and the isolated molecule using Quantum ESPRESSO.28 To this end, we used the B86bPBE-XDM exchange–correlation functional,29–33 periodic boundary conditions, and the projector augmented wave (PAW) method.34 PAW datasets with 4 (C), 6 (O), and 1 (H) valence electrons were obtained from the pslibrary.35 A plane-wave and a density cutoff of 80 Ry and 800 Ry were used, respectively. Crystal structural relaxation was carried out employing as starting point the structure reported in ref. 36. During structural optimization, both lattice parameters and atomic positions were relaxed until all forces were below 0.005 eV Å−1. For the monomer, we used periodic boundary conditions with a 20 Å cubic box and a single k-point at the origin of reciprocal space. The OH-group torsional energy profiles were calculated in 10° steps by relaxing the structures for every value of the H–O–C–C dihedral angle. The all-electron density was obtained using the PAW reconstruction. Non-covalent index (NCI) maps37,38 as well as the electron-density critical points were obtained using the critic2 program.39 The latter used the recently developed “smoothrho” interpolation scheme.40Fig. 4 depicts the experimental and calculated crystal structures of o-dHBZ. As can be observed, both structures show minor differences in bond distances between heavy atoms. Slightly larger discrepancies are noted for some of the lattice constants – see Table S3 in the ESI.† Additional calculations were also performed on the known crystal structures of the other two dHBZ isomers, as shown in Table S3 and Fig. S10–S13 in the ESI.† These results serve to corroborate that our computational methodology provides an adequate description of the electronic structure and intermolecular interactions across all three dHBZs.
Fig. 5 depicts the two nearest-neighbour o-dHBZ dimers in the crystal, along with an analysis in terms of the non-covalent-interactions (NCI) index. We identify two distinct types of NCIs. The first type (green in Fig. 5) is related to weak stabilizing interactions between the monomers (van der Waals, stacking, etc.).41,42 The second and stronger type (red/blue) points at the formation of intermolecular HBs. There is one or two HBs per dimeric unit depending on the relative arrangement of the o-dHBZ molecules, see Fig. 5. For isolated o-dHBZ, the preferred rotational conformer corresponds to an intramolecular arrangement whereby one of the OH hydrogens points towards the vicinal oxygen, as shown in Fig. S1(a) (ESI†). Our NCI analysis indicates the existence of a weak stabilizing intramolecular interactions, in line with experimental results.43,44 This finding is corroborated by comparing the relative strengths of the different NCI interactions in the solid, where intermolecular HBs are significantly stronger than intramolecular ones, as well as those found in the isolated molecule – see Fig. 5 and Fig. S14 in the ESI.† Furthermore, comparison of the crystal with the isolated o-dHBZ molecule shows that it still maintains some of the features seen in the latter. The lowest-energy configuration in isolated o-dHBZ is characterized by an intramolecular O–H⋯O angle of 114.3° and a H⋯O distance of 2.133 Å. In the crystal, this angle decreases to 106.1° and the corresponding distance increases to 2.320 Å. The accompanying intermolecular HB depicted in Fig. 4 and 5(a) has an angle of 145.5° and a distance of 1.839 Å, indicative of a stronger interaction at the expense of an even weaker (yet still present) intramolecular HB. The additional HB in the crystal shown in Fig. 5(b) corresponds to an almost-linear (171.5°) HB with a H⋯O distance of 1.721 Å. These values indicate that this HB is the strongest in the crystal. From a topological viewpoint, we note that no distinct bond critical points could be found for the intramolecular HB either in the isolated molecule or in the solid, in line with previous results.43,45 For intermolecular HBs in the solid, the calculated bond critical-point densities for the structures shown in Fig. 5 amount to 3.12 × 10⁻² a.u. (a) and 4.36 × 10⁻² a.u. (b), respectively.
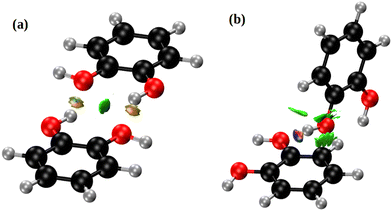 | ||
| Fig. 5 NCI domains in the o-dHBZ crystal, obtained from the ab initio calculations. Colors denote relative strength: high (red/blue) vs. low (green). For further details, see the main text. | ||
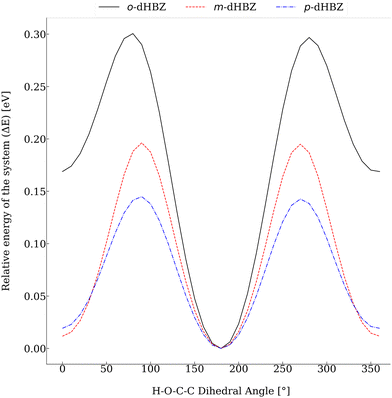
Relative to the other two dHBZ isomers, our calculations indicate that o-dHBZ features a subtle balance and interplay between intramolecular and intermolecular interactions involving OH hydrogens. These considerations can be put on more quantitative grounds by considering the energy scales of interconversion between the rotational conformers shown in Fig. 6. For m-dHBZ and p-dHBZ, distinct local minima are nearly degenerate and well within thermal energies (kBT ∼ 20–30 meV), making them readily accessible over the temperature range explored in the experiments. o-dHBZ, on the other hand, exhibits a well-defined conformational ground state ∼10kBT below other energy minima. This figure represents an upper conservative bound for the solid, given the weakening of intramolecular interactions relative to those of an intermolecular nature. Heating this solid and entering the molten state would then correspond to an intermediate situation between the limits of a fully ordered structure favoring stronger intermolecular HBs (highest density) and the isolated molecule. Within this picture, the complex thermophysical behaviour observed for o-dHBZ can be accounted for in terms of a substantial prevalence of intramolecular bonding in the liquid phase as well as in the resulting metastable (vitreous) phase observed with FSC. For increasingly high heating rates, these intramolecular interactions are retained sufficiently in the supercooled liquid thereby activating new pathways for cold crystallization or annealing. In line with the above considerations, this new ordered phase requires a significantly lower energy input (and temperature) to enter the liquid, as observed experimentally. From the viewpoint of materials design, the behavior of o-dHBZ opens up exciting opportunities to explore and ultimately tailor and control additional degrees of freedom where energy can be locked away or put to use for the assembly of ordered or disordered phases with distinct physico-chemical properties.
The experimental and computational results presented herein also shed new light into the use of dHBZs as PCMs for TES. p-dHBZ has a relatively high latent heat per unit mass well within the range of commercially available materials5 as well as a small hysteresis loop between melting and crystallization. This behaviour is retained over a surprisingly wide range of heating–cooling conditions. As such, p-dHBZ, constitutes the most promising candidate for its use as a PCM, particularly in those situations where energy uptake and release are required over a narrow temperature range. m-dHBZ and o-dHBZ do not conform to this simple scenario. Instead, their high propensity to support metastable phases well below the normal liquid under typical conditions for PCM operation could very well pave the way for their use in hybrid TES systems, such as those designed to exploit simultaneously both latent and sensible contributions to TES performance.
Financial support for this work has been secured through Grants PID2020-114506GB-I00 funded by MCIN/AEI/10.13039/501100011033; TED2021-129457B-I00 funded by MCIN/AEI/10.13039/501100011033 and the European Union NextGenerationEU/PRTR; EC-2022-1-0019, funded by the Basque Government; and RES-QHS-2023-1-0027, supported by the Red Española de Supercomputación for access to computer resources at XULA-CIEMAT. A. O. R thanks the Principality of Asturias (FICYT) for project AYUD/2021/51036, cofinanced by EU FEDER. M. G. acknowledges the support of Chiara Milanese from the University of Pavia. We also acknowledge the continued support received from the IKUR Strategy under the collaboration agreement between Ikerbasque Foundation and the Materials Physics Center on behalf of the Department of Education of the Basque Government.
Conflicts of interest
There are no conflicts to declare.Notes and references
- H. Zhang, H. Wang, X. Zhu, Y.-J. Qiu, K. Li, R. Chen and Q. Liao, Appl. Energy, 2013, 112, 956–966 CrossRef.
- S. Nadaf and P. Gangavati, Int. J. Adv. Eng. Technol., 2014, 5, 31–39 Search PubMed.
- T. Yan, R. Wang, T. Li, L. Wang and T. Ishugah, Renew. Sustainable Energy Rev., 2014, 43, 13–31 CrossRef.
- Y. Tian and C. Zhao, Appl. Energy, 2013, 104, 538–553 CrossRef CAS.
- H. Nazir, M. Batool, F. J. B. Osorio, M. Isaza-Ruiz, X. Xu, K. Vignarooban, P. Phelan Inamuddin and A. M. Kannan, Int. J. Heat Mass Transf., 2019, 129, 491–523 CrossRef CAS.
- F. Kuznik, K. Johannes and D. David, in Advances in Thermal Energy Storage Systems, ed. L. F. Cabeza, Woodhead Publishing, 2015, pp. 325–353 Search PubMed.
- Y. Li, Y. Kou, K. Sun, J. Chen, C. Deng, C. Fang and Q. Shi, J. Energy Chem., 2023, 80, 228–236 CrossRef CAS.
- Y. Liu, Y. Deng, J. Zheng, F. Wu, J. Lu, S. Sun, D. Wu and T. Wu, Sol. Energy Mater. Sol. Cells, 2022, 248, 112031 CrossRef CAS.
- X. Shao, S. Yang, L. Fan and Y. Yuan, J. Energy Storage, 2023, 68, 107848 CrossRef.
- B. Feng, L.-W. Fan, Y. Zeng, J.-Y. Ding and X.-F. Shao, Int. J. Therm. Sci., 2019, 146, 106103 CrossRef CAS.
- T. Inagaki and T. Ishida, J. Am. Chem. Soc., 2016, 138, 11810–11819 CrossRef CAS PubMed.
- T. Inagaki and T. Ishida, J. Phys. Chem. C, 2016, 120, 7903–7915 CrossRef CAS.
- M. D. Ossowska-Chrusciel, E. Juszynska-Galazka, W. Zajac, A. Rudzki and J. Chrusciel, J. Mol. Struct., 2015, 1082, 103–113 CrossRef CAS.
- Y. Lee, J.-W. Lee, H.-H. Lee, D. R. Lee, C.-C. Kao, T. Kawamura, Y. Yamamoto and J.-H. Yoon, J. Chem. Phys., 2009, 130, 112031 Search PubMed.
- Y. Ebisuzaki, L. H. Askari, A. M. Bryan and M. F. Nicol, J. Chem. Phys., 1987, 87, 6659–6664 CrossRef CAS.
- W. Acree, Jr. and J. S. Chickos, J. Phys. Chem. Ref. Data, 2016, 45, 033101 CrossRef.
- D. F. Evans and R. E. Richards, Nature, 1952, 170, 246 CrossRef CAS.
- K. Maartmann-Moe, Acta Cryst., 1966, 21, 979–982 CrossRef CAS.
- B. Y. C. J. Brown and F. Cal, Nature, 1926, 117, 170–174 CrossRef.
- W. Clegg and A. Scott, CSD Commun., 2017 DOI:10.5517/ccdc.csd.cc1pw33s.
- H. Wunderlich and D. Mootz, Acta Crystallogr., Sect. B: Struct. Sci., Cryst. Eng. Mater., 1971, 27, 1684–1686 CrossRef CAS.
- V. Di Lisio, B. Braunewell, C. Macia-Castello, M. Simoni, R. Senesi, F. Fernandez-Alonso and D. Cangialosi, Thermochim. Acta, 2023, 719, 179414 CrossRef CAS.
- M. Gaboardi, I. Silverwood, B. Braunewell, J. Siegel and F. Fernandez-Alonso, Carbon, 2021, 183, 196–204 CrossRef CAS.
- J. Armstrong, S. Mukhopadhyay, F. Bresme and F. Fernandez-Alonso, Phys. Chem. Chem. Phys., 2016, 18, 17202–17209 RSC.
- B. Wunderlich, A. Boller, I. Okazaki and K. Ishikiriyama, Thermochim. Acta, 1997, 304–305, 125–136 CrossRef.
- D. Cangialosi, J. Condens. Matter Phys., 2014, 26, 153101 CrossRef CAS PubMed.
- J. M. Hutchinson, J. Therm. Anal. Calorim., 2009, 98, 579–589 CrossRef CAS.
- P. Giannozzi, O. Andreussi, T. Brumme, O. Bunau, M. B. Nardelli, M. Calandra, R. Car, C. Cavazzoni, D. Ceresoli and M. Cococcioni, et al. , J. Phys.: Condens. Matter, 2017, 29, 465901 CrossRef CAS PubMed.
- A. D. Becke, J. Chem. Phys., 1986, 85, 7184 CrossRef CAS.
- J. P. Perdew, K. Burke and M. Ernzerhof, Phys. Rev. Lett., 1996, 77, 3865–3868 CrossRef CAS PubMed.
- E. R. Johnson, in Non-covalent Interactions in Quantum Chemistry and Physics, ed. A. Otero-de-la Roza and G. A. DiLabio, Elsevier, 2017, ch. 5, pp. 169–194 Search PubMed.
- A. D. Becke and E. R. Johnson, J. Chem. Phys., 2007, 127, 154108 CrossRef PubMed.
- A. Otero-de-la-Roza and E. R. Johnson, J. Chem. Phys., 2012, 136, 174109 CrossRef CAS PubMed.
- P. Blöchl, Phys. Rev. B: Condens. Matter Mater. Phys., 1994, 50, 17953 CrossRef PubMed.
- A. Dal Corso, Comput. Mater. Sci., 2014, 95, 337–350 CrossRef.
- C. J. Brown, Acta Cryst., 1966, 21, 170–174 CrossRef CAS.
- E. R. Johnson, S. Keinan, P. Mori-Sánchez, J. Contreras-García, A. Cohen and W. Yang, J. Am. Chem. Soc., 2010, 132, 6498–6506 CrossRef CAS PubMed.
- A. Otero-de-la-Roza, E. R. Johnson and J. Contreras-García, Phys. Chem. Chem. Phys., 2012, 14, 12165–12172 RSC.
- A. Otero-de-la-Roza, E. R. Johnson and V. Luaña, Comput. Phys. Commun., 2014, 185, 1007–1018 CrossRef CAS.
- A. Otero-de-la Roza, J. Chem. Phys., 2022, 156, 224116 CrossRef CAS PubMed.
- L. Estévez, N. Otero and R. A. Mosquera, J. Phys. Chem. A, 2009, 113, 11051 CrossRef PubMed.
- V. Barone, I. Cacelli, A. Ferretti and G. Prampolini, Biomimetics, 2017, 2, 18 CrossRef PubMed.
- J. Bruckhuisen, G. Dhont, A. Roucou, A. Jabri, H. Bayoudh, T. T. Tran, M. Goubet, M.-A. Martin-Drumel and A. Cuisset, Molecules, 2021, 26, 3645 CrossRef CAS PubMed.
- D. J. Bakker, A. Peters, V. Yatsyna, V. Zhaunerchyk and A. M. Rijs, J. Phys. Chem. Lett., 2016, 7, 1238 CrossRef CAS PubMed.
- M. Mandado, A. M. Graña and R. A. Mosquera, Phys. Chem. Chem. Phys., 2004, 6, 4391–4396 RSC.
Footnotes |
| † Electronic supplementary information (ESI) available: Experiments, Calculations, and Additional experimental and computational results. See DOI: https://doi.org/10.1039/d3ya00510k |
| ‡ These authors contributed equally to this work. |
| This journal is © The Royal Society of Chemistry 2024 |

