
 Open Access Article
 This Open Access Article is licensed under a Creative Commons Attribution-Non Commercial 3.0 Unported Licence
Co-Prussian blue analogue supported on graphene-based materials as an electrocatalyst for OER at neutral pH†
Rafael G.
Yoshimura
 ,
Thiago V.
de B. Ferraz
,
Priscilla J.
Zambiazi
and
Juliano A.
Bonacin
*
,
Thiago V.
de B. Ferraz
,
Priscilla J.
Zambiazi
and
Juliano A.
Bonacin
*
Institute of Chemistry, University of Campinas, 13083-970 Campinas, SP, Brazil. E-mail: jbonacin@unicamp.br
First published on 26th December 2023
Abstract
The development of efficient, robust, and low-cost electrocatalysts for the oxygen evolution reaction (OER) under mild conditions is a sustainable pathway for energy conversion and storage technologies. Cobalt Prussian blue analogue (Co-PBA) has been emerging as a potential candidate to be engineered and match such requirements. In this study, the catalytic activity performance of Co-PBA was improved by depositing over different types of graphene-based materials that act as supports, resulting in hybrid composites. The Co-PBA + r_GO N2, which is Co-PBA deposited over a reduced graphene oxide doped with N atoms (urea as N source), showed the best OER catalytic improvements in a neutral medium (0.5 mol L−1 KNO3), reducing the overpotential in 54 mV and 137 mV to reach current densities of 10 (J10) and 50 (J50) mA cm−2, respectively, in comparison to the sole electrocatalyst Co-PBA. These results indicate that the interaction between the Co-PBA and graphene-based supports plays a pivotal role in effectively enhancing the OER activity of the electrocatalyst.
Introduction
The generation of renewable electricity from natural sources (such as solar, wind, and ocean) can potentially attend to the global energy demand.1 One of the main issues associated with promoting energy transition from fossil fuel to intermittent renewable energy sources is mainly related to energy storage.2–4 Green hydrogen emerges as a critical enabler in this energy transition scenario, where renewable electricity can be stored in chemical bonds through the electrochemically driven water-splitting reaction.2–4The cathodic hydrogen evolution reaction (HER) and anodic oxygen evolution reaction (OER) are the two half-reactions that comprise electrochemical water splitting.5,6 Despite the product of interest being generated at the cathode, the intrinsic sluggish kinetics of the OER, which is a complex multistep process that involves four proton-coupled electron transfers and O2 bond formation, hamper accomplishing the overall process.6,7 In addition to its application in the water splitting field, the OER is a strategic reaction in energy conversions and storage technologies, such as solar energy,8,9 rechargeable metal–air batteries,10–12 and regenerative fuel cells.13 To minimize the higher overpotential and kinetic barrier associated with OER, various electrocatalysts have been designed to operate under extremely alkaline pH conditions. The OER is a pH-dependent reaction that profits from the abundant OH− active species according to eqn (1):1,14–16
| OER in an alkaline medium: 4OH− → O2 + 2H2O + 4e− | (1) |
Cobalt-based catalysts for the OER in a neutral medium have attracted considerable appreciation for their activity, stability, and simple process of preparation from low-cost materials.6,12 Cobalt-Prussian blue analogue (Co-PBA) is one example that has been displaying great performance towards the OER under mild conditions.5,6,19 Despite its advantages, Co-PBA exhibits a major drawback of a low concentration of exposed electroactive cobalt sites.20 A strategy to circumvent this shortcoming is the use of a Co-PBA/graphene-based composite where the graphene-based materials act as a support providing a boost to the electroactive sites.21 Additionally, nitrogen doping on graphene-based materials can effectively impact their properties such as conductivity and charge transfer. Accommodating electrocatalysts over nitrogen-doped graphene-based supports has been reported as an effective way to improve the distribution of metal nanoparticles, enhancing mass transfer and boosting the electrocatalytic performance toward water splitting.22,23
Herein, we report a simple and facile strategy to improve the performance of the Co-PBA electrocatalyst toward the OER at neutral pH by depositing over different types of graphene-based materials that act as a support, resulting in hybrid composites. Furthermore, we aim to understand the role of the graphene-based supports in the electrocatalyst activity and how we can modulate this interaction to achieve outstanding performances in the resulting hybrid composite.
Results and discussion
Graphene-based supports
All the graphene-based samples were subjected to CHN elemental analysis to determine their composition and further confirm the presence of N atoms in their structures. Table 1 lists the elemental compositions of all graphene-based samples. As expected, GO has the highest oxygen content (57.96 wt%) and lowest carbon content (38.53 wt%). Upon hydrothermal reduction, the carbon content of the derived samples tended to increase while their oxygen content decreased, as evidenced by their C/O ratios (Table 1). These results confirm that the hydrothermal treatment partially removed some of the oxygen functionalities. In addition, the analysis confirms the successful doping of N atoms on r_GO N1, r_GO N2, and r_GO N3, which were used stoichiometrically with 3 different sources of nitrogen (ammonium hydroxide, urea, and hydrazine, respectively). As can be seen in Table 1, all 3 N-doped samples have relatively similar nitrogen content.
Although r_GO N1 has the highest nitrogen content, its elemental composition is similar to that of the r_GO N2. A trend observed in the N-doped materials is that a higher nitrogen content results in a lower C content, and consequently a lower C/N ratio. These results also indicate that starting from the same precursor (GO) and varying the type of nitrogen source leads to the formation of different materials. r_GO N3 is noteworthy due to its highest carbon content and lowest oxygen and nitrogen contents. We believe that this is related to the source of nitrogen used in the r_GO N3 synthesis, hydrazine, which is a strong reducing agent. As in the synthesis of the N-doped graphene-based materials, the precursor, GO, was previously stirred for 2 hours with the respective nitrogen source before the hydrothermal treatment; thus, r_GO N3 was first subjected to a chemical environment that lowered the oxygen content prior to the hydrothermal treatment. This prior removal of oxygen functionalities over the precursor material may also hinder the insertion of N atoms since it is expected that the N atoms are incorporated by the carbon lattice when they react with oxygenated functionalities during the hydrothermal treatment.24 Thus, in this approach, r_GO N3 already underwent the hydrothermal treatment with a relatively small number of oxygenated groups, leading to the material with the highest degree of reduction and lowest N content.
 | ||
| Fig. 1 SEM images of the graphene-based samples. The scale bars are shown in each figure. Images are (A) GO; (B) r_GO; (C) r_GO N1; (D) r_GO N3; (E) r_GO N3. | ||
![[double bond, length as m-dash]](https://www.rsc.org/images/entities/char_e001.gif) O stretching), 1402 cm−1 (OH deformation), and 1224 cm−1 (epoxy C–O stretching) can be observed mainly in GO.26,27 The samples that were subjected to hydrothermal treatment exhibited smaller intensities of the bands associated with oxygenated groups, mostly 3400 cm−1, which agrees with the reduction process. The bands at 2930 and 2853 cm−1 correspond to the CH2 symmetric and anti-symmetric stretching vibration respectively,26 while the bands at 1630 cm−1 can be correlated to the skeletal vibration of graphitic domains.28 For the samples that were N-doped, the bands located at 1570 cm−1 correspond to the carbon–nitrogen bond.26
O stretching), 1402 cm−1 (OH deformation), and 1224 cm−1 (epoxy C–O stretching) can be observed mainly in GO.26,27 The samples that were subjected to hydrothermal treatment exhibited smaller intensities of the bands associated with oxygenated groups, mostly 3400 cm−1, which agrees with the reduction process. The bands at 2930 and 2853 cm−1 correspond to the CH2 symmetric and anti-symmetric stretching vibration respectively,26 while the bands at 1630 cm−1 can be correlated to the skeletal vibration of graphitic domains.28 For the samples that were N-doped, the bands located at 1570 cm−1 correspond to the carbon–nitrogen bond.26
 | ||
| Fig. 2 IR spectra of the graphene-based samples. | ||
Raman spectroscopy analyses were done to investigate the structural features of graphene-based materials. Their Raman spectra (Fig. 3) exhibit two distinct bands, D (1346–1349 cm−1) and G (1592–1600 cm−1). The D band arises due to disorder and structural defects caused by the sp3 hybridized carbon atoms, while the G band is commonly observed in all graphitic structures and occurs due to the doubly degenerate phonon mode of the sp2 carbon network.29
 | ||
| Fig. 3 Raman spectra of the graphene-based samples with their respective Id/Ig ratios. These spectra correspond to (A) GO; (B) r_GO; (C) r_GO N1; (D) r_GO N3; (E) r_GO N3. | ||
The intensity ratio of the D and G bands (Id/Ig) is associated with the amount of structural defects, disorder, and edge plane exposure of the graphene sheets.30 The increase in the Id/Ig values shown in Fig. 3 indicates that the hydrothermal reduction and nitrogen doping possibly resulted in materials with a higher sp3/sp2 carbon ratio, more defects, disorder, and edge sites in comparison to the precursor material.30,31 Also, the Raman spectra evaluated the positions of the D and G bands exhibited in Table S1 (ESI†). The downshift observed in the G band from the precursor to the derived samples agrees with previous studies and is indicative of reduction and/or doping.32 This downshift may be explained by the lower content of oxygen bonded to the carbon skeleton, providing the carbon atoms a bond less rigid in its stretch mode and consequently lower energy.
Co-PBA electrocatalyst
 | ||
| Fig. 4 SEM image of Co-PBA. | ||
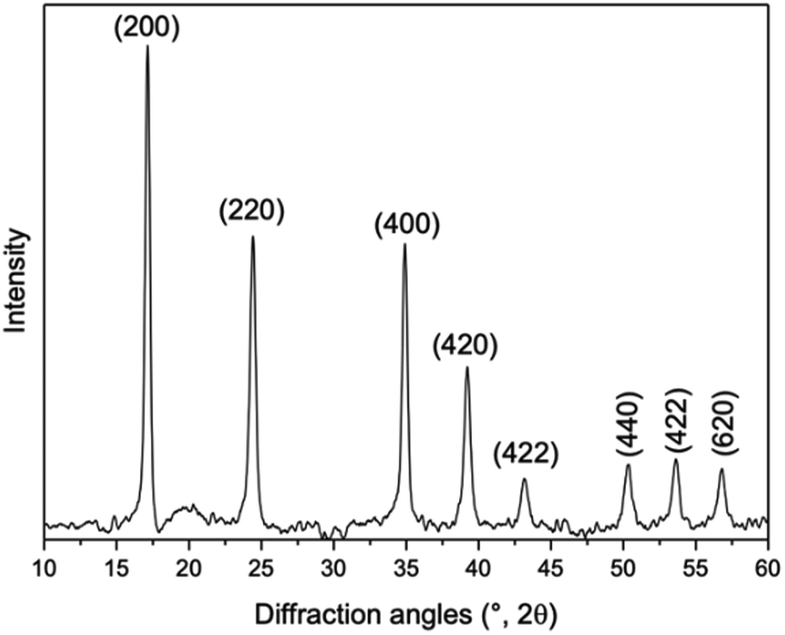 | ||
| Fig. 5 X-ray powder diffraction (XRD) pattern of the cobalt Prussian blue analogue (Co-PBA) with the crystallographic planes (PDF number 72-1431). | ||
 | ||
| Fig. 6 Raman and infrared spectra of Co-PBA. | ||
Electrochemical parameters
To evaluate the electrochemical parameters of the materials, cyclic voltammograms (CV) of the modified GCE with the described materials were obtained using a solution containing 5 mmol L−1 [Ru(NH3)6]3+ and 0.1 mmol L−1 KNO3 as the redox probe and support electrolyte respectively. The voltammograms and parameters obtained from the experiments are presented in Fig. S2 (ESI†) and Table 2, respectively.| Sample | Electrochemical properties | OER activity | |||
|---|---|---|---|---|---|
| ECSA 10−2 (cm2) | K obs 10−3 (cm s−1) | Tafel (mV dec−1) | η (mV) j = 1 mA cm−2 | η (mV) j = 10 mA cm−2 | |
| Co-PBA | 4.94 | 3.01 | 188 | 590 | 980 |
| GO | 5.26 | 1.70 | 174 | 670 | 1040 |
| r_GO | 3.99 | 0.62 | 196 | 660 | 1060 |
| r_GO N1 | 3.90 | 0.77 | 210 | 700 | 1070 |
| r_GO N2 | 3.81 | 0.91 | 217 | 770 | 1090 |
| r_GO N3 | 3.89 | 2.01 | 208 | 660 | 1050 |
Among all the materials, Co-PBA exhibited the highest  , which was expected due to the presence of the metallic centers. Regarding the comparison of the graphene-based materials, GO and r_GO N3 had higher values for
  , as more defined peaks can be seen in their voltammograms (Fig. S2(A) and (F), ESI†). We suppose that this is correlated to the higher amount of oxygen functionalities present on GO, as O atoms have relatively high electronegativity and easily get a partial negative charge, thus increasing the interaction and approximation with the redox probe, [Ru(NH3)6]3+, which is a positive species. However, the electrochemical behavior of r_GO N3 could be caused by the highest intensity ratio of the D and G bands (Id/Ig), which indicates that the material may have more edge sites, where electronic transfer is faster.36,37 For the other materials, r_GO, r_GO N1 and r_GO N2, their voltammograms (Fig. S2(C)–(E), ESI†) reveal capacitive features.
Linear sweep voltammetry (LSV) in a 0.1 mol L−1 KNO3 solution at pH 7 was performed to analyze the oxygen evolution reaction (OER) activity of the materials (Fig. 7A). The electrocatalytic information obtained from the LSV curves is presented in Table 2. As expected, Co-PBA has the lowest overpotentials of 590 mV and 980 mV to reach current densities of 1 mA cm−2 (J1) and 10 mA cm−2 (J10), respectively. In the graphene-based group, GO and r_GO N3 exhibited lower overpotentials to reach J10, mostly according to the same trend observed in their  values.
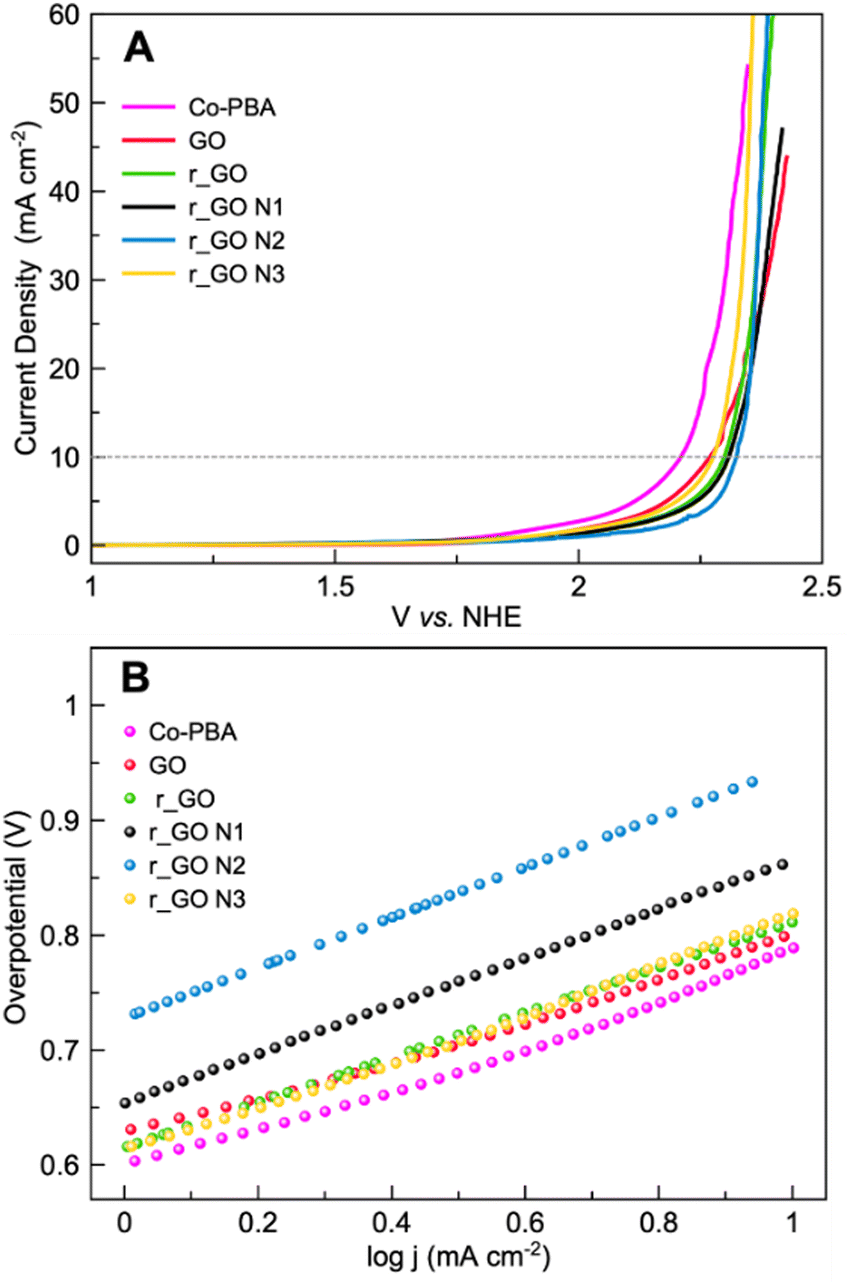 | ||
| Fig. 7 Electrochemical experiments of Co-PBA and graphene-based materials performed in 0.5 mol L−1 KNO3 at a scan rate of 5 mV s−1. (A) Linear sweep voltammetry (LSV) and (B) Tafel plot. | ||
Tafel plots were used to assess the kinetic behavior of the materials toward OER. This allowed us to obtain information regarding how the current density increased with the applied overpotential.7 The Tafel plots and slopes are presented in Fig. 7B and Table 2, respectively. The kinetic behavior of the materials was evaluated in the interval range between J1 and J10, where the analyzed variables behaved linearly. Examining the Tafel slope values in Table 2, GO displays the lowest value followed by Co-PBA, indicating that both materials have faster kinetics and a relatively similar mechanism. Also, the Tafel slope values reveal that subjecting GO to hydrothermal treatment and doping with N atoms results in materials with a slower mechanistic pathway. As can be verified in Table 2, higher values of the Tafel slope were obtained for all materials obtained from GO.
OER activity of the hybrid composites
In an attempt to improve the performance of the Co-PBA electrocatalyst, we first deposited the graphene-based materials onto the surface of the GCE to act as a support, followed by the deposition of Co-PBA over the graphene-based depositions. Thereby, the Co-PBA remains on the interface with the electrolytic solution to act as the electrocatalyst. For further comparison with the previous electrochemical experiments, the total amount of material deposited on the GCE surface was maintained. The results and electrochemical parameters obtained for the hybrid composites are presented in Fig. 8A–C and Table 3. | ||
| Fig. 8 Electrochemical experiments of the hybrid composites performed in 0.5 mol L−1 KNO3 at a scan rate of 5 mV s−1. (A) Linear sweep voltammetry (LSV), (B) the redox process Co2+/Co3+ and (C) the Tafel plot. | ||
| Support | ΔJ10 (mV) | ΔJ50 (mV) | Tafel (mV dec−1) | |
|---|---|---|---|---|
| ΔJ10 = (voltage of the composite − voltage of Co-PBA) at J10. ΔJ50 = (voltage of the composite − voltage of Co-PBA) at J50. | ||||
| Co-PBA | GO | −52 | −115 | 183 |
| r_GO | −51 | −107 | 200 | |
| r_GO N1 | −39 | −85 | 175 | |
| R_GO N2 | −54 | −137 | 180 | |
| r_GO N3 | −51 | −136 | 175 | |
The LSV curves (Fig. 8A) reveal that all the hybrid composites could reach J10 and J50 at lower potentials than the sole Co-PBA. The ECSA of Co-PBA was used to normalize the current density of all hybrid composites due to the presence of Co-PBA in all hybrid composites and in direct contact with the electrode/solution interface. Table 3 summarizes the variation between the hybrid composites and sole Co-PBA to reach J10 and J50. We represent the term ΔJ10 as the difference between the composite and sole Co-PBA to reach J10 (ΔJ10 = voltage at J10 of the composite – voltage at J10 of the sole Co-PBA). Almost all hybrid composites could reach J10, needing less than 50 mV in comparison to sole Co-PBA, except Co-PBA + r_GO N1, which required less than 39 mV. Moreover, we could achieve significant progress at a larger current density of 50 mA cm−2 (J50), as listed in Table 3. Except for Co-PBA + r_GO N1, all the hybrid composites could be reduced by more than 100 mV to reach J50. Notably, Co-PBA + r_GO N2 and Co-PBA + r_GO N3 exhibited the best performances, reducing 137 and 136 mV, respectively.
These results clearly indicate that the graphene-based supports play a pivotal role in the electrocatalytic performance of Co-PBA. The lower overpotentials observed for the hybrid composites to reach J10 and J50 may indicate a lower energy barrier. In electrocatalytic processes that use cobalt-based catalysts, it is assumed that Co3+ is the main active site involved in the catalytic steps such as adsorption, activation, and desorption.38 However, the Co3+ active site on Co-PBA is obtained from the oxidation of Co2+ present in its sphere of external coordination, Co3[Co(CN)6]2, where is also located some vacancies on the structure mainly occupied by water molecules, a feature of Prussian blue analogues.39 The Co3+ in the sphere of internal coordination is more related to providing stabilization to the structure. Therefore, when the GCE was modified with the hybrid composite, the presence of the graphene-based support assisted in obtaining the Co3+ active sites on Co-PBA at lower potentials in comparison to the sole Co-PBA, as can be seen in Fig. 8B. Also, it is noteworthy that the hybrid composites start polarization earlier than the sole Co-PBA, especially the supports derived from GO, which is related to the capacitive properties of these graphene-based materials. As the potential is applied, these supports accumulate charge behaving similarly to a capacitor. Thus, the charged supports interact with the electrocatalyst resulting in a boost in the active sites and lowering the potential of the Co2+/Co3+ redox process, which may help the water molecules to undergo the nucleophilic attack to proceed with the OER.
According to the Tafel slopes obtained for the hybrid composites (Fig. 8C and Table 3), the presence of graphene-based supports can also improve the kinetics of the reaction. As can be seen, most hybrid composites had lower Tafel slope values than the sole Co-PBA (except Co-PBA + r_GO). In addition to these Tafel slopes being lower, they are relatively close to the Tafel slope of sole Co-PBA, which may indicate that even in the presence of the support, the kinetics of the reaction could continue through a similar mechanism performed by the sole Co-PBA. To compare the performance of the hybrid composites used in this work, Table S2 (ESI†) exhibits the electrochemical parameters of some electrocatalysts reported in the literature under mild conditions.
Conclusions
In summary, an effective way to improve the electrocatalytic performance of Co-PBA toward the OER in a neutral medium is presented. Hydrothermal treatment could partially reduce graphene oxide and dope with nitrogen stoichiometrically considering different sources of nitrogen (ammonium hydroxide, urea, and hydrazine), resulting in different materials. These graphene-based materials were designed to act as supports to boost the electroactive sites of the electrocatalyst. Overall, all hybrid composites could reduce the potential to reach J10 and J50 compared to sole Co-PBA. Moreover, by analyzing the kinetic parameters, all hybrid composites with only one exception, Co-PBA + r_GO, could still improve the kinetics of the reaction. This improvement, especially at J50, may be seen as progress in the field of the OER at neutral pH (mild conditions) since the materials used in the hybrid composites are relatively cheap and easy to synthesize/work. In addition, it is worth mentioning that by using hybrid composites, we could reduce the amount of the electrocatalyst by 50% and still obtain better results. Further research is still necessary to better understand the interaction between the support and electrocatalyst; however, this approach has proven to be an efficient way to help the electrocatalyst achieve outstanding OER performance in a neutral medium.Experimental materials
Graphite powder (100%) was obtained from Fischer Chemicals (Fair Lawn, NJ, USA). Sulfuric acid, H2SO4 (95–98.0%), potassium permanganate, KMnO4 (99.0%), phosphoric acid, H3PO4 (85.0%), hydrogen peroxide aqueous solution, H2O2 (29.0%), hydrochloric acid, HCl (37–38.0%), sodium hydroxide, NaOH (97.0%), urea, CH4N2O (99.5%), ammonium hydroxide, NH4OH (28.0%) and tri-sodium citrate dihydrate, C6H5Na3O7·2H2O (99.0%) were purchased from Synth (Diadema, SP, Brazil). Potassium nitrate, KNO3 (≥99.0%), potassium hexacyanocobaltate(III), K3[Co(CN)6] (>97.0%), cobalt acetate tetrahydrate, Co(CH3COO)2·4H2O (≥99.0%), Nafion perfluorinated (5 wt% in lower aliphatic alcohols and water), hexaammineruthenium(III) chloride, [Ru(NH3)6]Cl3 (98.0%), hydrazine monohydrate, N2H4 64–65.0%, N2H4·H2O (98.0%) and cellulose membrane (avg. flat width: 76 mm, MW 12.121) were provided by Sigma-Aldrich (USA). Ethanol P.A. was obtained from LS Chemicals. All aqueous solutions were prepared using ultrapure water (18.2 MΩ cm), obtained from a Milli-Q Plus system (Merck Millipore, USA). All the above chemicals were of analytical grade and used without any further purification.Synthetic procedures
Characterization methods
The morphologies of the graphene-based materials and Co-PBA were characterized using a Jeol JSM-6360 LV scanning electron microscope and a Quanta 250 field emission scanning electron microscope, respectively. X-ray diffractograms (XRD) were obtained using a Shimadzu 7000 XRD diffractometer with CuKα1 radiation (λ = 1.5418 Å) in the 2θ range of 10–60° at a scan rate of 2° min−1. Raman spectra were obtained using a Confocal T64000 spectrometer (Jobin Yvon, USA) with a solid-state sapphire laser of 532 nm. Elemental analyses (CHN) were carried out on a PerkinElmer 2400 series ii instrument based on the Pregl–Dumas method. The oxygen content was estimated from the difference between 100% and the sum of the C + H + N%, assuming that no ash was present. ATR-FTIR spectra were recorded on an Agilent Cary 630 in a range of 400 to 4000 cm−1, and the FTIR spectra of the graphene-based samples were obtained using standard KBr pellets (0.5 mg sample + 100 mg KBr).Working electrode modification
The glass carbon electrode (GCE) was polished with 1.0, 0.5 and 0.3 μm alumina slurry on a polishing cloth, rinsed with DI water, and then immersed in ethanol for 10 minutes. The suspensions were prepared with 4.5 mg of the samples dispersed in 1.1 mL of ethanol, 360 μL of DMF, and 30 μL of Nafion, resulting in a concentration of ≃3 mg mL−1. The prepared sample dispersions were sonicated for 2 hours and subsequently, 4 depositions of 2 μL of suspension were dropped onto the surface area of GCE (area = 0.071 cm−2, resulting in a catalyst load of ≃0.34 mg cm−2). The interval between each deposition was 30 minutes and then the samples were allowed to dry at room temperature for over 12 h. To obtain the hybrid composite, we performed the same procedure as described above with the first 2 depositions of a graphene-based material to act as a substrate, followed by 2 depositions of the Co-PBA catalyst.Electrochemical measurements
All electrochemical experiments were performed at room temperature (25 °C ± 2 °C) using a Metrohn Autolab potentiostat PGSTATIO302N, connected to a PC. A standard three-electrode electrochemical cell was used with modified GCE as the working electrode, saturated calomel electrode (SCE) as the reference electrode, and platinum wire as the counter electrode. Prior to the experiments, the electrolyte solutions were purged with N2 for 15 minutes.Calculation methods
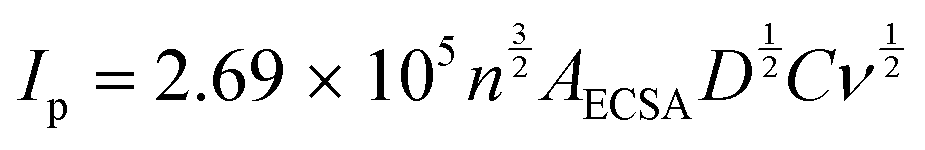
The calculations used to determine the electrochemical properties and electrocatalytic parameter activities are described next.The ECSA of the samples were obtained according to the Randles–Ševčíck equation,41–43 where Ip is the peak current, n is the number of electrons involved in the electrochemical process, AECSA is the electrochemical surface area, D is the diffusion coefficient (9.10 × 10⁻⁶ cm2 s−1 for [Ru(NH3)6]3+), C is the concentration of the redox probe and ν is the scan rate:
K
obs was obtained by the Nicholson method41–43 using the following equation:

The iR drop correction of 90% was carried out using the positive feedback compensation method, provided by the electrochemical workstation in the LSV experiments used to evaluate the OER activity. The Tafel plots were extracted from the LSV curves with 100% iR correction. The reference electrode (SCE) potentials were converted into normal hydrogen electrode (NHE) potentials according to the following equation:
| E vs. NHE = E vs. SCE + 0.224 |
Author contributions
Rafael G. Yoshimura – investigation, formal analysis, data curation, writing – original draft, review & editing; Thiago V. de B. Ferraz – formal analysis, writing – review & editing; Priscilla J. Zambiazi – formal analysis, writing – review & editing; Juliano A. Bonacin – supervision, resources, visualization, writing – review & editing.Conflicts of interest
There are no conflicts to declare.Acknowledgements
All authors are grateful for financial support of Brazilian Funding Agencies. This study was financed in part by the Coordenação de Aperfeiçoamento de Pessoal de Nível Superior – Brasil (CAPES) – Finance Code 001 and Process 88887.339135/2019-00, Conselho Nacional de Desenvolvimento Científico e Tecnológico CNPq (308203/2021-6) and Fundação de Amparo à Pesquisa do Estado de São Paulo, FAPESP (grant# 2017/11986-5, grant# 2021/05976-2).References
- I. Roger, M. A. Shipman and M. D. Symes, Nat. Rev. Chem., 2017, 1, 0003 CrossRef CAS.
- A. M. Abdalla, S. Hossain, O. B. Nisfindy, A. T. Azad, M. Dawood and A. K. Azad, Energy Convers. Manage., 2018, 165, 602–627 CrossRef CAS.
- T. Von Zuben, D. Moreira, R. Germscheidt, R. Yoshimura, D. Dorretto, A. De Araujo, A. Salles Jr and J. Bonacin, J. Braz. Chem. Soc., 2022, 8, 824–843 Search PubMed.
- R. Germscheidt, D. Moreira, R. Yoshimura, N. Gasbarro, E. Datti, P. Dos Santos and J. Bonacin, Adv. Energy Sustainability Res., 2021, 2, 2100093 CrossRef CAS.
- B. Pires, P. Dos Santos, V. Katic, S. Strohauer, R. Landers, A. Formiga and J. Bonacin, Dalton Trans., 2019, 48, 4811–4822 RSC.
- P. Zambiazi, G. Aparecido, T. Ferraz, W. Skinner, R. Yoshimura, D. Moreira, R. Germscheidt, L. Nascimento, A. Patrocinio, A. Formiga and J. Bonacin, Dalton Trans., 2020, 49, 16488–16497 RSC.
- N. Suen, S. Hung, Q. Quan, N. Zhang, Y. Xu and H. Chen, Chem. Soc. Rev., 2017, 46, 337–365 RSC.
- J. Park, S. Kim and A. Bard, Nano Lett., 2006, 6(1), 24–28 CrossRef CAS PubMed.
- Z. He, C. Zhong, X. Huang, W. Wong, H. Wu, L. Chen, S. Su and Y. Cao, Adv. Mater., 2011, 23(40), 4636–4643 CrossRef CAS PubMed.
- J. Zhang, B. Sun, Y. Zhao, A. Tkacheva, Z. Liu, K. Yan, X. Guo, A. McDonagh, D. Shanmukaraj, C. Wang, T. Rojo, M. Armand, Z. Peng and G. Wang, Nat. Commun., 2019, 10(1), 602 CrossRef CAS PubMed.
- M. Zheng, J. Jiang, Z. Lin, P. He, Y. Shi and H. Zhou, Small, 2018, 14(47), 1803607 CrossRef PubMed.
- B. Li, H. Xue, H. Pang and Q. Xu, Sci. China Chem., 2020, 63(4), 475–482 CrossRef CAS.
- J. Li, Nano-Micro Lett., 2022, 14, 112 CrossRef CAS PubMed.
- T. Shinagawa and K. Takabane, ChemSusChem, 2017, 10, 1318 CrossRef CAS PubMed.
- Y. Xu, C. Wang, Y. Huang and J. Fu, Nano Energy, 2021, 80, 105545 CrossRef CAS.
- T. Naito, T. Shinagawa, T. Nishimoto and K. Takanabe, ChemSusChem, 2020, 13, 5921–5933 CrossRef CAS PubMed.
- J. Peng, W. Dong, Z. Wang, Y. Meng, W. Liu, P. Song and Z. Liu, Mater. Today Adv., 2020, 8, 100081 CrossRef.
- Y. Dong and S. Komarneni, Small Methods, 2021, 5, 2000719 CrossRef CAS PubMed.
- P. Zambiazi, A. De Moraes, R. Kogachi, G. Aparecido, A. Formiga and J. Bonacin, J. Braz. Chem. Soc., 2020, 31, 2307–2318 CAS.
- E. Alsaç, E. Ülker, S. Nune, Y. Dede and F. Karadas, Chem. – Eur. J., 2018, 24, 4856–4863 CrossRef PubMed.
- I. Gerber and P. Serp, Chem. Rev., 2020, 120, 1250–1349 CrossRef CAS PubMed.
- S. Chen and S. Qiao, ACS Nano, 2013, 7, 10190–10196 CrossRef CAS PubMed.
- H. Lee, K. Paeng and I. Kim, Synth. Met., 2018, 244, 36–47 CrossRef CAS.
- D. Long, W. Li, L. Ling, J. Miyawaki, I. Mochida and S. Yoon, Langmuir, 2010, 26, 16096–16102 CrossRef CAS PubMed.
- L. Wang, Z. Sofer and M. Pumera, ACS Nano, 2020, 14, 21–25 CrossRef CAS PubMed.
- C. Maity, G. Hatui, K. Verma, G. Udayabhanu, D. Pathak and G. Nayak, Vacuum, 2018, 157, 145–154 CrossRef CAS.
- D. He, Z. Peng, W. Gong, Y. Luo, P. Zhao and L. Kong, RSC Adv., 2015, 5, 11966–11972 RSC.
- G. Hatui, G. Nayak and G. Udayabhanu, Electrochim. Acta, 2016, 219, 214–226 CrossRef CAS.
- L. Malard, M. Pimenta, G. Dresselhaus and M. Dresselhaus, Phys. Rep., 2009, 473, 51–87 CrossRef CAS.
- D. Geng, S. Yang, Y. Zhang, J. Yang, J. Liu, R. Li, T. Sham, X. Sun, S. Ye and S. Knights, Appl. Surf. Sci., 2011, 257, 9193–9198 CrossRef CAS.
- S. Pei and H. Cheng, Carbon, 2012, 50, 3210–3228 CrossRef CAS.
- C. Rao, K. Gopalakrishnan and A. Govindaraj, Nano Today, 2014, 9, 324–343 CrossRef CAS.
- U. Holzwarth and N. Gibson, Nat. Nanotechnol., 2011, 6, 534 CrossRef CAS PubMed.
- S. Kettle, E. Diana, E. Marchese, E. Boccaleri and P. Stanghellini, J. Raman Spectrosc., 2011, 42, 2006–2014 CrossRef CAS.
- H. Zhang, C. Li, D. Chen, J. Zhao, X. Jiao and Y. Xia, CrystEngComm, 2017, 19, 2057–2064 RSC.
- W. Yuan, Y. Zhou, Y. Li, C. Li, H. Peng, J. Zhang, Z. Liu, L. Dai and G. Shi, Sci. Rep., 2013, 3, 2248 CrossRef PubMed.
- S. Pavlov, R. Nazmutdinov, M. Fedorov and S. Kislenko, J. Phys. Chem. C, 2019, 123, 6627–6634 CrossRef CAS.
- W. Hu, M. Zheng, H. Duan, W. Zhu, Y. Wei, Y. Zhang, K. Pan and H. Pang, Chin. Chem. Lett., 2022, 33, 1412–1416 CrossRef CAS.
- I. Nielsen, D. Dzodan, D. Ojwang, P. Henry, A. Ulander, G. Ek, L. Häggström, T. Ericsson, H. Boström and W. Brant, J. Phys. Energy, 2022, 4, 044012 CrossRef.
- D. Marcano, D. Kosynkin, J. Berlin, A. Sinitskii, Z. Sun, A. Slesarev, L. Alemany, W. Lu and J. Tour, ACS Nano, 2010, 4, 4806–4814 CrossRef CAS PubMed.
- P. Dos Santos, V. Katic, H. Loureiro, M. Dos Santos, D. Dos Santos, A. Formiga and J. Bonacin, Sens. Actuators, B, 2019, 281, 837–848 CrossRef CAS.
- R. Germscheidt, D. Francischini, M. Silva, M. Arruda, A. Formiga, T. Rocha and J. Bonacin, ACS Appl. Energy Mater., 2022, 5, 9447–9454 CrossRef CAS.
- J. Bonacin, P. Dos Santos, V. Katic, C. Foster and C. Banks, Electroanalysis, 2018, 30, 170–179 CrossRef CAS.
Footnote |
| † Electronic supplementary information (ESI) available. See DOI: https://doi.org/10.1039/d3ya00483j |
| This journal is © The Royal Society of Chemistry 2024 |