
 Open Access Article
 This Open Access Article is licensed under a
 Creative Commons Attribution 3.0 Unported Licence
Manganese dissolution in alkaline medium with and without concurrent oxygen evolution in LiMn2O4†
Omeshwari Yadorao
Bisen
 ac,
Max
Baumung
ac,
Michael
Tatzel
b,
Cynthia A.
Volkert
a and
Marcel
Risch
*ac
ac,
Max
Baumung
ac,
Michael
Tatzel
b,
Cynthia A.
Volkert
a and
Marcel
Risch
*ac
aInstitute of Materials Physics, University of Göttingen, Friedrich-Hund-Platz 1, 37077 Göttingen, Germany
bDepartment of Sedimentology & Environmental Geology, University of Göttingen, Goldschmidtstr. 3, 37077 Göttingen, Germany
cNachwuchsgruppe Gestaltung des Sauerstoffentwicklungsmechanismus, Helmholtz Zentrum Berlin für Materialien und Energie GmbH, Hahn-Meitner-Platz 1, 14109 Berlin, Germany. E-mail: marcel.risch@helmholtz-berlin.de
First published on 8th January 2024
Abstract
Manganese dissolution during the oxygen evolution reaction (OER) has been a persistent challenge that impedes the practical implementation of Mn-based electrocatalysts including the LixMn2O4 system in aqueous alkaline electrolyte. The investigated LiMn2O4 particles exhibit two distinct Mn dissolution processes; one independent of OER and the other associated with OER. Combining bulk sensitive X-ray absorption spectroscopy, surface sensitive X-ray photoelectron spectroscopy as well as detection of Mn dissolution by ICP-OES and by using a rotating ring-disk electrode, we explore the less understood Mn dissolution mechanism during OER. We correlate near-surface oxidation with the charge attributed to dissolved Mn, which indicates increasing Mn dissolution with the formation of surface Mn4+ species under an anodic potential. The stronger dissolution during the OER is attributed to the formation of additional Mn4+ from Mn3+ during OER. We discuss that control over the amount of Mn4+ in LixMn2O4 before the onset of the OER can partially mitigate the OER-triggered dissolution. Overall, our atomistic insights into the Mn dissolution processes are crucial for knowledge-guided mitigation of electrocatalyst degradation, which can be broadly extended to manganese-based oxide systems.
Introduction
In the light of globally increasing energy consumption, stable and efficient electrocatalytic energy storage and conversion are paramount for the transition from dwindling fossil sources to sustainable sources owing to the intermittent nature of renewable energy.1,2 Water splitting provides an attractive avenue for chemical energy storage (e.g. in hydrogen bonds) but it suffers from the inefficiency of the oxygen evolution reaction (OER).3–6 In the last few decades, there has been tremendous attention on enhancing the activity of OER catalysts, but the stability of these catalysts has not been extensively investigated.7 These challenges have persisted for an extended period, with limited attention directed towards comprehending the stability of electrocatalysts and elucidating the degradation mechanisms of the OER catalysts. These mechanisms encompass various processes such as catalyst dissolution, change in crystal phase and morphology, support passivation, detachment of the electrocatalyst from the electrode, and blocking of active sites.7 Among these, dissolution of catalysts is generally believed to be one of the most important causes of catalysts degradation.8 In most studies, the stability of catalysts is often inferred solely by change in electrolysis current density and/or overpotential values.9–11 However, stable activity over time does not guarantee materials stability because of persistent dissolution of metal cations from an oxide surface, potentially causing dynamic surface changes and increased area as leached ions unveil new surfaces.12The dissolution of Mn is a critical concern in Mn oxide-based electrocatalysis and battery research.13–17 We note that Mn can be highly mobile on the surface of Mn oxides as recently reported by environmental TEM.18 Four Mn dissolution processes have been discussed in literature previously: (1) the MnO2/MnO4− redox pair, (2) surface reconstruction, (3) bulk changes, and (4) the OER.1,8,14,15,19,20 The Mn4+O2/Mn7+O4− redox is predicted by thermodynamics (commonly inferred from an E-pH/Pourbaix diagram);1,14,15 its calculated reversible potential is +0.595 V vs. SHE21 (MnO4− + 2H2O + 3![[thin space (1/6-em)]](https://www.rsc.org/images/entities/char_2009.gif) e− ⇌ MnO2(s) + 4OH−; 1.362 V vs. RHE at pH 13).22,23 It has been experimentally observed at 1.41 V vs. RHE using ICP-MS.14 Surface reconstruction cannot be predicted a priori. The relevant experimental potentials are between 0.67 and 1.525 V vs. RHE where Mn3O4 with tetrahedral Mn2+ is formed on Mn oxides as observed, e.g., by ICP-MS at 0.675 V vs. RHE.15,24 Additionally, we have previously observed Mn loss due to bulk delithiation of LiMn2O4 in alkaline electrolytes as probed by RRDE.20,24,25 Finally, metal dissolution may be coupled with the OER,26 which also affects Mn oxides.14,15 Since Mn oxidizes to Mn4+ before the onset of the OER24 and surface reconstruction is common during OER,8 the Mn loss during OER may be related to the aforementioned processes that can also occur without OER. Experimentally, Mn loss during OER was observed by Rabe et al. in the range 1.525 to 1.75 V vs. RHE.15 Out of the four Mn dissolution processes, the one during OER is least understood, yet most relevant for OER electrocatalysis.
e− ⇌ MnO2(s) + 4OH−; 1.362 V vs. RHE at pH 13).22,23 It has been experimentally observed at 1.41 V vs. RHE using ICP-MS.14 Surface reconstruction cannot be predicted a priori. The relevant experimental potentials are between 0.67 and 1.525 V vs. RHE where Mn3O4 with tetrahedral Mn2+ is formed on Mn oxides as observed, e.g., by ICP-MS at 0.675 V vs. RHE.15,24 Additionally, we have previously observed Mn loss due to bulk delithiation of LiMn2O4 in alkaline electrolytes as probed by RRDE.20,24,25 Finally, metal dissolution may be coupled with the OER,26 which also affects Mn oxides.14,15 Since Mn oxidizes to Mn4+ before the onset of the OER24 and surface reconstruction is common during OER,8 the Mn loss during OER may be related to the aforementioned processes that can also occur without OER. Experimentally, Mn loss during OER was observed by Rabe et al. in the range 1.525 to 1.75 V vs. RHE.15 Out of the four Mn dissolution processes, the one during OER is least understood, yet most relevant for OER electrocatalysis.
In this study, we use pristine nano-sized cubic spinel LiMn2O4 particles as a model system for the OER in alkaline media to investigate the Mn dissolution processes during potential cycling. We used the Pt ring of a RRDE25 to detect trends in Mn dissolution current and explore it for mechanistic investigation of electrocatalyst degradation. Tafel slopes obtained from qualitative Mn dissolution current at the RRDE ring were used to investigate the two distinct Mn dissolution processes, one independent of OER and the other associated with it. The Mn oxidation state and LiMn2O4 composition are elucidated using X-ray absorption spectroscopy and XPS, which we correlate with the mechanistic insights. Further, we elucidated the role of Mn4+ species formed at the surface during anodic cycling with the Mn dissolution. Our results suggest electrocatalyst treatment prior to the OER as a strategy for mitigating electrocatalyst degradation by controlling the Mn oxidation state.
Results and discussion
We use a pristine LiMn2O4 powder as a model system for the OER in alkaline media to investigate the Mn dissolution processes during potential cycling. The tunable electronic properties of Mn in LiMn2O4 during OER cycling enable the insightful understanding of OER activity and stability of electrocatalysts. Pristine LiMn2O4 powder has a well-defined crystal structure (Fig. S1, ESI† inset) with a cubic spinel lattice structure (Fd3m) which is confirmed by X-ray diffraction (XRD, Fig. S1, ESI†).25,27For the electrochemical measurements, we have used a three-electrode cell with rotating ring-disk electrode (RRDE) in 0.1 M NaOH (pH = 13), where LiMn2O4 decorated a glassy carbon (GC) rod as a disk electrode and an outer concentric Pt ring as a ring electrode. In general, the total disk current obtained by conventional electrochemical experiments has various contribution of catalytic current (O2 evolution), corrosion current (Mn dissolution) and redox current (Mn oxidation current). Using product detection at the ring electrode, we qualitatively studied trends in the various contributions of the disk current. Here, in two distinct experiments, the Pt ring was used to qualitatively probe the corrosion/dissolution current due to solvated Mn electrochemically by applying 1.2 V vs. RHE at the Pt ring, which is thermodynamically favorable potential to reduce the MnO4− or MnO42− moieties in electrolyte into some form of MnOx25 and by applying 0.4 V vs. RHE to qualitatively probe oxygen evolution by oxygen reduction. We use arbitrary units for the product currents as their value is not calibrated, which is not needed to identify the trends discussed herein. The detailed electrochemical procedure is documented in the Experimental section. Fig. 1(a) represents the cyclic voltammogram (CV) of total disk current and as-measured ring current for oxygen and Mn detection at a scan rate of 10 mV s−1 for cycle 1. The first cycle exhibits distinct onsets of the total disk current, OER and Mn dissolution current. Notably, the disk current began to increase prior to 1.4 V vs. RHE, whereas Mn ring current started to rise after 1.4 V vs. RHE, which is well before the onset of oxygen evolution (above 1.6 V vs. RHE). Thus, the disk current before 1.4 V vs. RHE has solo contribution of the oxidation of Mn moieties (which is confirmed below by the Mn oxidation using XAS and XPS analysis), whereas after 1.4 V vs. RHE, current due to Mn dissolution also arose. At voltage above 1.6 V vs. RHE, we observed the exponential increase in OER ring current in addition to the Mn dissolution. The shape of the disk CV combined with the onsets of product detection at the ring implied that the total disk current of the anodic scan included the most prominent contributions from Mn oxidation current at low potential, from corrosion (Mn detection) at intermediate potential and catalysis (i.e., O2 detection) at high potential. In the later cycles, the Mn dissolution current drastically diminishes with cycling (Fig. 1(b)), whereas the catalytic current alters little (Fig. S2, ESI†), which is in agreement with our previous work.25 The cathodic scans are exponential without any relevant feature.
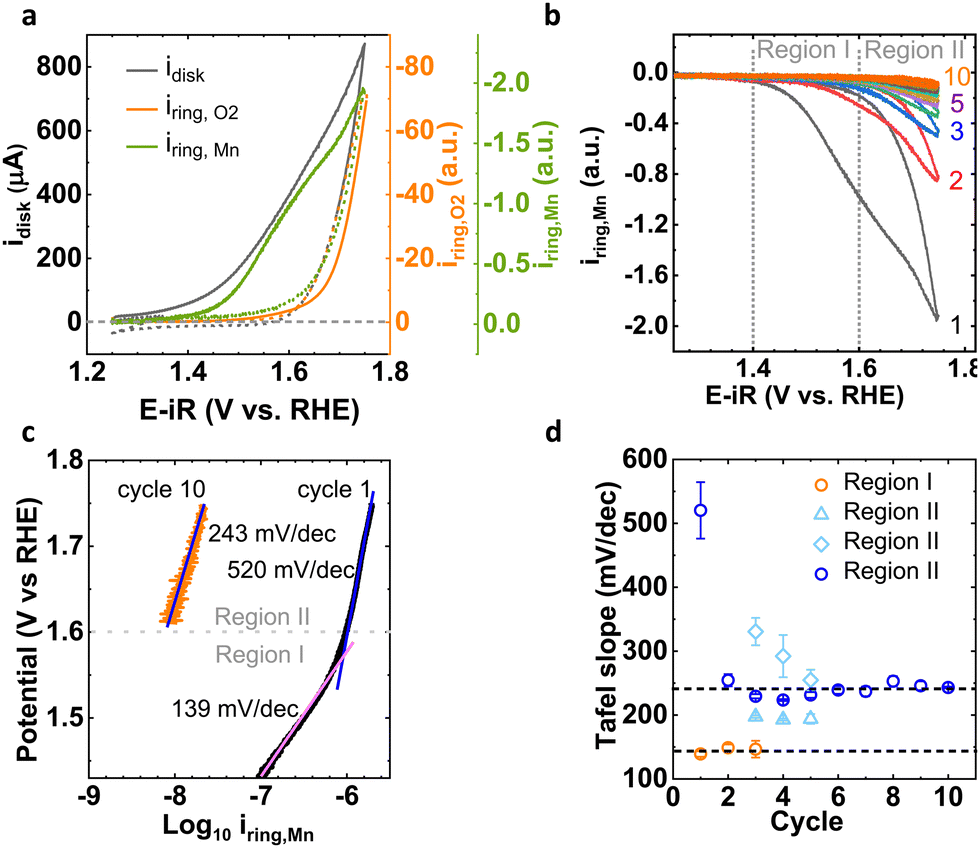 | ||
| Fig. 1 (a) Cyclic voltammetry of disk current and corresponding as-measured ring current of OER and Mn dissolution for cycle 1. The anodic scan is shown as solid lines and the cathodic scan as dashed lines. (b) As-measured Mn corrosion current observed at Pt ring (potential applied at ring is 1.2 V vs. RHE) for 1st to 10th cycle and (c) Tafel slope corresponding to 1st and 10th cycle. The two distinct Mn loss processes observed before and after OER onset (above 1.6 V vs. RHE) for the 1st cycle. (d) Tafel slope as a function of number of Mn cycles. | ||
With the aim of understanding the corrosion process for LiMn2O4, we have monitored the loss of Mn on the Pt ring of RRDE during 10 cycles (Fig. 1(b)). For the first cycle, the CV with two onsets (EMnprocess1 ∼ above 1.4 V and EMnprocess2 ∼ above 1.6 V vs. RHE) of exponentially increasing current was observed before and after the OER onset (above 1.6 V vs. RHE). We have assigned two distinct potential regions for investigating the Mn dissolution current, which represent the potential regime without OER (Region I) and with OER (Region II). The Mn dissolution processes corresponding to Region I and Region II are proposed as Process I and Process II, respectively. The CV of subsequent cycles looked similar but with lower current suggesting that Mn dissolution decreases relative to cycle 1 and in later cycles in both regions. While virtually no Mn dissolution current was detected in Region I during later cycles, it was still detected in Region II, which further supported distinct processes I and II.
The mechanistic insights from the distinct behaviors of Mn dissolution in Region I and Region II were better understood by Tafel analysis of the Mn dissolution current at the Pt ring (Fig. 1(c), Fig. S3 and Table S1, ESI†). The Tafel slope (b = ∂logi/∂E) in chemical equilibrium indicates how the kinetic currents scale with the applied potential.28 For cycle 1, we observed the two distinct slopes of 139 (4) mV dec−1 in Region I and 520 (44) mV dec−1 in Region II. The Tafel slope of 139 (4) mV dec−1 in Region I was close to 120 mV dec−1, which represents a reaction mechanism with electrochemical RLS (assuming a transfer coefficient of 0.5).28–30 While Region II had the Tafel slope value of 520 (44) mV dec−1 which is clearly higher value than 120 mV dec−1. Such high values are commonly assigned to reaction mechanisms with chemical limiting steps without any pre-equilibrium reaction step involved prior to RLS.28,29 Beyond the first cycle, the Tafel slope in Region I remained constant until it vanished after the 3rd cycle and the Tafel slope in Region II decreased to 240 (18) mV dec−1, which might indicate a change to an electrochemical limiting step with a small transfer coefficient (b = 0.25).29–31 Depending on the how many Tafel slopes are assumed, the decrease either happened gradually over 5 cycles or abruptly from the 1st to the 2nd cycle (Fig. 1(d)). Nonetheless, we observed two distinct processes, namely Process I in Region I and Process II in Region II with different values and trends of the Tafel slopes. After potential cycling, only Process II remained active.
To understand the insights from the two distinct Mn dissolution processes, it is important to investigate both processes independently by experimental design where we investigate only Region I until a steady-state is reached (Fig. 2(a); “conditioning” experiment) and only then enter Region II (Fig. 2(c); “post conditioning” experiment). The anodic Mn ring current in Region I exhibited a Tafel slope of approximately 120 mV dec−1 for 10 cycles (details in Fig. 2(b) and Table S2, ESI†), which agreed with the data in a wider potential range shown in Fig. 1(b) (“without conditioning” experiment). Subsequently enlarging the potential window to include Region II during post conditioning, we observed that the Tafel slope values around 200 mV dec−1 (Fig. 2(d) and Table S3 (ESI†), note: two different Tafel slopes were observed for the early cycles), which agrees with the data in Fig. 1(b) (without conditioning, after first cycle) where a wider potential range was used from the start. These experiments demonstrated that the processes can be separated and by comparison to Fig. 1(d) that Process II in early cycles was coupled to Process I.
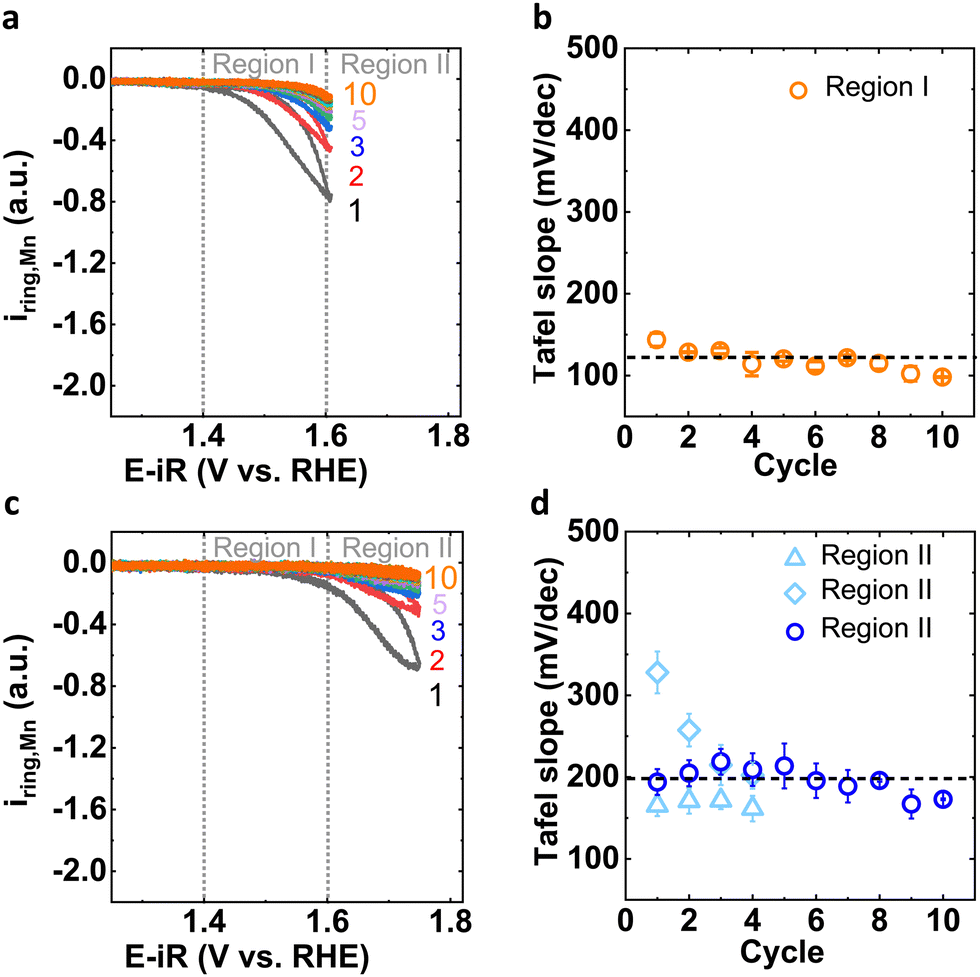 | ||
| Fig. 2 (a) Mn corrosion current observed at Pt ring for 1st to 10th cycle before OER (in potential window of 1.25–1.6 V vs. RHE) and (b) corresponding Tafel slope in Region I. (c) Mn corrosion current observed at Pt ring for 1st to 10th cycle after the conditioning process (in potential window of 1.25–1.75 V vs. RHE) and (d) corresponding Tafel slopes in Region II. Cycles are indicated by coloured numbers. | ||
By using the insights from these two Mn processes, our aim was to mitigate and/or lower down the Mn loss. For evaluating progress toward this goal, we qualitatively investigated the cumulative Mn charge passed during the conditioning and post conditioning experiments to compare it with the Mn charges during the experiment without conditioning (Fig. 3 and Table S4, ESI†). The cumulative charges during conditioning and post conditioning were identical within error and the cumulative charge of the sequence of these two experiments was lower than that of the experiment without conditioning after the 2nd cycle (Fig. 3(a)). This suggested that the conditioning step was beneficial to lower down the Mn loss from the LiMn2O4 system.
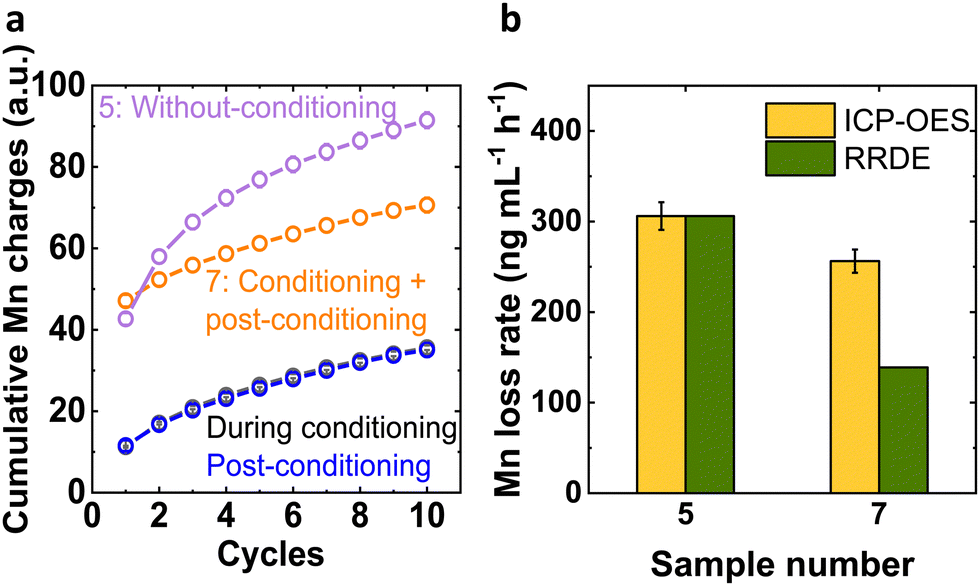 | ||
| Fig. 3 (a) The cumulative Mn charges corresponding to without-conditioning (sample number 5), during conditioning and post-conditioning and conditioning + post-conditioning (sample number 7) Mn dissolution current over 10 cycles. (b) Corresponding Mn loss rate from ICP-OES and qualitatively from the ring of the RRDE set to Mn detection. The uncalibrated ring data was scaled to the loss rate from ICP-OES of sample 5. Error bars indicate 5% measurement uncertainty. | ||
We determined the effective Mn loss rate to the electrolyte quantitatively by ICP-OES to complement the above trends (Fig. 3(b)). Without conditioning (sample 5), 306(15) ng Mn was lost per milliliter of electrolyte and hour, which was reduced to 256(13) ng Mn mL−1 h−1 after conditioning and post-conditioning (sample 7). We note that the 0.1 M NaOH electrolyte did not contain any Mn within the lower limit of detection (LOD) of 0.1 ng mL−1. The rate of cumulative charge from RRDE analysis agrees qualitatively but it must be noted that the highest accumulated charge did not correspond to the most Mn in the electrolyte (Fig. S4, ESI†). A possible explanation of the discrepancy is that Mn precipitated as Mn oxides in the used alkaline electrolyte. Small Mn oxides dispersed in the electrolyte were included in the ICP-OES measurement of the dispersion, while the RRDE method only detected solvated Mn species.
To understand the formation of the electrochemically active state of LiMn2O4, we have carried out a CV at the disk and product detection at the ring (Fig. S5, ESI†), both without and with a conditioning step. After the 5th cycle, the total disk current represents the dominant process of OER with a diminished contribution from Mn dissolution. To investigate further possible changes after long operation, we have investigated 1000 cycles with and without the conditioning treatment (Fig. S6, ESI†). The observed trends were most pronounced in the initial 10 cycles (Fig. S7, ESI†), so that we focused on this early phase herein. Clear changes due to conditioning were detected during cycles 1 to 20, after which similar currents were found with and without conditioning. These tests indicate that strategies to mitigate Mn oxidation are needed to stabilize LiMn2O4 for long-term operation; their discussion is beyond the scope of this report. The formation of a similar active state was expected from our hypothesis that the OER oxidizes LiMn2O4, which can be better understood by complementing electrochemical studies with spectroscopic characterization techniques.
Understanding of structure–activity/stability relationships
Process I and Process II could produce different microstructures, in particular Mn oxidation states. We performed bulk sensitive X-ray absorption spectroscopy (XAS) and surface-sensitive X-ray photoelectron spectroscopy (XPS) after selected preparation condition of key points in the previously discussed experiments (Table 1 and Fig. S8, ESI†). Fig. 4(a) shows Mn–K edge X-ray absorption near-edge structure (XANES) spectra of aforementioned samples.32 The edge position visually shifts to higher energy with higher potential and cycling as analyzed by the integral method33 in Fig. 4(b). Sample 3 (LMO_c0f_1.6V) is an exception to this trend, likely due to a slight variation during sample preparation, which does not affect our conclusions. Using a calibration curve assembled from Mn oxides with known oxidation states (Fig. S9, ESI†), we calculated that the formal oxidation state of Mn in sample 1 (LMO_ink) is about +3.33(3), which is lower than a stoichiometric LiMn2O4 powder (+3.50) likely due to ink preparation.34,35 The formal oxidation state increases from Mn3.5+ to Mn3.6+ from sample 2 to 5 (Table S6, ESI;† note that samples 2 and 3 are identical within error).| Sample number | Sample name | Preparation |
|---|---|---|
| 0 | LMO | As-received LiMn2O4 powder |
| 1 | LMO_ink | Dropcasted as LMO ink |
| 2 | LMO_c0f_1.4V | Dropcasted as LMO ink, then scan to 1.4 V at 10 mV s−1 |
| 3 | LMO_c0f_1.6V | Dropcasted as LMO ink, then scan to 1.6 V at 10 mV s−1 |
| 4 | LMO_c1f | Dropcasted as LMO ink then single cycle from 1.25 V to 1.75 V and back to 1.25 V at 10 mV s−1 |
| 5 | LMO_c10f or without-conditioning | Dropcasted as LMO ink then 10 cycles from 1.25 V to 1.75 V and back to 1.25 V at 10 mV s−1 |
| 6 | LMO_c10c or conditioning | Dropcasted as LMO ink then 10 cycles from 1.25 V to 1.6 V and back to 1.25 V at 10 mV s−1 |
| 7 | LMO_c10c_c10f or post-conditioning | Dropcasted as LMO ink, processed as LMO_c10c and then 10 cycles from 1.25 V to 1.75 V and back to 1.25 V at 10 mV s−1 |
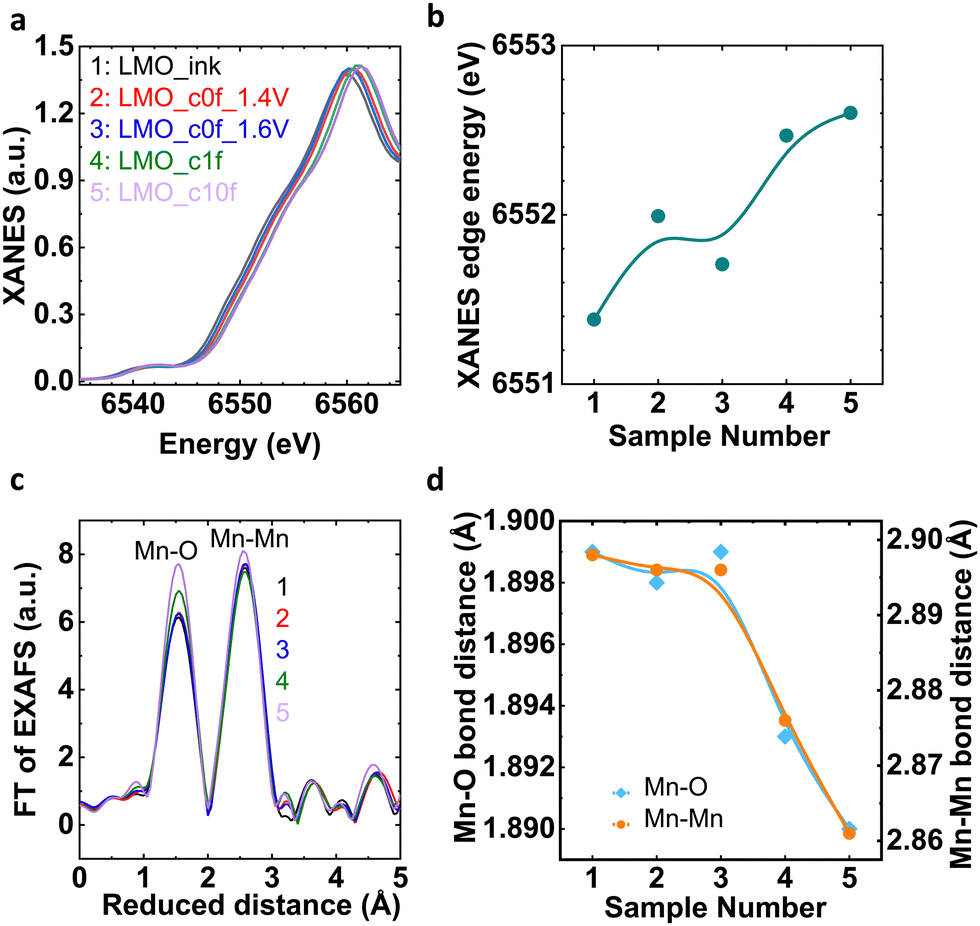 | ||
| Fig. 4 (a) XANES spectra at Mn–K edge and (b) corresponding relation of XANES edge energy with LMO_ink and electrochemically processed samples. (c) FT of EXAFS spectra at the Mn–K edge and (d) corresponding relation of Mn–O and Mn–O bond distances with LMO_ink and electrochemically processed samples. Lines are guide to the eye in panels b and d. Coloured numbers refer to sample numbers from the legend in panel a and Table 1. | ||
The change in the local structure (mainly averaged interatomic distance) of the selected samples was further tracked by EXAFS (extended X-ray absorption fine structure) at the Mn–K edge.32 The Fourier transform (FT) of the EXAFS of LMO_ink (sample 1) and electrochemically processed samples showed two prominent peaks corresponding to Mn–O and Mn–Mn bonding of the cubic spinel LiMn2O4 (Fig. 4(c)) without additional peaks that would indicate new crystalline or amorphous phases after dissolution of Mn during the OER. In order to resolve the minor changes in Mn–O and Mn–Mn bond distances, we have carried out EXAFS fitting (Table S7 and Fig. S10, S11, ESI†). The trends of the Mn–O and Mn–Mn distances mirrored that of the edge position as expected. For higher potentials and cycles, both distances were reduced (Fig. 4(d)).
X-ray diffraction (XRD) measurements were employed to investigate the impact of voltage cycling on the cubic crystal structure. The XRD analysis of the pristine LMO_ink and selected electrochemically processed samples is presented in Fig. S12 (ESI†). Within the noise level, there is no indication of additional diffraction peaks in comparison to sample 1 (LiMn2O4 ink), which supports the retention of the same phase in both conditioned and unconditioned cases. Moreover, the diffraction pattern showed peak shifts to larger 2θ, i.e., a reduction of the lattice parameter as expected for Mn oxidation coupled to delithiation (x < 1)36,37 and also seen in shorter distances in the EXAFS analysis (Fig. 4(d)). Lattice contraction is also expected for the loss of Mn detected in the electrochemical experiments (Fig. 1 and 2).37,38 This motivated us to check how the composition of the samples changed after key points of the electrochemical measurements.
XPS was used to track the Mn, Li and O content and the populations of Mn oxidation states in the near surface region of the samples after selected electrochemical treatment as defined in Table 1. Firstly, wide XPS spectra were recorded (Fig. S13, ESI†). They comprised the expected signal from Mn, Li and O and the additional signal from Na due to residuals of electrolyte after electrochemical processing. The presence of Na 1s signals makes the quantitative analysis of the Mn 2p, Mn 3p and Li 1s edges unreliable. Therefore, we have mainly focused on qualitative analysis of Mn 2p, Mn 3p and Li 1s via high resolution-XPS (HRXPS) by normalizing the Mn 2p3/2 peak and Mn 3p peak height. Fig. S14a and b (ESI†) show the Mn 2p3/2 and Mn 3p/Li 1s HRXPS spectra of the samples without conditioning while Fig. S14c and d (ESI†) show the respective HRXPS spectra of samples after conditioning and after post-conditioning. Sample 1 (LMO_ink) exhibited a shoulder at the low binding energy (B.E.) side of the Mn 2p3/2 and Mn 3p peaks indicating the presence of some amount of Mn2+, which is in well agreement with the EELS analysis and soft-XAS of the Mn-L3 edge of pristine LMO where the tetrahedral antisite Mn2+ defects are present in the near surface region.36,39 All electrochemically treated samples have equal or lower height of the shoulder assigned to tetrahedral Mn2+. Furthermore, the same trends are observed for the Li1s peak, which was highest for sample 1 and decreased with electrochemical treatment, indicating delithiation. Further changes in the main peak position of Mn 2p3/2 and shape, which we ascribe to the population of Mn3+ and Mn4+ moieties, which is also in well agreement with the delithiation. All qualitative changes in the spectra are summarized in Table 2.
| XPS analysis | Mn2+ | Mn3+ | Mn4+ | Li+ | Mn oxidation state from XANES | Mn oxidation state from Mn3s XPS |
|---|---|---|---|---|---|---|
| Down arrows indicate decrease ranging from little decrease (“↓”) to strong decrease (“↓↓↓”) relative to previous applied key point.Up arrows indicate increase ranging from little decrease (“↑”) to strong increase (“↑↑↑”) relative to previous applied key point. | ||||||
| LMO_ink | Starting state of material | Starting state of material | Starting state of material | Starting state of material | 3.33 (3) | 3.39 (1) |
| LMO_c0f_1.4V | ↓ | 0 | 0 | 0 | 3.48 (4) | 3.44 (1) |
| LMO_c0f_1.6V | ↓↓ | ↓↓ | ↑↑ | ↓↓ | 3.41 (4) | 3.69 (2) |
| LMO_c1f | ↓↓↓ | ↓↓↓ | ↑↑↑ | ↓↓↓ | 3.60 (5) | 3.87 (3) |
| LMO_c10f | ↓↓ | ↓↓ | ↑↑ | ↓↓ | 3.64 (6) | 3.94 (3) |
| LMO_c10c | ↓↓↓ | ↓↓↓ | ↑↑↑ | ↓↓↓ | — | 3.86 (5) |
| LMO_c10c_c10f | ↓↓↓ | ↓ | ↑ | ↓ | — | 3.94 (3) |
The Mn oxidation states were also quantitatively obtained by analysis of the difference in the Mn 3s multiplet splitting (ΔEMn3s) from Mn3s HRXPS (Fig. S15; Table S8, ESI† and Table 2) using a published calibration curve.40 The multiplet splitting (ΔEMn3s) decreased with higher potential and cycling, indicating the increase in oxidation state. Noteworthily, the effect of oxidation was more pronounced on the surface so that the Mn oxidation state from Mn3s XPS is larger than the bulk oxidation state from XAS analysis (Table 2 and Fig. S15c, ESI†), indicating surface oxidation with anodic potential, which has also been seen previously for other Mn oxides.41 In particular, the ΔEMn3s values of 4.69 eV after 10 cycles including the OER with and without separate conditioning (i.e., samples LMO_c10f and LMO_c10c_c10f) closely matched the MnO2 phase (4.70 eV),40 suggesting a predominant presence of Mn4+ on the surface due to the anodic potentials to study the OER.
Comparison of the qualitative trends from Mn2p, Mn3p and Li1s XPS analysis to the quantitative Mn3s XPS analysis indicated that Mn oxidation was charge-balanced by both Mn2+ (likely tetrahedral) loss39 (Fig. 5(a)) and Li+ loss (Fig. 5(b)). The reduction in Mn2+ and Li+ appeared to be correlated. Notably, the sample after post-conditioning (LMO_c10c_c10f) retained the same amount of Mn2+ and Li+ as compared to the sample without conditioning (LMO_c10f). This inspired us to correlate the electrochemical Mn dissolution charges obtained in the previous section with the electronic properties of the surface.
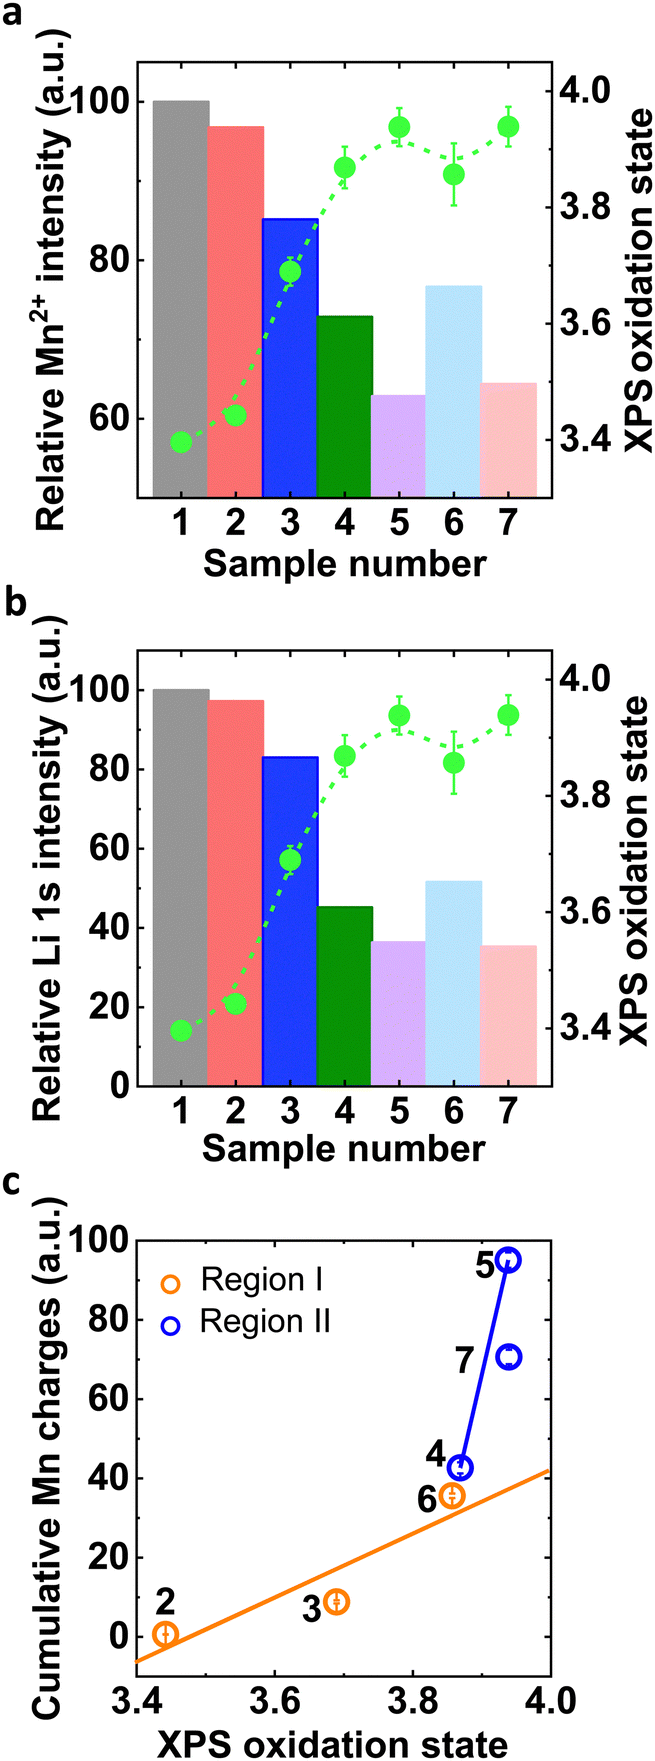 | ||
| Fig. 5 (a) and (b) Normalized relative Mn2+ and Li+ intensity of all electrochemically processed samples with respect to sample 1 (LMO_ink) and corresponding oxidation state obtained from Mn3s XPS. (c) Correlation of cumulative Mn charges with near-surface oxidation state in Region I and Region II. Sample numbers are defined in Table 1. | ||
The cumulative Mn charge detected on the ring of an RRDE depended clearly linearly on the near-surface Mn oxidation state where higher oxidation state led to more Mn loss (Fig. 5(c)). Similar trends were observed as function of Mn2+ or Li+ concentration in the samples (Fig. S16, ESI†). Our analysis clearly showed different linear trends in Region I and II, i.e., with and without OER, where more Mn loss was detected per change in oxidation state for concomitant OER. These trends highlight the different natures of the two detected Mn dissolution processes as discussed in detail below.
In this report, we have identified two Mn dissolution processes on the cubic spinel LiMn2O4. Using ex situ HRXPS, we found surface oxidation with the formation of mixed Mn3+/4+ with relatively increasing Mn4+ population with applied potentials and cycling. This aligns with prior research indicating Mn surface oxidation to Mn4+ beyond 1.2 V vs. RHE, occurring even before the OER onset.24,41,42 The linear trend of Mn loss with Mn oxidation toward Mn4+ strongly suggests that both Process I and Process II proceed via the reaction MnO2(s) + 4OH− → MnO4− + 2H2O + 3e− (E0 = 0.595 V vs. SHE, 1.362 V vs. RHE at pH 13). While the onset potential for Process I of about 1.4 V aligns with the reversible potential of this reaction and experimental observations from other research,1,14,15 while the mechanics in Region II, i.e., during OER remain ambiguous.
Region II displayed larger cumulative Mn charge with minor surface oxidation changes, suggesting an additional process that makes Mn4+. It is plausible that this process is the OER where Mn3+ is oxidized to Mn4+. The OER mechanism of LiMn2O4 has been extensively studied by our group before.23 Note that Mn is believed to oxidize independently of the prototypical OER mechanism so that the argument is valid for any known OER mechanism.43–46 The postulation that Mn3+ to Mn4+ oxidation during OER causes Mn dissolution is fully consistent with our observations (Fig. 5(c)). The conditioning procedure (sample LMO_c10c) leads to a higher Mn oxidation state as compared to a single half cycle without OER (sample LMO_c0f_1.6V), which means less Mn3+ before the onset of the OER that can oxidize to Mn4+. Yet, the Mn oxidation state was identical with and without conditioning (sample LMO_c10c vs. LMO_c10c_c10f), which suggested the formation of an electronically identical active state for extensive cycling.
It is evident from our research that a thorough understanding of the atomic origins of Mn dissolution mechanisms is vital for effectively preventing electrocatalyst degradation. The role of Mn3+ and Mn4+ for stability has been under debate. Rabe et al. found Mn3+-based oxide without OER more stable than Mn4+-based oxide with OER,15 while Morita et al. and Ramirez et al. found lower stability of Mn3+-based oxides during OER.47,48 Our observations suggest that the labile Mn4+ surface species can be additionally produced by the OER from Mn3+. Therefore, more robust Mn-based electrocatalysts need to prevent excessive Mn oxidation before and during the OER as we reported for a Mn–Co oxide.49
Conclusions
We discussed pristine cubic spinel LiMn2O4 particles as an electrocatalytic model for the OER in alkaline media for Mn-based battery materials50,51 and Mn oxides in general, which all are expected to suffer from Mn loss and in the case of the battery materials also Li or Na loss. We used an RRDE, where manganese loss at the disk was qualitatively probed at the ring to deepen our mechanistic understanding of electrocatalysts degradation. Two distinct onsets of exponential increasing current of Mn dissolution were observed. Process I above 1.4 V with Tafel slopes around 145(15) mV dec−1 and Process II above 1.6 V vs. RHE with Tafel slopes decreasing from 520(44) mV dec−1 to 240(18) mV dec−1. While Mn dissolution with the former onset is discussed to some detail in the literature,1,14,15 the distinct Mn dissolution process during the OER is less understood. To address this knowledge gap, we performed XAS and XPS measurements to gain insights into the atomic origins of these electrochemical differences. The data shows no indication of foreign phases or phase changes. The bulk of the samples oxidized from +3.33(3) for the ink-cast electrode to +3.64(6) after 10 cycles, where with application of higher potentials and cycling led to more oxidation. Both the Mn–O as well as Mn–Mn distances also decreased as expected for Mn oxidation. Mn3s XPS analysis revealed a larger extent of oxidation near the surface, ranging from +3.39(1) for the ink-cast electrode to +3.94(3) after 10 cycles. Additionally, the XPS data qualitatively showed that the Mn oxidation with voltage cycling was balanced by both Mn2+ and Li+ ions. This physical characterization enabled us to correlate the cumulate charge associated with Mn dissolution from RRDE experiments to the near-surface oxidation state of samples subjected to various conditions and cycles. Mn loss increased monotonously with oxidation of the Mn remaining in LiMn2O4, where two linear trends were identified. Less Mn was lost per increase in oxidation state without OER as compared to with concomitant OER, suggesting a distinct nature of the two Mn dissolution processes.The comprehensive understanding of Mn dissolution from the LiMn2O4 model system shows the pivotal role of Mn4+ species in the dissolution process, which we controlled before the onset of the OER by experimental design, i.e., the conditioning procedure. From correlation between surface electronic properties and dissolution, we concluded that increased population of Mn4+ species at the surface influences the Mn loss in both identified regions. The increased dissolution trend during OER suggested the formation of additional Mn4+ from Mn3+ during OER alongside surface oxidation. This postulation suggests that Mn oxides must be made robust against Mn oxidation of two distinct processes with separate onsets. It must be noted that the OER likely requires some Mn4+, which would anticorrelate stability and activity.47,52 Nonetheless, we performed additional experiments where near-surface Mn oxidation to +3.86(5) was induced without OER to reduce the concentration of Mn3+ species that could oxidize during OER. This conditioning treatment resulted in a lower Mn loss rate without significant activity loss as compared to direct OER cycling without previous conditioning by Mn oxidation. We note that the beneficial effect vanished after 20 cycles, which is in line with our above statement that both identified processes need to be optimized in future work to control the amount of Mn4+. Based on our observations, we expect that the typical conditioning step of electrocatalysts has a large impact on the degradation as well as potentially the activity of Mn oxides. Our work showed that atomistic insights into the Mn dissolution processes are crucial for knowledge-guided mitigation of electrocatalyst degradation. We expect that the general insight into the role of Mn4+ for degradation of Mn oxides can be extended widely to manganese-based oxide systems.
Materials and methods
Nano-sized (>99%) LiMn2O4 were purchased from Sigma-Aldrich. Tetrahydrofuran (THF) was purchased from VWR (≥99.9% stabilized). The electrolyte utilized was 1 M sodium hydroxide Titripur (Merck) solution, which was further diluted to 0.1 M using ultrapure water (Milli-Q with a resistivity of ≥18.2 MΩ). The electrolyte was purged with gases (argon 5.0 and oxygen 4.8) obtained from AirLiquide Alphagaz. Acetylene carbon black was purchased from Alfa Aesar (≥99.9%) and was acid-treated.Experimental methods
Electrochemical experimental setup
For all electrocatalytic experiments, we employed an OrigaFlex system, which consisted of three OGF500 Potentiostats (Origalys SAS). Our measurement setup included a RRDE-3A rotator (ALS Japan Co Ltd) and custom-made electrochemical cells made of polytetrafluoroethylene (PTFE) cylinders. The electrochemical cells were configured in a three-electrode configuration with a saturated calomel electrode (SCE) (ALS Japan Co Ltd, RE-2B) as a reference electrode, and platinum wire as a counter electrode. The RRDE-electrode setup consisted of a 4 mm diameter glassy carbon disk (area = 0.126 cm2) and a concentric platinum ring with inner and outer diameters of 5 mm and 7 mm, respectively. The working electrodes (disk and Pt-ring) were separately polished to a mirror finish using Al2O3-micro polish and cleaned with water and isopropanol. The SCE reference electrode was calibrated daily against a commercial reversible hydrogen electrode (RHE, HydroFlex Gaskatel).To identify suitable potentials for product detection, a 0.1 M NaOH electrolyte was first saturated with oxygen and a cyclic voltammetry (CV) experiment was conducted at the ring electrode in the potential range of 0–1.75 V vs. RHE at the scan rate of 100 mV s−1 for five cycles at a rotation speed of 1600 rpm. The same procedure was repeated for an electrolyte saturated with argon. Subsequently, 10.3 mg of KMnO4 was added to the argon-saturated electrolyte for a final molarity of 1 mM and another CV was performed. Based on these initial experiments, potentials of 0.4 V and 1.2 V vs. RHE were selected to qualitatively detect oxygen and manganese. We note that the ring currents in either detection experiment were in μA but we prefer to use arbitrary units to avoid over- or misinterpretation of the uncalibrated ring currents.
The catalytic ink of LiMn2O4 was prepared by mixing 10 mg of LiMn2O4 powder and 2 mg of carbon black into a 2 mL of tetrahydrofuran (THF) slurry. After 30 minutes of sonication, 10 μL of this suspension was applied on a polished glassy carbon disk, which was then assembled in a RRDE setup. The ink was uniformly spread across the entire disk surface. The electrolyte was also saturated with argon 30 minutes prior to any of the electrochemical measurements in Ar-saturated 0.1 M NaOH.
Electrochemical measurements
The protocol of our experiment has been taken from the our previous publication.25 Three measurements were carried out by drop-casting the LiMn2O4 ink over glassy carbon disk electrodes and assembling the RRDE setup. The total current was recorded on the disk, whereas oxygen and manganese were qualitatively detected on the ring due to uncalibrated currents. In our experiments, the disk electrode was initially held at 1.25 V vs. RHE for five minutes and then CV were performed in the potential window of 1.25 to 1.60 V or 1.75 V vs. RHE. All measurements were carried out with the scan rate of 10 mV s−1 and with the rotation speed of 1600 rpm. All characterization and electrochemical experiments were carried out at room temperature. Subsequently, the electrochemical impedance spectroscopy (EIS) was employed in the frequency range of 100 kHz to 1 Hz to determine the uncompensated resistance (Fig. S17, ESI†) and correct the applied voltage for the ohmic drop.Physical characterization of LiMn2O4 particles
At KMC-2, the general used setup was arranged as follows: I0 ionization chamber, sample, I1 ionization chamber or FY detector, energy reference and I2 ionization chamber. The used double monochromator consisted of two Ge-graded Si(111) crystal substrates and the polarization of the beam was linear horizontal.54 To prepare the reference samples, a thin and uniform layer of the powder was spread on Kapton tape. After removing the surplus powder, the tape was folded multiple times to create 1 cm × 1 cm windows. These reference samples (MnO, Mn3O4, Mn2O3, LiMnO2, LiMn2O4 and MnO2) were evaluated in transmission mode between two ion chambers detectors at ambient temperature. Electrochemically processed samples were prepared by dropcasting the LiMn2O4 ink on 4 mm glassy carbon disk and evaluated in fluorescence mode. The reference Mn-foil is also simultaneously collected corresponding to each measurement. Two refences spectra were compared to confirm the correct energy calibration. For the X-ray absorption near edge structure (XANES) energy calibration, the respective metal foil was utilized, setting the inflection point for Mn at 6539 eV. All spectra normalization involved the subtraction of a straight line obtained by fitting the data before the K-edge and division by a polynomial function obtained by fitting the data after the K-edge.
The Fourier transform (FT) of the extended X-ray absorption fine structure (EXAFS) was determined between 44 and 412.1 eV (3.4 to 10.4 A) above the K edge, with E0 values set at 6539 eV for Mn. EXAFS simulation gives the structural information of three of relevant parameters; co-ordination number (N) which is related to the number of neighboring atoms around the absorber atom, averaged interatomic distance (R) is nothing but the bond distance between the absorber atom and scatterer and Debye–Waller factor (σ) which is associated with the distance distribution in a disordered material. It must be noted that, Mn–O and Mn–Mn co-ordination peak position on the reduced distance scale are approximately 0.3 Å smaller than the true interatomic distances. We performed EXAFS simulations using the SimXLite software. The phase functions were calculated with the FEFF8-Lite program (version 8.5.3) with the self-consistent field option enabled. The used phase functions were simulated using the LiMn2O4 crystal structure from the crystallography open database with ID 1513966.27 We fixed N = 6 for both Mn–Mn and Mn–O coordination path and fit all other parameters including amplitude reduction factor (S02). To optimize the EXAFS simulations, we minimized the error sum which was obtained by summing the squared deviations between the measured and simulated values, i.e., least-squares fit approach. The R-factor was estimated by Fourier filtering data and fit model between of 0 and 3 Å. The fitting was conducted using the Levenberg–Marquardt method with numerical derivatives.54
Data availability
The data that support the findings of this study are openly available in Zenodo at 10.5281/zenodo.10377482, reference number 10377482.Conflicts of interest
There are no conflicts to declare.Acknowledgements
This work was financially supported by SFB 1073 (project C05) funded by the Deutsche Forschungsgemeinschaft (DFG, German Research Foundation) – project number 217133147. We thank the Helmholtz-Zentrum Berlin für Materialien und Energie for the allocation of synchrotron radiation beamtime. The authors thank to Joaquín Morales-Santelices, Denis Antipin, Julian Lorenz, Corinna Harms, Konstantin Rücker and Dereje Hailu Taffa for helping with XAS data collection, Frederik Stender for remote help during beamtime and Götz Schuck for support at the KMC-2 beamline. The authors also thank Florian Schönewald for helping with XPS data collection. The XPS instrument was funded by the DFG – project number 424956935.References
- Q. Gao, C. Ranjan, Z. Pavlovic, R. Blume and R. Schlögl, Enhancement of Stability and Activity of MnOx/Au Electrocatalysts for Oxygen Evolution through Adequate Electrolyte Composition, ACS Catal., 2015, 5(12), 7265–7275, DOI:10.1021/acscatal.5b01632
.
- D. G. Nocera, Solar Fuels and Solar Chemicals Industry, Acc. Chem. Res., 2017, 50(3), 616–619, DOI:10.1021/acs.accounts.6b00615
- T. Faunce, S. Styring, M. R. Wasielewski, G. W. Brudvig, A. W. Rutherford, J. Messinger, A. F. Lee, C. L. Hill, H. deGroot, M. Fontecave, D. R. MacFarlane, B. Hankamer, D. G. Nocera, D. M. Tiede, H. Dau, W. Hillier, L. Wang and R. Amal, Artificial photosynthesis as a frontier technology for energy sustainability, Energy Environ. Sci., 2013, 6, 1074–1076, 10.1039/C3EE40534F
- J. Qi, W. Zhang and R. Cao, Solar-to-Hydrogen Energy Conversion Based on Water Splitting, Adv. Energy Mater., 2018, 8(5), 1–16, DOI:10.1002/aenm.201701620
- J. H. Montoya, L. C. Seitz, P. Chakthranont, A. Vojvodic, T. F. Jaramillo and J. K. Nørskov, Materials for Solar Fuels and Chemicals, Nat. Mater., 2016, 16(1), 70–81, DOI:10.1038/nmat4778
- N. S. Lewis and D. G. Nocera, Powering the Planet: Chemical Challenges in Solar Energy Utilization, Proc. Natl. Acad. Sci. U. S. A., 2006, 103(43), 15729–15735, DOI:10.1073/pnas.0603395103
- M. Risch, Upgrading the Detection of Electrocatalyst Degradation during the Oxygen Evolution Reaction, Curr. Opin. Electrochem., 2023, 38, 101247, DOI:10.1016/j.coelec.2023.101247
- F. Chen, Z. Wu, Z. Adler and H. Wang, Review Stability Challenges of Electrocatalytic Oxygen Evolution Reaction: From Mechanistic Understanding to Reactor Design, Joule, 2021, 5(7), 1704–1731, DOI:10.1016/j.joule.2021.05.005
- C. E. Moore, J. Eastcott, H. A. El-sayed, A. Weiß, L. F. Olbrich, G. P. Putro and H. A. Gasteiger, OER Catalyst Stability Investigation Using RDE Technique: A Stability Measure or an Artifact?, J. Electrochem. Soc., 2019, 166(8), F458–F464, DOI:10.1149/2.0301908jes
- S. Geiger, O. Kasian, A. M. Mingers, S. S. Nicley, K. Haenen, K. J. J. Mayrhofer and S. Cherevko, Catalyst Stability Benchmarking for the Oxygen Evolution Reaction: The Importance of Backing Electrode Material and Dissolution in Accelerated Aging Studies, ChemSusChem, 2017, 10(21), 4140–4143, DOI:10.1002/cssc.201701523
- A. Hartig-Weiss, M. F. Tovini, H. A. Gasteiger and H. A. El-sayed, OER Catalyst Durability Tests Using the Rotating Disk Electrode Technique: The Reason Why This Leads to Erroneous Conclusions, ACS Appl. Energy Mater., 2020, 3(11), 10323–10327, DOI:10.1021/acsaem.0c01944
- R. Frydendal, E. A. Paoli, B. P. Knudsen, B. Wickman, P. Malacrida, I. E. L. Stephens and I. Chorkendorff, Benchmarking the Stability of Oxygen Evolution Reaction Catalysts: The Importance of Monitoring Mass Losses, ChemElectroChem, 2014, 1(12), 2075–2081, DOI:10.1002/celc.201402262
- J. Melder, P. Bogdanoff, I. Zaharieva, S. Fiechter, H. Dau and P. Kurz, Water-Oxidation Electrocatalysis by Manganese Oxides: Syntheses, Electrode Preparations, Electrolytes and Two Fundamental Questions, Z. Phys. Chem., 2020, 234(5), 925–978, DOI:10.1515/zpch-2019-1491
- F. D. Speck, P. G. Santori, F. Jaouen and S. Cherevko, Mechanisms of Manganese Oxide Electrocatalysts Degradation during Oxygen Reduction and Oxygen Evolution Reactions, J. Phys. Chem. C, 2019, 123(41), 25267–25277, DOI:10.1021/acs.jpcc.9b07751
- M. Rabe, C. Toparli, Y. H. Chen, O. Kasian, K. J. J. Mayrhofer and A. Erbe, Alkaline Manganese Electrochemistry Studied by: In Situ and Operando Spectroscopic Methods-Metal Dissolution, Oxide Formation and Oxygen Evolution, Phys. Chem. Chem. Phys., 2019, 21(20), 10457–10469, 10.1039/c9cp00911f
- D. Tang, Y. Sun, Z. Yang, L. Ben, L. Gu and X. Huang, Surface Structure Evolution of LiMn2O4 Cathode Material upon Charge/Discharge, Chem. Mater., 2014, 26(11), 3535–3543, DOI:10.1021/cm501125e
- A. Li, H. Ooka, N. Bonnet, T. Hayashi, Y. Sun, Q. Jiang, C. Li, H. Han and R. Nakamura, Stable Potential Windows for Long-Term Electrocatalysis by Manganese Oxides Under Acidic Conditions, Angew. Chem., Int. Ed., 2019, 58(15), 5054–5058, DOI:10.1002/anie.201813361
- G. Lole, V. Roddatis, U. Ross, M. Risch, T. Meyer, L. Rump, J. Geppert, G. Wartner, P. Blöchl and C. Jooss, Dynamic Observation of Manganese Adatom Mobility at Perovskite Oxide Catalyst Interfaces with Water, Commun. Mater., 2020, 1(1), 68, DOI:10.1038/s43246-020-00070-6
- F. M. Li, L. Huang, S. Zaman, W. Guo, H. Liu, X. Guo and B. Y. Xia, Corrosion Chemistry of Electrocatalysts, Adv. Mater., 2022, 34(52), 1–20, DOI:10.1002/adma.202200840
- M. Baumung, L. Kollenbach, L. Xi and M. Risch, Undesired Bulk Oxidation of LiMn2O4 Increases Overpotential of Electrocatalytic Water Oxidation in Lithium Hydroxide Electrolytes, ChemPhysChem, 2019, 20(22), 2981–2988, DOI:10.1002/cphc.201900601
-
P. Vanýsek, in CRC Handbook of Chemistry and Physics, ed. W. M. Haynes, Electrochemical Series, CRC Press, 92nd edn, 2011 Search PubMed
-
M. Pourbaix, Atlas of Electrochemical Equilibria in Aqueous Solutions, National Association of Corrosion Engineers, Houston, TX, 1974 Search PubMed
- L. Köhler, M. Ebrahimizadeh Abrishami, V. Roddatis, J. Geppert and M. Risch, Mechanistic Parameters of Electrocatalytic Water Oxidation on LiMn2O4 in Comparison to Natural Photosynthesis, ChemSusChem, 2017, 10(22), 4479–4490, DOI:10.1002/cssc.201701582
- M. Risch, K. A. Stoerzinger, B. Han, T. Z. Regier, D. Peak, S. Y. Sayed, C. Wei, Z. Xu and Y. Shao-Horn, Redox Processes of Manganese Oxide in Catalyzing Oxygen Evolution and Reduction: An in Situ Soft X-Ray Absorption Spectroscopy Study, J. Phys. Chem. C, 2017, 121(33), 17682–17692, DOI:10.1021/acs.jpcc.7b05592
- M. Baumung, F. Schönewald, T. Erichsen, C. A. Volkert and M. Risch, Influence of Particle Size on the Apparent Electrocatalytic Activity of LiMn2O4 for Oxygen Evolution. Sustain, Energy Fuels, 2019, 3(9), 2218–2226, 10.1039/c8se00551f
- S. Cherevko, A. R. Zeradjanin, A. A. Topalov, N. Kulyk, I. Katsounaros and K. J. J. Mayrhofer, Dissolution of Noble Metals during Oxygen Evolution in Acidic Media, ChemCatChem, 2014, 6(8), 2219–2223, DOI:10.1002/cctc.201402194
- Y. Shimakawa, T. Numata and J. Tabuchi, Verwey-Type Transition and Magnetic Properties of the LiMn2O4 Spinels, J. Solid State Chem., 1997, 131, 138–143, DOI:10.1006/jssc.1997.7366
- S. Fletcher, Tafel Slopes from First Principles, J. Solid State Electrochem., 2009, 13(4), 537–549, DOI:10.1007/s10008-008-0670-8
- D. Antipin and M. Risch, Calculation of the Tafel Slope and Reaction Order of the Oxygen Evolution Reaction between PH 12 and PH 14 for the Adsorbate Mechanism, Electrochem. Sci. Adv., 2022, 1–13, DOI:10.1002/elsa.202100213
- T. Shinagawa, A. T. Garcia-esparza and K. Takanabe, Insight on Tafel Slopes from a Microkinetic Analysis of Aqueous Electrocatalysis for Energy Conversion, Sci. Rep., 2015, 5, 13801, DOI:10.1038/srep13801
- A. L. Negahdar, F. Zeng, S. Palkovits and R. Palkovits, Mechanistic Aspects of the Electrocatalytic Oxygen Evolution Reaction over Ni−Co Oxides, ChemElectroChem, 2019, 6(22), 5588–5595, DOI:10.1002/celc.201901265
- M. Risch, D. M. Morales, J. Villalobos and D. Antipin, What X-Ray Absorption Spectroscopy Can Tell Us About the Active State of Earth-Abundant Electrocatalysts for the Oxygen Evolution Reaction, Angew. Chem., Int. Ed., 2022, 61(50), e202211949 (
Angew. Chem.
, 2022
, 134
, e202211949
) DOI:10.1002/anie.202211949
- H. Dau, P. Liebisch and M. Haumann, X-Ray Absorption Spectroscopy to Analyze Nuclear Geometry and Electronic Structure of Biological Metal Centers – Potential and Questions Examined with Special Focus on the Tetra-Nuclear Manganese Complex of Oxygenic Photosynthesis, Anal. Bioanal. Chem., 2003, 376, 562–583, DOI:10.1007/s00216-003-1982-2
- A. Grimaud, K. J. May, C. E. Carlton, Y. Lee, M. Risch, W. T. Hong, J. Zhou and Y. Shao-horn, Catalysts for Oxygen Evolution in Alkaline Solution, Nat. Commun., 2013, 4, 2439, DOI:10.1038/ncomms3439
- D. M. Morales, J. Villalobos, M. A. Kazakova, J. Xiao and M. Risch, Nafion-Induced Reduction of Manganese and Its Impact on the Electrocatalytic Properties of a Highly Active MnFeNi Oxide for Bifunctional Oxygen Conversion, ChemElectroChem, 2021, 2979–2983, DOI:10.1002/celc.202100744
-
M. Baumung, Correlations between Manganese Valence and Catalytic Oxygen Evolution of LixMn2O4, PhD thesis, University of Göttingen, 2021 DOI:10.53846/goediss-8768
- R. J. Gummow, A. de Kock and M. M. Thackeray, Improved Capacity Retention in Rechargeable 4 V Lithium/Lithium-Manganese Oxide (Spinel) Cells, Solid State Ionics, 1994, 69(1), 59–67, DOI:10.1016/0167-2738(94)90450-2
- M. Kopec, J. R. Dygas, F. Krok, A. Mauger, F. Gendron and C. M. Julien, Magnetic Characterization of Li1+xMn2−xO4 Spinel (0 ≤ x ≤ Frac(1, 3)), J. Phys. Chem. Solids, 2008, 69(4), 955–966, DOI:10.1016/j.jpcs.2007.11.005
- F. Schönewald, M. Eckhoff, M. Baumung, M. Risch, P. E. Blöchl, J. Behler and C. A. Volkert, A Criticial View on Eg Occupancy as a Descriptor for Oxygen Evolution Catalytic Activity in LiMn2O4 Nanoparticles, arXiv, 2020, preprint, arxiv.2007.04217 DOI:10.48550/arXiv.2007.04217.
- M. Oku and K. Hirokawa, X-Ray photoelectron spectroscopy of manganese-oxygen systems, J. Electron Spectrosc. Relat. Phenom., 1975, 7, 465–473, DOI:10.1016/0368-2048(75)85010-9
- H. Radinger, P. Connor, R. Stark, W. Jaegermann and B. Kaiser, Manganese Oxide as an Inorganic Catalyst for the Oxygen Evolution Reaction Studied by X-Ray Photoelectron and Operando Raman Spectroscopy, ChemCatChem, 2021, 13(4), 1175–1185, DOI:10.1002/cctc.202001756
- L. Xi, C. Schwanke, J. Xiao, F. F. Abdi, I. Zaharieva and K. M. Lange,
In Situ L-Edge XAS Study of a Manganese Oxide Water Oxidation Catalyst, J. Phys. Chem. C, 2017, 121(22), 12003–12009, DOI:10.1021/acs.jpcc.7b02331
- D. Antipin and M. Risch, Trends of Epitaxial Perovskite Oxide Films Catalyzing the Oxygen Evolution Reaction in Alkaline Media, J. Phys. Energy, 2020, 2(3), 032003, DOI:10.1088/2515-7655/ab812f
- I. Zaharieva, D. González-Flores, B. Asfari, C. Pasquini, M. R. Mohammadi, K. Klingan, I. Zizak, S. Loos, P. Chernev and H. Dau, Water Oxidation Catalysis-Role of Redox and Structural Dynamics in Biological Photosynthesis and Inorganic Manganese Oxides, Energy Environ. Sci., 2016, 9(7), 2433–2443, 10.1039/c6ee01222a
- H. Dau, C. Limberg, T. Reier, M. Risch and S. Roggan, The Mechanism of Water Oxidation: From Electrolysis via Homogeneous
to Biological Catalysis, ChemCatChem, 2010, 2, 724–761, DOI:10.1002/cctc.201000126
- Y. Gorlin, B. Lassalle-Kaiser, J. D. Benck, S. Gul, S. M. Webb, V. K. Yachandra, J. Yano and T. F. Jaramillo,
In Situ X-Ray Absorption Spectroscopy Investigation of a Bifunctional Manganese Oxide Catalyst with High Activity for Electrochemical Water Oxidation and Oxygen Reduction, J. Am. Chem. Soc., 2013, 135(23), 8525–8534, DOI:10.1021/ja3104632
- C. Iwakura, The Anodic Characteristics of Massive Manganese Oxide Electrode, Electrochim. Acta, 1979, 24(April 1978), 357–362, DOI:10.1016/0013-4686(79)87019-X
- A. Ramírez, P. Hillebrand, D. Stellmach, M. M. May, P. Bogdanoff and S. Fiechter, Evaluation of MnOx, Mn2O3, and Mn 3O4 Electrodeposited Films for the Oxygen Evolution Reaction of Water, J. Phys. Chem. C, 2014, 118(26), 14073–14081, DOI:10.1021/jp500939d
- J. Villalobos, D. M. Morales, D. Antipin, G. Schuck, R. Golnak, J. Xiao and M. Risch, Stabilization of a Mn−Co Oxide During Oxygen Evolution in Alkaline Media, ChemElectroChem, 2022, 9(13), 1–13, DOI:10.1002/celc.202200482
- Z. F. Huang, S. Xi, J. Song, S. Dou, X. Li, Y. Du, C. Diao, Z. J. Xu and X. Wang, Tuning of Lattice Oxygen Reactivity and Scaling Relation to Construct Better Oxygen Evolution Electrocatalyst, Nat. Commun., 2021, 12(1), 1–9, DOI:10.1038/s41467-021-24182-w
- C. Wei, Z. Feng, G. G. Scherer, J. Barber, Y. Shao-Horn and Z. J. Xu, Cations in Octahedral Sites: A Descriptor for Oxygen Electrocatalysis on Transition-Metal Spinels, Adv. Mater., 2017, 29(23), 1606800, DOI:10.1002/adma.201606800
- J. Melder, P. Bogdanoff, I. Zaharieva, S. Fiechter, H. Dau and P. Kurz, Water-Oxidation Electrocatalysis by Manganese Oxides: Syntheses, Electrode Preparations, Electrolytes and Two Fundamental Questions, Z. Phys. Chem., 2020, 234(5), 925–978, DOI:10.1515/zpch-2019-1491
- P. K. Kofstad, A. Z. Hed, S. Tanaka, N. Hirose and T. Tanaki, To Cite This Article: Masaya Chigane and Masami Ishikawa. Manganese Oxide Thin Film Preparation by Potentiostatic Electrolyses and Electrochromism, J. Electrochem. Soc., 2000, 147(6), 2246–2251, DOI:10.1149/1.1393515
- H. Berlin, KMC-2: An X-Ray Beamline with Dedicated Di Raction and XAS Endstations at BESSY II, J. Large-Scale Res. Facil., 2016, A49, 1–6, DOI:10.17815/jlsrf-2-65
Footnote |
| † Electronic supplementary information (ESI) available. See DOI: https://doi.org/10.1039/d3ya00434a |
| This journal is © The Royal Society of Chemistry 2024 |