
 Open Access Article
 This Open Access Article is licensed under a Creative Commons Attribution-Non Commercial 3.0 Unported Licence
Resistive switching memory from dielectric lignin for sustainable electronics†
Sebastiano
De Stefano
a,
Ofelia
Durante
*a,
Rosarita
D’Orsi
b,
Alessandra
Operamolla
 b,
Marianna
Ambrico
*c,
Paolo Francesco
Ambrico
c,
Nadia
Martucciello
d,
Filippo
Giubileo
d and
Antonio
Di Bartolomeo
a
b,
Marianna
Ambrico
*c,
Paolo Francesco
Ambrico
c,
Nadia
Martucciello
d,
Filippo
Giubileo
d and
Antonio
Di Bartolomeo
a
aDepartment of Physics “E.R. Caianiello”, University of Salerno, Via Giovanni Paolo II 132, Fisciano (Sa) 84084, Italy. E-mail: odurante@unisa.it
bDepartment of Chemistry and Industrial Chemistry, University of Pisa, Via Giuseppe Moruzzi 13, Pisa 56124, Italy
cCNR, Institute for Plasma Science and Technology, Via Giovanni Amendola 122/d, Bari 70126, Italy. E-mail: marianna.ambrico@istp.cnr.it
dCNR-SPIN, Salerno Unit, Via Giovanni Paolo II 132, Fisciano (Sa) 84084, Italy
First published on 24th July 2024
Abstract
Organic materials are currently at the forefront of research within the field of nanoelectronics, aiming to offer a sustainable alternative to existing technologies across a variety of applications, including memory storage. Lignin, a waste of the paper manufacturing industry, is usually destined to be combusted to feed other industrial processes. Nonetheless, lignin is part of the emerging class of organic materials, serving as a complementary component in devices. This paper details the electrical characterization of a device featuring interdigitated electrode patterns shorted by lignin. The device exhibits butterfly-shaped current–voltage characteristics with significant hysteresis, delineating two distinct resistive states that suggest its potential use for memory applications. Current–voltage characteristics, measured at different temperatures and pressures, are analysed as a function of the applied voltage to conclude that space-charge limited current and hopping are the main conduction mechanisms. As a memristor, the lignin-based device shows good stability and endurance after numerous read–write cycles as well as long data retention. Additionally, electrical impedance spectroscopy is applied to investigate the dielectric response and its influence on the memory effect. This study shed light on the electric properties of lignin and opens the way to a variety of applications, like demonstrated one in the memristor domain.
1. Introduction
In recent times, the electronics industry's relentless pursuit of miniaturization alongside a surge in performance has brought the search for novel devices and materials into the spotlight. New materials like metal oxides, carbon, transition metal dichalcogenides, perovskites, etcetera1–7 have already demonstrated exceptional electrical and optoelectronic properties, offering cutting-edge solutions for use in logic circuits and memory devices.8–10 Concurrently, as advancements in these materials forge ahead, the domain of organic materials is receiving heightened attention.11,12 The interest in organic materials is not only due to their remarkable properties but also their potential for sustainability as a focal point in scientific endeavours.Among the organic materials garnering attention, lignin stands out.13 As a biopolymer resulting from the industrial processes of paper production, lignin is recognized as one of the most copious polymers on our planet. Yet, it is noteworthy that annually, about 50 million tons of lignin are produced as waste, which historically has found minimal use beyond serving as feed for thermochemical plants or in other industrial processes, yielding low return.14 Nevertheless, the abundance and biocompatibility of lignin are paving the way for new burgeoning and prosperous fields of application. Indeed, lignin has been utilized in dressings for wound healing,15 3D printing plastic composites,16 electrodes for Na-ion battery or supercapacitors,17,18 or even as dielectric in field effect transistors.19 Only recently, the use of lignin as material in memory storage devices has been proposed.20
Lignin derives from the radical polymerization of C6C3 alcoholic monomers (p-coumaryl alcohol, coniferyl alcohol and sinapyl alcohol). The relative abundance of these monomers depends on the origin, but in general lignin is rich in aromatic rings and catechol units that can contribute to charge delocalization and can give rise to intriguing redox properties. Catechols were used as covalently linked appendages for chitosan to prepare molecular memory films based on redox states.21 In electronic manufacturing, lignin has been considered for enhancing or functionalizing the inherent properties of specific electronic devices, due to its capacity of interfacing with electronic materials.19,22–25 However, the application of lignin as the principal material in device fabrication remains largely uncharted, due to the scarce knowledge of its structure and the properties related to it.
On the other hand, as the traditional von Neumann computing architecture based on complementary metal oxide semiconductor technology is reaching its limit, memristor based computing can potentially offer a hardware breakthrough. Memristors are an emerging class of electronic devices that hold promises for high-density, high-energy efficiency, ultra-fast, low-latency, low power, large-capacity non-volatile memory.26 Various resistive switching materials, including binary oxides, perovskites, organics, and two-dimensional materials, have been proposed.27–31 Herein, we demonstrate that lignin can be an excellent switching material that can toggle between a high and low resistance state without the formation of a conductive filament.26
This study presents an unprecedented way to fabricate device for memristors performance evaluation through the drop casting of lignin layer onto a gold interdigitated electrode array. The drop casting is the simplest wet deposition process that avoids waste of material and is widely recognized for its simplicity and compatibility with any solutions and substrates. It requires low energy and room temperatures and facilitates the precise control of the lignin that is deposited onto the interdigitated electrode (IDE) structures used for the fabrication the device.
The electrical characterization of the device shows two distinct states of resistance which are used to implement a memristor with good endurance and data retention. We also investigate electrical conduction occurring in lignin, identifying the space charge limited and the hopping as the two main conduction mechanisms. Moreover, electrical impedance spectroscopy (EIS) is applied to obtain the dielectric permittivity and the conductivity in a wide frequency range to gain insights into the AC dielectric behaviour of the used lignin and for comparison to the literature.32,33
Our research positions lignin as a promising resistive switching material in the development of memristors for data storage within next-generation integrated systems, marking a significant stride towards harnessing its full potential. Investigating the electrical characteristics of lignin, which in its pristine form shows features comparable to other well-established dielectric materials, opens the door to future developments and uses of this waste material in sustainable organic electronics.
2. Material and device
2.1. Lignin
We used sulphur-containing technical lignin that derives from softwood displaying a lower sulfonate content due to the alkaline post-treatment. An extended chemical and structural characterization of the lignin, with information about the solubility, structural characteristics and thermal stability, is reported elsewhere.19,34 In particular, the amount of polar or aromatic groups and fusion among monomers revealed a condensed and conjugated structure with vinyl units, phenyl enol ethers and a high number of carboxylic acid motieties. Furthermore, the lignin displayed 25.3% total ash content, derived from the alkaline post-treatment with NaOH solution. The elemental composition of ashes, obtained by FE-SEM/EDS (field emission scanning electron microscopy/energy dispersive X-ray spectroscopy), not shown here, revealed the presence of Na (20.7%), O (26.4%), S (4.13%) and K (3.20%) as main elements.19 The lignin was dissolved in a mixture of EtOH![[thin space (1/6-em)]](https://www.rsc.org/images/entities/char_2009.gif) :NH4OHaq,10% in volumetric ratio 1:1. The solvent was obtained by mixing absolute ethanol and 10% w:w aqueous ammonia in 1:1 volumetric ratio. This lignin solution was used for device fabrication. Moreover, a previous investigation by UV-vis spectroscopy showed the capacity of hydroalcoholic ammonia to convert phenolic –OH of lignin into phenoxides.19 In Fig. 1(a), we report the attenuate total transmittance-Fourier transform infrared spectroscopy (ATR-FTIR) of the as-purchased lignin compared with the lignin used for suspension after the drying of the solvent. Fig. 1(a) shows that the lignin does not undergo any significative changes in its structural characteristics after deposition. The spectra were recorded at room temperature in the air in the range between 4000 and 650 cm−1 with a resolution of 4 cm−1, 16 accumulated scans, and a DTGS as a detector.
:NH4OHaq,10% in volumetric ratio 1:1. The solvent was obtained by mixing absolute ethanol and 10% w:w aqueous ammonia in 1:1 volumetric ratio. This lignin solution was used for device fabrication. Moreover, a previous investigation by UV-vis spectroscopy showed the capacity of hydroalcoholic ammonia to convert phenolic –OH of lignin into phenoxides.19 In Fig. 1(a), we report the attenuate total transmittance-Fourier transform infrared spectroscopy (ATR-FTIR) of the as-purchased lignin compared with the lignin used for suspension after the drying of the solvent. Fig. 1(a) shows that the lignin does not undergo any significative changes in its structural characteristics after deposition. The spectra were recorded at room temperature in the air in the range between 4000 and 650 cm−1 with a resolution of 4 cm−1, 16 accumulated scans, and a DTGS as a detector.
 | ||
| Fig. 1 (a) ATR-FTIR spectra of commercial lignin (red line) and dried alcoholic:ammonia lignin suspension (black line), used for the device fabrication. (b) UV-Vis absorption spectrum of a lignin solution (blue curve, lignin dissolved in EtOH:NH4OHaq,10% in volumetric ratio 1:1 at 0.05 mg mL−1 concentration) and a lignin thin film deposited on quarts (red curve, from a 1 mg mL−1 solution in the same solvent combination). Inset: Photo of lignin as thin films (top) and as a solution (bottom). SEM images of lignin at 10 kV and 455× (c) and 2000× (d) magnification. | ||
Fig. 1(b) shows the UV-Vis absorption spectrum of lignin, recorded in solution and in the solid state. The solvent used was EtOH:NH4OHaq,10% in volumetric ratio 1:1. As for conjugated organic polymers, the optical bandgap can be calculated as  , where λonset is the absorption edge calculated from the intercept between the tangent of the absorption curve and the x-axis. With this approach, the lignin optical bandgap is 3.1 eV in solution and 2.6 eV in solid state phase. However, since lignin is a biopolymer with a very intricate structure, not all the lignin chains might possess the same optical bandgap; the quoted values may refer only to the polymer chains possessing the most condensed/conjugated molecular backbones. The obtained results, as well as the measured absorbance spectra, are in agreement with the data available in the literature.35
To investigate the physical changes that occurred after the deposition, the morphology of the lignin was investigated by scanning electron microscopy (SEM). The SEM image in Fig. 1(c) shows the lignin's rough surface over a wide area, similar to previous works.36–38 A careful look shows also the presence of cracks (magnified in the SEM image of Fig. 1(d)) that delimit irregular-shaped regions.
Table 1 shows the elemental analyses of the purchased lignin and the dried lignin suspension to check for possible changes in the lignin used in the solution. Carbon, hydrogen, nitrogen, and sulphur contents were determined for the purchased lignin and the dried alcoholic:ammonia solution of the same lignin. All analyses were carried out on 5 mg samples to evidence well changes in sulphur or nitrogen content. Oxygen content was calculated for all samples by the difference after ash correction (25.3%). All determinations were done twice. Results showed a small increase in nitrogen content, probably ammonia solution allows a small functionalization of the lignin. This small functionalization was previously attributed to the formation of Schiff's bases on the few lignin's available pending carbonyls.39
| Elemental analysis (%w/w) | |||||
|---|---|---|---|---|---|
| C | H | N | S | O | |
| Lignin | 46.03 | 4.84 | 0.06 | 1.80 | 21.97 |
| Dried suspension | 42.96 | 4.90 | 0.23 | 1.65 | 24.96 |
2.2. Device
A cartoon of the device and the measurement setup is shown in Fig. 2(a). The interdigitated Au electrodes and the morphology of the deposited lignin are made evident in the optical image of Fig. 2(b). Despite the presence of a few empty zones (brighter colours), caused by the deposition technique, a good spreading of the material can be observed. Noteworthy, the optical image shows that the lignin forms agglomerates (grains) with different sizes from about 20 μm to 100 μm. | ||
| Fig. 2 (a) Cartoon of the device with the lignin deposited over interdigitated Au electrodes, ending with pads connected to the probe station. (b) Optical image at 10× magnification of the lignin over the interdigitated Au electrodes. (c) AFM image of a 70 μm × 70 μm portion of deposited lignin; the 15 μm × 15 μm magnified area shows pinholes in the material. The path used to extract the thickness profile is shown in black. (d) The height profile of the lignin layer was estimated along a path length of 3.5 μm. | ||
Atomic force microscopy (AFM) analysis was carried out in a region without gold, where the lignin lays on the glass substrate, so that the thickness of the deposited material could be accurately extracted. Fig. 2(c) shows the AFM image of a 70 μm × 70 μm wide region; the magnification of a 15 μm × 15 μm sub-area reveals the presence of pinholes, about 1 μm wide, presumably due to the structure of the lignin, as already reported.40 The root-mean-square (RMS) roughness on this scanned area is about 107 nm. Fig. 2(d) shows the profile of the material thickness along the path indicated by the black dotted line in Fig. 2(c), corresponding to a layer thickness of approximately 370 nm. Multiple profiles extracted from the same region indicated an average thickness around 400 nm.
3. Results and discussion
3.1. Current–voltage measurements
The initial electrical characterization of the device was performed through current (I)–voltage (V) measurements at atmospheric pressure and room temperature. As shown by the black curve in Fig. 3(a), the test was conducted within a voltage range of ±5 V following the sequence 0 V → 5 V (branch 1), 5 V → −5 V (branches 2 and 3) and −5 V → 5 V (branches 4 and 5). The cycle begins with a trigger current (indicated as branch 1) that only appears at the start of the test. Thereafter, the I–V curve follows a butterfly-shaped path. This butterfly-shaped profile, which has been already reported in literature,29 is due to the right and left shift of the I–V curve during the back-and-forth voltage sweep and corresponds to a pronounced hysteresis with the switching between a low resistance state (LRS) and a high resistance state (HRS). For positive voltages, the LRS (branch 1) is observed for increasing V and changes to an HRS (branch 2) when V decreases from 5 V. Similar behaviour is observed for negative voltages, with the LRS observed for increasing negative V and the HRS for decreasing negative bias. The presence of two switching voltages from LRS to HRS, at ±5 V, places the device in the category of bipolar resistive switching (BRS) memories,41 with the butterfly-shaped behaviour that distinguishes it as an abnormal BRS memory.42 Also evident is the formation in the HRS of a current valley, at non-zero voltages, for both positive and negative branches, and a significantly higher current, by about two orders of magnitude, in the LRS at the same voltages. This behaviour differs from other BRS in the literature42,43 and requires an explanation. | ||
| Fig. 3 (a) Butterfly-shaped I–V characteristic over a ±5 V voltage range, in a semi-log plot, at room pressure (black curve) and at 2.2 mbar (green curve), with temperature at 295 K; the orange arrows, appropriately numbered, distinguish specific parts of the curve. (b) Current trend as a function of temperature from 290 K to 395 K, evaluated at −5 V. Inset: I–V characteristics acquired at increasing temperature, from 290 K to 395 K, and at room pressure. (c) Butterfly-shaped I–V characteristics, on a semi-log-scale, at room temperature and pressure, acquired at different maximum voltage ranges. (d) Dependence on the maximum voltage range of the I–V hysteresis (black curve) and the position of the minima (red curve). | ||
Subsequently, the I–V measurements were performed at a pressure of 2.2 mbar and room temperature, as shown by the green curve in Fig. 3(a). Although the butterfly-shaped structure of the I–V curve is preserved, the current is significantly lowered by about 6 orders of magnitude, pointing to the dramatic role that air exposure might play in lignin's conductivity.
Similarly, a temperature-dependent characterization was conducted at atmospheric pressure. Starting at 290 K, the temperature was incrementally increased to 395 K in 15 K steps. Fig. 3(b) shows that the current measured at −5 V decreases with the rising temperature up to 335 K, and then begins a gradual increase up to 395 K. A subset of the I–V curves, from which the current at −5 V is extracted, are shown in the inset of Fig. 3(b) consistently confirming the butterfly shape over the explored temperature range.
The hysteresis in the I–V curves of the device can be characterized by a width H, defined as H = Imax − Imin, where Imin denotes the current at one of the I–V curve's valley and Imax corresponds to the maximum current at the same voltage but on the LRS (notice that the H is the same either if calculated at the positive or at the negative current valley voltages).
Furthermore, to investigate the butterfly-shaped I–V curves, measurements were carried out in different voltage ranges, at room temperature and pressure. Noticeably, as shown in Fig. 3(c), when the voltage range increases, the butterfly shape is preserved and the current in the device increases, making the LRS and HRS more distinguishable. The increase in hysteresis width (black curve), along with the positive valley voltage shift towards higher positive voltages (red curve), is shown as a function of the voltage range in Fig. 3(d).
3.2. Conduction mechanisms
The process of isolation and purification of the used lignin involved the use of sodium hydroxide NaOH, which inevitably releases Na+ ions in the final material,19 as stated above. Similarly, other species, such as potassium ions K+ present in the original biomass, can be detected in the ash analysis of the purified lignin.19 On the other hand, the solution of ethanol and ammonia drop-casted onto the substrate released phenoxide anions (C6H5O−) and carboxylate groups (COO−) into the material,19 which, especially the latter, can enhance the conduction properties of the lignin. Moreover, when hydrophobic lignin is exposed to air, some species present in air can be physio-adsorbed on its surface contributing to the electrical conduction.44 The adsorption is favoured by the granular structure as well as by the electrostatic force of ions present in it.Therefore, we surmise that there are two parallel electrical conduction channels. The first is related to the intrinsic conduction of lignin as the active material, while the second, much more conductive, involves defects and adsorbed species that act as hopping centres for electrons, which thus become the major charge carriers in lignin. This model is corroborated by the dramatic decrease in current, reported in Fig. 3(a) and (b), caused by adsorbate desorption at lower pressure and/or at high temperatures.45,46
The presence of positive and negative free ions, beyond their contribution to conduction, allows for significant polarization of the active material of the device, which can explain the shift of the I–V curve during the back-and-forth voltage sweep and the formation of the butterfly-shaped curve. When lignin is subjected to an electric field, positive and negative ions accumulate at the electrodes, so the voltage that is applied to lignin is reduced, as the applied one is screened by the accumulated ions. Starting from zero, with the increase in voltage up to 5 V, ions of opposite charge accumulate at the two electrodes as shown in Fig. 4(a); when the voltage is reversed, the accumulated charge does not disperse at the same rate as the voltage decreases, so the actual voltage drop across lignin remains lower than the applied voltage, as shown in Fig. 4(b); this causes a lower current and the HRS as well as a point where the applied voltage is non-zero, positive, but the actual voltage on lignin is null, resulting in the formation of the valleys in the I–V curve, as shown in Fig. 4(c). With the decreasing voltage in the negative direction, there will be a point where, due to this accumulation of ionic charges, the effective voltage is non-null while the applied voltage is zero, thereby registering a significant current. This process is then reiterated when the polarity of the applied voltage is reversed.
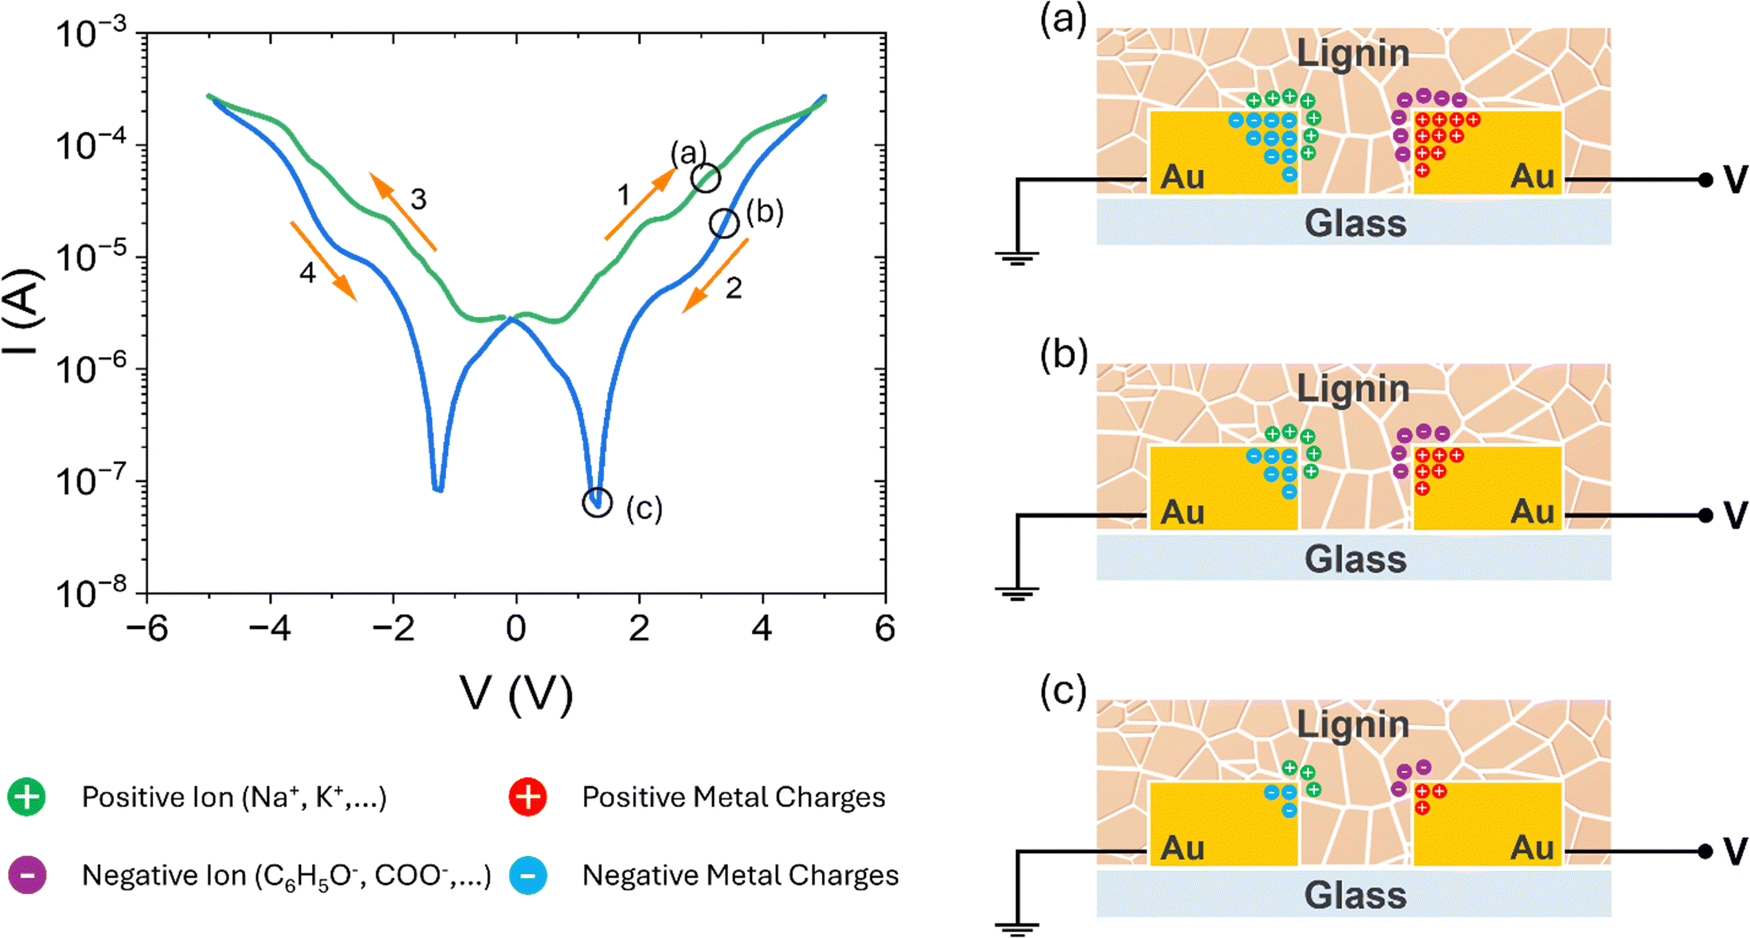 | ||
| Fig. 4 Charge accumulation in lignin for (a) positive sweep (LRS), (b) reverse sweep (HRS), and (c) I–V current valley voltage. In the bottom-left of the figure, a legend has been included for a better understanding of the charges in the proposed model: positive ions in lignin (green), negative ions in lignin (violet), positive metal charges (red), negative metal charges (cyan). | ||
Having understood the origin of the I–V butterfly curves, and their pressure and temperature dependence, now we address the electrical conduction mechanisms. Fig. 5(a) is a semi-log plot of the I–V curve. Four regions, linked to four different conduction mechanisms, highlighted by the brown, cyan, violet and pink colours can be identified. The first brown region corresponds to a linear increase of the current, I ∝ V consistent with an ionic conduction mechanism47 (see inset of Fig. 5(a)). The cyan region, shown in Fig. 5(b), is well fitted by power law, I ∝ Vγ, with exponent 2.36, which indicates a space-charge-limited conduction as the dominant transport mechanism.48 When the applied voltage is increased, there is a change in the I–V curve (violet region). Fig. 5(c) shows the best fit, which is provided by a hopping mechanism between trap centres,  , where q is the elementary charge, a the average distance between two adjacent trap sites, E = V/d the electric field, d the inter-electrode distance, kB is the Boltzmann constant and T is the temperature.48
 | ||
| Fig. 5 (a) I–V curve at 295 K. The brown, cyan, violet and pink dots represent different current conduction mechanisms, i.e. ionic conduction (inset), (b) space-charge-limited conduction, (c) hopping conduction and (d) ohmic conduction. (e) Positive branch of the I–V curve at 395 K and (f) fit of ohmic conduction. | ||
At higher voltages (pink region), the conduction mechanism becomes ohmic, I ∝ V, as shown in the log–log plot of Fig. 5(d). Therefore, the charge transport changes from ionic conduction to electron conduction via space-charge-limited, hopping and finally ohmic mechanism while the applied voltage is increased. At high temperature (Fig. 5(e)), the three conduction mechanisms are not distinguishable, and the I–V curve is consistent with ohmic conduction, as shown in Fig. 5(f).
Based on the fits, then, the proposed conduction model is as follows: electrons injected from the electrode, begin to populate the trap states at low voltage until the filling is sufficiently high to form space charge which limit the current.48 When the voltage increases, the carriers get enough energy to hop from one trapped site to the next, and only when all the traps are filled, conduction becomes of ohmic type.
The proposed mechanisms are valid for both HRS and LRS I–V branches (as the material polarization makes one branch shift with respect to the other, ohmic conduction is not observed on the HRS branch). This is highlighted in Fig. 5(a) where the regions with the same conduction mechanisms on the HRS and LRS branches are colour-matched.
At a pressure of 2.3 mbar the material shows a higher resistance because the adsorbates such as water, protagonists of the above mechanisms, are desorbed and ohmic conduction becomes dominant.49
3.3. Dielectric properties
EIS was applied to measure impedance spectra, Z vs. ω (where Z = ReZ + iImZ, ReZ is the real part and ImZ is the imaginary part of the impedance Z, and where ω is the frequency), in room conditions (RH = 50%, T = 291–293 K). The Z vs. ω data have been then adopted for the evaluation of the complex AC dielectric permittivities ε* and conductivities σ*, which are expressed via the corresponding real (ε′, σ′) and imaginary (ε′′, σ′′) parts as| ε* = ε′ + iε′′ | (1) |
| σ* = σ′ + σ′′ | (2) |
The real and imaginary parts of dielectric permittivity were estimated from the ReZ and ImZ part of the impedance data and by adopting classical formulas:50
 | (3) |
| σ*(ω) = σ′(ω) + iσ′′(ω) = iωε0ε*(ω) = iωε0(ε′(ω) − iε′′(ω)) | (4) |
The analysis of the ε′ dispersion reveals a plateau that terminates with a shoulder around 10 kHz, as shown in filled-dots curve in Fig. 6(a), followed by a sharp drop at high frequencies. In the same frequency range, the ε′′ vs. ω (emptied-dots curve in Fig. 6(a)) exhibits a minimum, followed by a bump corresponding to the ε′ relaxation, associated with electrode polarization (EP).
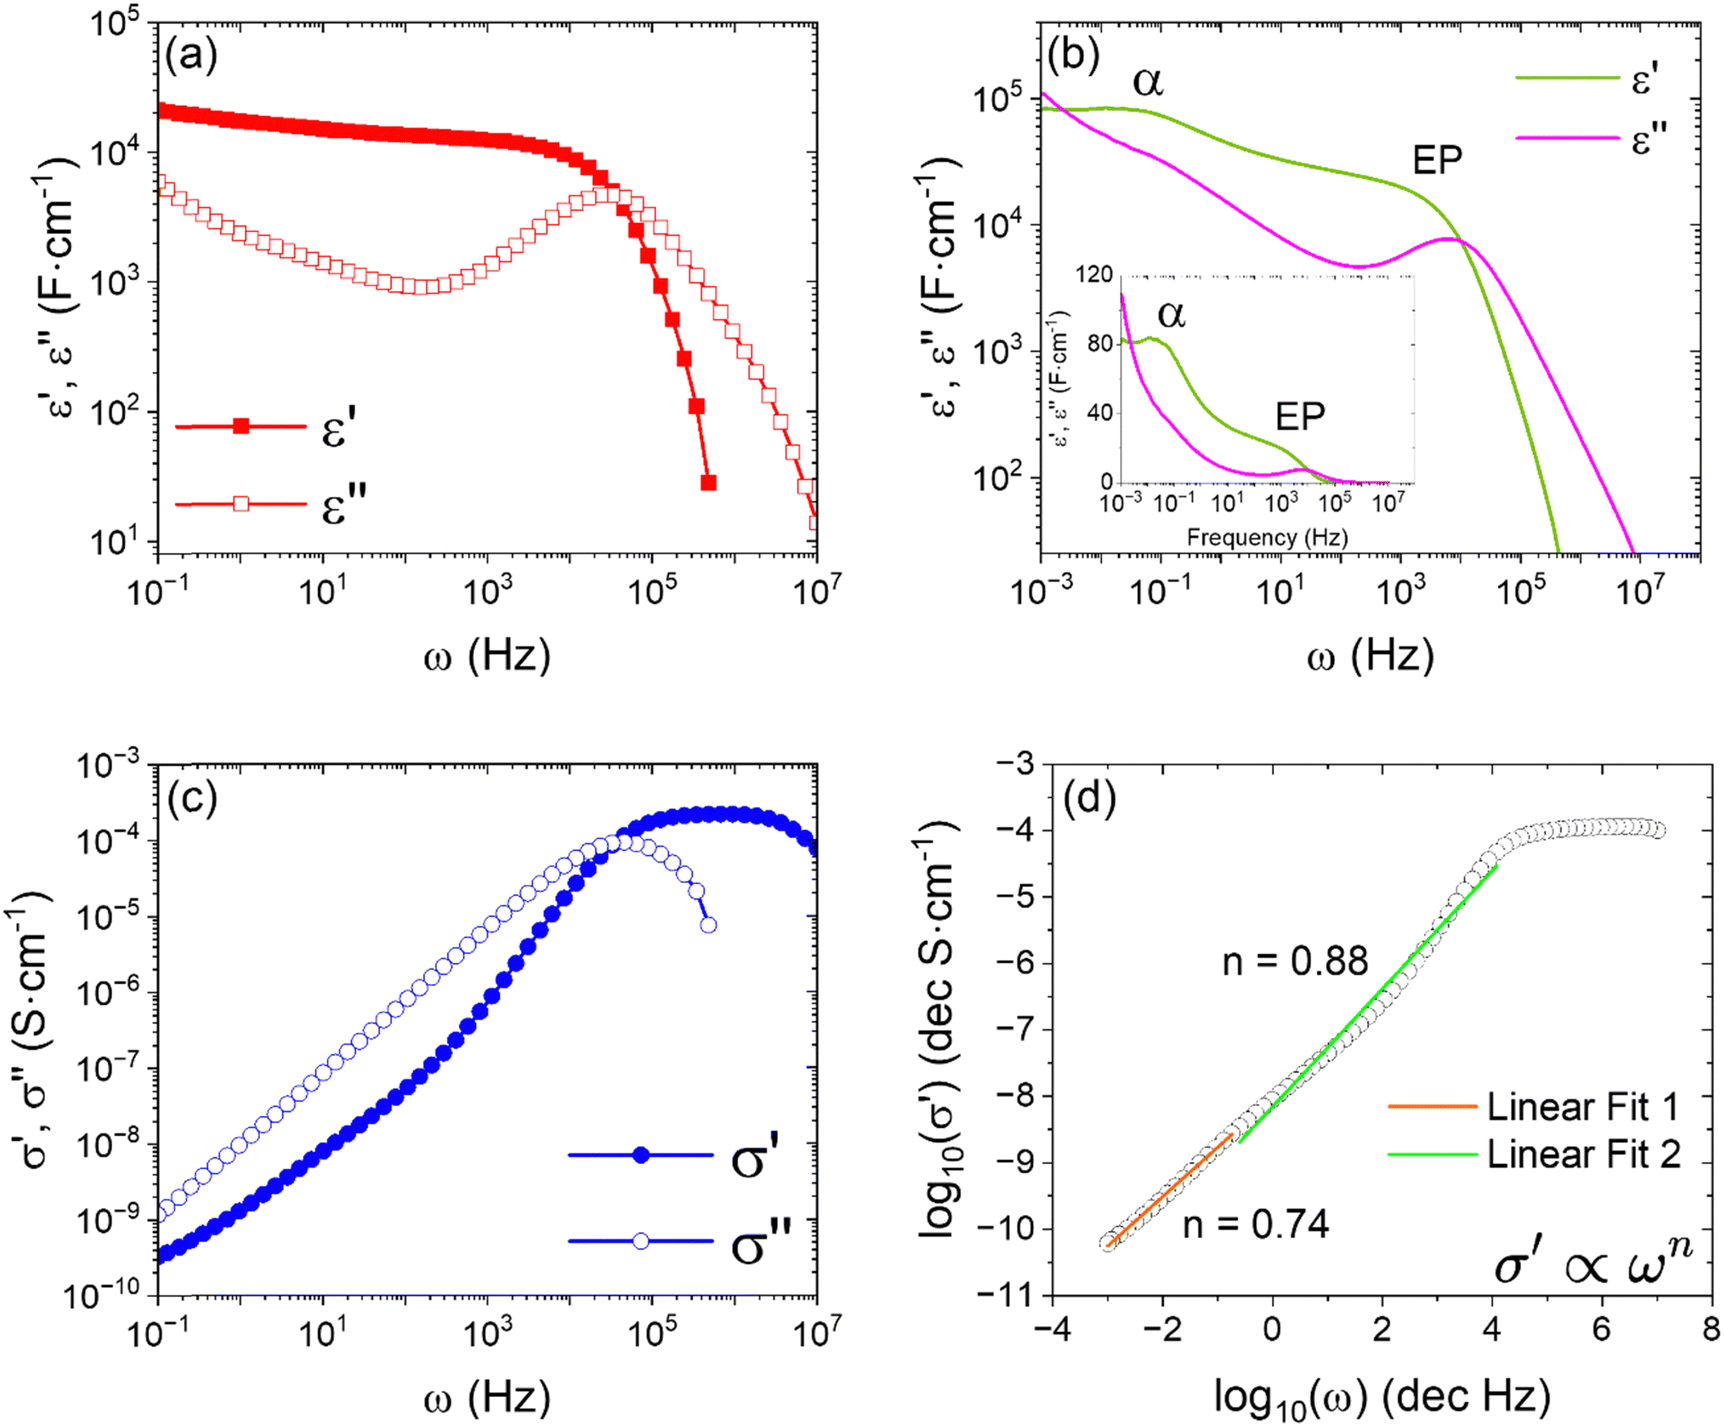 | ||
| Fig. 6 (a) Log–Log plot of real ε′ and imaginary ε′′ parts of the dielectric permittivity versus frequency in the range from 0.1 Hz to 10 MHz and (b) from 1 mHz to 100 MHz, with AC voltage VAC = 300 mV. Inset: Semi-log plot of permittivity spectra. (c) Log–Log plot of real σ′ and imaginary σ′′ parts of AC conductivity versus frequency in the range from 0.1 Hz to 10 MHz. (d) Linear fits of σ′ versus frequency following Jonscher–Funke on different frequency range. | ||
To gain deeper insights into the lignin dielectric response and discern much slower relaxation processes, we extend the spectra down to 1 mHz in Fig. 6(b). The relaxation phenomenon known as α, attributed to the segmental motion of polymer chains, manifests as a peak at ω < 0.1 Hz. Notably, in the lowest frequency range of the ε′′ vs. ω dispersion, a linear behavior is present, corresponding to DC-related conductivity term superimposed to the relaxation ones.51 The presence of two main relaxations in ε′ is also visible in the representation in linear scale (see inset of Fig. 6(b)) by the linear behaviour in the lowest frequency range due to the DC-related term.51
Concerning AC conductivity, looking at Fig. 6(c), in the frequency range from 1 mHz to 100 kHz, the real part σ′ exhibits an increase from 10−11 to 10−4 S cm−1. Notably, this conductivity value corresponds to the plateau, which also marks the end of the electrode polarization and starting of ionic charge diffusion. Moreover, analysing the σ′ vs. ω spectrum in Fig. 6(d) we discern two distinct regions: the first one is between 1.0 mHz and 1.0 Hz where the behaviour follows the Johnsher–Funke model52 with n = 0.7 (orange line in Fig. 6(d)) and where the conductivity is at its lowest and it is localized in a region where polymer chains are responsive. We attribute this region to the conductivity of paths available for percolative processes. In the second region, i.e. between 1.0 Hz and 10 kHz the behaviour adheres to the Johnsher–Funke model since n = 1.0 (green line in Fig. 6(d)). Here, the conductivity increases, and it is associated with charge-hopping processes through localized states.53
3.4. Memristor
The distinctive shape of the I–V characteristics of the lignin-based device suggests its application as a memristor.54,55 Indeed, the two well-separated resistive states, LRS and HRS, can be identified as logic 1 with higher current and logic 0 with lower current, respectively. A positive or negative voltage pulse (e.g. ±5 V) can be applied to switch between the LRS and HRS at a given reading voltage (e.g. the positive or negative valley voltage).Fig. 7(a) shows three cycles of 5 consecutive I–V measurements demonstrating that the electrical behaviour of lignin is preserved upon electrical stress, even after several cycles of operation. This stable behaviour is essential to operate the device with the same current and voltage levels regardless of the device usage.
 | ||
| Fig. 7 (a) Three measurement each of five complete I–V cycles showing the excellent stability of the device. (b) Two complete WRER cycles, normalized to HRS current, with pulses of 0.5 s duration at 5 V and −5 V, and read time of 50 s. (c) Two complete WRER cycles, normalized to HRS current, with pulses of 40 s duration and read time of 4000 s. (d) 125 complete WRER cycles, normalized to HRS current, with 40 s write/erase pulses and read time of 60 s. | ||
Erase, write and read voltage pulses were then applied to check the performance of the device as a memory. Based on the I–V characteristics in Fig. 7(a), it was chosen to read the logic bit at a voltage of 1.3 V, corresponding to the greatest separation between the two resistive states, while pulses at 5 V and −5 V were applied to write a state 0 and a state 1, respectively. Fig. 7(b) shows the current under the application of voltage pulses with a duration of 500 ms in a write–read–erase–read (WRER) sequence; although there is a characteristic time during the read phase within which the current reaches a steady condition, there remains a margin of about one order of magnitude between the current in the LRS and that in the HRS.
Likewise, in Fig. 7(c), the current was monitored over a long time of 4000 s after the application of WRER voltage pulses of 40 s duration; the figure shows that the two current states remain well separated after a long time, showing great retention properties.
Finally, the endurance of the memory was tested with several WRER cycles. Fig. 7(d) shows that after about 130 WRER cycles, with fixed-height pulses at 6.3 V and −3.7 V to write a state 0 and a state 1 respectively, corresponding to a continuous working time of more than 25 × 103 s, the device still maintains a significant separation between the two current states, so guaranteeing endurance necessary for memory applications. The steady increase in the on and off currents indicates an increase in conductance due to modification of the lignin/electrode interface or of the atomic structure of lignin, caused by the electrical stresses during WRER operations.
4. Conclusions
In conclusion, we have shown that a technical lignin can be used for memory electronic devices. The successful realization via an all-solution processed lignin memristor device with reproducible electrical properties has been demonstrated. The devices have been tested via I–V and dielectric permittivity characterizations. The I–V curves showed a butterfly shape with stable hysteresis and strong dependence on temperature and air pressure. A model based on ionic charge accumulation at the electrodes and polarization of air adsorbates can explain the experimental findings, also corroborated by the analytical fits of I–V curves and by the dielectric permittivity and conductivity versus frequency measurements. Moreover, the lignin-based device has been proposed and demonstrated as memristor with low power consumption, good data retention and endurance.This study not only enhances our understanding of lignin's electrical conduction but also opens exciting routes for memristor applications. With its stability, wide memory window, non-volatility, and endurance, the lignin-based memristor holds promise for sustainable and high-performance memory devices, opening a whole stream of research about the possibility to also improve the performance that has been presented here on pure lignin.
5. Experimental section
Device fabrication
The lignin used in this study was purchased from Sigma-Aldrich. To fabricate the devices, we utilized a drop-casting method. Specifically, a suspension of lignin in ethanol/ammonia solution with a concentration of 10 mg ml−1 was carefully drop-cast onto a glass substrate. The choice of ethanol/ammonia as the solvent provides solubility for lignin and facilitates uniform deposition due to its controlled evaporation rate. The substrate was specially prepared with a circular interdigitated electrode (IDE) array provided by MICRUX, featuring electrodes with dimensions of 10 μm width and 10 μm gap, totally 90 pairs on a 3.0 mm diameter.During the deposition process, 20 μl of lignin suspension was uniformly spread onto the IDE array. The suspension was sonicated for 15 minutes before drop casting and the substrates were cleaned for 15 minutes in propanol for a gentle surface degreasing. A graduate Eppendorf pipette (10–20 μl) was adopted to finely control the droplet volume. The samples were left to dry in ambient air at a temperature of 291 K and relative humidity (RH) = 50% to promote the formation of a stable lignin film on the electrode surface. To assess the reproducibility of the process, we produced sets of several identical devices obtaining consistent results under similar environmental conditions. Also, stability in time was evaluated by measuring the samples after several days from deposition. This method ensures that the lignin adheres evenly across the electrode surfaces, forming a consistent and well-defined coating.
Experimental equipment
ATR-FTIR spectra were collected with a Thermo Fischer Nicolet iS50 FTIR instrument interfaced with an ATR ITX accessory equipped with a diamond crystal (radiation penetration approximately 2 μm at 1000 cm−1). The spectra were elaborated using SPECTRA software. Elemental analyses were performed on an Elementar Vario Micro Cube analyzer. The impedance spectra were collected by using a Novocontrol Impedance Analyzer. The electrical measurements were performed with a Lake Shore probe station connected to a semiconductor characterization system Keithley 4200-SCS, at atmospheric pressure. Temperature was controlled in the range 200–395 K by using a Lake Shore controller. The height profile of the Lignin film was measured by atomic force microscopy (NaioAFM by Nanosurf AG).A Novocontrol Impedance Analyzer has been adopted for EIS measurements. The impedance spectra were collected in the frequency range either 1.0 mHz–10 MHz or 0.1 Hz–10 MHz and by applying an AC voltage VAC = 300 mV.
Data availability
The data supporting this article have been included as part of the ESI.† The data are provided as Origin plots with embedded data collected in the ppt file named data_lignin.ppt.Conflicts of interest
There are no conflicts to declare.Acknowledgements
A. D. B. and O. D. acknowledge the financial support from the University of Salerno, with grant ORSA223384 and ORSA235199. R. D. and A. O. acknowledge the University of Pisa for the funding “BIHO 2022 – Bando Incentivi di Ateneo Horizon e Oltre” (Prot. no. 0048740/2022). M. A. and P. F. A. acknowledge the Italian Ministry of University and Research (MUR) PONa3_00369 SISTEMA.References
- S. C. Baral, P. Maneesha, S. Sen, S. Sen and S. Sen, in Optical Properties of Metal Oxide Nanostructures, ed. V. Kumar, I. Ayoub, V. Sharma and H. C. Swart, Springer Nature, Singapore, 2023, vol. 26, pp.1–34 Search PubMed.
- C. Wang, K. Xia, H. Wang, X. Liang, Z. Yin and Y. Zhang, Adv. Mater., 2019, 31, 1801072 CrossRef PubMed.
- S. Tajik, Z. Dourandish, F. Garkani Nejad, H. Beitollahi, P. M. Jahani and A. Di Bartolomeo, Biosens. Bioelectron., 2022, 216, 114674 CrossRef CAS PubMed.
- D. Jiang, Z. Liu, Z. Xiao, Z. Qian, Y. Sun, Z. Zeng and R. Wang, J. Mater. Chem. A, 2022, 10, 89–121 RSC.
- N. Suresh Kumar and K. Chandra Babu Naidu, J. Materiomics, 2021, 7, 940–956 CrossRef.
- O. Durante, K. Intonti, L. Viscardi, S. De Stefano, E. Faella, A. Kumar, A. Pelella, F. Romeo, F. Giubileo, M. S. G. Alghamdi, M. A. S. Alshehri, M. F. Craciun, S. Russo and A. Di Bartolomeo, ACS Appl. Nano Mater., 2023, 6, 21663–21670 CrossRef CAS PubMed.
- A. Kumar, K. Intonti, L. Viscardi, O. Durante, A. Pelella, O. Kharsah, S. Sleziona, F. Giubileo, N. Martucciello, P. Ciambelli, M. Schleberger and A. Di Bartolomeo, Mater. Horiz., 2024, 11, 2397–2405 RSC.
- Y. Zheng, J. Wei, J. Liu, L. Chen, K. An, X. Zhang, H. Ye, X. Ouyang and C. Li, Int. J. Miner., Metall. Mater., 2022, 29, 404–423 CrossRef.
- A. Kumar, E. Faella, O. Durante, F. Giubileo, A. Pelella, L. Viscardi, K. Intonti, S. Sleziona, M. Schleberger and A. Di Bartolomeo, J. Phys. Chem. Solids, 2023, 179, 111406 CrossRef CAS.
- A. S. R. Bati, Y. L. Zhong, P. L. Burn, M. K. Nazeeruddin, P. E. Shaw and M. Batmunkh, Commun. Mater., 2023, 4, 2 CrossRef CAS.
- Organic Electronics Materials and Devices, ed. S. Ogawa, Springer, Japan, Tokyo, 2015 Search PubMed.
- M. Fahlman, S. Fabiano, V. Gueskine, D. Simon, M. Berggren and X. Crispin, Nat. Rev. Mater., 2019, 4, 627–650 CrossRef CAS.
- O. Yu and K. H. Kim, Appl. Sci., 2020, 10, 4626 CrossRef CAS.
- R. J. A. Gosselink, E. de Jong, B. Guran and A. Abächerli, Ind. Crops Prod., 2004, 20, 121–129 CrossRef CAS.
- F. Reesi, M. Minaiyan and A. Taheri, Drug Delivery Transl. Res., 2018, 8, 111–122 CrossRef CAS PubMed.
- Z. Wan, H. Zhang, M. Niu, Y. Guo and H. Li, Int. J. Biol. Macromol., 2023, 253, 126660 CrossRef CAS PubMed.
- Y. She, X. Li, Y. Zheng, D. Chen, X. Rui, X. Lin and Y. Qin, Energy Environ. Mater., 2023, e12538 Search PubMed.
- V. C. Tran, G. G. Mastantuoni, D. Belaineh, S. Aminzadeh, L. A. Berglund, M. Berggren, Q. Zhou and I. Engquist, J. Mater. Chem. A, 2022, 10, 15677–15688 RSC.
- R. D’Orsi, C. V. Irimia, J. J. Lucejko, B. Kahraman, Y. Kanbur, C. Yumusak, M. Bednorz, F. Babudri, M. Irimia-Vladu and A. Operamolla, Adv. Sustainable Syst., 2022, 6, 2200285 CrossRef.
- Y. Park and J.-S. Lee, ACS Appl. Mater. Interfaces, 2017, 9, 6207–6212 CrossRef CAS PubMed.
- S. Wu, E. Kim, C. Chen, J. Li, E. VanArsdale, C. Grieco, B. Kohler, W. E. Bentley, X. Shi and G. F. Payne, Adv. Electron. Mater., 2020, 6, 2000452 CrossRef CAS.
- É. I. Chupka and T. M. Rykova, Chem. Nat. Compd., 1983, 19, 78–80 CrossRef.
- S. Kane, R. Ulrich, A. Harrington, N. P. Stadie and C. Ryan, Carbon Trends, 2021, 5, 100088 CrossRef CAS.
- Y. Zheng, H. Liu, L. Yan, H. Yang, L. Dai and C. Si, Adv. Funct. Mater., 2024, 34, 2310653 CrossRef CAS.
- B. Jiang, H. Jiao, X. Guo, G. Chen, J. Guo, W. Wu, Y. Jin, G. Cao and Z. Liang, Adv. Sci., 2023, 10, 2206055 CrossRef CAS PubMed.
- Y. Xiao, B. Jiang, Z. Zhang, S. Ke, Y. Jin, X. Wen and C. Ye, Sci. Technol. Adv. Mater., 2023, 24, 2162323 CrossRef PubMed.
- Z. Peng, A. Grillo, A. Pelella, X. Liu, M. Boyes, X. Xiao, M. Zhao, J. Wang, Z. Hu, A. D. Bartolomeo and C. Casiraghi, Mater. Horiz., 2024, 11, 1344–1353 RSC.
- C. J. Bettinger and Z. Bao, Polym. Int., 2010, 59, 563–567 CrossRef CAS PubMed.
- M. Khalid Rahmani, S. Ali Khan, M. Farooq Khan and M. Hee Kang, Mater. Sci. Eng., B, 2022, 282, 115784 CrossRef CAS.
- X. Liu, Z. Ji, D. Tu, L. Shang, J. Liu, M. Liu and C. Xie, Org. Electron., 2009, 10, 1191–1194 CrossRef CAS.
- S. A. Khan, M. K. Rahmani, H. Kim, M. F. Khan, C. Yun and M. H. Kang, Org. Electron., 2021, 96, 106228 CrossRef CAS.
- M. P. F. Graça, A. Rudnitskaya, F. A. C. Faria, D. V. Evtuguin, M. T. S. R. Gomes, J. A. B. P. Oliveira and L. C. Costa, Electrochim. Acta, 2012, 76, 69–76 CrossRef.
- D. V. Stergiou, P. G. Veltsistas and M. I. Prodromidis, Sens. Actuators, B, 2008, 129, 903–908 CrossRef CAS.
- R. D’Orsi, J. J. Lucejko, F. Babudri and A. Operamolla, ACS Omega, 2022, 7, 25253–25264 CrossRef PubMed.
- M. Takada, Y. Okazaki, H. Kawamoto and T. Sagawa, ACS Omega, 2022, 7, 5096–5103 CrossRef CAS PubMed.
- N. A. Zakaria, M. Hazwan Hussin, A. L. Ahmad, C. P. Leo, P. E. Poh, K. Behzadian, I. I. Akinwumi, A. Moghayedi and J. Diazsolano, J. Water Process Eng., 2021, 43, 102248 CrossRef.
- W. Liu, Y. Yao, O. Fu, S. Jiang, Y. Fang, Y. Wei and X. Lu, RSC Adv., 2017, 7, 48537–48543 RSC.
- Y. Li, Q. Fu, R. Rojas, M. Yan, M. Lawoko and L. Berglund, ChemSusChem, 2017, 10, 3445–3451 CrossRef CAS PubMed.
- R. D’Orsi, N. Di Fidio, C. Antonetti, A. M. Raspolli Galletti and A. Operamolla, ACS Sustainable Chem. Eng., 2023, 11, 1875–1887 CrossRef PubMed.
- E. Rosova, N. Smirnova, E. Dresvyanina, V. Smirnova, E. Vlasova, E. Ivan’kova, M. Sokolova, T. Maslennikova, K. Malafeev, K. Kolbe, M. Kanerva and V. Yudin, Cosmetics, 2021, 8, 24 CrossRef CAS.
- G. Wang, C. Li, Y. Chen, Y. Xia, D. Wu and Q. Xu, Sci. Rep., 2016, 6, 36953 CrossRef CAS PubMed.
- D. Y. Guo, Z. P. Wu, L. J. Zhang, T. Yang, Q. R. Hu, M. Lei, P. G. Li, L. H. Li and W. H. Tang, Appl. Phys. Lett., 2015, 107, 032104 CrossRef.
- D. S. Jeong, H. Schroeder and R. Waser, Nanotechnology, 2009, 20, 375201 CrossRef PubMed.
- M. Erfani Jazi, G. Narayanan, F. Aghabozorgi, B. Farajidizaji, A. Aghaei, M. A. Kamyabi, C. M. Navarathna and T. E. Mlsna, SN Appl. Sci., 2019, 1, 1094 CrossRef CAS.
- A. Di Bartolomeo, A. Pelella, X. Liu, F. Miao, M. Passacantando, F. Giubileo, A. Grillo, L. Iemmo, F. Urban and S. Liang, Adv. Funct. Mater., 2019, 29, 1902483 CrossRef.
- A. Di Bartolomeo, A. Kumar, O. Durante, A. Sessa, E. Faella, L. Viscardi, K. Intonti, F. Giubileo, N. Martucciello, P. Romano, S. Sleziona and M. Schleberger, Mater. Today Nano, 2023, 24, 100382 CrossRef CAS.
- S. M. Sze and K. K. Ng, Physics of Semiconductor Devices, Wiley, 1st edn, 2006 Search PubMed.
- F.-C. Chiu, Adv. Mater. Sci. Eng., 2014, 2014, 1–18 Search PubMed.
- X. Guo, H. Yuan, T. Xiao and Y. Wu, Int. J. Biol. Macromol., 2019, 131, 1038–1043 CrossRef CAS PubMed.
- Impedance Spectroscopy: Theory, Experiment, and Applications, ed. E. Barsoukov and J. R. Macdonald, Wiley, 1st edn, 2005 Search PubMed.
- S. Havriliak and S. Negami, J. Polym. Sci., Part C: Polym. Symp., 1966, 14, 99–117 CrossRef.
- A. K. Jonscher, Nature, 1977, 267, 673–679 CrossRef CAS.
- K. Funke, Prog. Solid State Chem., 1993, 22, 111–195 CrossRef CAS.
- V. Erokhin, G. D. Howard and A. Adamatzky, Int. J. Bifurc. Chaos, 2012, 22(11), 1250283 CrossRef.
- Q. Zhao, Z. Xie, Y.-P. Peng, K. Wang, H. Wang, X. Li, H. Wang, J. Chen, H. Zhang and X. Yan, Mater. Horiz., 2020, 7, 1495–1518 RSC.
Footnote |
| † Electronic supplementary information (ESI) available. See DOI: https://doi.org/10.1039/d4tc02229g |
| This journal is © The Royal Society of Chemistry 2024 |