
 Open Access Article
 This Open Access Article is licensed under a
 Creative Commons Attribution 3.0 Unported Licence
Dissecting the nature and dynamics of electronic excitations in a solid-state aggregate of a representative non-fullerene acceptor†
Samuele
Giannini
 *a,
Jesús
Cerdá
b,
Giacomo
Prampolini
a,
Fabrizio
Santoro
a and
David
Beljonne
b
*a,
Jesús
Cerdá
b,
Giacomo
Prampolini
a,
Fabrizio
Santoro
a and
David
Beljonne
b
aInstitute of Chemistry of OrganoMetallic Compounds, National Research Council (ICCOM-CNR), I-56124 Pisa, Italy. E-mail: samuele.giannini@cnr.it
bLaboratory for Chemistry of Novel Materials, University of Mons, Mons 7000, Belgium
First published on 4th June 2024
Abstract
Understanding electronic excitations and their dynamics in non-fullerene acceptor (NFA) materials is crucial for improving the efficiency of opto-electronic devices. In this study, we use a Frenkel-exciton Hamiltonian, which couples electronic and nuclear degrees of freedom, to investigate the optical properties and exciton dynamics in an extended solid-state aggregate formed by a representative NFA named m-4TICO. Besides the presence of significant H-like interactions, we observed a predominant influence of J-aggregation-like effects on the solid-state absorption spectrum, resulting in a spectral red-shift and a reduced vibronic band compared to the solution phase. We have also identified a significant correlation between energetic disorder—primarily due to low-frequency molecular torsional vibrations in the acceptor–donor–acceptor structure—and the Stokes shift. Through semiclassical non-adiabatic molecular dynamics, we explore how excitonic interaction patterns affect exciton delocalization and diffusion. Based on our results, we discuss design principles derived from the manipulation of energetic disorder and excitonic coupling-sign relationships that substantially modulate exciton transport, thereby offering actionable strategies to enhance the efficiency of opto-electronic devices.
 Samuele Giannini | Dr Samuele Giannini received his MSc in Chemistry in 2016 from the University of Pisa (Italy), where he worked in the group of Prof. Benedetta Mennucci. He then moved to the UK, where he pursued his PhD at University College London (UCL) under the supervision of Prof. Jochen Blumberger. In London, he worked on modelling electronic transport processes in nano-scale organic semiconductors. Dr. Giannini completed his PhD in December 2020 and was awarded the Marshall Stoneham Prize for the best PhD thesis in Condensed Matter & Materials Physics from UCL. After a short postdoctoral stay at UCL, in March 2021, he joined the group of Prof. David Beljonne in the Laboratory for Chemistry of Novel Materials (CMN) at the University of Mons (Belgium). During his stay in Mons, he was awarded a Chargé de Recherches Fellowship from the FNRS. Currently, Samuele is back in Pisa as a staff researcher at the Italian National Research Council (CNR). In 2024, he was awarded a Marie Skłodowska-Curie Actions Postdoctoral Fellowship to carry on his research on the electronic and transport properties of both natural and artificial systems. |
Introduction
In the field of organic photovoltaics (OPVs), now approaching a 20% power conversion efficiency,1–3 the discovery and optimization of non-fullerene acceptors (NFAs) hold the key to unlocking the next generation of solar energy conversion technologies. In contrast to fullerene derivatives, the optical absorption of NFAs extends over the visible and near-infrared spectral range, thereby improving energy harvesting by successfully complementing the absorption features of typical donor polymers.4 Their chemical tunability allows for the optimization of ionization potentials and electron affinities to achieve lower losses in open-circuit voltage. Although these materials have often been used successfully in high-efficiency bulk heterojunction architectures,5,6 the advent of novel NFAs such as Y6, IDIC, and ITIC, with longer exciton diffusion lengths (20–50 nm)7 and extended crystalline domains, is promoting a renaissance in the use of planar heterojunctions.8,9 An advantage of the latter is the inherently reduced donor/acceptor interfacial area, which inhibits charge recombination and increases thermodynamic stability. In some cases, the efficiencies of these planar junctions are on the same order as, or even greater than, their bulk heterojunction counterparts.8,10,11 The well-controlled microstructure, associated with reduced energetic disorder and morphological uncertainty of the constituent materials, paves the way for the design of more efficient OPV materials and architectures.A critical factor in this pursuit is the development and application of computational models and protocols that can accurately simulate the opto-electronic properties and transport behaviour of NFAs in their solid-state phase. Some of these models have been instrumental in identifying materials with optimal morphological patterns, as well as absorption and emission characteristics, which directly correlate with minimal energy losses and enhanced device efficiency.12–14 In extended systems such as NFA aggregates, or polymers, the excited states can be shared between molecular sites, depending on the strength of the excitonic interactions between these sites.15–18 Consequently, the spectral features of the films usually differ from those of the isolated molecule,16–19 and reliable predictions require going beyond single-molecule computations/models. Effective protocols based on Frenkel-exciton Hamiltonian have been developed in this regard and successfully applied to the study of steady-state optical properties of aggregates and crystals of conjugated organic molecules,20–23 supramolecular systems,24 extended polymers25,26 and copolymers.27
Immediately after photo-absorption, delocalized excitons in these materials travel towards the donor:acceptor interface. Understanding the mechanism by which this process occurs is crucial for designing strategies to enhance it. Recent theoretical and numerical advances in the field of exciton28–30 and charge31–35 transport have provided strong evidence that the diffusion of the (exciton or charge) carrier wavefunction in molecular materials is strongly correlated with the extent of its delocalization. This necessitates the use of efficient approaches that can be applied to system sizes large enough to fully accommodate delocalized excitons. Moreover, the method employed to study transport processes in these soft, van der Waals bonded, materials needs to account for thermal vibrations and their coupling to the molecular excitations and the electronic interactions between molecules (termed diagonal and off-diagonal exciton–phonon coupling). In addition, the so-called “back reaction”, namely, the effect of the electronic motion on the nuclear degrees of freedom should ideally be taken into consideration as well. In a previous work, we have developed the Frenkel Exciton Surface Hopping (FE-SH),28 a computationally efficient atomistic non-adiabatic molecular dynamics method that goes beyond standard exciton hopping theories based on Fermi's Golden Rule,36 whose assumptions might be violated in NFAs featuring large diffusion constants.29,37 FE-SH uses the same electronic Frenkel-exciton Hamiltonian and delivers an optimal balance between predictive power and computational feasibility, hence addressing the desirable criteria outlined above.
In this work, by employing the aforementioned state-of-the-art methodologies, we investigate the opto-electronic properties in solution and solid phase as well as transport properties in the solid-state of a reference non-fullerene acceptor molecule, specifically m-4TICO, as depicted in Fig. 1. The tightly bound packing motif characterizing m-4TICO is expected to induce significant excitonic effects, thereby visibly modulating the spectral features when transitioning from solution to solid state. This is here demonstrated through a detailed computational characterization of the experimental steady-state absorption and photoluminescence spectra of m-4TICO, both in solution and in solid form. Utilizing electronic structure calculations combined with a Frenkel-exciton Hamiltonian to describe the excited states of a nano-scale aggregate, we show that the optical absorption of the m-4TICO crystal is significantly perturbed by the formation of reasonably strong J-like interactions. These interactions are responsible for a red shift of the solid-state spectra compared to the solution phase, as well as for a reduction of the 0–1 vibronic band. Furthermore, we examine the spatial extension of the electronic states in this system, which we found to be rather modest at the bottom of the excitonic band, with averaged delocalization lengths of approximately four molecules. The local confinement is induced by disorder in molecular excitation energies, which is caused by low-frequency vibrations characteristic of the m-4TICO molecule. We discuss the importance of accurately incorporating this source of disorder to correctly replicate the measured Stokes shift between absorption and photoluminescence in the solid-state and discuss a possible strategy to suppress this source of localization.
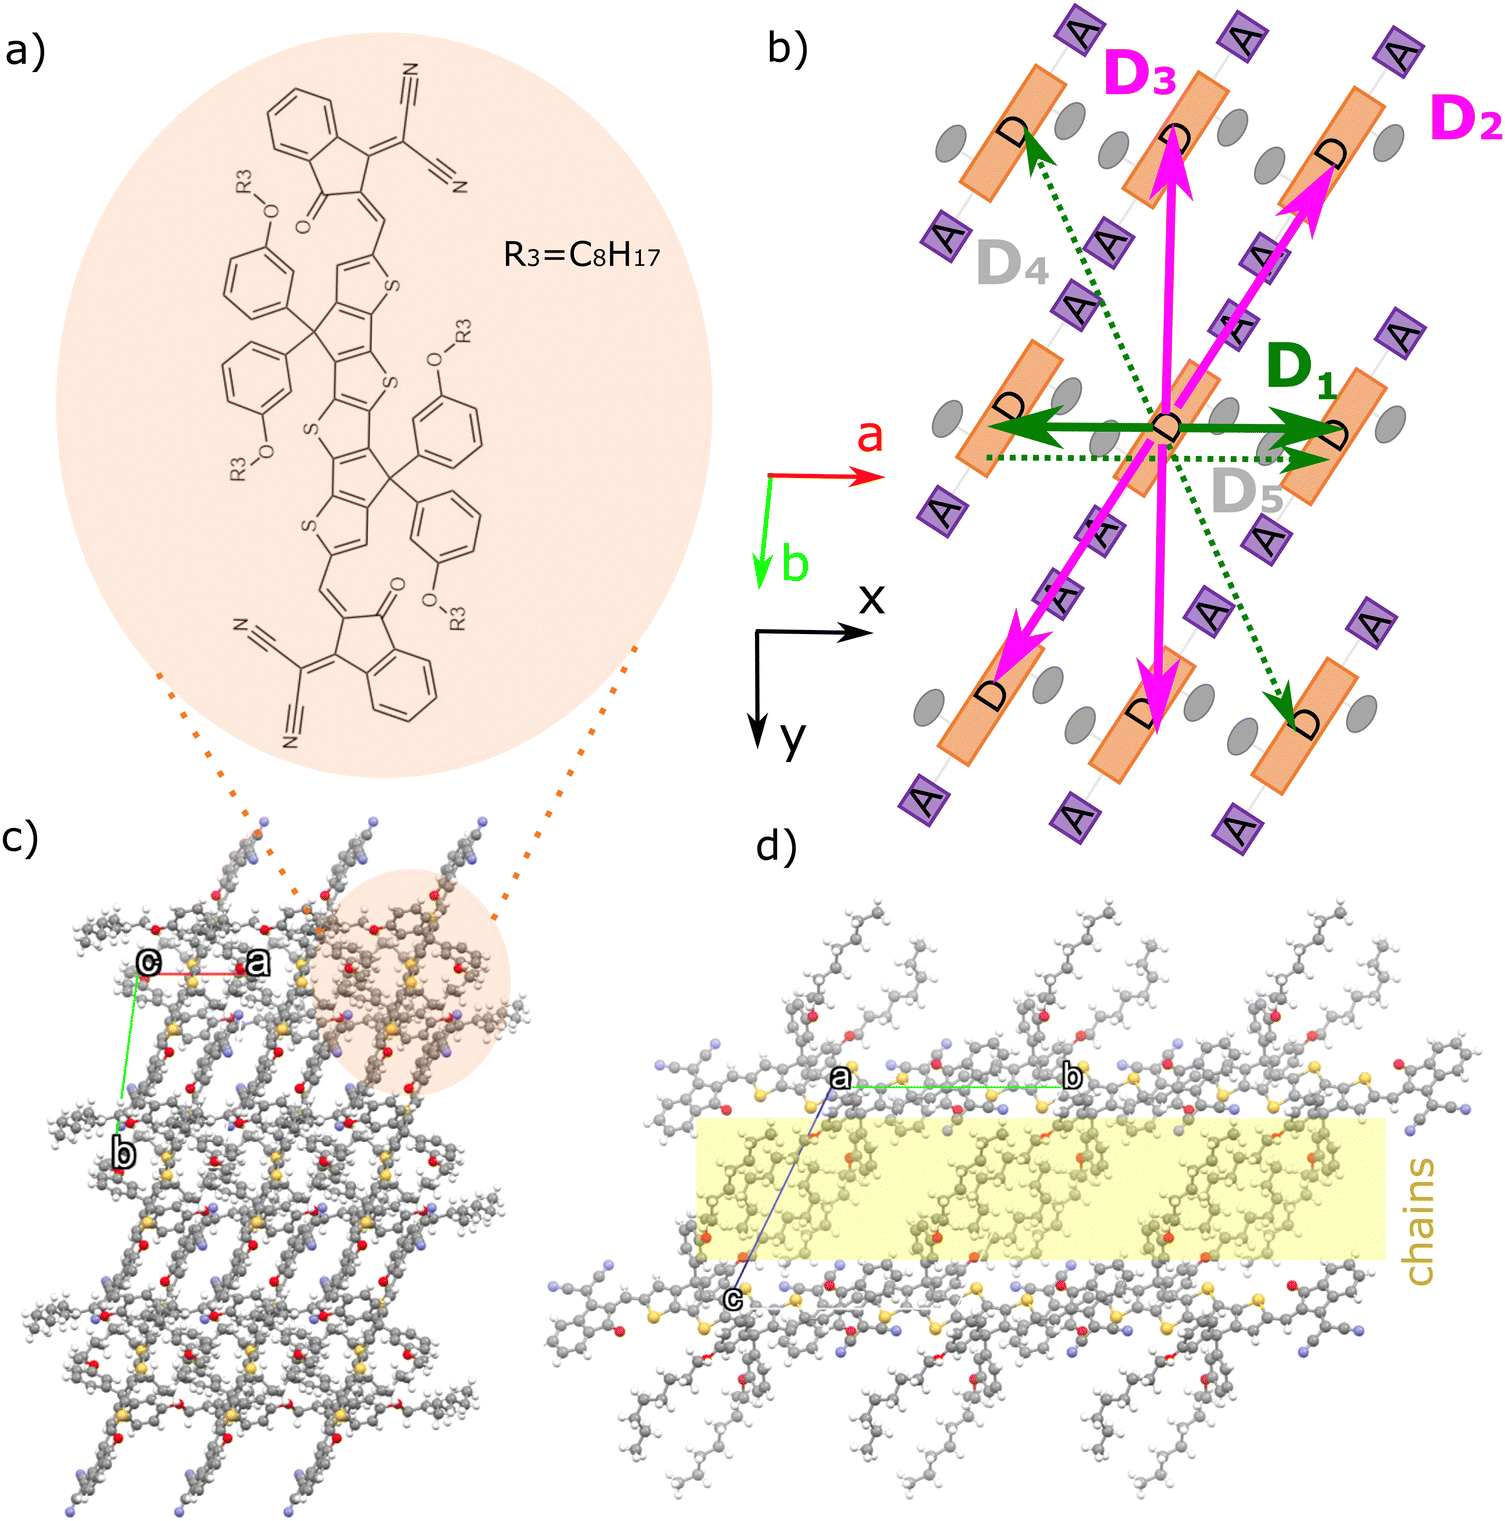 | ||
| Fig. 1 (a) Chemical structure of m-4TICO. (b) Schematic representation of the brickwork crystal arrangement of m-4TICO molecule. Coloured solid arrows represent the strongest nearest neighbour excitonic interactions in the a–b plane. Green is used for H-like interactions, while magenta is used for J-like interactions (see the text for an explanation and Table 1 for all pairs). This colour code is maintained throughout the manuscript and in the other figures. Weaker interactions are represented with dashed arrows and shaded grey labels. Panels (c) and (d) represent the crystal structure arrangement of m-4TICO seen from the top and lateral views of the brickwork layers, respectively. The unit cell axes a and b are shown in red and lime, respectively (axis c is eclipsed by the other two). The cell axis forming the a–b plane are oriented in the x–y Cartesian reference frame as indicated. The insulating layer formed by alkyl-side chains is highlighted in yellow. | ||
By utilizing non-adiabatic surface-hopping (SH) molecular dynamics,28 we show that the excitonic wavefunction moves through a manifold of modestly localized excited states at the low energy edge of the exciton band, percolating more favourably in the direction where there is stronger delocalization of thermally accessible excitonic states. We demonstrate that increased delocalization of the excitonic states at the bottom of the exciton band, which fosters a more pronounced quantum transient delocalization28 of the excitonic wavefunction, could be in principle achieved in NFAs by engineering the sign of the excitonic couplings within the conducting plane. Consequently, we establish and discuss some design principles for enhancing exciton transport capabilities.
Results and discussion
Molecular and crystal structure
The NFA we investigate in this work, m-4TICO, is composed of a fused-ring thiophene-thieno[3,2-b]thiophene–thiophene (4T) as the central donor unit and electron-deficient 3-(dicyanomethylidene)indan-1-one (IC) groups as flexible terminal acceptor units. With respect to common derivatives of the same family (e.g. ITIC and IDIC), m-4TICO bears alkoxy-phenyl sidechains that allow for some degrees of structural flexibility and a liquid crystal phase behaviour. This apparently leads to a reduction in bimolecular recombination and an improved power conversion efficiency when this system is employed in solar cell blends with a donor phase.38 An important feature characterizing m-4TICO and similar NFAs is that, when blended with donor polymers in bulk heterojunctions, the single crystal packing motif of the pure acceptor phase tends to be preserved.39 As a result, it is justified to apply our computational analysis to the m-4TICO crystal structure, which provides a reasonable representation of the real thin-film morphology.40The molecular packing and crystal structure arrangement of m-4TICO molecules in the solid state is represented in Fig. 1. The thin film morphology was resolved experimentally by means of an extensive characterization using single-crystal X-ray diffraction (XRD), powder XRD, and Grazing Incidence Wide Angle X-ray Scattering (GIWAXS).40 Interestingly, the acceptor–donor–acceptor (A–D–A) characteristic chemical form of m-4TICO molecules allows for the formation of well interconnected brickwork two-dimensional (2D) π–π stacking-like structure. The 2D plane extends along a and b crystallographic directions at almost 91 degrees with respect to one another (see Table S4, ESI†). Along the c crystallographic direction instead, the alkoxy-phenyl sidechains interdigitate to form a somewhat insulating layer perpendicular to the main conductive plane.
Molecular excitations
We start our analysis by investigating the absorption spectrum of m-4TICO in a dilute solution of chloroform (CF). We report the measured spectrum in Fig. 2(a). We observe an intense absorption peak corresponding to the transition energy, , from the ground (S0) to the first excited state (S1) at 1.66 eV and a second peak around ∼1.84 eV, likely associated with a vibronic shoulder.
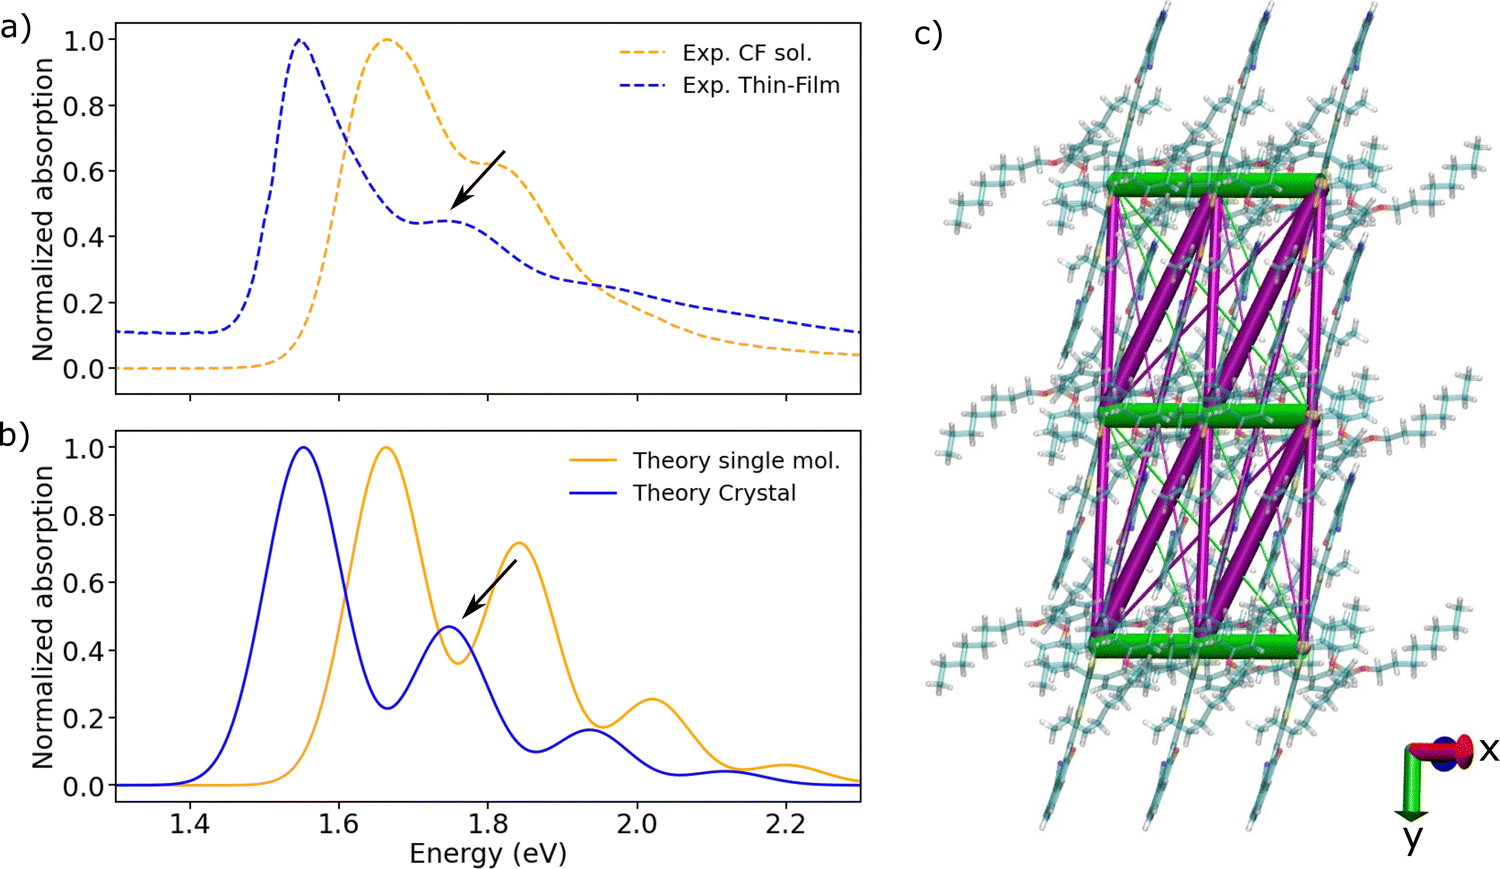 | ||
| Fig. 2 (a) Experimental absorption spectra of m-4TICO in CF solution (dashed orange line) and solid thin-film phase (dashed blue line), respectively. (b) Computed normalized absorption spectra of m-4TICO single molecule (solid orange line) and solid-state crystal phase (solid blue line). Electronic energies, gradients, and Hessians were computed with DFT and TDDFT, whereas vibronic progressions were obtained as described in Methods. The vertical excitation energy of S0 → S1 transition was shifted by 0.6 eV to match the experimental value (see text for details). The spectrum of m-4TICO crystal is obtained using the Frenkel excitonic Hamiltonian (eqn (1)) parameterized using ab initio DFT data as described in the text. A Gaussian spectral broadening, σhom. = 51 meV, was added to all computed spectra as explained in the text. The red shift of the crystal with respect to the solution (of about 0.1 eV) is due to both excitonic effects and a solution-to-crystal shift as discussed in the main text. (c) Representation of the excitonic couplings network for a small representative m-4TICO supercell (note that larger supercells are used for the computation of converged spectra as described in the text). H-like (J-like) interactions are shown as green (magenta) segments, following the colour code given in Fig. 1. Note that the sign of the couplings is consistently given to all the molecular pairs. Only interactions stronger than 2 meV are shown for clarity purposes and the thickness of the coloured lines is proportional to the excitonic coupling strength. | ||
To understand the origin of both peaks, we performed electronic structure time-dependent density functional theory (TDDFT) calculations on the optimized single molecule structure at the CAM-B3LYP/6-31G(d,p) level. Unless otherwise stated, this is the level of theory used for all electronic structure calculations. The robustness of the results concerning other functionals is discussed in the ESI.† As a small note, TDDFT vertical energies at various level of theory are overestimated compared to the experimental value (see Table S1, ESI†). We are, however, interested in understanding optical features of steady-state spectra, spectral changes upon aggregation and dynamics in the lower energy exciton band formed by S1 states. All these characteristics depend on the nature of the S1 state and are rather insensitive to its actual energy, as long as its character and possible mixing to other excited states is described correctly. This is the case for the investigated molecule. In fact, m-4TICO presents a bright S0–S1 transition with a strong HOMO–LUMO-like character (see natural transition orbitals in Fig. S1, ESI†) followed by a second dark S0–S2 excitation ∼0.4–0.6 eV higher in energy (see Table S1, ESI†) that does not strongly couple with the first excitation.
The vibronic nature of the second peak observed in the solution spectrum of m-4TICO is confirmed by calculating the coupling of the electronic excitation with the molecular vibrational degrees of freedom. This was conducted using a (quantum) displaced harmonic oscillator model (see schematic representation in Fig. S2, ESI†), as implemented in the FCclasses3.0 software and detailed in Section S2 (ESI†).41 To identify the vibrational modes coupled with the excitation and the corresponding exciton relaxation energy (λrel, in eqn (S3), ESI†), we projected the vectors representing geometric Cartesian displacements between the ground and excited states onto the intramolecular normal modes. As delineated in Table S2 (ESI†) and extensively discussed in Section S2 (ESI†), a very good agreement was observed between normal mode analysis performed with both vertical and adiabatic approaches,42 suggesting that the A–D–A aromatic scaffold of m-4TICO exhibits a relatively harmonic potential, notwithstanding the presence of somewhat flexible torsional mode at low frequency (see Fig. S3, ESI†). We estimated an exciton relaxation energy λrel of about ∼167 meV in line with the relaxation energy found for similar NFAs belonging to the ITIC family.43 This analysis reveals the presence of essentially two sets of modes contributing to λrel. Two high-frequency modes in the region of 1436 cm−1 and 1505 cm−1, which are the ubiquitous stretching/aromatic ring breathing modes and have large weights on the backbone donor unit of the molecule and several low-frequency modes essentially related to torsional degrees of freedom between the central donor and the acceptor side groups. As commonly done in the literature,17,18,23,44 the high-frequency modes with large exciton—phonon coupling can be conveniently coalesced in a single effective vibrational mode with a frequency, ℏωeff = 1450 cm−1 and an effective Huang Rhys factor (Seff = λrelhf/ℏωeff) of 0.65. Details can be found in Section S2 (ESI†). One the other hand, by using linear response theory, the low-frequency modes can be used to estimate the homogenous spectral broadening to apply to the single molecule spectrum via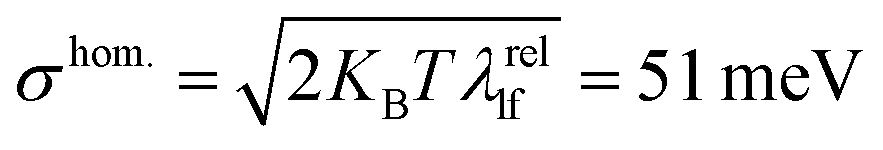 , where λrellf is the relaxation energy associated with the low frequency modes and KB is the Boltzmann constant. This assumption is also supported by explicit molecular dynamics calculations that will be presented in the next section.
By considering the calculated ℏωeff and Seff and using eqn (S4) (ESI†) to evaluate the absorption spectrum, we can reproduce the vibronic progression of the main S0 → S1 transition (see Fig. 2(b) orange line). We observe a good agreement between the spectral shape of the simulated and experimental spectra, thereby confirming the vibronic nature of the second peak visible in the experimental spectrum of m-4TICO single molecule in solution.
Aggregation effects
Turning to the analysis of the solid thin-film phase spectrum in Fig. 2(a), we observe a significant shift of about 0.1 eV in the absorption peak towards the red edge of the electromagnetic spectrum upon aggregation. The red shift is accompanied by a diminished intensity of the second vibronic band of the solid-state spectrum compared to that in solution. For idealized model systems, Spano20 has shown that both these features are generally indicative of excitonic effects stemming from the formation of sizable J-like excitonic interactions. These interactions lead to the splitting of localized Frenkel exciton (FE) energy levels and the emergence of excited states with enhanced oscillator strengths at the lower end of the excitonic band. The width of the energy band depends on the strength of the excitonic interactions between the molecules. In the case of ideal J-aggregates, as represented by a one-dimensional (1D) model chain, the strength of these interactions correlates directly with the extent of the red shift in the spectrum and inversely with the height of the 0–1 vibronic shoulder.20 In realistic 2D and 3D morphologies with a mixture of H-like and J-like interactions, the excitonic effect outcome is more difficult to predict.To investigate whether J-like aggregation behaviour characterizes the solid thin-film phase of m-4TICO and to understand the origin of both the red shift and the vibronic band intensity suppression, we adopted a Frenkel-exciton type model to represent the excited states of an extended nano-scale size supercell of m-4TICO (vide infra). The electronic Hamiltonian in eqn (1) is parametrized with electronic structure calculations as described in Methods. In brief, such a Hamiltonian is represented on a diabatic basis of singlet FE states corresponding to localized excitations on the various molecular sites. It includes the electronic interactions between FE states by means of the long-range excitonic couplings (Vkl) between tightly bound excitons sitting either on molecules k or l. The strength and sign of these interactions determine the delocalization of the excitonic eigenstates as we discuss in detail in Methods and in Section S6 (ESI†). The coupling of FE states with the nuclear degrees of freedom is explicitly included in the model using the same single effective vibrational quantum mode coupled to the electronic excitation (eqn (6)) characterizing the single molecule (as explained in Section S2, ESI†). Once constructed, the Hamiltonian is diagonalized to determine the excitonic states needed to generate the optical response of the extended systems (via eqn (S4) and (S5), ESI†). We refer to the Methods section for a description of the model and related parameters.
We note in passing that, Frenkel-like Hamiltonians coupled to nuclear vibrations similar to the one utilized in this study have been effectively applied in past research.20–22 Nevertheless, we introduce in our present computational protocol several novelties. (i) We move away from ideal lattices of reduced dimensionality with only nearest neighbour interactions,20 in favour of realistic three-dimensional morphology probed by experimental means (see Fig. 1). (ii) We encompass the entire spectrum of long-range excitonic interactions, extending beyond just nearest neighbour interactions commonly adopted to build idealised model systems. All the combinations of interacting molecules are included here with efficient methods to calculate excitonic couplings that allow to consider the atomistic details of the molecules. (iii) We account for explicit dynamical effects on both excitation energies and excitonic interactions by combining electronic structure and molecular dynamics of the system. (iv) As it will be shown in the last section, we couple the classical version of the Frenkel-exciton Hamiltonian with all-atom non-adiabatic SH molecular dynamics to follow the time dependent evolution of the coupled exciton–nuclear wavefunction.
We start our theoretical analysis focussing on the excitonic effects characterizing the m-4TICO crystalline structure by computing the off-diagonal elements of the Hamiltonian, Vkl, among molecular pairs k and l extracted from a 3D supercell constructed by replicating the unit cell of the molecule.40 All unique dimers within a maximum centre of mass (COM) cut-off distance of 20 Å along a, b and c crystallographic directions are reported in Table 1 and visually shown in Fig. S4 (ESI†). As discussed in Methods, Vkl typically takes the form of a sum of a long-range Coulombic part and a short-range part, accounting for exchange, overlap, and electronic polarization contributions, VTotkl = VCoul.kl + VShortkl.45VTotkl is obtained by diabatizing the electronic excitations of molecular dimers.46–50 In this work, we adopted the multi-state fragment excitation energy difference-fragment charge difference method (MS-FED-FCD) used in combination with TDDFT.48–50 This method accounts for all short- and long-range effects and gives us an important benchmark value for the excitonic interactions (see Table 1). Additionally, it allows to compute couplings between FE and intermolecular charge transfer (CT) states that might also mix. The coupling with CT states was recently found to be important in Y6 thin-film.23,51 However in m-4TICO, our calculations rule out the possible presence of low-lying CT states that can mix with FE states, in agreement with has been found for the morphologically similar NFA of the same family, i.e., ITIC.51 We refer to Table S5 and Section S6 (ESI†) for a discussion in this regard.
| Dimer | Distance | V MS-FCD-FED kl | V Coul. kl | V TrESP kl | V PDA kl |
|---|---|---|---|---|---|
| a The sign of the coupling is given consistently to all pairs according to eqn (5) in which H- and J-like aggregates bear a positive and negative sign, respectively. | |||||
| D1 | 8.65 | 59.9 | 59.7 | 59.6 | 235.8 |
| D2 | 18.74 | −49.8 | −47.3 | −47.2 | −55.7 |
| D3 | 16.49 | −29.6 | −26.8 | −26.8 | −79.1 |
| D4 | 18.50 | 5.4 | 5.0 | 5.0 | 19.0 |
| D5 | 17.31 | 17.7 | 17.7 | 17.6 | 29.5 |
| D6 | 18.04 | 16.3 | 16.4 | 16.4 | 22.4 |
| D7 | 18.05 | 15.0 | 14.0 | 14.0 | 11.9 |
| D8 | 18.56 | 13.6 | 13.5 | 13.5 | 15.5 |
| D9 | 18.68 | 12.2 | 12.4 | 12.4 | 4.6 |
The Coulomb part, VCoul.kl, of the excitonic coupling can be evaluated starting from the interaction of the transition densities of the isolated fragments followed by a calculation of the integral between them (eqn (3)). It is clear from the comparison in Table 1 that VTotkl ≈ VCoul.kl, and therefore we can conclude that the short-range coupling VShortkl is of little importance even for these closely packed m-4TICO molecules (some of which bear a minimum atomic distance of about 2.5 Å) and can be neglected to a good approximation. To speed up the calculation of the Coulomb interaction and efficiently evaluate all possible long-range interactions in large supercells, we tried the commonly used point dipole approximation (PDA) to VCoul.kl (eqn (S8), ESI†). This approach yields much overestimated coupling values since the full transition density cannot be simply approximated using point dipole moments. Therefore, to reconstruct the molecular transition densities we use much more reliable transition electrostatic potential (TrESP) charges calculated as explained in Methods (eqn (4)). This approach not only yields accurate excitonic interactions calculated using a simple Coulomb sum, but more importantly it allows us to keep the sign of the interactions consistent among all different pairs (see discussion in Methods).
Having established the method of choice for the coupling calculations, in Table 1 we note that the most significant interactions exceeding 20 meV occur within the a–b plane of m-4TICO. Specifically, molecular pairs D2 and D3 have strong J-like negative interactions. However, the pair with the strongest coupling (D1) exhibits a positive value and is oriented along a crystallographic direction. We visually show the coupling network, amount, and strength of the excitonic interactions in Fig. 2(c). Here, we clearly see that a numerous number of interactions have J-like character, suggesting that the red-shift observed in Fig. 2(b) might be a consequence of dominating J-aggregation effects. To conclusively ascertain this, we constructed the Hamiltonian in eqn (2) for a 20 × 20 × 1 supercell (400 molecules in total) using the computed interactions in vacuo screened with an isotropic dielectric constant (ε = 2) – a value consistent with other non-fullerene acceptors (NFAs).3,23 The appropriateness of the screening constant was verified by calculating the dielectric tensor via a microelectrostatic method, as detailed in ref. 52. We note in passing, that a thorough benchmarking considering different system sizes, screening dielectric constants, particle basis set, and their impacts on spectral features is elaborated in Section S7 and represented in Fig. S7 (ESI†). Furthermore, the linear vibronic coupling between the exciton and the effective intramolecular vibrational mode was explicitly incorporated into the Hamiltonian construction using eqn (6). Upon completion, the exciton–nuclear Hamiltonian (eqn (1)) was diagonalized by employing a one-particle basis set.18,20 As discussed in the Methods this reduced basis set proves effective when the excitonic interactions are notably smaller than the linear exciton–phonon coupling, which, in turn, is proportional to the exciton relaxation energy of the high frequency modes (λrelhf).
As demonstrated in Fig. 2(b), the diagonalization of the Frenkel exciton Hamiltonian produces a spectrum for the solid-state form of m-4TICO that aligns exceptionally well with experimental observations, particularly in terms of the relative heights of the peaks and their positions. We observe that the total red shift is about 103 meV. It comprises two main contributions: one due to excitonic effects, which can be attributed to the interplay and sign of the different excitonic couplings (J-like vs. H-like contributions);18,20 and the other one originating from environmental and polarization effects, which has been referred to as solution-to-crystal shift (Δ0–0).23,52,53
After diagonalizing the Hamiltonian in eqn (1) and obtaining the resulting excitonic eigenstates, our computation allows us to estimate the first contribution, namely the shift due to excitonic effects attributed solely to excitonic couplings, at approximately 31 meV. As carefully explained by Spano, this effect arises from a redistribution of the oscillator strength toward higher (or lower) energy in H(J)-aggregates.18,20 In m-4TICO, this analysis leads us to conclude that J-like effects predominate, despite the presence of competing and equally significant H-like interactions. This finding has important implications for the diffusion of excitons in m-4TICO, as further discussed below.
The second contribution is of environmental origin, and it essentially acts on the excitation energy of the molecules. This effect, which constitutes a rigid shift of the spectrum but does not alter the actual dynamics, is not explicitly evaluated in this work. Therefore, in order to match the experimental gap, following the approach of others,54 we added the remaining solution-to-crystal environmental red-shift (Δ0–0 = −72 meV) to our spectra. It is also noteworthy that a solution-to-crystal shift of a similar magnitude has been identified in other quadrupolar organic semiconductors and non-fullerene acceptors (NFAs).23 We also point out that the solution-to-crystal shift could be in principle evaluated using efficient embedding schemes as recently developed in the literature.52,53,55,56
Disorder effects
Until now, our analysis has moved under the assumption that m-4TICO molecules are fixed within their lattice positions. The electronic Frenkel Hamiltonian in eqn (2) has not accounted for any other source of disorder. All excitation energies were assumed identical for all molecules. To introduce the spectral broadening visible in the experiment, excitation energies were assumed to fluctuate all in the same way mimicking a situation of long-range homogeneous broadening due to perfectly correlated site fluctuations (see Fig. 3(b)).17,18 This homogeneous broadening (σhom.) is ascribed to low-frequency intramolecular vibrational modes of the molecule both in solution and solid-state. The excitonic couplings were considered constant as well, mirroring their values in the crystal structure (see Table 1). In Fig. 3(a), we show that although such a model can nicely capture the experimental features of the steady-state absorption spectrum, the experimental Stokes shift (of about 45 meV) between absorption and photoluminescence (PL) is not reproduced. The simulated absorption and emission overlap and the Stokes shift is essentially null when this kind of correlated homogeneous disorder is introduced. The reason is that the emissive state, which is fully delocalized over the system in the absence of spatially uncorrelated inhomogeneous disorder, has the same character as that responsible for the absorption.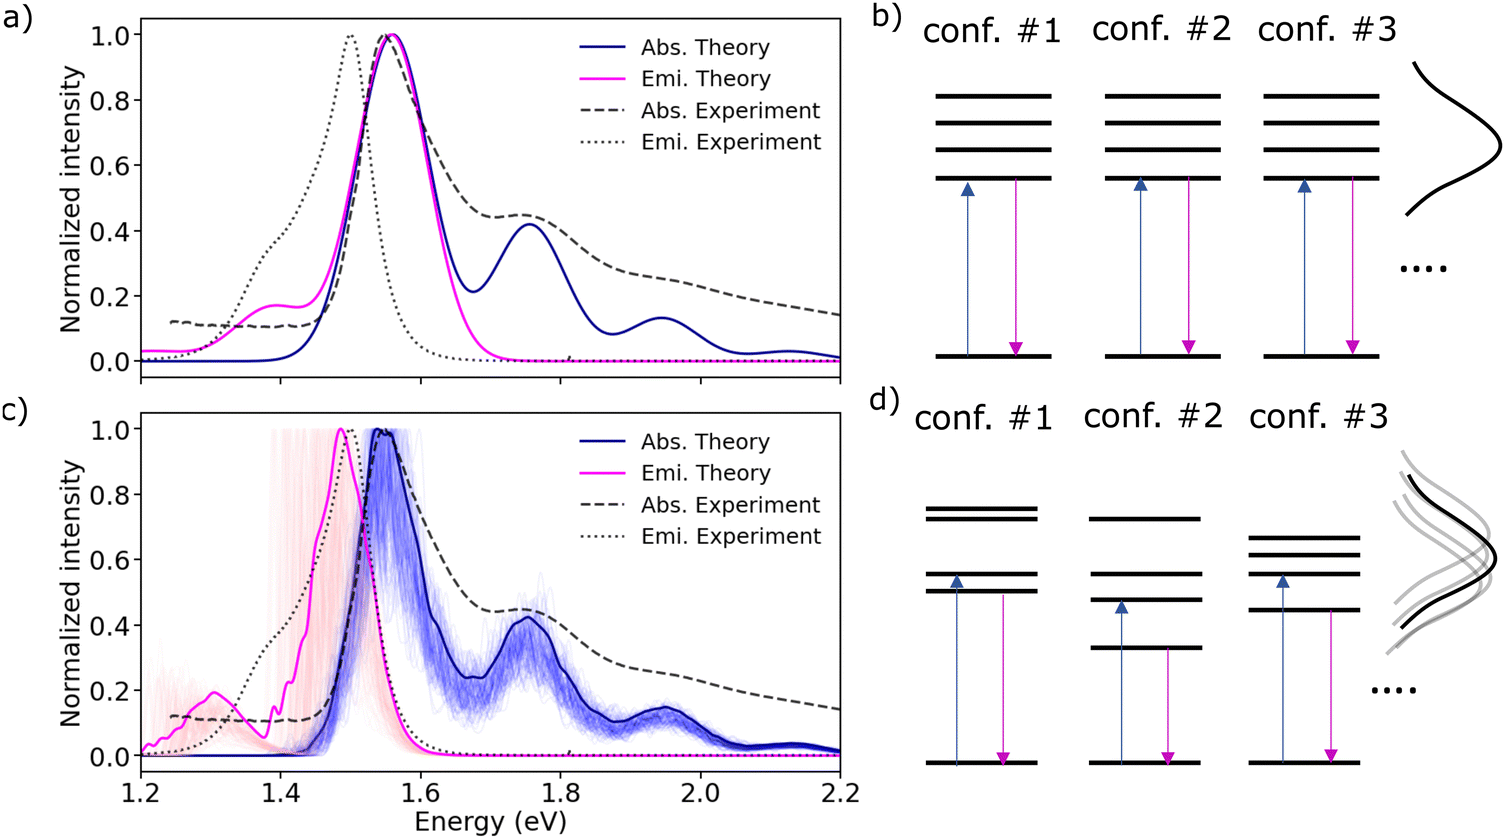 | ||
| Fig. 3 (a) Predicted absorption (solid blue line) and emission (solid magenta line) spectra computed applying a homogeneous broadening σhom. = 51 meV to both absorption and emission. (b) Schematic representation of the excitation energies in the absence of energetic disorder. (c) Computed absorption (solid blue line) and emission (solid magenta line) average spectra over 100 realizations of diagonal and off-diagonal disorder as explained in the text. The diagonal disorder was computed by sampling excitation energies from a Gaussian distribution with σinhom. = 51 meV. Individual contributions of the different realizations are shown with shaded lines by applying a small convolution of 5 meV to the sticks. (d) Schematic representation of the excitation energies in the presence of inhomogeneous short-range energetic disorder. All the computed spectra in emission and absorption are shifted as discussed in the caption of Fig. 2 and the main text. Experimental absorption and emission spectra of m-4TICO in the solid thin-film phase are represented using dashed and dotted black lines, respectively. | ||
It is widely recognized that disorder can significantly affect the photophysical and delocalization properties of the excitonic states of molecular aggregates.28,44 We, therefore, explored the influence of thermal and dynamic fluctuations on the optical absorption and emission characteristics of the solid-state m-4TICO. To this end, we started by parametrizing an accurate quantum mechanically derived force field (QMD-FF) to describe the dynamics and related fluctuations of m-4TICO molecules in the solid-state. The specific parametrization was carried out using the Joyce software57,58 that allows an accurate parametrization of the intramolecular parameters in the ground and excited (S1) state of the molecule by exploiting a fitting procedure of QM Hessians obtained at DFT and TDDFT levels, respectively. Details are given in the Methods. The m-4TICO scaffold structure is characterized by an additional degree of flexibility induced by the rotation around the alternating σ bonds (dihedral angles δ shown in Fig. S10, ESI†) and significant amplitude distortions from the equilibrium positions take place. Therefore, for each of the dihedrals δ, a relaxed internal energy scan was performed, by optimising all degrees of freedom except the scanned torsional angle at the same level of theory. We report in the Methods and ESI† (see Sections S9 and S10) an extensive description of the parameterisation procedure and its validation. The completion of the QMD-FF molecular description for classical molecular dynamics (MD) simulations involved the integration of the Joyce parameterized intramolecular term with an intermolecular contribution (see eqn (S15), ESI†), where Lennard-Jones parameters were transferred from suitable general amber force field (GAFF) atom types, whereas point charges were consistently derived from the DFT electronic density, in accordance with the restrained electrostatic potential (RESP) procedure.59
By employing such a QMD-FF derived for the ground state, we conducted MD simulations of a supercell at room temperature over a duration of 500 ps. Following the equilibration phase, we sampled the distribution of excitation energies ( ) by extracting snapshots of a single m-4TICO molecule every 5 fs along a 10 ps long trajectory and performing single point TDDFT calculations to estimate the excitation energy of each different conformation. This process revealed a notably wide distribution of energies, characterized by a total standard deviation of σE = 103 meV, indicating significant conformational disorder. We show in Fig. 4(a) that a very similar energy distribution (with σE = 111 meV) could be derived without conducting any explicit electronic structure calculations, but rather using directly the QMD-FF. This was done by simply calculating the vertical excitation energy difference between the excited- and ground-state FF energies as predicted by the QMD-FF with appropriate parameters for the two potential energy surfaces. This not only serves as further validation of the force fields developed in this study but also allows to carry out explicit non-adiabatic molecular dynamics simulations of the excitons using the FE-SH method developed in ref. 28 and discussed further below.
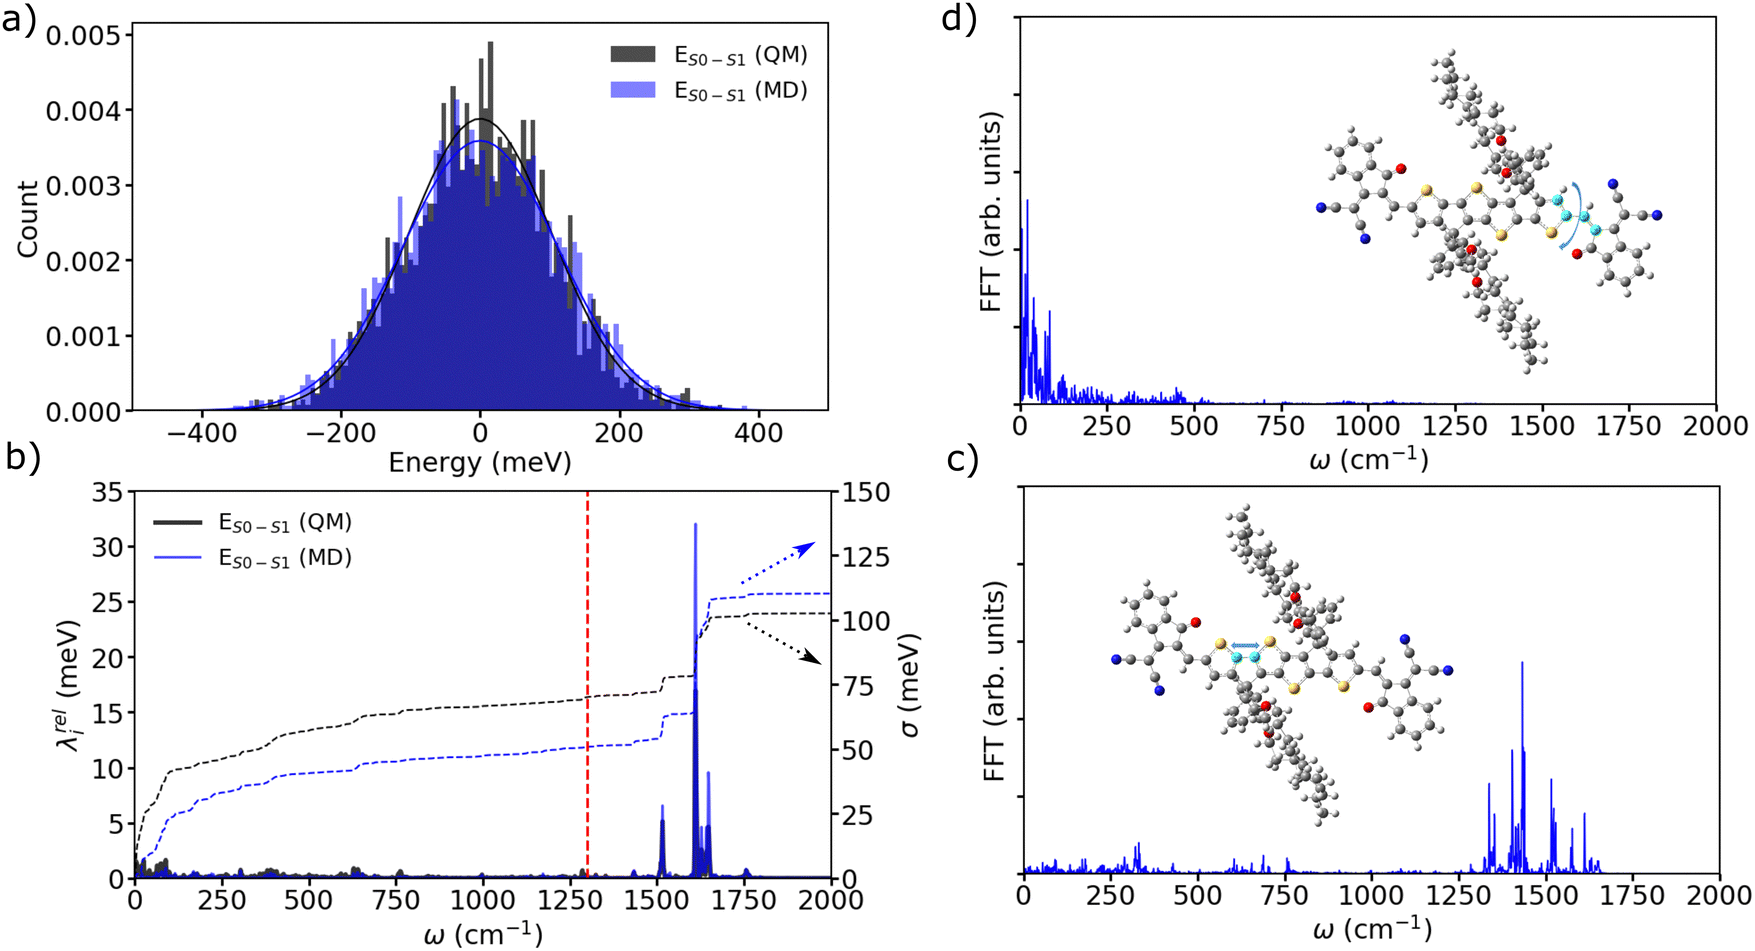 | ||
| Fig. 4 (a) Excitation energy distributions of a m-4TICO molecule extracted from a MD run as explained in the text. Excitation energies of various snapshots were evaluated either using explicit TDDFT electronic structure calculations (black line) or using single point calculations performed with specifically parametrized QMD-FF for the ground and excited state of the molecule (blue line) as explained in the text. (b) Relaxation energy (λredi) obtained from the cosine transform of the excitation energies (eqn (S13), ESI†) computed at QM and MD levels as in (a). The red line at 1300 cm−1 represents the demarcation used to distinguish low-frequency from high-frequency vibrations as discussed in the text. On the second twin axis we report the cumulative running integral (eqn (S12), ESI†) of the spectral exciton–phonon coupling density. Panels (c) and (d) represent the cosine transforms (eqn (S10) ESI†) of the specific bond and torsional angle represented in the inserts, respectively. | ||
Through the evaluation of the autocorrelation function of excitation energies (eqn (S9), ESI†) and the subsequent cosine transformation of energy fluctuations (eqn (S12), ESI†), a distinct demarcation between stiff high-frequency and flexible low-frequency vibrations contributing to the relaxation energy (eqn (S13), ESI†) becomes evident (see Fig. 4(b)). High-frequency modes peaking above 1300 cm−1 are attributable to stretching and ring-breathing molecular vibrations (see Fig. 4(c)), whereas low-frequency modes predominantly occurring in the range of 50–300 cm−1 are associated with the slower torsional modes within the planar aromatic scaffold of the monomer (see Fig. 4(d)). Interestingly, this comprehensive analysis, which considers all potential vibrational degrees of freedom along with anharmonic effects, aligns with the initial normal mode analysis presented above (see Fig. S8, ESI†). This parallelism further supports the fact that the potential energy surface characterizing m-4TICO is sufficiently harmonic as previously noted. Moreover, this analysis confirms the distinction between fast high-frequency movements responsible for the vibronic progression visible in the spectrum and slower low-frequency motions that can be considered as a source of energetic disorder.
Another source of dynamic disorder that could be significant, especially when considering that organic semiconductors are held together by weak van der Waals forces, is the slow fluctuation of the intermolecular excitonic interactions.28 To understand to which extent this source of disorder affects the dynamics of m-4TICO NFA molecule, we evaluated excitonic couplings of all supercell pairs sampled along an MD trajectory. The excitonic coupling distributions of the many hundreds of interactions that need to be evaluated at each step can only be retried with a computationally efficient and fast method. We tackle this challenge by using the previously presented TrESP method (eqn (4)). In Fig. S6a (ESI†) we show the spectral density of the coupling fluctuations for the three largest coupling pairs. As expected, these fluctuations are essentially induced by low-frequency intermolecular modes below and around 50 cm−1. Interestingly, in Fig. S6b (ESI†), we show that the excitonic coupling distributions are comparably much narrower compared to what is commonly found for electronic transfer integrals in the case of hole and electron carrier transport materials.32,60 This is because long-range excitonic couplings are less susceptible to intermolecular displacements compared to the former (exponentially decaying) short-range interactions. We also mention at this point that the TrESP approach can approximate reasonably well the mean coupling value as well as its fluctuations when compared to the more expensive evaluation of the full transition densities, VCoul.kl, at each step (see Table S7, ESI†). This is presumably because the interdigitated supercell structure of m-4TICO makes it such that the shape of the transition density does not strongly vary along MD. We refer to Section S6 (ESI†) for a discussion.
In light of these findings, we incorporated both diagonal and off-diagonal disorder into our electronic Frenkel Hamiltonian in eqn (2). Diagonal disorder, pertaining to excitation energies, was introduced into the Hamiltonian by designating modes below 1300 cm−1 (red line in Fig. 4(b)) as slow and classical whereas the vibronic contributions of the modes above this threshold were described through a single effective quantum mode. Threating slow modes as classical enables, for each molecule in the system, the random sampling of their excitation energies from a Gaussian distribution with a standard deviation of approximately 51 meV. We refer to this as inhomogeneous disorder (σinhom.). This is because in this model, we assume that the disorder is short-range and predominantly uncorrelated (i.e. inhomogeneous), as each excitation energy oscillates independently from the others (see Fig. 3(d)).18,61 High-frequency vibrations are accounted for in the Hamiltonian using a single effective mode as previously described for the spectrum in solution. We remark that to avoid a double counting of the disorder induced by high-frequency vibrations on the spectrum, the effective quantum mode only carries the reorganization energy of these modes (Seff = λrelhf/ℏωeff). We also note that it would have been possible to decompose the spectral density into a series of discrete bath modes that could then be used directly in a system-bath Hamiltonian. This is feasible for a couple or a small cluster of chromophores, but it becomes impractical for a large super-cell of molecules like the one used in this work. Therefore, we resort to a simplified clustering of low and high frequency modes as discussed.
Conversely, off-diagonal disorder was implemented by directly calculating the TrESP couplings for each pair of molecules extracted from the MD simulation. The Hamiltonian was constructed for 100 distinct realizations of the disorder, subsequently diagonalized, and then utilized to calculate both the optical absorption and emission spectra of the crystalline phase of m-4TICO according to eqn (S4) (ESI†).
The outcomes of this analysis are presented in Fig. 3(c) and contrasted with the earlier scenario depicted in Fig. 3(a). Several critical observations emerge from this comparison. Firstly, we note that, in m-4TICO, fluctuations in the excitonic coupling, being minimal, do not markedly influence the spectral characteristics of the aggregate. Even when this source of disorder is excluded from the Hamiltonian, the spectral shape of absorption and emission do not significantly change (see Fig. S12, ESI†), and the following observations remain valid. More interestingly, the introduction of short-range inhomogeneous excitation energy disorder, as depicted in Fig. 3(d) –unlike the uniform, long-range disorder introduced in Fig. 3(b)–induces a red-shift of the photoluminescence (PL) spectrum (compare Fig. 3(a) and (c)). The computed Stokes shift accurately mirrors the expected experimental Stokes shift (see Fig. 3(c)), while the absorption spectrum remains unchanged in both scenarios (compare Fig. 3(a) and (c)). Introducing the disorder directly in the excitation energies distribution (as represented in Fig. 3(d)) produces a more realistic model compared to the one assumed previously in Fig. 3(a) and (b), where the disorder was fully entirely spatially correlated. This physical adjustment leads to a scenario where the states, particularly at the tail of the excitonic band, exhibit increased spatial localization. Unlike the absorption spectrum, the PL spectrum (eqn (S5), ESI†) is significantly influenced by disorder because emission predominantly occurs from the lowest energy exciton. This exciton can undergo substantial changes in character (e.g., localization length) through mixing with higher energy excitons of varying extents.17,18 This aspect and the importance of localization for transport properties will be elaborated upon in the subsequent discussion.
Spatial delocalization
Having established that explicit disorder in the Hamiltonian is needed to recover the correct Stokes shift, we now discuss the impact that disorder has on the localization of the states forming the excitonic band of the solid-state aggregate. This is important because it is now well-known that28,31,62 the delocalization of the thermally accessible states of the system influences the effectiveness of the diffusion of excitons in the material via the so-called transient delocalization mechanism. To quantify the extension of the absorbing states in m-4TICO, we started from the disordered Hamiltonian (including quantum vibrations) previously constructed to get the absorption spectrum in Fig. 3(c) and calculated the inverse participation ratio (IPR). The IPR is essentially related to the number of sites a given eigenstate j is delocalized over. Employing a one-particle basis set the IPR(j) of eigenstate j is given in eqn (8). In Fig. 5(b), the IPR(j) is reported as a function of the eigenenergy of the states and superimposed to the Density of States (DOS) of the exciton band.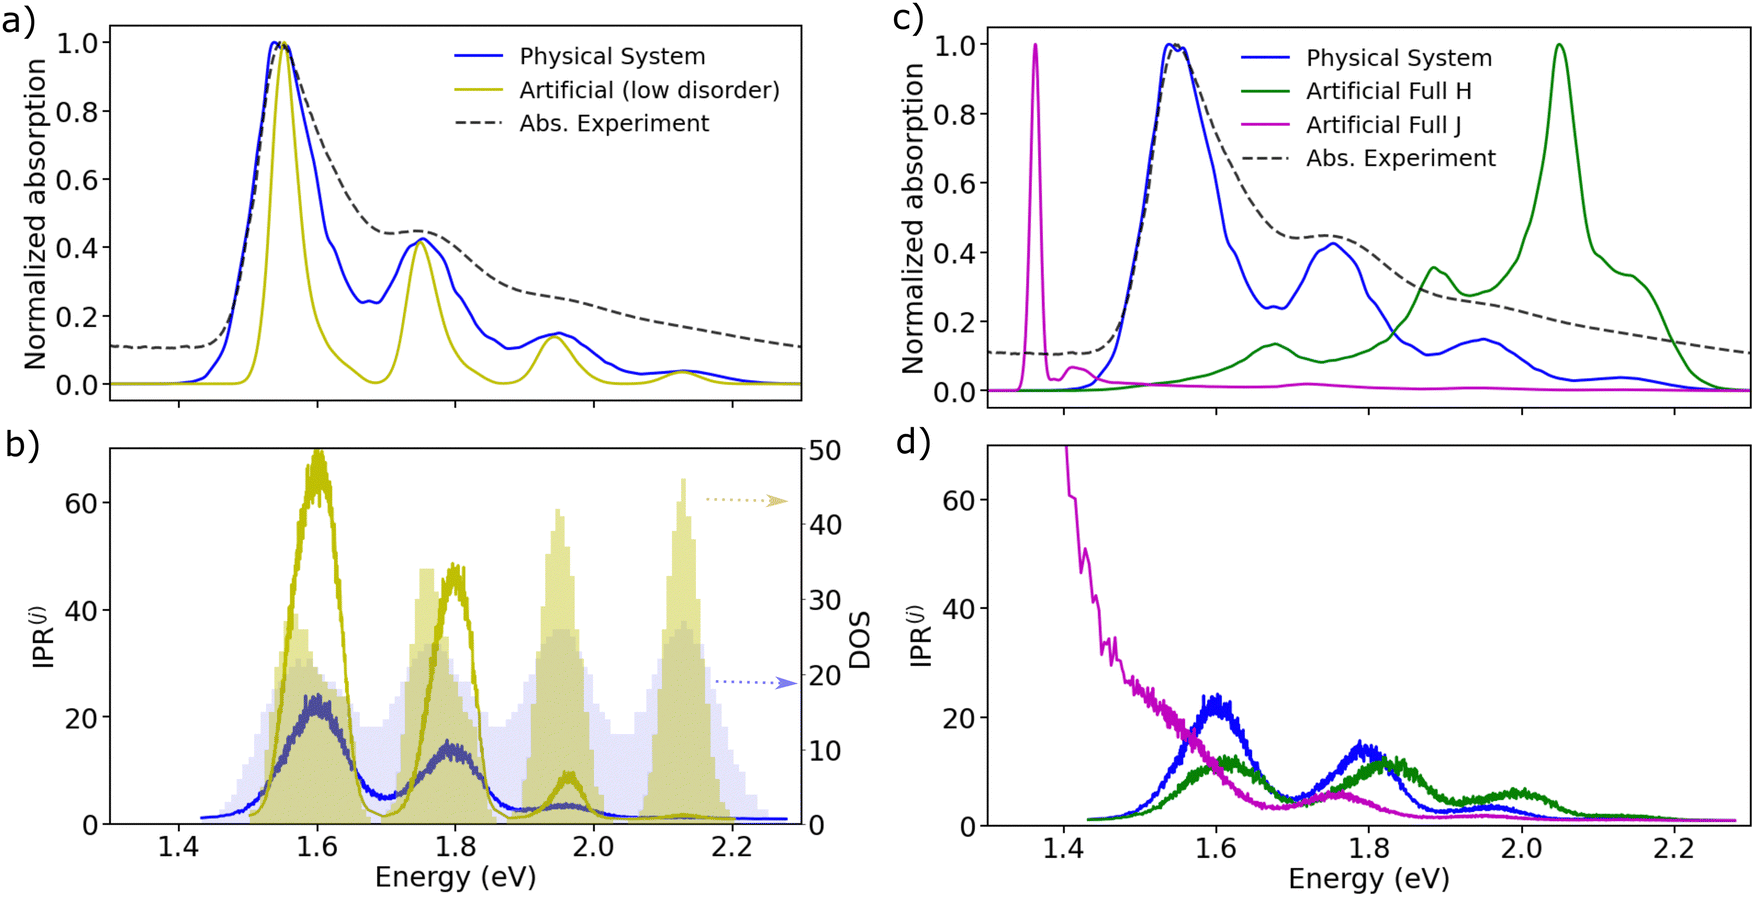 | ||
| Fig. 5 (a) Absorption spectra in the presence of diagonal and off-diagonal disorder calculated for the physical system (in blue) and an artificial system (in yellow). The latter was built considering a reduction of about factor 2 in the diagonal disorder (yielding σinhom. = 25 meV) with respect to the physical system. (b) Energy-resolved IPR of the states calculated with eqn (8) for both physical and artificial models. On the second axis, we report the DOS of the vibronic states for both models. (c) Absorption spectra (with diagonal and off-diagonal disorder) calculated for the physical system (in blue) and for two other models with different coupling networks and coupling-sign relationships. In blue we show the physical system with related coupling patterns represented in Fig. 1(b). In magenta an artificial system is built considering exclusively negative J-like signs for both short- and long-range interactions across all realizations of the disordered Hamiltonians. In green a second artificial system built considering exclusively negative H-like interactions. (d) Energy-resolved IPR of the adiabatic states calculated with eqn (8) for the aforementioned models. | ||
We first note that the DOS presents peaks corresponding to the vibronic energy levels of the exciton band, which are broadened by the presence of inhomogeneous disorder, thereby forming a continuum band of coupled electronic–vibrational states. Interestingly, the IPR(j) trend shows that the amount of delocalization of the Frenkel excitons evolves with their energy. While states at the bottom and at the top of the excitonic band are localized, those in the middle are more extended.34,63 The reasonably high Huang–Rhys factor (related to the local exciton–phonon interaction) compared to the magnitude of the excitonic coupling is one of the factors contributing to such localization. We estimated the averaged delocalization length for the thermally accessible states at the bottom of the excitonic band from the Boltzmann average IPR(j), as 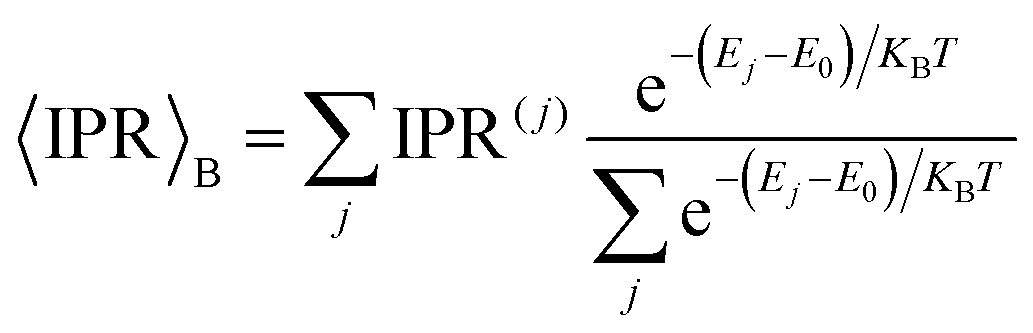 . For the physical system, we found 〈IPR〉B = 4.3. This signifies that the exciton wavefunction is on average localized by disorder over four sites, with the tail states not extending much beyond this value.
Notably, if one could make the A–D–A structure stiffer, it would be possible to reduce the amount of inhomogeneous disorder and the delocalization of the states would be increased. This is shown in Fig. 5(a) and (b) by building an artificial system with diagonal disorder reduced by about factor of 2 (namely, from 51 meV to 25 meV). In such a case, the vibronic energy level becomes energetically separated and strikingly the delocalization of the tail states increases by more than 5 times, yielding an averaged 〈IPR〉B = 24 (and a steeper absorption). Importantly, this provides the first important design rule to increase the delocalization of the thermally accessible excitonic band states by means of reducing the amount of diagonal energetic disorder.
As discussed in the literature concerning exciton delocalization effects64,65 and in the context of charge transport within organic materials,33,34,66,67 the localization or delocalization of states is influenced not only by the magnitude of electronic coupling compared to the standard deviation of energetic disorder but also by the structure of the Hamiltonian, particularly how site connections facilitate delocalization despite disorder. In molecular semiconductors with herringbone layer packing, the design of the DOS and state localization at the bottom of the conduction band are tied to the sign and size of the three largest nearest–neighbour electronic couplings.34,67 For electron transport, a negative product of “signed” nearest–neighbour couplings—hereafter termed “negative coupling-sign relation”—alongside isotropic electronic couplings (i.e., couplings of similar magnitude) promotes significant carrier delocalization, thereby enhancing electron carrier mobility. Conversely, the scenario for hole transfer systems is reversed.34,67
Upon examining the conductive brickwork layer of m-4TICO depicted in Fig. 1(b) and initially focusing on the three strongest nearest–neighbour excitonic couplings for energy migration, we observe that the overall sign is positive, given the presence of two negative and one positive interaction. This characteristic, reminiscent of electron transport scenarios, provides partial explanation for the strong localization of states at the bottom of the band, even though the presence of long-range (and non-negligible beyond nearest neighbour) excitonic interactions partially complicates this picture. This crucial observation raises the question: could the states at the bottom of the excitonic band exhibit greater delocalization if the coupling-sign relation were negative? And how would this impact transport properties?
To explore these concepts further, we designed two “artificial” systems featuring opposite coupling sign-combinations compared to the physical system analysed so far (see Fig. 5(c) and (d)). For the first artificial system, we assigned exclusively negative J-like signs to both short- and long-range interactions across all realizations of the disordered Hamiltonians. In contrast, the second system was endowed with exclusively positive H-like couplings. As expected, by looking at Fig. 5(c), we note that the spectrum of the artificial J-like aggregate exhibits a further significant shift by 175 meV towards the red, with the 0–1 band nearly entirely suppressed, highlighting that the only bright state is located at the bottom of the exciton band. On the other hand, the artificial H-like spectrum demonstrates a pronounced blue shift, indicative of bright states forming at the top of the excitonic band.20
Remarkably, the two scenarios present differing delocalization patterns (see Fig. 5(d)). The artificial J-like system displays states that are strongly delocalized at the bottom of the excitonic band (〈IPR〉B = 84.3), in alignment with the approximate negative coupling sign-relationship found when considering only the three nearest neighbour interactions. As Spano has pointed out,18 this intensified delocalization is also linked to the superradiance characteristic of ideal J-aggregates, where coherent delocalization varies with the actual number of molecules in the system. The artificial H-like system exhibits a delocalization pattern akin to that of the physical system, in line with both systems having a globally positive sign-combination. This observation is crucial for understanding transport properties. As we demonstrate in the following section a larger delocalization of the states triggers a faster diffusion and a longer exciton diffusion length.
Exciton transport dynamics
The exciton is propagated in time across the a–b plane of m-4TICO using our all-atom Frenkel-exciton surface hopping (FE-SH) non-adiabatic molecular dynamics.28 In FE-SH methodology the exciton wavefunction, Ψ(t) (eqn (9)), is propagated across the material by solving the time-dependent Schrödinger equation coupled to the room temperature motion of the nuclei. See details in Methods. The electronic Hamiltonian (eqn (2)) used to construct the potential energy surface and to derive the atomic forces is analogue to the one adopted to obtain the optical properties of the system and it is updated on-the-fly to naturally incorporate diagonal and off-diagonal exciton–phonon couplings. The only distinction is that the nuclear dynamic and forces (eqn (11)) are now treated classically using the QMD-FF previously discussed. This approximation is necessary to push the semiclassical propagation of the exciton to the long ps-scale in which Einstein diffusion takes place. As shown in Fig. 4(b), the frequency of the vibrations coupled to the excitation is well captured by the QMD-FF. As common to other surface hopping schemes68,69 the feedback from the electronic to the nuclear degrees of freedom is incorporated by stochastic hops between the excitonic potential energy surfaces (see Methods for details). An important aspect of our FE-SH is that this method obeys several desirable properties including energy conservation, internal consistency, and detailed balance, which are crucial to accurately study transport properties in the long-time limit.70–72 This is possible owing to an important set of corrections to the original Tully's surface hopping algorithm that we have implemented in our FE-SH algorithm as extensively discussed in our previous works.28,32,72,73 Among these crucial algorithmic improvements, we mention here: a state tracking algorithm,70,72 necessary to avoid trivial crossings and spurious long-range exciton transfer; a rescaling of the velocities in the direction of the non-adiabatic coupling vectors to correctly achieve detailed balance and energy conservation;70,71 and finally a decoherence correction based on exponential damping of the coefficients of the electronic wavefunction for all except the active state where the trajectory is actually running. The latter algorithm is widely used in the literature28,70,72,74 to tackle the well-known decoherence problem of this methodology. We refer to the Methods section for full simulation details.The exciton carrier wavefunction is initially chosen to be fully localized on a single molecule, denoted as k, with Ψ(t = 0) = |ek〉, positioned at the center of the supercell, and allowed to evolve over time. We note that, while the short-time relaxation dynamics within the excitonic band formed by the Frenkel states depends on the choice of the initial exciton wavefunction, the long-time diffusive dynamics is the same for different initial configurations.28,33 From the time-dependent exciton propagation (eqn (10)), we computed the mean-squared displacement (MSD), eqn (13), of the exciton along the eigendirections of the a–b plane of supercell of m-4TICO crystal, averaged over 500 FE-SH trajectories, as shown in Fig. S13 (ESI†). After a rapid increase at short times, the MSD exhibits an approximately linear increase at longer times indicative of normal diffusion. From this behavior, the diffusion tensor, D (eqn (12)) can be calculated. The computed diffusion tensor for the a–b plane is presented in polar representation in Fig. 6(a). Note that the a–b frame in this figure is reflected with respect to a compared to the orientation shown in Fig. 1. Interestingly, diffusion is faster in the direction parallel to the D2 molecular pairs, i.e., the largest eigenvector of the D tensor after its diagonalization, which forms an angle of 25 degrees with respect to the a-axis direction. Thus, the fast transport direction is not oriented along the strongest excitonic coupling pair, D1. This occurs because of a concerted effect of the couplings along D2 and D3, which leads to the excitonic states becoming delocalized along the transverse D2 direction. The computed D coefficient in the fastest direction is 0.029 cm2 s−1, which is in remarkable agreement with the value of 0.026 cm2 s−1 experimentally found by Firdaus et al. for the analogous ITIC system. If we assume for m-4TICO the same exciton lifetime time (τ) as for ITIC (τ = 394 ps), we can estimate an exciton diffusion length (L) in the fastest direction of m-4TICO of 47.7 nm. This estimate is in line with the exciton diffusion length measured in other high-performance NFAs.7,75 As shown in Fig. S14 (ESI†), D is well converged in terms of super-cell size for the physical system.
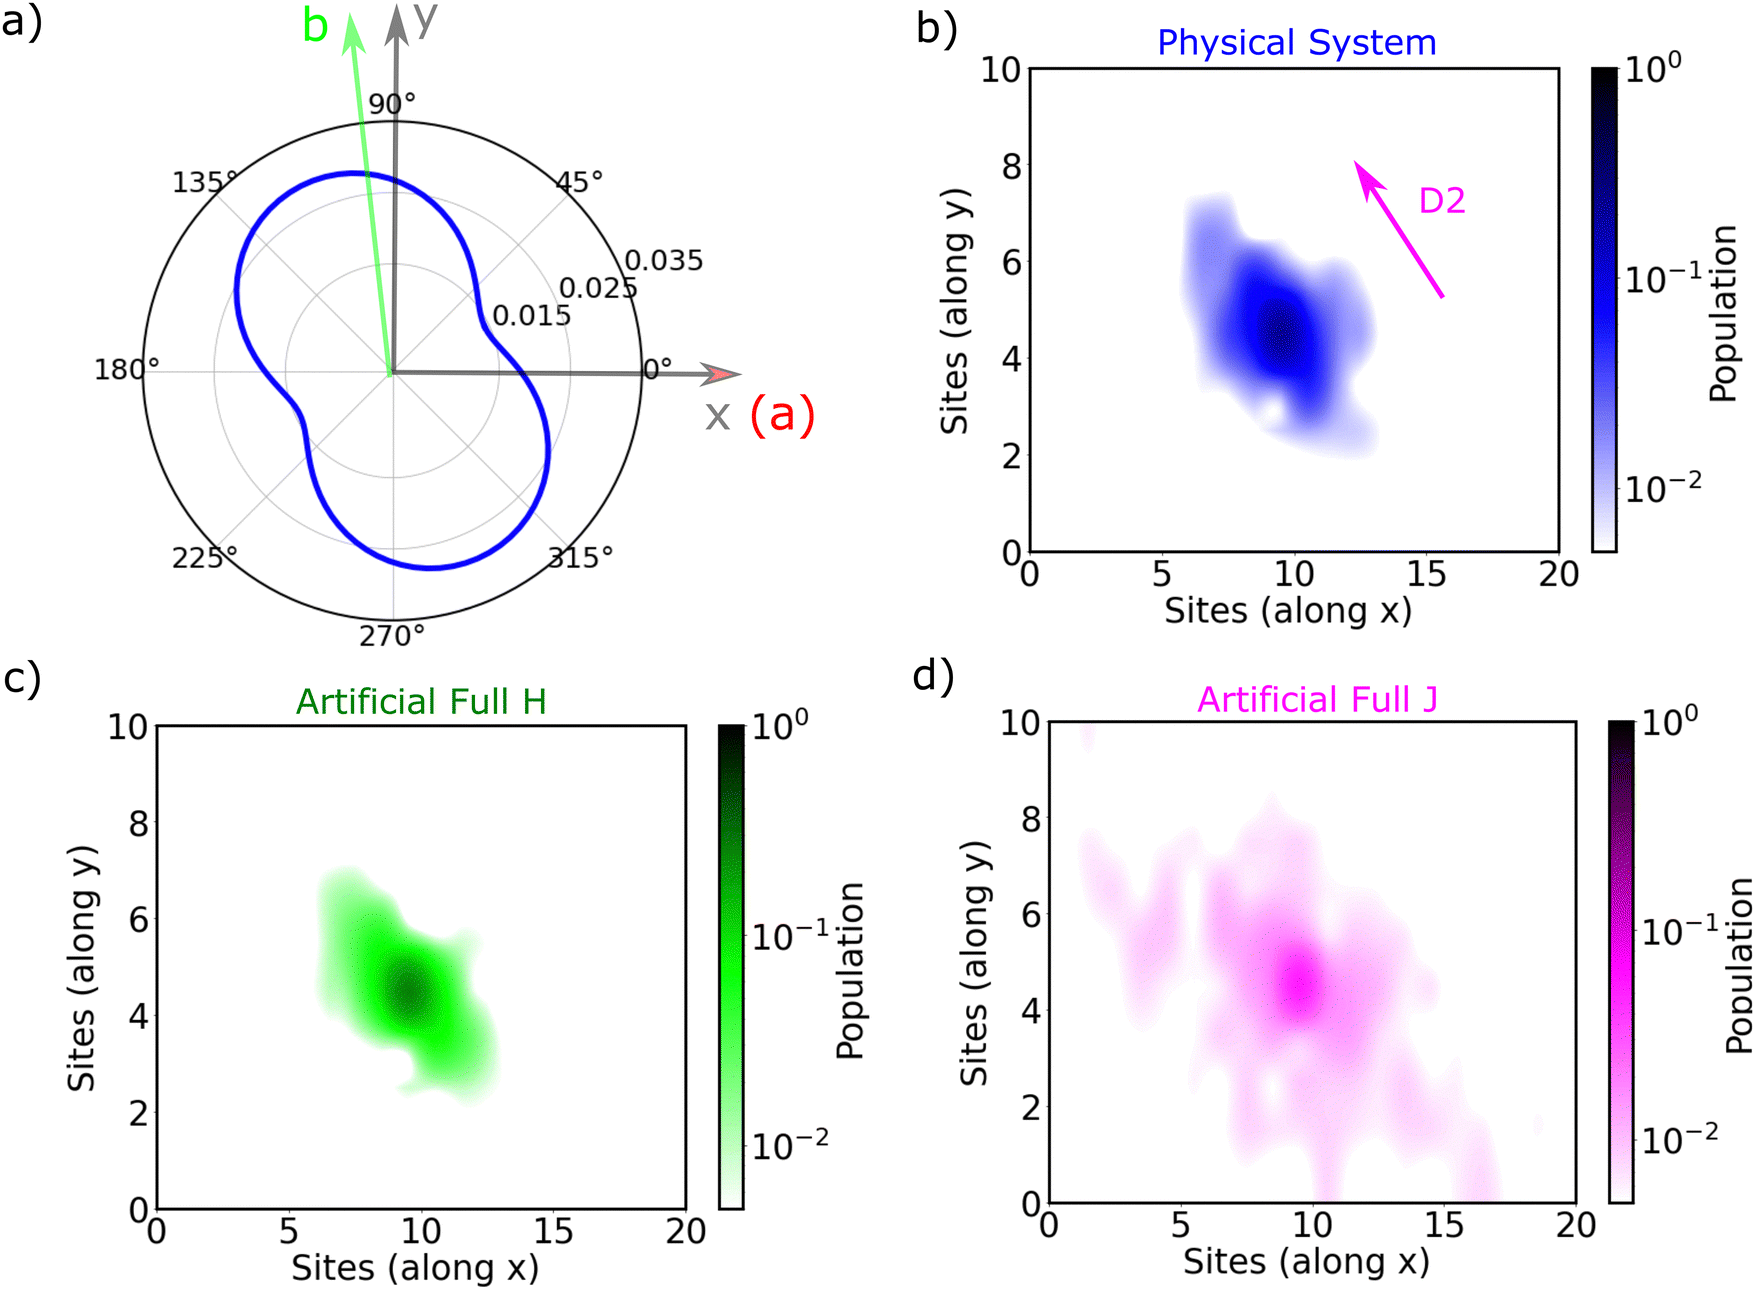 | ||
| Fig. 6 (a) Polar representation of diffusion tensor anisotropy (eqn (12)) in the a–b plane of m-4TICO calculated as an averaged of the MSD over 500 FE-SH trajectories. Panels (b)–(d) represent the average time-evolution of the exciton population 〈|ul|2〉 (where 〈⋯〉 indicates an average over time and over trajectories) for the three different models with different coupling-sign relationships as discussed in the text and the caption of Fig. 5. Note that the supercell orientation in the present figure is reflected with respect to the x(a) axis compared to the representation given in Fig. 1 and 2(c). This choice obviously does not change the fact that the high transport direction is oriented along D2 as indicated. | ||
In Fig. 6(b), we present the average time evolution of the wavefunction 〈|ul|2〉 for the physical system, where 〈⋯〉 indicates an average over time and trajectories. Interestingly, the anisotropy of the D tensor (Fig. 6(a)) tracks closely the average spatial population of the wavefunction (Fig. 6(b)), which in turn follows the delocalization of the states. As a matter of fact, as discussed extensively in previous works also in the context of charge carrier transport,28,32–34,60 the diffusion process in ordered materials is led by a transient quantum delocalization mechanism by which the carrier wavefunction occasionally jumps up to higher-lying delocalized states whereupon it can travel large distances before relaxing back down to lower states. This means that the delocalization of states within a few KBT from the bottom of the excitonic band plays a prominent role in determining the efficiency of the diffusion process. The more delocalized these thermally accessible states, the faster the exciton diffusion.
In this regard, as already highlighted in Fig. 5(c), the states at the bottom of the excitonic band are determined by the sign combinations of the excitonic interactions. We demonstrated that an artificially prepared system possessing an entirely positive pattern of H-like interactions, exhibits states with localization akin to those in the physical system (also featuring a positive sign-combination). This behavior is perfectly reflected in the time propagation of the wavefunction, as demonstrated in Fig. 6(c), with a computed diffusion length in the fastest direction being 44.4 nm. An alternative hypothetical artificial system with a globally negative sign combination with all J-like interactions displays instead extended thermally accessible states (see Fig. 5(c) and (d)). This sign combination leads to a much faster diffusion of the wavefunction, as illustrated in Fig. 6(d). The diffusion length of such an artificial J-like system increases by at least 3 times as compared to the physical system reaching L = 154 nm. Unfortunately, this rapid diffusion prevents the convergence of the D tensor and the related diffusion length, as the wavefunction reaches the boundaries of the supercell (see Fig. S14, ESI†). Thus, this latter estimate should be taken with a grain of salt.
Conclusion
Our study developed a comprehensive protocol based on Frenkel–Exciton Hamiltonian, parametrized using explicit electronic structures data, which is useful for dissecting the nature of electronic excitations and related exciton dynamics in extended aggregates in their solid state morphologies. Here, we studied a representative NFA molecule, m-4TICO. Our findings rationalize the complex changes in spectral characteristics during the transition from solution to the solid-state phase. We first demonstrate that, despite the complex pattern of excitonic interactions possessing both H- and J-like characteristics in the solid-state morphology, the absorption spectrum of m-4TICO is primarily influenced by J-aggregation-like effects. These effects cause a partial red-shift of the spectrum upon aggregation and a significant suppression of the 0–1 vibronic band in both absorption and emission, compared to the solution spectrum. We also observed a distinct correlation between the presence of energetic disorder, which is ubiquitous in organic semiconductors, and the measured Stokes shift. This degree of disorder is prompted by low-frequency molecular torsional vibrations typical of the acceptor–donor–acceptor (A–D–A) structure in most NFAs.Our results also underscore the critical role of such energetic disorder, together with the strength of the excitonic interactions, in governing the quantum delocalization of the thermally accessible excitonic states of the system, thereby influencing the exciton diffusion mechanism.28 However, as discussed by Scholes et al.,64,65 crucial source of localization/delocalization of the states is not solely the magnitude of electronic coupling relative to the standard deviation of energetic disorder and the magnitude of the exciton relaxation energy, but also the structure of the Hamiltonian—specifically, the connections between sites that facilitate delocalization and its resilience to the disorder. This suggests that the arrangement of the coupling connections matters not only for determining spectral changes but also for important transport properties. In this work, by manipulating interaction patterns and coupling sign relationships, we demonstrated the possibility of strongly modulating the extension of the thermally accessible exciton band states. Notably, similar possibilities have been recently explored and proposed in the case of charge transport in organic materials based on the transient localization scenario.33,34,66,67 Importantly, by explicitly propagating the coupled electron-nuclear wavefunction, we show that an enhanced delocalization of these states directly affects transport dynamics by promoting faster, more efficient exciton diffusion through transient exciton delocalization.28,29
The considerations outlined above provide a roadmap for designing NFAs with exciton diffusion constants that surpass those of today's best materials. We derive two crucial design principles aimed at enhancing transport efficiency: (i) reducing molecular torsional vibration-induced disorder possibly by making the A–D–A structure stiffer; (ii) achieving a favourable sign combination that is beneficial to promote the formation of low-energy extended states similarly to what has been found for charge transport in small molecule organic semiconductors. These insights not only advance our understanding of excitonic processes in solid-state aggregates but also provide actionable strategies for optimizing organic semiconductor materials for enhanced performance in practical applications.
Methodology
To model the electronic states, optical properties, and exciton transport properties of densely packed molecular aggregates, where excitons are shared among molecules, we employ a Frenkel-exciton-type Hamiltonian coupled to the nuclear degrees of freedom of the system:| Ĥ = ĤFE + ĤFE-N | (1) |
Frenkel-excitonic Hamiltonian
To construct the Hamiltonian in eqn (1), we consider in this work only local (quasi-diabatic) singlet molecular excitations of m-4TICO molecules (i.e., Frenkel excitons). This constitutes an excellent approximation, since we have verified that CT states are higher in energy with respect to FE exciton states and do not significantly mix with the latter (see Section S6, ESI†). Thus, the eigenvectors of the first term in eqn (1), ĤFE, are the adiabatic excitonic states forming the excitonic band of the system. In practice, ĤFE, is written as: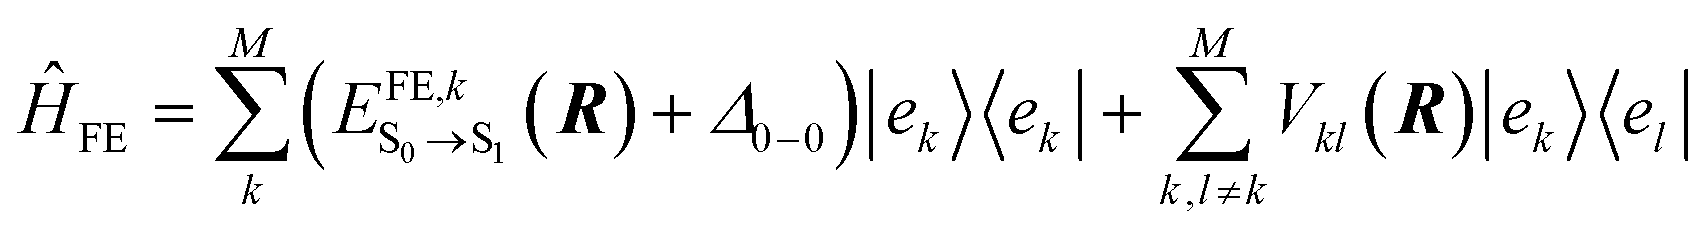 | (2) |
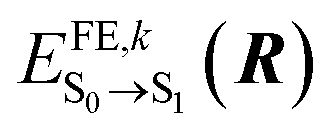 denotes the excitation energy of such a state (which in general depends on the Cartesian coordinates R of the molecule k) and Δ0–0 is the solution-to-crystal shift due to electrostatic and polarization effects induced by the environment. Vkl(R) is the intermolecular excitonic coupling between states |ek〉 and |el〉. The latter can be calculated as described below using different approximations with various accuracy and speed.
Excitonic interactions
As explained in the main text, VTotkl is generally written in terms of a long-range or Coulomb term and a short-range term, VTotkl = VCoul.kl + VShortkl.45 The total coupling can be accurately computed with different diabatic procedures in conjunction with TD-DFT, like the maximum-overlap approach implemented in Overdia46,47 and the multi-state diabatization procedure MS-FED-FCD.48–50 In this work, we adopt MS-FED-FCD as explained extensively in Section S6 (ESI†). In brief, first, the adiabatic excited states of the donor–acceptor pair are calculated followed by diabatization to (maximally) localized diabatic excitonic states. The excitonic coupling corresponds to the off-diagonal element between the locally excited FE states and includes all long- and short-range contributions. To ensure a complete de-mixing between excitations of different nature (e.g. FE and CT states) and an optimal reconstruction of localized FE states and related couplings we use 15 excited states for the diabatization. Besides providing a suitable benchmark for the total excitonic coupling, MS-FED-FCD allows us to compute couplings between FE and CT states as shown in Table S5 (ESI†). Nevertheless, MS-FED-FCD is computationally too demanding to compute all the long-range excitonic interactions in extended nano-scale solids. Fortunately, we found that VShortkl can be neglected to a good approximation in the present system, therefore cheaper methods can be used to approximate the long-range Coulomb interaction, VCoul.kl.In general, VCoul.kl is defined by the classical interaction between the transition densities of isolated donor and acceptor (singlet) states:
 | (3) |
 and ρTl are the diagonal parts of the one-particle density matrix constructed from the ground and excited-state wave functions of isolated donor and acceptor, εs is screening factor representing the dielectric constant that can be applied to include polarization effect due to the crystalline environment. The transition densities of each molecule can be computed through an atomic orbital expansion in combination with configuration interaction singles (CIS) and TDDFT. Note that transition densities are computed on isolated k and l molecules separately in this approach, as opposed to MS-FED-FCD, where a calculation on the whole donor–acceptor pair is performed. Therefore, this allows for a computational speed-up. Yet, VCoul.kl still requires electronic structure calculations for all investigated dimers which is a very large number.
A much faster alternative to compute long-range coupling in very good agreement with VCoul.kl for molecular dimers, relies on the calculation of the interaction between transition ESP charges (TrESP) approximating the full interacting transition densities. In this case the excitonic coupling is written as the Coulomb interaction of TrESP charges of k and l molecules as:
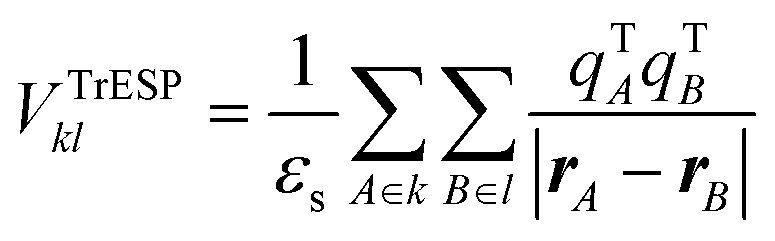 | (4) |
Excitonic coupling sign
We note that the excitonic coupling sign between two molecules of a given dimer extracted from the solid-state crystal is in principle arbitrary as it depends on the phase of the interacting molecular transition densities. However, it is vital to ensure a consistent relative phase and coupling sign when constructing the exciton Hamiltonian (eqn (2)) of a given system. The sign combination has an important impact on the electronic and optical properties54,78 as we have shown in Fig. 5. The requirement of a consistent sign combination is straightforwardly fulfilled when using atomic TrESP charges to represent transition densities and to calculate excitonic couplings, Vkl. This is becuase the phase of the molecular transition density is determined by construction for all pairs by the order of atomic TrESP charges that is kept consistent for all the molecules in the supercell. In fact, the order of the TrESP charges depends on the specific atom ordering which is the same for all the molecules in the system (and fulfills translational symmetry). Moreover, the TrESP approach allows in principle to univocally distinguish positive (which we called H-like) vs. negative (indicated with J-like) interactions computing a signed transition-dipole-corrected coupling Ṽkl as| Ṽkl = sgn(dk·dl)Vkl | (5) |
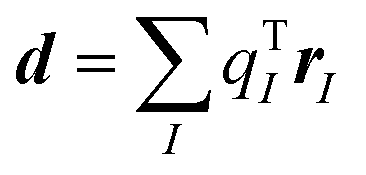 (I runs over the atomic positions of the molecule and qTI are the atomic TrESP charges). If all the dipoles are oriented in the same direction (as it is the case for m-4TICO), then Ṽkl = Vkl. See Fig. 2 for a visual representation of H- vs. J-like interactions.
Exciton–nuclear interactions
The nuclear degrees of freedom and their coupling to the electronic Hamiltonian are considered at different levels of approximation, depending on whether optical steady-state or long-time transport properties are examined.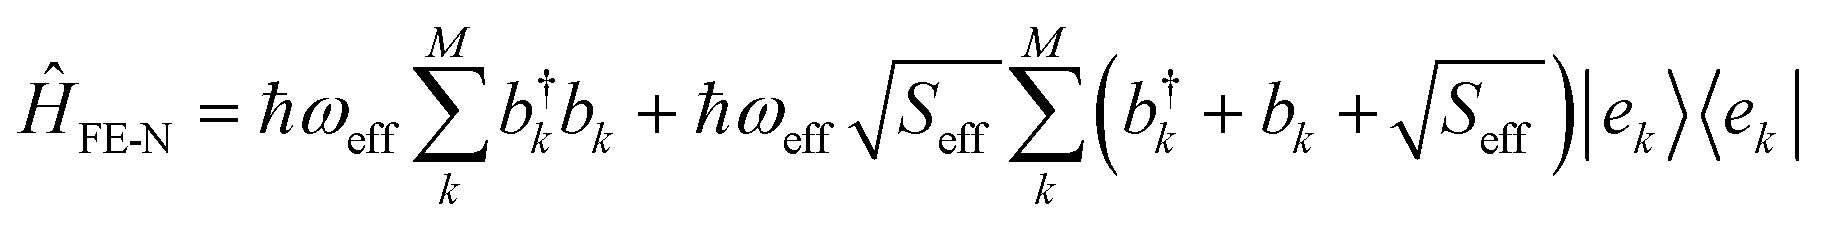 | (6) |
 and bk are the common creation and annihilation operators associated with a quantum harmonic oscillator. Eqn (6) assumes that both excited and ground states have the same curvature and zero-point energy, which is uniform for all molecules and it is not indicated. This omission does not impact any finding since we are focusing on the energy differences between the eigenstates. Seff is the Huang–Rhys factor associated to the high frequency portion of the relaxation energy (λrelhf) of the excited state potential,
 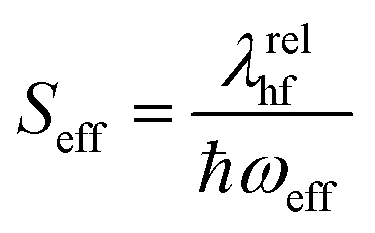 . Such a value determines the importance of the vibronic coupling. The values are calculated as described in Section S2 (ESI†). The low frequency contribution to the relaxation energy induced upon excitation is introduced through spectral broadening of the diagonal element of the Hamiltonian as explained in the main text.
Eigenstates and delocalization
The full Hamiltonian matrix Ĥ accounting for quantum vibrations is expressed in a multi-particle basis set that can be conveniently truncated to one (1p) or two (2p) particle basis to make its diagonalization computationally feasible as commonly done in the literature.18,20 Such a basis set has been extensively used by Spano et al.18,20 to represent the low energy eigenstates of the Hamiltonian in the regimes of weak and intermediate electronic coupling. Employing a 1p basis set truncation, an eigenstate j of the full electron-nuclear Hamiltonian takes the form: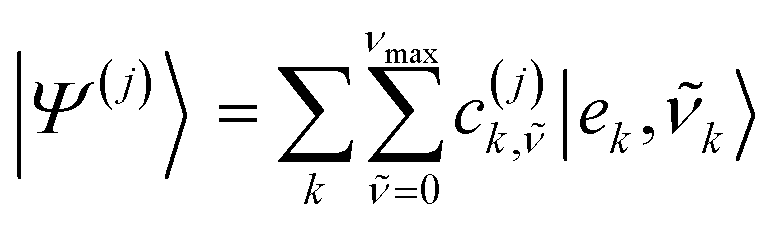 | (7) |
![[small nu, Greek, tilde]](https://www.rsc.org/images/entities/i_char_e0e1.gif) and ν represent the vibrational energy levels in the shifted excited state potential and ground state potential respectively, νmax (set to 3 in this work unless otherwise states) is the maximum number of vibrational quanta considered for the effective mode coupled to singlet excitation on the different molecules. The equation for the eigenstates referring to a two-particle basis set truncation are given in Section S5 (ESI†).
and ν represent the vibrational energy levels in the shifted excited state potential and ground state potential respectively, νmax (set to 3 in this work unless otherwise states) is the maximum number of vibrational quanta considered for the effective mode coupled to singlet excitation on the different molecules. The equation for the eigenstates referring to a two-particle basis set truncation are given in Section S5 (ESI†).
We use the inverse participation ratio (IPR) as a measure to describe the delocalization of a given eigenstate |Ψ(j)〉 of the Hamiltonian. The IPR(j) is essentially related to the number of sites over which the eigenstate j is delocalized. Employing a 1p basis coefficient and tracing out the vibrations for each site, the IPR(j) is written as:
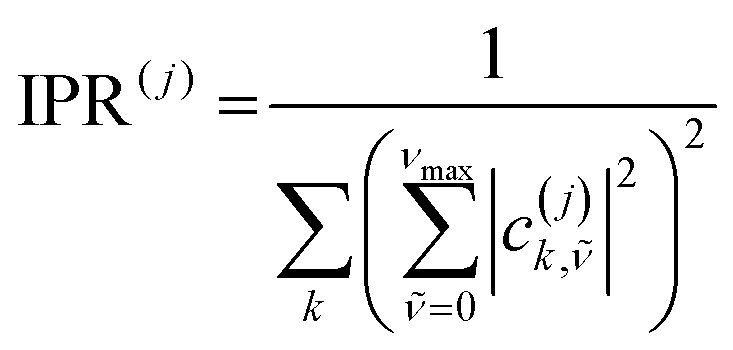 | (8) |
 are the expansion coefficient of the 1p wavefunction in eqn (7).
Frenkel-exciton surface hopping (FE-SH)
FE-SH is a computationally efficient atomistic non-adiabatic molecular dynamics method that strikes a balance between predictive power and computational feasibility. In this method the carrier excitonic wavefunction is represented as a linear combination of the FE localized states {el} used as a basis set for the electronic Hamiltonian, ĤFE, in eqn (2):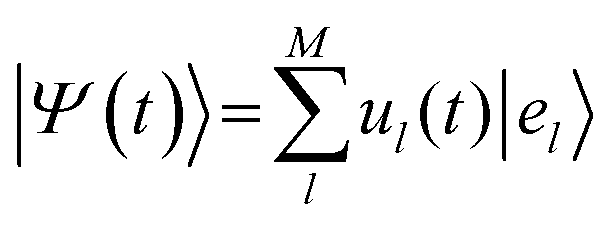 | (9) |
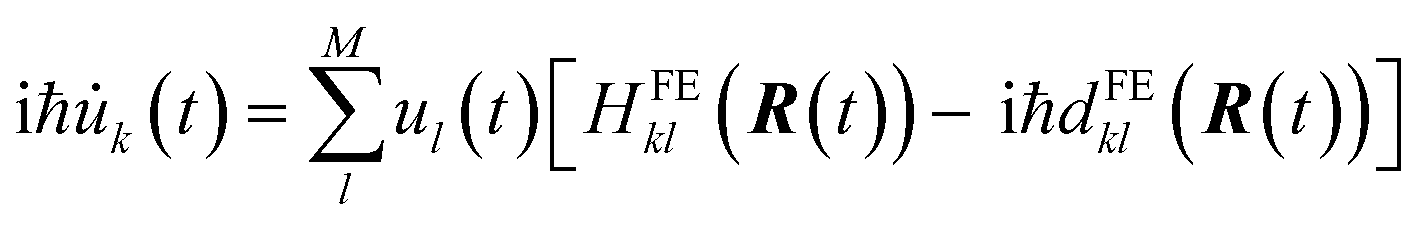 | (10) |
In FE-SH, the electronic propagation is performed in the diabatic basis, which is smoother and allows for a numerically more stable integration of the time-dependent Schrödinger equation in eqn (10).71,73,81 In fact, the nonadiabatic coupling elements (NACE) between the quasi-diabatic states, 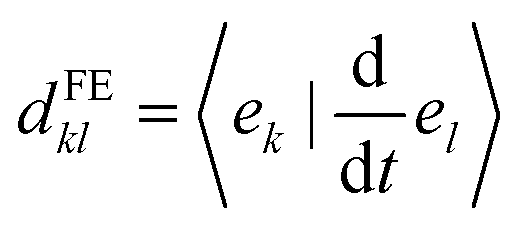 are typically very small and are neglected. Note that this is not the case for NACE between adiabatic states as we discuss below. We have shown in our previous studies28,60 that neglecting the NACE between diabatic states yields essentially the same dynamics but accelerates the calculations considerably. Conversely, the nuclear equations of motion are solved in the adiabatic basis. In accord with Tully's fewest switches surface hopping algorithm, the nuclear degrees of freedom are propagated on a single potential energy surface (PES), denoted as Ea (“a” for “active surface”), obtained by diagonalizing the Hamiltonian eqn (2). The coupling from the exciton to the nuclear motion is accounted for by transitions of the nuclear dynamics (“hops”) from the PES of the active eigenstate a, Ea, to the PES of another eigenstate j using Tully's surface hopping probability.68 The surface hopping probability, in turn, depends on the population of the states involved in the transition and the NACE between adiabatic states of the system obtained after diagonalization of eqn (2). The NACE in the adiabatic basis are not small close to avoided crossing regions and are explicitly calculated in our code.71
Nuclear forces required to propagate the nuclear dynamics are calculated using the Hellmann–Feynman theorem. The force acting on nucleus I on the potential energy surface Ea can be expressed as:
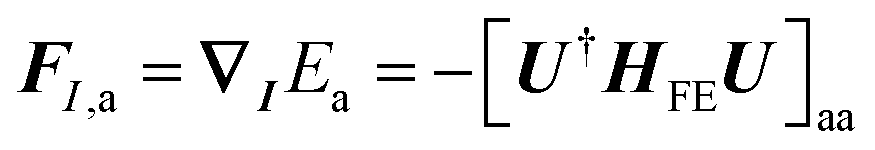 | (11) |
Finally, the surface hopping algorithm is supplemented with a number of important features necessary to apply the method to the calculation of transport properties, namely decoherence correction, trivial crossing detection, elimination of spurious long-range exciton transfer, and adjustment of the velocities in the direction of the non-adiabatic coupling vector in case of a successful surface hop.28,32,72,73 These algorithms are necessary to improve a number of desirable properties including Boltzmann occupation of the excitonic band states in the long-time limit, internal consistency between exciton carrier wavefunction and surface populations of the excitonic band states, and convergence of the diffusion with system size and nuclear dynamics time step. We refer to ref. 28, 32, 72 and 73 for a detailed description and discussion of the importance and the physical underpinnings of these additions to the original fewest switches surface hopping method.68
Diffusion tensor
Solving eqn (10), one obtains the excitonic wavefunction as a function of time, |Ψ(t)〉. This gives access to key dynamical properties, e.g., the diffusion tensor and the mechanism by which the excitonic wavefunction moves within the material subject to the different localization of the states within which can travel. The (second rank) diffusion tensor components, Dαβ, can be obtained as the time derivative of the mean squared (spatial) displacement of the exciton along the nine Cartesian components (MSDαβ),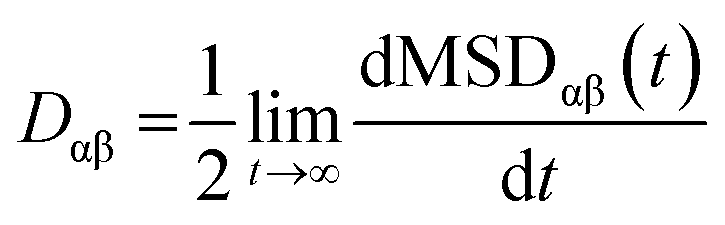 | (12) |
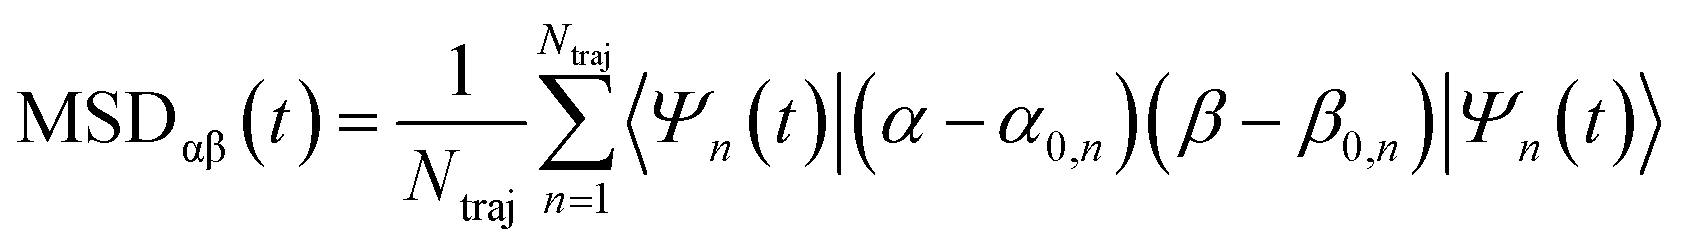 | (13) |
 where |uk,n|2 is the time-dependent excitonic population of site k in trajectory n as obtained by solving eqn (10). The elements of the diffusion tensor, Dαβ, can be used to define the diffusion lengths,83
 where τ is the exciton lifetime, that is the time for the exciton to relax to the ground state. The latter quantity can be obtained from, e.g., photoluminescence experiments.83
Parametrization of quantum-mechanically-derived FF
The parameterization of the intramolecular QMD-FF for the investigated NFA has been carried out with the Joyce code,57 using DFT data purposely computed for the target compound. A full expression of the QMD-FF potential energy used in this work is given in Section S9 (ESI†). In the first step, QM chemical descriptors are computed for the isolated monomer, and then used for the parameterization of the EQMD-FFk intramolecular energy term defined in eqn (S16) (ESI†). To retrieve the best parameters the objective function below is minimized as explained in ref. 57, 58 and 84 | (14) |
 terms are user-defined weights that were set according to previous applications.85 As mentioned before the objective function is minimized both for the ground and excited state molecule in order to retrieve force-field parameters for both the ground and the excited state.
Intermolecular parameters were taken from a standard Generalized Amber Force Field (GAFF) and were considered equivalent for both the ground and excited state of the molecule. Point charges were fitted in accordance with the restrained electrostatic potential (RESP) procedure.59 In Fig. S11 (ESI†), we show that the structure of the crystal is well maintained along MD and the molecules oscillate around their equilibrium position as shown by the radial distribution function of the centre of mass.
Simulation details
Electronic structure calculations were performed for the crystal structure reported by Mondelli et al.40 Excitation energies, excitonic couplings and exciton–phonon interactions needed to parametrize the Hamiltonian in eqn (1) were performed at TDDFT level implemented in the Gaussian16 software package.86 The level of theory used for most of the calculations was fixed at CAM-B3LYP/6-31G(d,p) unless where stated otherwise. Intra-molecular parameters (equilibrium positions and force constants) for quantum-mechanically derived force fields (QMD-FFs) fitting QM reference data were obtained with the Joyce software57,58 as explained in Section S10 (ESI†). Relaxed scans of the flexible dihedrals δ reported in Fig. S10 (ESI†) were also performed at the same level of theory.For each system, a series of 2D and 3D supercells (10 × 5 × 1, 20 × 15 × 1, 20 × 20 × 1, 20 × 20 × 2) from the experimental crystallographic unit cell were built. A total number of molecules going from 150 to 800 were considered to calculate converged absorption and emission spectra (see Fig. S7, ESI†). To account for disorder and thermal fluctuations, classical MD simulations were performed with the Gromacs 2021.5 software on such supercells.87 Periodic boundary conditions were taken into account along with long range electrostatic effects through the Particle mesh Ewald algorithm. Long MD simulations of at least 500 ps in the NVT ensemble were run to equilibrate the system. We used an integration time step of 1 fs, imposing constraints on the bonds involving H atoms through the LINCS algorithm, adopting a modified Berendsen thermostat88 to control temperature (fixed at 300 K in all simulations). Structural analyses on MD trajectories exploiting the MDAnalysis python library are reported (see Section S10 (ESI†)). For sampling the excitation energies and the electronic coupling calculations, we extracted single molecules or pairs of molecules from subsequent MD runs on equilibrated systems.
FE-SH simulations to study exciton transport properties were performed by employing the computational protocol developed in ref. 28. Supercells were equilibrated in periodic boundary conditions for at least 250 ps in the NVT ensemble to a target temperature of 300 K. This was followed by equilibration for at least 250 ps in the NVE ensemble (which is the ensemble used for non-adiabatic dynamics simulations). From the NVE trajectory, an uncorrelated set of positions and velocities were chosen as starting configurations for the swarm of FE-SH trajectories. The nuclear time step was chosen as small as 0.01 fs to prevent trivial crossings associated with narrow excitonic bandwidth and a localized excitonic wavefunction.28,70Eqn (10) was integrated using the fourth-order Runge–Kutta algorithm and an electronic time step of δt = Δt/5. For each system, about 500 FE-SH trajectories of the length of 1 ps were run to calculate the mean-squared displacement and the diffusion tensor. The exciton carrier wavefunction is initially chosen to be fully localized on a single molecule, denoted as k, with Ψ(t = 0) = |ek〉, positioned at the center of the supercell, and allowed to evolve over time according to the FE-SH algorithm described above in the NVE ensemble. As shown in previous works,28,33 after an initial relaxation, the diffusion constant is independent of the initial conditions (within the accuracy of our method). The convergence of the diffusion constant with the number of electronically active molecules, that is the molecules whose transition density is considered to build the Hamiltonian in eqn (2), is shown in Fig. S15 (ESI†). All simulations were carried out with our in-house implementation of FE-SH in the CP2K simulation package89 by employing the same intramolecular QMD force-field developed with the Joyce code.
Author contributions
S. G. performed all the quantum chemical calculations and non-adiabatic dynamics simulations presented in this work and performed related data analysis (with input from G. P., F. S. and D. B). S. G. and J. C. developed the codes for optical properties and dynamics used in this work. G. P. helped with the Joyce FF (http://www.iccom.cnr.it/en/joyce-2/) parametrization. F. S. helped with the use of FCclasses3.0 (http://www.iccom.cnr.it/en/fcclasses/) and provided model setup suggestions. All authors contributed to the data interpretation. S. G. and D. B. initially designed the research, and S. G. wrote the manuscript. All authors reviewed and discussed the manuscript.Conflicts of interest
The authors declare no conflicts of interest.Acknowledgements
S. G. would like to acknowledge Jochen Blumberger, Giacomo Londi, Lorenzo Cupellini, and Frank C. Spano for useful discussions. We are extremely grateful to Siebe Frederix, Koen Vandewal, and Pierluigi Mondelli for providing the experimental spectra in solution and in solid state of m-4TICO. S. G., G. P. and F. S. thank the support of ICSC-Centro Nazionale di Ricerca in High Performance Computing, Big Data and Quantum Computing, funded by European Union-NextGenerationEU-PNRR, Missione 4 Componente 2 Investimento 1.4. The work in Mons has been funded by the Belgian National Fund for Scientific Research (FRS-FNRS) within the Consortium des Équipements de Calcul Intensif (CÉCI), under Grant U.G.018.18, and by the Walloon Region (LUCIA Tier-1 supercomputer; grant number 1910247), under grant 1117545. D. B. is a FNRS research director. J. C. acknowledges to European Union for its Marie Curie Individual fellowship (HORIZON-MSCA-2022-PF-01-01, project no. 101106941).References
- L. Zhu, M. Zhang, J. Xu, C. Li, J. Yan, G. Zhou, W. Zhong, T. Hao, J. Song, X. Xue, Z. Zhou, R. Zeng, H. Zhu, C.-C. Chen, R. C. I. MacKenzie, Y. Zou, J. Nelson, Y. Zhang, Y. Sun and F. Liu, Nat. Mater., 2022, 21, 656–663 CrossRef CAS.
- W. Lowrie, R. J. E. Westbrook, J. Guo, H. I. Gonev, J. Marin-Beloqui and T. M. Clarke, J. Chem. Phys., 2023, 158, 110901 CrossRef CAS.
- Y. Tamai, Aggregate, 2022, 3, 1–29 Search PubMed.
- J. Hofinger, C. Putz, F. Mayr, K. Gugujonovic, D. Wielend and M. C. Scharber, Mater. Adv., 2021, 2, 4291–4302 RSC.
- Y. Cui, Y. Xu, H. Yao, P. Bi, L. Hong, J. Zhang, Y. Zu, T. Zhang, J. Qin, J. Ren, Z. Chen, C. He, X. Hao, Z. Wei and J. Hou, Adv. Mater., 2021, 33, 2102420 CrossRef CAS.
- C. Yan, S. Barlow, Z. Wang, H. Yan, A. K. Y. Jen, S. R. Marder and X. Zhan, Nat. Rev. Mater., 2018, 3, 1–19 CrossRef.
- Y. Firdaus, V. M. Le Corre, S. Karuthedath, W. Liu, A. Markina, W. Huang, S. Chattopadhyay, M. M. Nahid, M. I. Nugraha, Y. Lin, A. Seitkhan, A. Basu, W. Zhang, I. McCulloch, H. Ade, J. Labram, F. Laquai, D. Andrienko, L. J. A. Koster and T. D. Anthopoulos, Nat. Commun., 2020, 11, 5220 CrossRef CAS.
- T. H. Lee, Y. Dong, R. A. Pacalaj, S. Y. Park, W. Xu, J.-S. Kim and J. R. Durrant, Adv. Funct. Mater., 2022, 32, 2208001 CrossRef CAS.
- K. Jiang, J. Zhang, C. Zhong, F. R. Lin, F. Qi, Q. Li, Z. Peng, W. Kaminsky, S. H. Jang, J. Yu, X. Deng, H. Hu, D. Shen, F. Gao, H. Ade, M. Xiao, C. Zhang and A. K. Y. Jen, Nat. Energy, 2022, 7, 1076–1086 CrossRef.
- W. Gao, F. Qi, Z. Peng, F. R. Lin, K. Jiang, C. Zhong, W. Kaminsky, Z. Guan, C. S. Lee, T. J. Marks, H. Ade and A. K. Y. Jen, Adv. Mater., 2022, 34, 1–11 Search PubMed.
- D. Zhang, W. Zhong, L. Ying, B. Fan, M. Li, Z. Gan, Z. Zeng, D. Chen, N. Li, F. Huang and Y. Cao, Nano Energy, 2021, 85, 105957 CrossRef CAS.
- X. K. Chen, D. Qian, Y. Wang, T. Kirchartz, W. Tress, H. Yao, J. Yuan, M. Hülsbeck, M. Zhang, Y. Zou, Y. Sun, Y. Li, J. Hou, O. Inganäs, V. Coropceanu, J. L. Bredas and F. Gao, Nat. Energy, 2021, 6, 799–806 CrossRef CAS.
- F. D. Eisner, M. Azzouzi, Z. Fei, X. Hou, T. D. Anthopoulos, T. J. S. Dennis, M. Heeney and J. Nelson, J. Am. Chem. Soc., 2019, 141, 6362–6374 CrossRef CAS.
- G. Kupgan, X. K. Chen and J. L. Brédas, Mater. Today Adv., 2021, 11, 0–7 CAS.
- D. Kroh, F. Eller, K. Schötz, S. Wedler, L. Perdigón-Toro, G. Freychet, Q. Wei, M. Dörr, D. Jones, Y. Zou, E. M. Herzig, D. Neher and A. Köhler, Adv. Funct. Mater., 2022, 32, 2205711 CrossRef CAS.
- T. Nematiaram, D. Padula and A. Troisi, Chem. Mater., 2021, 33, 3368–3378 CrossRef CAS.
- R. Ghosh and F. C. Spano, Acc. Chem. Res., 2020, 53, 2201–2211 CrossRef CAS.
- N. J. Hestand and F. C. Spano, Chem. Rev., 2018, 118, 7069–7163 CrossRef CAS.
- A. Segalina, D. Aranda, J. A. Green, V. Cristino, S. Caramori, G. Prampolini, M. Pastore and F. Santoro, J. Chem. Theory Comput., 2022, 18, 3718–3736 CrossRef CAS.
- F. C. Spano, Acc. Chem. Res., 2010, 43, 429–439 CrossRef CAS.
- H. Yamagata, J. Norton, E. Hontz, Y. Olivier, D. Beljonne, J. L. Brédas, R. J. Silbey and F. C. Spano, J. Chem. Phys., 2011, 134, 204703 CrossRef CAS.
- M. Anzola, F. Di Maiolo and A. Painelli, Phys. Chem. Chem. Phys., 2019, 21, 19816–19824 RSC.
- S. Giannini, D. J. C. Sowood, J. Cerda, S. Frederix, J. Grune, G. Londi, T. Marsh, P. Ghosh, I. Duchemin, N. C. Greenham, K. Vandewal, G. D’Avino, A. J. Gillett and D. Beljonne, arXiv, 2023, preprint, arXiv:2312.04459, DOI:10.48550/arXiv.2312.04459.
- F. C. Spano, S. C. J. Meskers, E. Hennebicq and D. Beljonne, J. Chem. Phys., 2008, 129, 1–14 CrossRef.
- J. Clark, C. Silva, R. H. Friend and F. C. Spano, Phys. Rev. Lett., 2007, 98, 206406 CrossRef.
- R. Ghosh, C. M. Pochas and F. C. Spano, J. Phys. Chem. C, 2016, 120, 11394–11406 CrossRef CAS.
- R. Ghosh, C. K. Luscombe, M. Hambsch, S. C. B. Mannsfeld, A. Salleo and F. C. Spano, Chem. Mater., 2019, 31, 7033–7045 CrossRef CAS.
- S. Giannini, W.-T. Peng, L. Cupellini, D. Padula, A. Carof and J. Blumberger, Nat. Commun., 2022, 13, 2755 CrossRef CAS.
- A. J. Sneyd, D. Beljonne and A. Rao, J. Phys. Chem. Lett., 2022, 13, 6820–6830 CrossRef CAS.
- S. Prodhan, S. Giannini, L. Wang and D. Beljonne, J. Phys. Chem. Lett., 2021, 12, 8188–8193 CrossRef CAS.
- D. Balzer, T. J. A. M. Smolders, D. Blyth, S. N. Hood and I. Kassal, Chem. Sci., 2021, 12, 2276–2285 RSC.
- S. Giannini and J. Blumberger, Acc. Chem. Res., 2022, 55, 819–830 CrossRef CAS.
- S. Giannini, A. Carof, M. Ellis, H. Yang, O. G. Ziogos, S. Ghosh and J. Blumberger, Nat. Commun., 2019, 10, 3843 CrossRef.
- S. Giannini, L. Di Virgilio, M. Bardini, J. Hausch, J. J. Geuchies, W. Zheng, M. Volpi, J. Elsner, K. Broch, Y. H. Geerts, F. Schreiber, G. Schweicher, H. I. Wang, J. Blumberger, M. Bonn and D. Beljonne, Nat. Mater., 2023, 1–28 Search PubMed.
- S. Roosta, F. Ghalami, M. Elstner and W. Xie, J. Chem. Theory Comput., 2022, 18, 1264–1274 CrossRef CAS.
- V. Stehr, B. Engels, C. Deibel and R. F. Fink, J. Chem. Phys., 2014, 140, 024503 CrossRef CAS.
- P. A. Hume, W. Jiao and J. M. Hodgkiss, J. Mater. Chem. C, 2021, 9, 1419–1428 RSC.
- P. Mondelli, F. Silvestri, L. Ciammaruchi, E. Solano, E. Beltrán-Gracia, E. Barrena, M. Riede and G. Morse, J. Mater. Chem. A, 2021, 9, 26917–26928 RSC.
- P. Mondelli, P. Kaienburg, F. Silvestri, R. Scatena, C. Welton, M. Grandjean, V. Lemaur, E. Solano, M. Nyman, P. N. Horton, S. J. Coles, E. Barrena, M. Riede, P. Radaelli, D. Beljonne, G. N. M. Reddy and G. Morse, J. Mater. Chem. A, 2023, 11, 16263–16278 RSC.
- P. Mondelli, G. Boschetto, P. N. Horton, P. Tiwana, C. Skylaris, S. J. Coles, M. Krompiec and G. Morse, Mater. Horiz., 2020, 7, 1062–1072 RSC.
- J. Cerezo and F. Santoro, J. Comput. Chem., 2023, 44, 626–643 CrossRef CAS.
- F. J. Avila Ferrer and F. Santoro, Phys. Chem. Chem. Phys., 2012, 14, 13549 RSC.
- S. Kashani, Z. Wang, C. Risko and H. Ade, Mater. Horiz., 2023, 10, 443–453 RSC.
- J. Aragó and A. Troisi, Adv. Funct. Mater., 2016, 26, 2316–2325 CrossRef.
- L. Cupellini, M. Corbella, B. Mennucci and C. Curutchet, WIREs Comput. Mol. Sci., 2019, 9, 1–23 CAS.
- J. A. Green, M. Yaghoubi Jouybari, H. Asha, F. Santoro and R. Improta, J. Chem. Theory Comput., 2021, 17, 4660–4674 CrossRef CAS.
- J. A. Green, H. Asha, F. Santoro and R. Improta, J. Chem. Theory Comput., 2021, 17, 405–415 CrossRef CAS.
- L. Cupellini, S. Giannini and B. Mennucci, Phys. Chem. Chem. Phys., 2018, 20, 395–403 RSC.
- M. Nottoli, S. Jurinovich, L. Cupellini, A. T. Gardiner, R. Cogdell and B. Mennucci, Photosynth. Res., 2018, 137, 215–226 CrossRef CAS.
- J. Tölle, L. Cupellini, B. Mennucci and J. Neugebauer, J. Chem. Phys., 2020, 153, 184113 CrossRef.
- S. Mahadevan, T. Liu, S. M. Pratik, Y. Li, H. Y. Ho, S. Ouyang, X. Lu, H. Yip, P. C. Y. Chow, J. Brédas, V. Coropceanu, S. K. So and S.-W. Tsang, Nat. Commun., 2024, 15, 2393 CrossRef CAS.
- G. D’Avino, L. Muccioli, C. Zannoni, D. Beljonne and Z. G. Soos, J. Chem. Theory Comput., 2014, 10, 4959–4971 CrossRef.
- G. D’Avino, L. Muccioli, F. Castet, C. Poelking, D. Andrienko, Z. G. Soos, J. Cornil and D. Beljonne, J. Phys.: Condens. Matter, 2016, 28, 433002 CrossRef.
- N. J. Hestand, H. Yamagata, B. Xu, D. Sun, Y. Zhong, A. R. Harutyunyan, G. Chen, H. L. Dai, Y. Rao and F. C. Spano, J. Phys. Chem. C, 2015, 119, 22137–22147 CrossRef CAS.
- M. Rivera, M. Dommett, A. Sidat, W. Rahim and R. Crespo-Otero, J. Comput. Chem., 2020, 41, 1045–1058 CrossRef CAS.
- M. Rivera, M. Dommett and R. Crespo-Otero, J. Chem. Theory Comput., 2019, 15, 2504–2516 CrossRef CAS.
- I. Cacelli and G. Prampolini, J. Chem. Theory Comput., 2007, 3, 1803–1817 CrossRef CAS.
- J. Cerezo, G. Prampolini and I. Cacelli, Theor. Chem. Acc., 2018, 137, 1–15 Search PubMed.
- C. I. Bayly, P. Cieplak, W. Cornell and P. A. Kollman, J. Phys. Chem., 1993, 97, 10269–10280 CrossRef CAS.
- S. Giannini, O. G. Ziogos, A. Carof, M. Ellis and J. Blumberger, Adv. Theory Simul., 2020, 3, 2070021 CrossRef.
- F. C. Spano, S. C. J. Meskers, E. Hennebicq and D. Beljonne, J. Am. Chem. Soc., 2007, 129, 16278 CrossRef CAS.
- D. Balzer and I. Kassal, J. Phys. Chem. Lett., 2023, 14, 2155–2162 CrossRef CAS.
- R. L. Carey, S. Giannini, S. Schott, V. Lemaur, M. Xiao, S. Prodhan, L. Wang, M. Bovoloni, C. Quarti, D. Beljonne and H. Sirringhaus, Nat. Commun., 2024, 15, 288 CrossRef CAS.
- G. D. Scholes, Proc. R. Soc. A, 2020, 476, 20200278 CrossRef.
- G. D. Scholes, Faraday Discuss., 2019, 221, 265–280 RSC.
- S. Fratini, D. Mayou and S. Ciuchi, Adv. Funct. Mater., 2016, 26, 2292–2315 CrossRef CAS.
- S. Fratini, S. Ciuchi, D. Mayou, G. T. de Laissardière and A. Troisi, Nat. Mater., 2017, 16, 998–1002 CrossRef CAS.
- J. C. Tully, J. Chem. Phys., 1990, 93, 1061–1071 CrossRef CAS.
- R. Crespo-otero and M. Barbatti, Chem. Rev., 2017, 1–85 Search PubMed.
- A. Carof, S. Giannini and J. Blumberger, Phys. Chem. Chem. Phys., 2019, 21, 26368–26386 RSC.
- A. Carof, S. Giannini and J. Blumberger, J. Chem. Phys., 2017, 147, 214113 CrossRef.
- S. Giannini, A. Carof and J. Blumberger, J. Phys. Chem. Lett., 2018, 9, 3116–3123 CrossRef CAS.
- S. Giannini, A. Carof, M. Ellis, O. G. Ziogos and J. Blumberger, inMultiscale Dynamics Simulations: Nano and Nano-bio Systems in Complex Environments, ed. D. R. Salahub and D. Wei, Royal Society of Chemistry, 2021, pp. 172–202 Search PubMed.
- G. Granucci and M. Persico, J. Chem. Phys., 2007, 126, 134114 CrossRef.
- W. Lowrie, R. J. E. Westbrook, J. Guo, H. I. Gonev, J. Marin-Beloqui and T. M. Clarke, J. Chem. Phys., 2023, 158, 110901 CrossRef CAS.
- A. J. Sneyd, T. Fukui, D. Palecek, S. Prodhan, I. Wagner, Y. Zhang, J. Sung, Z. Andaji-Garmaroudi, L. R. MacFarlane, J. D. Garcia-Hernandez, L. Wang, G. R. Whittell, J. M. Hodgkiss, K. Chen, D. Beljonne, I. Manners, R. H. Friend and A. Rao, Sci. Adv., 2021, 7, eabh4232 CrossRef CAS.
- M. E. Madjet, A. Abdurahman and T. Renger, J. Phys. Chem. B, 2006, 110, 17268–17281 CrossRef CAS.
- N. J. Hestand and F. C. Spano, Acc. Chem. Res., 2017, 50, 341–350 CrossRef CAS.
- W. Peng, D. Brey, S. Giannini, D. Dell’Angelo, I. Burghardt and J. Blumberger, J. Phys. Chem. Lett., 2022, 13, 7105–7112 CrossRef CAS.
- M. Beck, Phys. Rep., 2000, 324, 1–105 CrossRef CAS.
- F. Plasser, G. Granucci, J. Pittner, M. Barbatti, M. Persico and H. Lischka, J. Chem. Phys., 2012, 137, 22A514 CrossRef.
- J. Spencer, F. Gajdos and J. Blumberger, J. Chem. Phys., 2016, 145, 064102 CrossRef.
- O. V. Mikhnenko, P. W. M. Blom and T.-Q. Nguyen, Energy Environ. Sci., 2015, 8, 1867–1888 RSC.
- D. Padula, A. Landi and G. Prampolini, Energy Adv., 2023, 2, 1215–1224 RSC.
- J. G. Vilhena, L. Greff Da Silveira, P. R. Livotto, I. Cacelli and G. Prampolini, J. Chem. Theory Comput., 2021, 17, 4449–4464 CrossRef CAS.
- M. J. Frisch, G. W. Trucks, H. B. Schlegel, G. E. Scuseria, M. A. Robb, J. R. Cheeseman, G. Scalmani, V. Barone, B. Mennucci, G. A. Petersson, H. Nakatsuji, M. Caricato, X. Li, H. P. Hratchian, A. F. Izmaylov, J. Bloino, G. Zheng, J. L. Sonnenberg, M. Hada, M. Ehara, K. Toyota, R. Fukuda, J. Hasegawa, M. Ishida, T. Nakajima, Y. Honda, O. Kitao, H. Nakai, T. Vreven, J. A. Montgomery Jr., J. E. Peralta, F. Ogliaro, M. Bearpark, J. J. Heyd, E. Brothers, K. N. Kudin, V. N. Staroverov, R. Kobayashi, J. Normand, K. Raghavachari, A. Rendell, J. C. Burant, S. S. Iyengar, J. Tomasi, M. Cossi, N. Rega, J. M. Millam, M. Klene, J. E. Knox, J. B. Cross, V. Bakken, C. Adamo, J. Jaramillo, R. Gomperts, R. E. Stratmann, O. Yazyev, A. J. Austin, R. Cammi, C. Pomelli, J. W. Ochterski, R. L. Martin, K. Morokuma, V. G. Zakrzewski, G. A. Voth, P. Salvador, J. J. Dannenberg, S. Dapprich, A. D. Daniels, O. Farkas, J. B. Foresman, J. V. Ortiz, J. Cioslowski and D. J. Fox, Gaussian 16, Revision C.01, Gaussian, Inc., Wallin, 2016 Search PubMed.
- M. J. Abraham, T. Murtola, R. Schulz, S. Páll, J. C. Smith, B. Hess and E. Lindah, SoftwareX, 2015, 1–2, 19–25 CrossRef.
- H. J. C. Berendsen, J. P. M. Postma, W. F. Van Gunsteren, A. Dinola and J. R. Haak, J. Chem. Phys., 1984, 81, 3684–3690 CrossRef CAS.
- T. D. Kühne, M. Iannuzzi, M. Del Ben, V. V. Rybkin, P. Seewald, F. Stein, T. Laino, R. Z. Khaliullin, O. Schütt, F. Schiffmann, D. Golze, J. Wilhelm, S. Chulkov, M. H. Bani-Hashemian, V. Weber, U. Borštnik, M. Taillefumier, A. S. Jakobovits, A. Lazzaro, H. Pabst, T. Müller, R. Schade, M. Guidon, S. Andermatt, N. Holmberg, G. K. Schenter, A. Hehn, A. Bussy, F. Belleflamme, G. Tabacchi, A. Glöβ, M. Lass, I. Bethune, C. J. Mundy, C. Plessl, M. Watkins, J. VandeVondele, M. Krack and J. Hutter, J. Chem. Phys., 2020, 152, 194103 CrossRef.
Footnote |
| † Electronic supplementary information (ESI) available. See DOI: https://doi.org/10.1039/d4tc01716a |
| This journal is © The Royal Society of Chemistry 2024 |