
 Open Access Article
 This Open Access Article is licensed under a Creative Commons Attribution-Non Commercial 3.0 Unported Licence
Decoding the domain dynamics of polycrystalline 0.7BiFeO3–0.3BaTiO3†
Lixu
Xie
 ab,
Neamul H.
Khansur
a,
Mingyue
Mo
b,
Ahmed
Gadelmawla
a,
Jie
Xing
b,
Zhi
Tan
b,
Jianguo
Zhu
*b and
Kyle G.
Webber
a
ab,
Neamul H.
Khansur
a,
Mingyue
Mo
b,
Ahmed
Gadelmawla
a,
Jie
Xing
b,
Zhi
Tan
b,
Jianguo
Zhu
*b and
Kyle G.
Webber
a
aDepartment of Materials Science and Engineering, Friedrich-Alexander-Universität Erlangen-Nürnberg (FAU), 91058 Erlangen, Germany
bCollege of Materials Science and Engineering, Sichuan University, 610064 Chengdu, China
First published on 5th July 2024
Abstract
Despite the extraordinary significance of high-temperature piezoelectric ceramics in engineered systems, understanding their macroscopic electromechanical response in terms of local underlying phenomena, in particular the domain dynamics at elevated temperatures that directly influence the stability of device performance, remains a significant challenge. Here, we investigate the relationship between domain evolution with temperature and its piezoelectric response utilizing 0.7Bi1.05FeO3–0.3BaTiO3 (BF30BT), a critical alternative to lead-based ferroelectrics for high-temperature applications. By analyzing the frequency and loading amplitude-dependent Rayleigh behavior, we are able to demonstrate the importance of the intrinsic contributions in piezoelectric response. The re-entrant relaxor nature of BF30BT results in active locally heterogeneous nanodomains that display reversible rapid response contributions rather than typical extrinsic contributions due to their low activation energy. Decoding the complicated domain dynamics of BF30BT allows for the further integration of microstructures and macroscopic characteristics, guiding the design and utilization of further high-temperature piezoelectric ceramics.
1. Introduction
Due to their electromechanical coupling and fast reaction time to an applied electric or stress field, piezoelectric and ferroelectric materials are frequently used as enabling components in a variety of electronic devices. With increasing technical demands, including sustainable development, piezoelectric materials are exposed to more extreme conditions during their use in various applications, especially for stable performance in high-temperature environments, such as aerospace, energy, tool manufacturing, and other industrial applications.1–3 To date, due to excellent temperature stability and high Curie temperature as well as good electromechanical response, lead-based piezoelectric ceramics dominate the market. However, because of the lack of efficient lead recycling and reuse technology for electronic materials, as well as potential health and environmental hazards of lead, there has been a concerted effort to develop lead-free piezoelectric materials as an alternative to lead-based ceramics. Although much focus has been placed on optimizing and understanding the small- and large-signal piezoelectric response, one area in which lead-free ferroelectrics have excelled in comparison to lead-containing systems is in high temperature stability.4 Among the various lead-free candidates, bismuth-layered materials have been widely studied because of their extremely high Curie temperature TC (∼900 °C) and outstanding temperature-stable electromechanical response, although the relatively small piezoelectric coefficient (∼15 pC N−1) significantly hinders its use in applications.5,6 A more extreme example is Nd2Ti2O7, which possesses a Curie temperature of up to 1482 °C, possibly the highest of any currently accessible material. However, its complex synthesis process and 2.6 pC N−1 piezoelectric coefficient are severe limitations.7 On the other hand, for systems with large piezoelectric signals, such as niobate systems represented by (K,Na)NbO3, Wu et al. induced a relaxor slush polar state near room temperature by multicomponent doping, which enhanced the piezoelectric performance to as high as 650 pC N−1 but substantially deteriorated the TC (∼190 °C).8 Obviously, achieving high piezoelectricity and Curie temperature simultaneously remains a significant challenge.Bismuth ferrite (BiFeO3, BF) has received considerable interest as an end member in high-temperature piezoelectric material systems because of the high TC (∼830 °C) and large spontaneous polarization Ps (∼100 μC cm−2).9,10 In order to overcome the limitations of high coercive field and electrical conductivity found in BiFeO3,3 binary solid solutions with other perovskite ferroelectrics, such as barium titanate (BaTiO3, BT), have been introduced.11,12 BaTiO3 displays a lower spontaneous polarization that can effectively reduce the energy difference between the ferroelectric phase and the paraelectric phase, which will enhance the electromechanical constitutive behavior while simultaneously decreasing the ferroelectric–paraelectric phase transition temperature and reducing the thermal stability. As such, BiFeO3–BaTiO3 (BF–BT) can achieve performance modulation by adjusting the proportion of BT.13 Using this concept and with the aid of quenching, Lee et al. reported excellent piezoelectric performance (d33 ∼402 pC N−1) and a high TC ∼454 °C.14
Although numerous researchers have tried various methods to further optimize the properties of BF–BT ceramics, one of the effective methods is the regulation of relaxor characteristics,15,16 which is usually achieved by different types of substitutions, such as A- and B-site dopants (Sm, Nd, La, etc.17–19), ABO3-type ((Na1/2Bi1/2)TiO3, NaTaO3, etc.20,21), and simple oxides (ZnO2, MnO2, TiO2, etc.22–24). Such substitutions are understood to break the long-range-ordered ferroelectric structure (LRO) and result in a relaxor ferroelectric structure. Typical relaxor ferroelectrics may be divided into three regions with an increasing temperature: nonergodic state (NE), ergodic state (E), and nonpolar state.25–27 Here, the Burns temperature TB separates the nonpolar and ergodic regions, below which the active polar nanoregions (PNRs) will appear. Upon further cooling, the freezing temperature Tf separates the ergodic and nonergodic regions, and PNRs rapidly transform into static ferroelectric domains below Tf.26,28,29 Therefore, the stability of PNRs is the most significant indicator for distinguishing different relaxor states.
It is worth noting that due to the mismatch of valence and ionic radii between A and B site cations, local nanoscale heterogeneity in the relaxor BF–BT ceramic system is observed,30,31 primarily manifested as heterogeneous polar regions (NHPRs) represented by nanodomains. It should be emphasized that here, we use nanoscale heterogeneous polar regions (NHPRs) instead of polar nanoregions (PNRs) to describe the local heterogeneity formed by nanoscale chemical and structural heterogeneity.32,33 The reason is that the concept of PNRs is derived from glass-like materials, which means that the polar regions are embedded in the “nonpolar” matrix. While in many cases, PNRs are embedded in long-range ordered ferroelectric structures, for example, according to TEM observation34 and molecular dynamics (MD) simulations,35 relaxor-PbTiO3 exhibits significant polarization with a small nonpolar area near room temperature. Based on this, Li et al. previously proposed the concept of NHPRs to predict and explain the high performance of 2.5 mol% Sm-doped 0.71PMN–0.29PT and 0.69PMN–0.31PT ceramics, which seems to be a more appropriate way to describe the local heterogeneity in these systems.36 Numerous investigations have shown that local nanoscale heterogeneity can help to reduce the energy difference between different polarization states and promote the transformation of relaxor ferroelectrics (RFE) into LRO ferroelectrics (FE), which can result in enhanced performance in PMN–PT36 and BNT37 ceramic systems. Interestingly, Kim et al. demonstrated using high-energy synchrotron radiation X-ray diffraction that the nanodomain structure of BF–BT originates from the disordered arrangement of Bi3+, which is helpful for domain reorientation.38 Importantly, since Bi3+ disorder cannot be completely eliminated by poling, the existence of nanodomains is observed in poled30 and unpoled31 systems. In addition, because BF–BT has various potential applications at high temperatures, it is important to study the dynamics of such a domain structure as a function of temperature, but there is currently no relevant published investigation.
Furthermore, from a macroscopic perspective, high-temperature domain dynamics account for just a fraction of the performance of piezoelectric ceramics. The piezoelectric response of multiphase coexisting perovskite ceramics, as is well known, comprises intrinsic and extrinsic contributions. The former can be attributed to lattice contributions in reaction to applied external fields, whereas the latter is caused by domain wall motion or phase boundary motion, which consists of reversible and irreversible elements.39 Under subcoercive external forces, such as electric field and stress, the domain walls are reversibly and irreversibly displaced, without a change in domain wall density expected for large-signal loading. As a result of external field effects, the direct piezoelectric response of ferroelectric materials is often nonlinear and hysteretic under a subcoercive field. This hysteresis follows the Rayleigh relationship with distinct reversible and irreversible coefficients, allowing the proportion of each contribution to be determined by fitting,40,41 as demonstrated for K0.5Na0.5NbO3,42 Bi1/2K1/2TiO3,43 Pb(Zr,Ti)O339 as well as other high-performance ceramics.
Therefore, we have investigated the origin of the piezoelectric response at high temperatures in polycrystalline BF-–BT by characterizing the temperature-dependent Rayleigh behavior to better understand how the domain dynamics change with increasing temperature. In this work, polycrystalline 0.7Bi1.05FeO3–0.3BaTiO3 was prepared using the solid-state reaction method with 5 mol% excess Bi to compensate for volatilization during sintering.44 This research directly addresses the origins of the electromechanical response in an important high-temperature piezoelectric material, which is critical for implementation in applications, as their temperature-dependent performance determines device stability and reliability. Macroscopic experimental data are contrasted with in situ temperature-dependent X-ray diffraction to evaluate domain morphology and analyze changes in the powder structure throughout the heating process. The combination of studies at different scales is conducive to a more in-depth and thorough analysis of materials, which is critical for the preparation of high-performance BF–BT ceramics and their practical applications.
2. Experimental methodology
Polycrystalline 0.7Bi1.05FeO3–0.3BaTiO3 (BF30BT) ceramics were synthesized by a solid-state reaction method. Analytically pure powders of Bi2O3 (99%, Alfa Aesar, Germany), Fe2O3 (99.9%, ThermoFisher GmbH, Germany), TiO2 (99.6%, Alfa Aesar, Germany), and BaCO3 (99.8%, Alfa Aesar, Germany) were dried overnight in an oven at 120 °C to remove moisture, weighed, and then mixed with the required stoichiometric ratio in a glove box with a relative humidity of <10%. Previous studies have reported on the utilization of Bi2O3 with purities ranging from 99% to 99.99% in the synthesis of BF–BT ceramics, with a large portion of the ceramics exhibiting second phase Bi25FeO40. Perhaps, after the purity of Bi2O3 reached a certain level, impurity elements like Si and Al did not play a significant role in the emergence of the secondary phase.3,45 Raw material powders were subsequently ball-milled for 24 h using zirconia balls (5 mm) in absolute ethanol, dried using a rotary evaporator, and calcined at a heating rate of 5 K min−1 at 700 °C for 2 h. Following this, the calcined powders were ball-milled in ethanol for an additional 24 h. After drying, the powders were uniaxially pressed to form cylinders with a diameter of 10.2 mm and a height of 10 mm and then cold isostatically pressed at 180 MPa. The cylinders were sintered at 980 °C for 3 h at a heating rate of 5 K min−1 and a cooling rate of 1 K min−1. During sintering, the BF–BT sample was embedded in sacrificial calcinated BF–BT powder. The sintered samples were ground into cylinders with a diameter of 5.8 mm (±0.02 mm) and a height of 6 mm (±0.02 mm) using a surface grinder. An annealing step at 450 °C for 2 h, with a heating and cooling rate of 5 K min−1, was used after sample preparation to relieve the residual stresses induced by machining. Subsequently, Pt electrodes were sputtered on both circular faces of the cylinder, and the samples were poled in silicone oil (AK200, Wacker) under a DC electric field of 2.5 kV mm−1 for 30 min at 100 °C, followed by field cooling to room temperature.Density was measured using Archimedes’ method with distilled water, and the three samples were weighed under the same conditions. Scanning electron microscopy (SEM, Quanta 200, FEI) was used to determine the microstructures of the sectioned samples. The average grain size was calculated by characterizing the grain area to obtain the equivalent grain diameter. For this purpose, five images were considered, and at least 500 grains were measured.
After crushing the sintered bulk ceramics into powder and annealing at 500 °C for 2 h, diffraction data were collected for crystal structure analysis using an X’ Pert Pro MPD (DY120 PANalytical) equipped with a Cu X-ray source (λKα1/λKα2 = 1.540598/1.544426). Diffraction data were collected in the 2θ range of 10° to 70° with a step size of 0.01° and a counting time of 10 s per step. The same measurement parameters were used for the in situ temperature-dependent measurements. A heating rate of 10 K min−1, and a temperature stabilization time of 5 min were used at each target temperature. The MAUD program was employed to refine XRD data.46
The temperature-dependent dielectric properties were measured on the cylindrical samples from room temperature to 550 °C (2 K min−1 heating and cooling rate) over a frequency range from 100 Hz to 1 MHz in an oven (LE 4/11/3216, Nabertherm) equipped with a custom-built sample holder and an LCR meter (Keysight 4980 AL, USA) controlled by a custom LabView control and analysis program.
Piezoelectric force microscopy (PFM) measurements were performed using an atomic force microscope (MFP-3D, Asylum Research, Goleta, CA) in out-of-plane mode with a scanning speed of f = 1 Hz and a scanning AC voltage of 3 V.
The room-temperature piezoelectric constant (d33) was measured 24 h after poling with a Berlincourt meter (PiezoMeter System PM300, Piezotest Ltd) using a bias mechanical force of 10.2 N and a frequency of 110 Hz. Temperature-dependent d33 and permittivity measurements were carried out from −150 °C to 400 °C with frequencies ranging from 0.5–140 Hz and 100 Hz to 1 MHz, respectively, using a custom-built setup comprised of a modified screw-type load frame (5967, Instron) and a thermal chamber cooled with liquid nitrogen.47 Inside the chamber, samples were placed on polished tungsten carbide bearings that allow electrical contact, and a piezoelectric stack actuator (P-025.80, PI Ceramics GmbH) was used to apply a constant stress amplitude of ±0.5 MPa at different frequencies ranging from 0.5 to 140 Hz. Rayleigh behavior was measured by varying the stress amplitude between ±0.5 and ±5 MPa with a pre-stress of −15 MPa from 25 °C to 400 °C and a constant frequency of 10 Hz. A preload was required in order to ensure that mechanical and electrical contacts were maintained throughout the measurements for all applied stress amplitudes.
3. Results and discussion
To ensure the reliability and repeatability of the experimental results, the room-temperature structure of BF30BT was characterized using XRD to assess the quality of samples, as shown in Fig. 1a. The diffraction patterns are in good agreement with the perovskite structure, but a minor Bi2O3-rich impurity phase Bi25FeO40 (ICSD#62719) was observed, which has been mentioned in other studies.48,49 Typically, the structure of BF–BT is characterized by distinctive peaks at 110pc, 111pc, and 200pc, where cluster peaks rather than clear peak splitting indicate a multiphase state. To explore the phase composition of BF30BT ceramics, the RBF phase (ICSD#15299, R3c) and TBT phase (ICSD#23758, P4mm) were used to fit powder XRD. The results of sigma value (sig) ≈ 1.37 and weighed pattern R-factor (Rwp) ≈ 4.3 show that the refinement process is reliable.50 The phase structure of BF–BT ceramics has been debated, with researchers proposing various phase compositions such as R3c + P4mm (R + T),14R3c + Pm![[3 with combining macron]](https://www.rsc.org/images/entities/char_0033_0304.gif) m (R + PC),13R3c (R),51 and P4mm + Pmm (T + PC)52 to model the diffraction data. The origin of such discrepancies is possibly related to the processing conditions, i.e., Bi volatilization and the associated existence of secondary phases as well as the core–shell microstructure. Moreover, similar to other Bi-based perovskite oxides,53,54 BF–BT may also exhibit local-scale variation in Bi-displacement, making the investigation of the average structure more challenging. Nevertheless, different combinations of space groups, i.e., R3c + P4mm, R3c + Pmm, R3c, and P4mm + Pmm were employed to model the room-temperature diffraction data presented in Fig. 1 and Fig. S1 and Table S1 (ESI†). Our data can be best modeled using a combined R3c + P4mm space group. Here, the lattice parameters obtained from refinements are a = b = 5.6439 Å and c = 13.8192 Å for rhombohedral (63%), and a = b = 3.9962 Å and c = 4.0189 Å for tetragonal (32%), confirming that the polycrystalline BF30BT displays a coexistence of rhombohedral and tetragonal phases at room temperature. Recently, Chen et al. and Wang et al. respectively investigated the local structure of BF–BT ceramics using TEM and observed considerable P4mm symmetry, which may support the practicality of this fitting conclusion.55,56 It is, therefore, understood to be located in the morphotropic phase boundary (MPB) region associated with high piezoelectricity performance.3,14
m (R + PC),13R3c (R),51 and P4mm + Pmm (T + PC)52 to model the diffraction data. The origin of such discrepancies is possibly related to the processing conditions, i.e., Bi volatilization and the associated existence of secondary phases as well as the core–shell microstructure. Moreover, similar to other Bi-based perovskite oxides,53,54 BF–BT may also exhibit local-scale variation in Bi-displacement, making the investigation of the average structure more challenging. Nevertheless, different combinations of space groups, i.e., R3c + P4mm, R3c + Pmm, R3c, and P4mm + Pmm were employed to model the room-temperature diffraction data presented in Fig. 1 and Fig. S1 and Table S1 (ESI†). Our data can be best modeled using a combined R3c + P4mm space group. Here, the lattice parameters obtained from refinements are a = b = 5.6439 Å and c = 13.8192 Å for rhombohedral (63%), and a = b = 3.9962 Å and c = 4.0189 Å for tetragonal (32%), confirming that the polycrystalline BF30BT displays a coexistence of rhombohedral and tetragonal phases at room temperature. Recently, Chen et al. and Wang et al. respectively investigated the local structure of BF–BT ceramics using TEM and observed considerable P4mm symmetry, which may support the practicality of this fitting conclusion.55,56 It is, therefore, understood to be located in the morphotropic phase boundary (MPB) region associated with high piezoelectricity performance.3,14
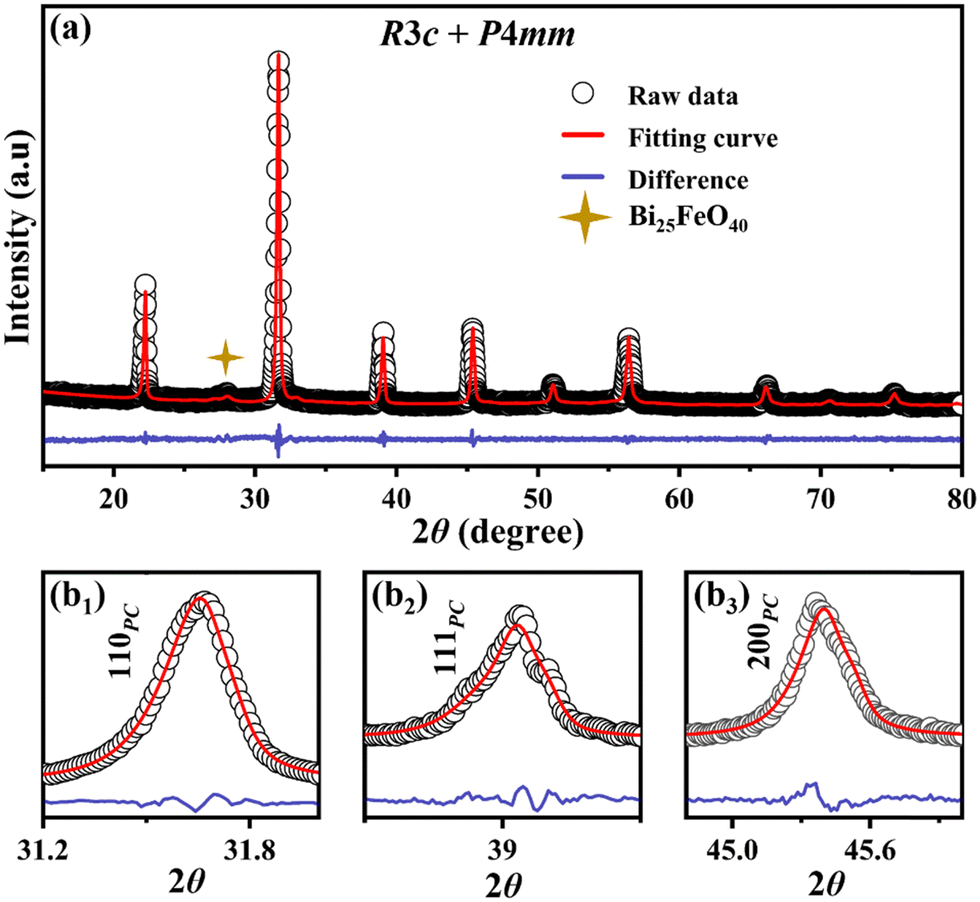 | ||
| Fig. 1 (a) Rietveld refinement XRD patterns in the 2θ range of 10°–90°; enlarged XRD peaks (b1) 31.2°–32°, (b2) 38°–40° and (b3) 44.8°–46° of BF30BT. | ||
The surface microstructures of BF30BT ceramics were investigated using SEM. The polished and thermally etched samples were used to further reveal their microstructure, as shown in Fig. 2 and Fig. S2 (ESI†). The prepared polycrystalline ceramics present a homogeneous and dense microstructure, with a comparatively bright area indicating the existence of a Bi-rich phase, identified as Bi25FeO40.49,57 According to the statistical analysis of the surface SEM images (Fig. S2a, ESI†), the grain size had an average diameter of 6.9 μm with a standard deviation of ±1.7 μm. Here, the density measured by the Archimedes method is ≈7.265 g cm−3, reaching approximately 95% of the theoretical density,58 indicating that the sintering conditions are suitable for electromechanical investigations.
 | ||
| Fig. 2 SEM images of the polished and thermally etched BF30BT ceramics. | ||
Under certain conditions, the application of an electric field and/or mechanical stress can induce an irreversible relaxor-to-ferroelectric transformation in nonergodic relaxor ferroelectrics, improving the overall small signal piezoelectric response.8,15,16,59 However, the relaxor state of ergodic relaxor ferroelectrics is stable, i.e., the relaxor phase returns to the disordered state after the external electric field is removed, resulting in a low small-signal piezoelectric response16 but potentially an enhanced large-signal unipolar strain response.31,60,61 One important factor controlling this state change is the critical relaxor-to-ferroelectric temperature, which can be seen in the temperature-dependent dielectric response. As such, relative permittivity was characterized as a function of temperature (25–700 °C) to investigate the phase transition temperature and relaxor characteristics of BF30BT ceramics (Fig. 3).
 | ||
| Fig. 3 (a) Temperature-dependent cooling curve of permittivity of BF30BT ceramic; (b) enlarged view at 25–200 °C. | ||
The dielectric response shows that the dielectric peak at Tm gradually moves to a higher temperature with increasing frequency, displaying a broadening that is characteristic of a relaxor ferroelectric,15,16 analogous to the canonical relaxor ferroelectric Pb(Mg1/3Nb2/3)O3–PbTiO3 (PMN–PT).62 Meanwhile, the rapid increase in dielectric loss is attributed to the significant enhancement in the conductivity of BF–BT ceramics above 200 °C.19,63,64 To characterize the relaxor characteristics of the BF30BT ceramic, the modified Curie–Weiss law was applied using eqn (1) and (2):
| ε = C/(T − To) | (1) |
 | (2) |
To better understand the relaxor characteristics of the BF30BT ceramic, the empirical Vogel–Fulcher law is used to fit the experimental data with eqn (3):
 | (3) |
 | ||
Fig. 4 (a) Relationship between and inverse dielectric permittivity 10![[thin space (1/6-em)]](https://www.rsc.org/images/entities/char_2009.gif) 000/εr of BF30BT ceramics; (b) Curie–Weiss fitting line of BF30BT ceramics; and (c) Vogel–Fulcher fitting curves of BF30BT ceramics. 000/εr of BF30BT ceramics; (b) Curie–Weiss fitting line of BF30BT ceramics; and (c) Vogel–Fulcher fitting curves of BF30BT ceramics. | ||
To investigate these effects further, PFM was employed to study the domain configurations of the unpoled BF30BT ceramic at room temperature. As shown in Fig. 5a, the domain morphology of the ceramic includes heterogeneous structures of island-like and stripe domains. Furthermore, as an enlarged view of Fig. 5a (block, white dashed lines), Fig. 5b clearly demonstrates the coexistence of typical herringbone domains and nanodomains, which always exhibit a relatively strong piezoelectric response to tip voltage. It should be emphasized that in the KNN81 and BF82 systems, herringbone domains are usually connected with 90° domain walls, which is related to the T phase in the BF–BT ceramic systems. Interestingly, meandering striped domains were observed in small grains of the same ceramic sample (Fig. 5c). This domain structure is somewhat blurry and shows a weak polar state in response to the tip, which is very similar to the PFM response of nanoscale heterogeneity in NBT–BT,83 and it has been broadly defined as a nanodomain structure with symmetry of the underlying crystal symmetry in BNT84 and KNN85. Such nanoscale heterogeneity is usually sensitive to external electric fields, and the coexistence of large-sized domains and nanodomains can result in some nanodomains being clamped by large-sized domains after poling and failing to return to their initial state after the external electric field is removed.86 This phenomenon is also confirmed by the PFM morphology of the poled sample (Fig. S3, ESI†), which showed a strong piezoelectric response and much lower domain wall density than the unpoled samples.87 Simultaneously, as stated previously, certain nanoscale domains have not been merged into the large-domain structure, corresponding to local heterogeneity, which is difficult to completely eliminate via poling.
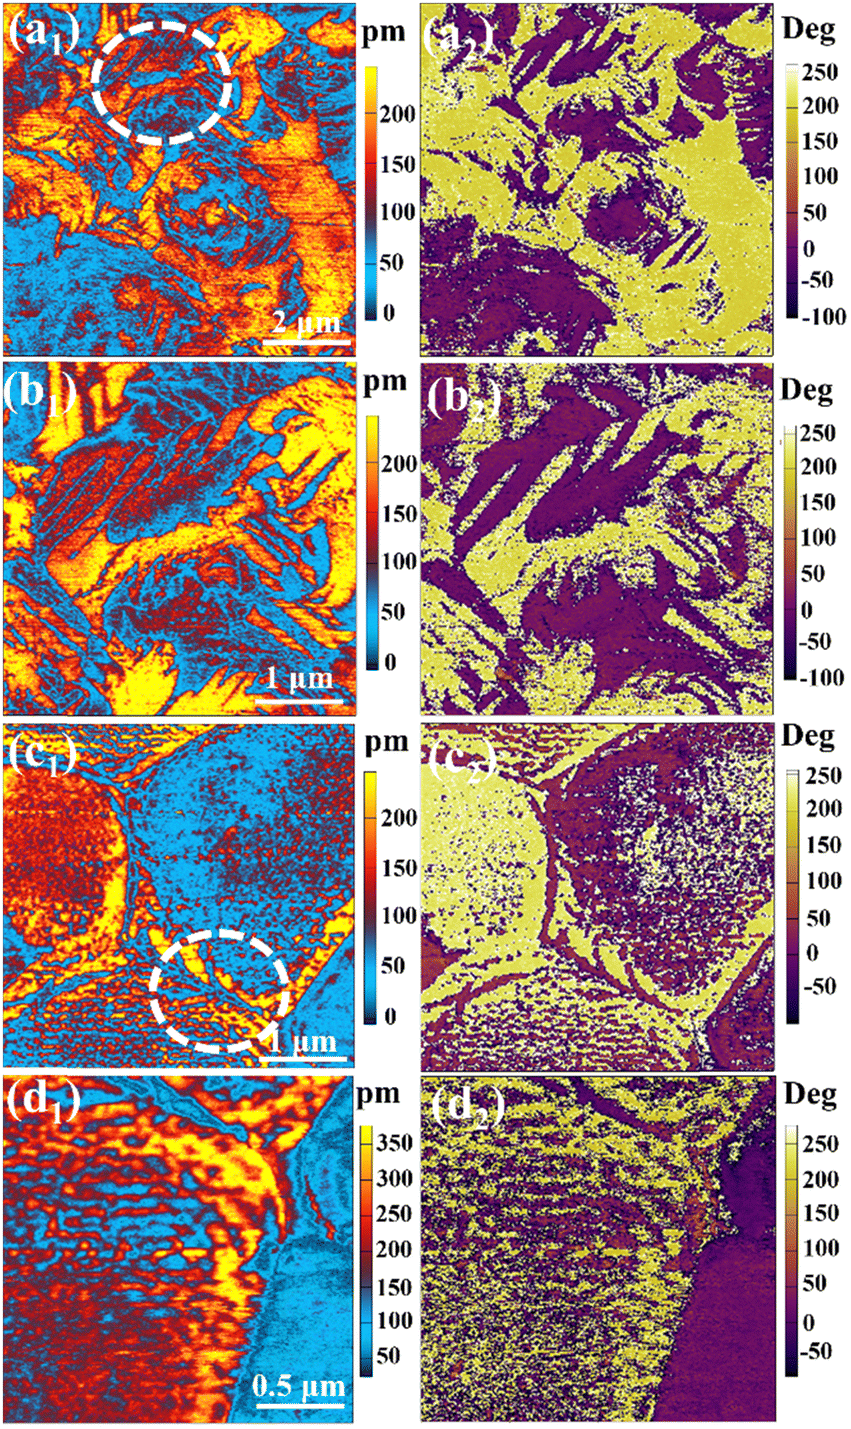 | ||
| Fig. 5 (a)–(d) Amplitude and corresponding phase pattern of unpoled BF30BT ceramics with different areas; and (b) and (d) enlarged views of (a) and (c). | ||
Furthermore, as the temperature-dependent phase structure is the foundation for evaluating the domain dynamics and piezoelectric contributions, in situ XRD measurements were employed to analyze the structural transition of both poled and unpoled samples from room temperature to 450 °C (Fig. 6a and c). Within the testing temperature range, BF30BT displayed a perovskite structure with characteristic peaks that gradually moved towards lower angles due to the thermal expansion of the lattice. It is worth mentioning that poled BF30BT displays a modest low-angle shift in 2θ. This phenomenon is primarily driven by the crystal structural distortion attributed to external electric fields,60,88 resulting in variations of lattice parameters such as an increase in tetragonality and the rhombohedral tilting angle of 90° − α, which is consistent with the refinement results in Fig. 7a and b. In general, the ferroelectric space group R3c can be regarded as the ideal paraelectric cubic phase Pmm frozen by two lattice distortion modes: (i) polar displacements of Bi3+ and Fe3+ along the [001] direction and (ii) antiferrodistortive distortion rotation of the oxygen octahedron around the [001] axis. These distortions are most noticeable at the characteristic 111pc peak of R3c.48,89,90 As illustrated in Fig. 6b and d, the 111pc peak progressively weakens and moves to a lower angle with increasing temperature, suggesting that R3c eventually converts into R3m, and the total fraction of the rhombohedral phase decreases.
 | ||
| Fig. 6 In situ XRD patterns of BF30BT ceramics with unpoled and poled states measured at different temperatures within (a) and (c) 2θ = 10°–80° and (b) and (d) 2θ = 38.5°–39.5°. | ||
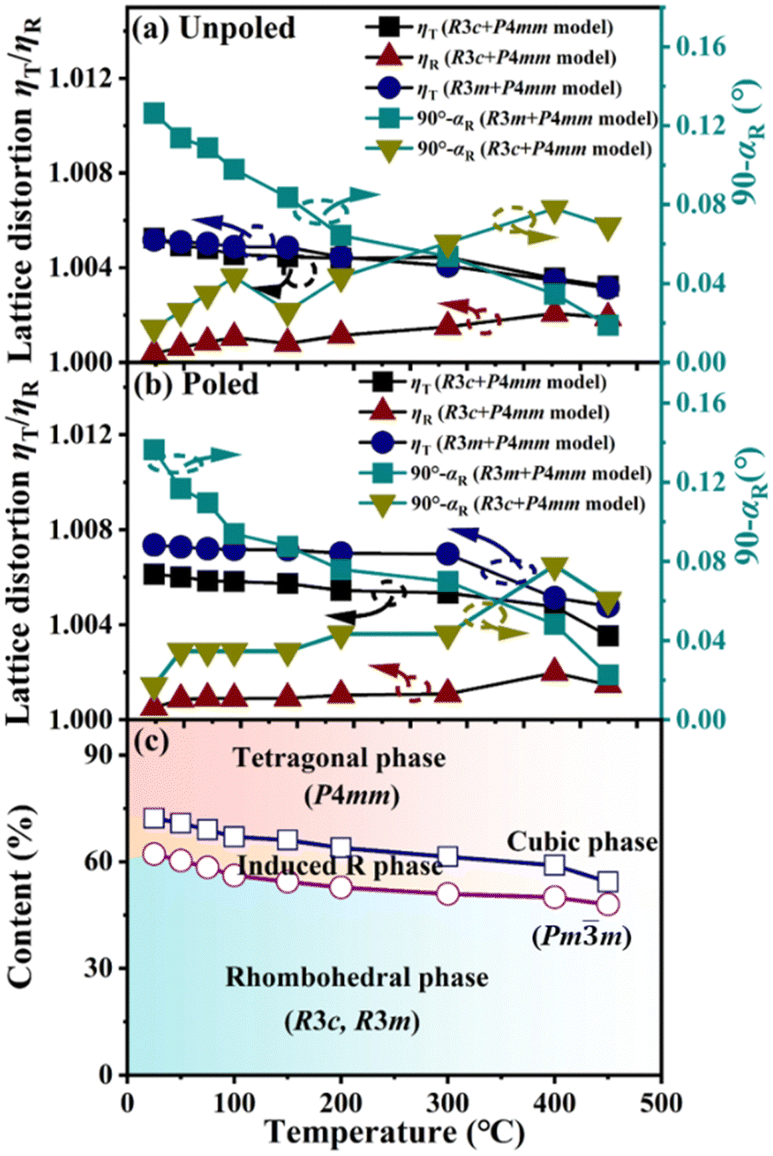 | ||
Fig. 7 (a) and (b) Crystal structure distortion of BF30BT ceramics with ηT = cT/aT and  ; and (c) schematic phase diagram of BF30BT ceramics. ; and (c) schematic phase diagram of BF30BT ceramics. | ||
To further investigate the phase structure, we used several phase combinations (R3m + P4mm, R3c + P4mm, R3m + Pmm, and R3c + Pmm, modes) for XRD refinement. It should be emphasized that R3c and R3m cannot be reliably differentiated in proportion due to the structural similarities and resolution of the measurement method used here. Typically, lattice distortion can be estimated using  ,61,91 as illustrated in Fig. 7a, b and Tables S2, S3 (ESI†). During heating, the lattice progressively expanded, and the distortion gradually decreased, indicating a transition from a low- to a high-symmetry phase. Furthermore, as the temperature increases, the template combination fitting results for R3m + P4mm increasingly outperform those for R3c + P4mm (see Tables S1 and S2, ESI†), which is consistent with the conclusion that the fraction of the R3m phase fraction increases. This transition also occurs in other BF–BT20 ceramic systems, particularly in pure BF systems.90 The oxygen octahedron's tilt state changes due to thermal vibration at high temperatures, but the polarization direction remains stable. Since several experimental studies and first-principle calculations indicate that the tilt of the oxygen octahedron suppresses the ferroelectric polarization,92,93 the R3m phase without the tilt of the oxygen octahedron is more favorable in lowering the polarization rotation barrier and enhancing the piezoelectric performance, which results in the improvement of piezoelectric performance within a certain temperature range.20 Based on the above-refined results and analysis, the phase diagrams of poled and unpoled BF30BT are shown in Fig. 7c. The fraction of R3c changes from 62% to 72% due to the poling process. The energy provided by the electric field during the poling process helps the ground state of the tetragonal phase overcome the energy barrier and transform into a low-symmetry rhombohedral phase. Increasing the temperature generates larger and more frequent thermal fluctuations, which lead to the high symmetry of tetragonal phase within the whole system, while within the rhombohedral phase, it also undergoes a transformation from R3c to R3m. As the temperature approaches the Curie temperature, the entire system gradually transitions into a state dominated by the paraelectric cubic phase.
In general, compared to ergodic RFE, NHPRs in nonergodic RFE will not entirely revert to the unoriented state after removing the external electric field,32,36 especially in poled BF–BT, where NHPRs and LRO structures coexist at room temperature. The behavior of such a complicated system at high temperatures directly affects the device's dependability. To understand the domain dynamics during the heating process, temperature-dependent dielectric and small-signal piezoelectric coefficients were investigated from −150 to 450 °C under a constant −15 MPa uniaxial preload as a function of frequency from 0.5 Hz to 140 Hz (Fig. 8). The applied stress does not significantly change the domain wall density and structure within the range of the sub-coercive field for Rayleigh analysis,39 as the −15 MPa preload used in our experiment is far lower than the −500 MPa coercive field of BF–BT ceramics reported in the literature.94 Here, the dielectric anomaly corresponding to the re-entrant temperature of around 75 °C is more visible in Fig. 8b, indicating that the effect of re-entrant behavior on the direct piezoelectric effect cannot be disregarded. In general, the temperature increase leads to a d33 enhancement, which subsequently decreases at high temperatures due to the loss of electric field-induced macroscopic polarization. Usually, the following equation is employed to estimate the piezoelectric response of ferroelectrics:
| d33 = 2QεP | (4) |
 | ||
| Fig. 8 (a) Temperature-dependent d33 and (b) enlarged dielectric permittivity of BF–BT with different frequencies under uniaxial compressive stress of −15 MPa. | ||
Here, frequency-dependent Rayleigh behavior is employed to further investigate the piezoelectric response, as follows:
| d33 = d0 + βωA | (5) |
The Rayleigh parameters d0 and β reveal different regions throughout the heating process for BF30BT (Fig. 9). Initially, within the low-temperature range (−150–0 °C), both the frequency-independent contribution component d0 and frequency-dependent contribution β increase. This phenomenon has also been observed in PZT and Bi1/2K1/2TiO3 systems,43,98 where the increase of d0 is primarily due to the activation and expansion of the lattice, and the enhancement of frequency-dependent contribution β is likely attributed to the thermal activation of frozen macro- and nanodomains, resulting in the enhancement of the domain wall motion.97,98 Upon further heating to the temperature range of 0–100 °C, d0 continues to increase with a small peak near 75 °C, while β exhibits a modest decreasing trend despite the enhanced thermal energy, which should increase domain activation and enhance domain wall motion. It should be noted that the dielectric and piezoelectric responses of the BF–BT ceramics show an apparent decoupling with frequency near room temperature100; hence, variations in this temperature range may be mainly ascribed to the impact of re-entrant behavior. In general, NHPRs will transform into LRO structures around the re-entrant temperature,19,75,78,101i.e., nanodomains will transform into macrodomains near 75 °C, thereby reducing the domain wall density. This phenomenon is common in other ferroelectric materials with re-entrant behavior, such as (1 − x)BaTiO3–xBiScO378 and (Ba0.925Bi0.05)(Ti1−xSnx)O3.101 On the one hand, the large domains may interact and potentially clamp small domains during the heating process, causing a decrease in their mobility.102–104 The above two factors are suggested to decrease the frequency-dependent β and result in a peak of d0 near the re-entrant temperature of 75 °C. Usually, local heterogeneity is mainly caused by A- and B-site atom disorder, which can be aligned when an electric field is applied but returns to its disordered state when the electric field is removed. This rapid response to external electric fields that nanodomain activity is more likely to be estimated in the frequency-independent response d0 rather than frequency-dependent β within the test frequency.38
 | ||
| Fig. 9 (a) Temperature-dependent variation in d0 and (b) frequency Rayleigh coefficient β for the BF30BT ceramics under a pre-stress of −15 MPa. | ||
Within the temperature range of 100–200 °C, β increases, although the underlying mechanism is unclear. It is suggested that increasing the temperature may increase β through enhanced activation of non-180° domain wall motion, which in turn boosts the frequency dispersion of the piezoelectric response.42,43,97,98 Furthermore, as shown by in situ XRD, increasing the temperature encourages the conversion of R3c to R3m, leading to an enhancement of the piezoelectric performance, which is a component of the frequency-independent response d0.20,90 When the temperature increases to 200–350 °C, thermally activated defect dipoles105 may reduce the pinning effect on the domain wall, allowing non-180° domain walls to move faster, ultimately reducing the frequency dispersion. Within this temperature range, lattice deformations caused by heating, such as symmetry, lattice expansion, and reduced distortion, dominate the contribution of d0, which is also observed in materials Bi1/2K1/2TiO343 and Pb(Zr,Ti)O3.39 After the temperature exceeds 350 °C, BF30BT begins to lose its polarization state, resulting in a drop in d0 and β.106
In addition to the frequency, the intrinsic and extrinsic contributions to the piezoelectric response are significantly influenced by the applied stress amplitude. The former refers to crystal lattice deformation caused by external fields, such as electric fields and pressure, while the latter comes from other effects, such as the movement of domain walls or interphase boundaries. The intrinsic contribution is generally reversible, while the extrinsic contribution can include both reversible and irreversible components.39 The stress amplitude-dependent measurement of d33 with a fixed frequency (10 Hz) was used to investigate the domain dynamics with the Rayleigh model, which is commonly used to identify reversible and irreversible piezoelectric responses.39 It should be noted that the measurement of stress amplitude-dependent Rayleigh behavior starts at room temperature since the freezing of the lattice and domain wall motion at low temperatures results in little difference in the piezoelectric response under different amplitudes. As shown in Fig. 10, the trend with low stress is comparable to the previous frequency-dependent data shown in Fig. 8a. Notably, stress amplitude dependence is not observed until above approximately 200 °C, indicating that irreversible contributions such as domain wall motion start accumulating, which corresponds well with previous observations.
 | ||
| Fig. 10 Temperature-dependent d33 with varying amplitudes for BF30BT at 10 Hz under a pre-stress of −15 MPa. | ||
Additionally, the stress-dependent Rayleigh behavior was used to fit the experimental data in order to determine the reversible and irreversible contributions as a function of temperature, as follows:
| d33 = dinit + ασA | (6) |
 | ||
| Fig. 11 (a) Temperature-dependent variation in dinit, (b) Rayleigh coefficient α, and (c) estimated extrinsic contribution at BF30BT ceramics at 10 Hz under a pre-stress of −15 MPa. | ||
Based on the data presented in this work, Fig. 12 is proposed to depicts the possible domain dynamic stages in BF30BT with variations in temperature. The initial state consists of randomly oriented long-range ordered macrodomains (illustrated by the thick arrow) and local heterogeneous nanodomains (illustrated by the thin arrow). After electrical poling, the macrodomains tend to orient with the applied field, resulting in the coalescence of smaller polar regions into larger domains, thereby lowering the domain wall density. The nanodomains reorient arbitrarily once the external electric field is removed due to their high activity. Moreover, as the temperature changes, the evolution of domain dynamics will likely undergo the following five stages:
 | ||
| Fig. 12 Schematic representation of the possible stages of temperature-dependent domain dynamics in BF30BT ceramics contributing to the microscopic piezoelectric response. | ||
Stage I (−150 to 0 °C): when the poled ceramic is at a low temperature, both macro- and nanodomains freeze. With increasing temperature, the domains become progressively more active with increasing thermal activation, resulting in a temperature-dependent piezoelectric response. Here, piezoelectric characteristics are mostly derived from the intrinsic contribution of the macrodomain lattice response.
Stage II (0–100 °C): when the temperature increases, nanodomains tend to orient with the polarization direction of the macrodomain, forming LRO structures due to the influence of re-entrant relaxor behavior. It should be noted that because macrodomains do not fully recover from the frozen state within this stage, the piezoelectric properties are more likely to originate from rapid lattice responses, nanodomains, and reversible domain wall motion.
Stage III (100–200 °C): the behavior of the grains is transitional when the temperature reaches this stage, which involves a mixed active and normal state of the macrodomain, leading to fluctuations in the piezoelectric response. The apparent frequency dispersion of the piezoelectric characteristics shows that extrinsic contributions, such as domain wall motion, become active.
Stage IV (200–350 °C): all domains become active, and the piezoelectric frequency dispersion is slightly decreased compared to the previous stage. Although extrinsic contributions, including domain wall motion, play an essential role at this stage, the piezoelectric response is still dominated by the lattice contributions.
Stage V (350–400 °C): above 350 °C, the LRO structure inside the ceramic grains begins to break, thereby increasing the domain wall density (both macro- and nanodomains) while decreasing the overall piezoelectric response. It is expected that the ceramics will finally completely depolarize as the temperature increases (>450 °C). Furthermore, in situ temperature-dependent TEM and local structural analysis are required to validate the proposed domain dynamics model.
4. Conclusions
The domain dynamics of high-temperature piezoelectric ceramic BF30BT were investigated through a combination of temperature-dependent structural analysis as well as dielectric and piezoelectric properties. Based on an analysis of its relaxor properties and microstructure, we found that BF30BT ceramics coexist in the R-T phase at room temperature and contain both macro- and nanodomains. Surprisingly, during the subsequent characterization of the Rayleigh behavior, we observed that nanodomains primarily demonstrate an intrinsic and reversible contribution because of their rapid reaction in the low-temperature region, which has received limited attention in previous investigations. As detailed in this work, we also discovered that the enhancement of high-temperature piezoelectric characteristics is primarily due to the reversible contribution of lattice deformation, with the remainder attributed to irreversible contributions such as active domain wall motion. We believe that decoding the domain dynamics and the mechanism of piezoelectric contributions can provide a more in-depth understanding of the physical properties of high-temperature ferroelectrics and piezoelectric materials, which are meaningful for further research and applications.Data availability
The data that support the findings of this study are available from the corresponding author upon reasonable request.Conflicts of interest
There are no conflicts to declare.Acknowledgements
N. H. K., A. G. and K. G. W. gratefully acknowledge the financial support for this work by the Deutsche Forschungsgemeinschaft (DFG) under GRK2495/H. L. X. X., T. Z., and J. G. Z. acknowledge the support of the National Natural Science Foundation of China (52032007), the Sichuan Science and Technology Program (23ZDYF0173), the Natural Science Foundation of Sichuan Province (24NSFSC5385 and 2024NSFSC1383), and the China Scholarship Council (No. 20200624013). We also appreciate Ms. Hui Wang from the Analytical & Testing Center of Sichuan University for help with SEM characterization.References
- J. Rödel, W. Jo, K. T. P. Seifert, E.-M. Anton, T. Granzow and D. Damjanovic, J. Am. Ceram. Soc., 2009, 92, 1153–1177 CrossRef.
- J. Rödel, K. G. Webber, R. Dittmer, W. Jo, M. Kimura and D. Damjanovic, J. Eur. Ceram. Soc., 2015, 35, 1659–1681 CrossRef.
- D. Wang, G. Wang, S. Murakami, Z. Fan, A. Feteira, D. Zhou, S. Sun, Q. Zhao and I. M. Reaney, J. Adv. Dielectr., 2019, 08 CAS.
- T. R. Shrout and S. Zhang, J. Electroceram., 2007, 19, 113–126 CrossRef.
- W. Shi, S. Guan, X. Li, J. Xing, F. Zhang, N. Chen, Y. Wu, H. Xu, Y. Xu and Q. Chen, J. Eur. Ceram. Soc., 2022, 42, 6968–6976 CrossRef CAS.
- C. Long, W. Zhou, W. Ren, Y. Zhang, K. Zheng and L. Liu, Scr. Mater., 2021, 204, 114102 CrossRef CAS.
- H. Yan, H. Ning, Y. Kan, P. Wang and M. J. Reece, J. Am. Ceram. Soc., 2009, 92, 2270–2275 CrossRef CAS.
- H. Tao, H. Wu, Y. Liu, Y. Zhang, J. Wu, F. Li, X. Lyu, C. Zhao, D. Xiao, J. Zhu and S. J. Pennycook, J. Am. Chem. Soc., 2019, 141, 13987–13994 CrossRef CAS PubMed.
- T. Mondal, S. Das, T. Badapanda, T. P. Sinha and P. M. Sarun, Phys. B, 2017, 508, 124–135 CrossRef CAS.
- J. Wang, J. B. Neaton, H. Zheng, V. Nagarajan, S. B. Ogale, B. Liu, D. Viehland, V. Vaithyanathan, D. G. Schlom, U. V. Waghmare, N. A. Spaldin, K. M. Rabe, M. Wuttig and R. Ramesh, Science, 2003, 299, 1719–1722 CrossRef CAS PubMed.
- H. Zhang, W. Jo, K. Wang and K. G. Webber, Ceram. Int., 2014, 40, 4759–4765 CrossRef CAS.
- S. O. Leontsev and R. E. Eitel, J. Mater. Res., 2011, 26, 9–17 CrossRef CAS.
- C. Li, T. Zheng and J. Wu, Acta Mater., 2021, 206, 116601 CrossRef CAS.
- M. H. Lee, D. J. Kim, J. S. Park, S. W. Kim, T. K. Song, M. H. Kim, W. J. Kim, D. Do and I. K. Jeong, Adv. Mater., 2015, 27, 6976–6982 CrossRef CAS.
- A. A. Bokov and Z.-G. Ye, J. Adv. Dielectr., 2012, 02, 1241010 CrossRef.
- A. A. Bokov and Z.-G. Ye, J. Mater. Sci., 2006, 41, 31–52 CrossRef CAS.
- Z. Chen, X. Bai, H. Wang, J. Du, W. Bai, L. Li, F. Wen, P. Zheng, W. Wu, L. Zheng and Y. Zhang, Ceram. Int., 2020, 46, 11549–11555 CrossRef CAS.
- C. Zhou, H. Yang, Q. Zhou, Z. Cen, W. Li, C. Yuan and H. Wang, Ceram. Int., 2013, 39, 4307–4311 CrossRef CAS.
- Z. Yang, B. Wang, T. Brown, S. J. Milne, A. Feteira, A. Wohninsland, K. V. Lalitha, Y. Li and D. A. Hall, J. Mater. Chem. C, 2023, 11, 2186–2195 RSC.
- L. Xie, M. Mo, H. Chen, Y. Xie, Y. Cheng, C. Shu, Q. Chen, J. Xing, Z. Tan, J. Zhu and H. Zhu, J. Mater. Chem. A, 2022, 10, 22540–22550 RSC.
- S. Cheng, B.-P. Zhang, L. Zhao and K.-K. Wang, J. Am. Ceram. Soc., 2019, 102, 7355–7365 CrossRef CAS.
- S. O. Leontsev and R. E. Eitel, J. Am. Ceram. Soc., 2009, 92, 2957–2961 CrossRef CAS.
- Y. Zhang, R. Huang, F. Zhang, Z. Liang, T. Xie, H.-T. Lin and Y. Dai, J. Am. Ceram. Soc., 2023, 106, 2384–2392 CrossRef CAS.
- X. Chen, H. Qin, H. Li, Y. Du, S. Wang, P. Li, Y. Hu, L. Liu, J. Zhao and D. Wang, J. Am. Ceram. Soc., 2024, 107, 4232–4241 CrossRef CAS.
- L. Wu, X. Wang and L. Li, RSC Adv., 2016, 6, 14273–14282 RSC.
- Z. Yang, H. Du, L. Jin, Q. Hu, H. Wang, Y. Li, J. Wang, F. Gao and S. Qu, J. Mater. Chem. A, 2019, 7, 27256–27266 RSC.
- X. Dong, X. Li, X. Chen, J. Wu and H. Zhou, Chem. Eng. J., 2021, 409, 128231 CrossRef CAS.
- D. Viehland, S. J. Jang, L. E. Cross and M. Wuttig, J. Appl. Phys., 1990, 68, 2916–2921 CrossRef CAS.
- H. Li, J. Zhao, Y. Li, L. Chen, X. Chen, H. Qin, H. Zhou, P. Li, J. Guo and D. Wang, ACS Appl. Mater. Interfaces, 2024, 16, 9078–9087 CrossRef CAS PubMed.
- F. Zeng, C. Zhou, C. Zhang, L. Jiang, J. Zhang, H. Guo, Y. Chen, W. Lu, W. Cai, G. Zhang, Y. Hu and G. Fan, Ceram. Int., 2022, 48, 10539–10546 CrossRef CAS.
- G. Wang, Z. Fan, S. Murakami, Z. Lu, D. A. Hall, D. C. Sinclair, A. Feteira, X. Tan, J. L. Jones, A. K. Kleppe, D. Wang and I. M. Reaney, J. Mater. Chem. A, 2019, 7, 21254–21263 RSC.
- F. Li, S. Zhang, D. Damjanovic, L.-Q. Chen and T. R. Shrout, Adv. Funct. Mater., 2018, 28, 1801504 CrossRef.
- Y. Imry and S.-k Ma, Phys. Rev. Lett., 1975, 35, 1399–1401 CrossRef CAS.
- K.-H. Kim, D. A. Payne and J.-M. Zuo, Phys. Rev. B: Condens. Matter Mater. Phys., 2012, 86, 184113 CrossRef.
- H. Takenaka, I. Grinberg, S. Liu and A. M. Rappe, Nature, 2017, 546, 391–395 CrossRef CAS PubMed.
- F. Li, D. Lin, Z. Chen, Z. Cheng, J. Wang, C. Li, Z. Xu, Q. Huang, X. Liao, L.-Q. Chen, T. R. Shrout and S. Zhang, Nat. Mater., 2018, 17, 349–354 CrossRef CAS.
- J. Yin, X. Shi, H. Tao, Z. Tan, X. Lv, X. Ding, J. Sun, Y. Zhang, X. Zhang, K. Yao, J. Zhu, H. Huang, H. Wu, S. Zhang and J. Wu, Nat. Commun., 2022, 13, 6333 CrossRef CAS PubMed.
- S. Kim, R. Miyauchi, Y. Sato, H. Nam, I. Fujii, S. Ueno, Y. Kuroiwa and S. Wada, Adv. Mater., 2023, 35, 2208717 CrossRef CAS.
- D. Damjanovic, J. Appl. Phys., 1997, 82, 1788–1797 CrossRef CAS.
- D. Damjanovic, J. Am. Ceram. Soc., 2005, 88, 2663–2676 CrossRef CAS.
- J. J. Prejean and J. Souletie, J. Phys., 1980, 41, 1335–1352 CrossRef CAS.
- A. Gadelmawla, U. Eckstein, K. Riess, Y.-X. Liu, K. Wang, J.-F. Li, K.-I. Kakimoto, N. H. Khansur and K. G. Webber, J. Am. Ceram. Soc., 2023, 106, 2326–2337 CrossRef CAS.
- G. E. Eyoum, U. Eckstein, K. Riess, A. Gadelmawla, E. Springer, K. G. Webber and N. H. Khansur, J. Mater. Sci.: Mater. Electron., 2022, 57, 15843–15861 CrossRef CAS.
- C. Zhou, H. Yang, Q. Zhou, G. Chen, W. Li and H. Wang, J. Mater. Sci.: Mater. Electron., 2013, 24, 1685–1689 CrossRef CAS.
- Y. Yin, Y. Tang, W. Pan, A. Song, J. Yu and B. Zhang, Ceram. Int., 2021, 47, 9486–9494 CrossRef CAS.
- J. Xing, Z. Tan, X. Chen, L. Jiang, W. Wang, X. Deng, B. Wu, J. Wu, D. Xiao and J. Zhu, Inorg. Chem., 2018, 58, 428–438 CrossRef.
- F. H. Schader, D. Isaia, M. Weber, E. Aulbach and K. G. Webber, J. Mater. Sci., 2018, 53, 3296–3308 CrossRef CAS.
- S. Cheng, L. Zhao, B. Zhang and K. Wang, Ceram. Int., 2019, 45, 10438–10447 CrossRef CAS.
- B. Xun, N. Wang, B. Zhang, X. Chen, Y. Zheng, W. Jin, R. Mao and K. Liang, Ceram. Int., 2019, 45, 24382–24391 CrossRef.
- J. Xing, Z. Tan, L. Xie, L. Jiang, J. Yuan, Q. Chen, J. Wu, W. Zhang, D. Xiao and J. Zhu, J. Am. Ceram. Soc., 2018, 101, 1632–1645 CrossRef CAS.
- Y. Yoneda, K. Yoshii, S. Kohara, S. Kitagawa and S. Mori, Jpn. J. Appl. Phys., 2008, 47, 7590 CrossRef CAS.
- L.-F. Zhu, X.-W. Lei, L. Zhao, M. I. Hussain, G.-Z. Zhao and B.-P. Zhang, Ceram. Int., 2019, 45, 20266–20275 CrossRef CAS.
- Y. Kuroiwa, S. Kim, I. Fujii, S. Ueno, Y. Nakahira, C. Moriyoshi, Y. Sato and S. Wada, Commun. Mater., 2020, 1, 71 CrossRef.
- I. Levin, D. S. Keeble, G. Cibin, H. Y. Playford, M. Eremenko, V. Krayzman, W. J. Laws and I. M. Reaney, Chem. Mater., 2019, 31, 2450–2458 CrossRef CAS.
- T. Liu, W. Qian, Y. Jiang, J. Xing, W. Xuan, J. Chen, J. Cheng and H. Gu, J. Eur. Ceram. Soc., 2023, 44, 2866–2873 CrossRef.
- G. Wang, T. Hu, W. Zhu, Z. Lu, A. Kleppe, M. Diaz Lopez, A. Feteira, D. C. Sinclair, Z. Fu, H. Huang, D. Wang and I. M. Reaney, Phys. Rev. Lett., 2023, 130, 076801 CrossRef CAS PubMed.
- I. Calisir and D. A. Hall, J. Mater. Chem. C, 2018, 6, 134–146 RSC.
- B.-W. Xun, Y.-C. Tang, J.-Y. Chen and B.-P. Zhang, J. Eur. Ceram. Soc., 2019, 39, 4085–4095 CrossRef CAS.
- F. Li, M. J. Cabral, B. Xu, Z. Cheng, E. C. Dickey, J. M. LeBeau, J. Wang, J. Luo, S. Taylor, W. Hackenberger, L. Bellaiche, Z. Xu, L.-Q. Chen, T. R. Shrout and S. Zhang, Science, 2019, 364, 264–268 CrossRef CAS.
- J. Chen, J. E. Daniels, J. Jian, Z. Cheng, J. Cheng, J. Wang, Q. Gu and S. Zhang, Acta Mater., 2020, 197, 1–9 CrossRef CAS.
- N. H. Khansur, M. Hinterstein, Z. Wang, C. Groh, W. Jo and J. E. Daniels, Appl. Phys. Lett., 2015, 107, 242902 CrossRef.
- C. J. Stringer, N. J. Donnelly, T. R. Shrout, C. A. Randall, E. F. Alberta and W. S. Hackenberger, J. Am. Ceram. Soc., 2008, 91, 1781–1787 CrossRef CAS.
- B. Li, T. Zheng and J. Wu, ACS Appl. Mater. Interfaces, 2021, 13, 37422–37432 CrossRef CAS.
- K. H. Härdtl, Ceram. Int., 1982, 8, 121–127 CrossRef.
- Z.-G. Ye and A. A. Bokov, Ferroelectrics, 2004, 302, 227–231 CrossRef CAS.
- R. D. Shannon and C. Prewitt, Acta Crystallogr., Sect. A: Cryst. Phys., Diffr., Theor. Gen. Crystallogr., 1976, 32, 751 CrossRef.
- G. Burns and F. H. Dacol, Solid State Commun., 1983, 48, 853–856 CrossRef CAS.
- S. B. Vakhrushev, B. E. Kvyatkovsky, A. A. Naberezhnov, N. M. Okuneva and B. P. Toperverg, Ferroelectrics, 1989, 90, 173–176 CrossRef CAS.
- S. Tsukada and S. Kojima, Phys. Rev. B: Condens. Matter Mater. Phys., 2008, 78, 144106 CrossRef.
- D. Viehland, S. J. Jang, L. E. Cross and M. Wuttig, Phys. Rev. B: Condens. Matter Mater. Phys., 1992, 46, 8003–8006 CrossRef PubMed.
- X. Dong, X. Li, H. Chen, Q. Dong, J. Wang, X. Wang, Y. Pan, X. Chen and H. Zhou, J. Adv. Ceram., 2022, 11, 729–741 CrossRef CAS.
- H. Yang, J. Zhao, J. Zhuang, M. Hinterstein, W. Ren, Z.-G. Ye and N. Zhang, J. Eur. Ceram. Soc., 2023, 43, 3289–3296 CrossRef CAS.
- A.-K. Fetzer, A. Wohninsland, K. Lalitha and H.-J. Kleebe, Phys. Rev. Mater., 2022, 6, 064409 CrossRef CAS.
- K. Dey, A. Ahad, K. Gautam, A. Tripathy, S. S. Majid, S. Francoual, C. Richter, M. N. Singh, A. Sagdeo, E. Welter, N. Vittayakorn, V. G. Sathe, R. Rawat and D. K. Shukla, Phys. Rev. B, 2021, 103, L100205 CrossRef CAS.
- V. V. Shvartsman and D. C. Lupascu, J. Am. Ceram. Soc., 2012, 95, 1–26 CrossRef CAS.
- B. Wang, C. Fu, X. Liu, B. Xie and D. A. Hall, Open Ceram., 2023, 13, 100322 CrossRef CAS.
- H. Yang, X. Wang, X. Yang, S. Guan, F. Huang, H. Zhang, H. Tan and Q. Chen, J. Eur. Ceram. Soc., 2024, 44, 3247–3257 CrossRef CAS.
- H. Y. Guo, C. Lei and Z.-G. Ye, Appl. Phys. Lett., 2008, 92, 172901 CrossRef.
- I. Levin, V. Krayzman, J. C. Woicik, F. Bridges, G. E. Sterbinsky, T. M. Usher, J. L. Jones and D. Torrejon, Phys. Rev. B, 2016, 93, 104106 CrossRef.
- M. Alguero, J. M. Gregg and L. Mitoseriu, Nanoscale Ferroelectrics and Multiferroics: Key Processing and Characterization Issues, and Nanoscale Effects, Wiley, vol. 2, 2016 Search PubMed.
- R. López-Juárez, O. Novelo-Peralta, F. González-García, F. Rubio-Marcos and M.-E. Villafuerte-Castrejón, J. Eur. Ceram. Soc., 2011, 31, 1861–1864 CrossRef.
- T. Zhao, A. Scholl, F. Zavaliche, K. Lee, M. Barry, A. Doran, M. P. Cruz, Y. H. Chu, C. Ederer, N. A. Spaldin, R. R. Das, D. M. Kim, S. H. Baek, C. B. Eom and R. Ramesh, Nat. Mater., 2006, 5, 823–829 CrossRef CAS PubMed.
- D. Gobeljic, V. V. Shvartsman, A. Belianinov, B. Okatan, S. Jesse, S. V. Kalinin, C. Groh, J. Rödel and D. C. Lupascu, Nanoscale, 2016, 8, 2168–2176 RSC.
- J. Yin, H. Tao, G. Liu and J. Wu, J. Am. Ceram. Soc., 2020, 103, 1881–1890 CrossRef CAS.
- C. Hu, X. Meng, M.-H. Zhang, H. Tian, J. E. Daniels, P. Tan, F. Huang, L. Li, K. Wang, J.-F. Li, Q. Lu, W. Cao and Z. Zhou, Sci. Adv., 2020, 6, eaay5979 CrossRef CAS PubMed.
- T. Zheng and J. Wu, Adv. Electron. Mater., 2020, 2000079 CrossRef CAS.
- J. Chen, C. Chen, S. Chang, C. Zhao and X. Jiang, Ceram. Int., 2024, 50, 11022–11031 CrossRef CAS.
- Z. Ning, Y. Jiang, J. Jian, J. Guo, J. Cheng, H. Cheng and J. Chen, J. Eur. Ceram. Soc., 2020, 40, 2338–2344 CrossRef CAS.
- J. Chen, J. Cheng, J. Guo, Z. Cheng, J. Wang, H. Liu and S. Zhang, J. Am. Ceram. Soc., 2019, 103, 374–381 CrossRef.
- J.-P. Zhou, R.-L. Yang, R.-J. Xiao, X.-M. Chen and C.-Y. Deng, Mater. Res. Bull., 2012, 47, 3630–3636 CrossRef CAS.
- H. D. Megaw and C. N. W. Darlington, Acta Crystallogr., Sect. A: Cryst. Phys., Diffr., Theor. Gen. Crystallogr., 1975, 31, 161–173 CrossRef.
- J. B. Neaton, C. Ederer, U. V. Waghmare, N. A. Spaldin and K. M. Rabe, Phys. Rev. B: Condens. Matter Mater. Phys., 2005, 71, 014113 CrossRef.
- X. Dai, Z. Xu, J. F. Li and D. Viehland, Appl. Phys. Lett., 1995, 77, 3354–3360 CAS.
- N. H. Khansur, J. Glaum, O. Clemens, H. Zhang, J. E. Daniels and K. G. Webber, Ceram. Int., 2017, 43, 9092–9098 CrossRef CAS.
- K. Uchino, S. Nomura, L. E. Cross, R. E. Newnham and S. Jang, J. Mater. Sci., 1981, 16, 569–578 CrossRef CAS.
- T. Rojac, A. Bencan, G. Drazic, M. Kosec and D. Damjanovic, J. Appl. Phys., 2012, 112, 064114 CrossRef.
- D. Damjanovic, Phys. Rev. B: Condens. Matter Mater. Phys., 1997, 55, R649–R652 CrossRef CAS.
- B. Kaeswurm, F. H. Schader and K. G. Webber, Ceram. Int., 2018, 44, 2358–2363 CrossRef CAS.
- Y. Li, T. Zheng, B. Li and J. Wu, J. Am. Ceram. Soc., 2023, 106, 2393–2406 CrossRef CAS.
- Z. Yang, Y. Li, B. Wang, J. Pan, A. K. Kleppe and D. A. Hall, J. Materiomics, 2023, 10, 57–69 CrossRef.
- M. Fang, Y. Ji, Z. Zhang, Y. Yang, C. Liu, D. Wang, L. Zhang, J. Gao and X. Ren, NPG Asia Mater., 2018, 10, 1029–1036 CrossRef CAS.
- C. A. Randall, N. Kim, J.-P. Kucera, W. Cao and T. R. Shrout, J. Am. Ceram. Soc., 1998, 81, 677–688 CrossRef CAS.
- M. E. Drougard and D. R. Young, Phys. Rev., 1954, 94, 1561–1564 CrossRef CAS.
- X. Lv, J. Wu, J. Zhu, D. Xiao and X. Zhang, J. Am. Ceram. Soc., 2018, 38, 85–94 Search PubMed.
- B. Li, C. Li, T. Zheng and J. Wu, Adv. Electron. Mater., 2022, 8, 2200609 CrossRef CAS.
- Y. Cui, X. Zhang, X. Lei, T. Yan, X. Chen, B. Peng, P. Ren, C. Li and L. Liu, J. Mater. Chem. C, 2022, 10, 8301–8309 RSC.
Footnote |
| † Electronic supplementary information (ESI) available. See DOI: https://doi.org/10.1039/d4tc01199f |
| This journal is © The Royal Society of Chemistry 2024 |