
 Open Access Article
 This Open Access Article is licensed under a Creative Commons Attribution-Non Commercial 3.0 Unported Licence
A low-cost, swift response, highly sensitive MOF-based dual sensing device enables detection of ultralow humidity levels and solvent polarity changes†
T.
Leelasree
a,
P. N.
Sidhartha
b,
Manav
Tathacharya
b,
Karumbaiah N.
Chappanda
bc and
Himanshu
Aggarwal
 *ad
*ad
aDepartment of Chemistry, Birla Institute of Technology and Science, Hyderabad Campus, Hyderabad 500078, India. E-mail: himanshu.aggarwal@hyderabad.bits-pilani.ac.in
bDepartment of Electronics and Electrical Engineering, Birla Institute of Technology and Science, Hyderabad Campus, Hyderabad 500078, India
cSensors and Nano Electronics (SANE) Lab, School of Applied Engineering and Technology, Southern Illinois University Carbondale, Illinois - 62901, USA
dMaterials Center for Sustainable Energy & Environment (McSEE), Birla Institute of Technology and Science, Hyderabad Campus, Hyderabad 500078, India
First published on 24th April 2024
Abstract
Detection of ultra-low humidity levels is very important; however, developing highly sensitive and rapid ultra-low humidity sensors is challenging due to the low water adsorption capacity, lack of hydrophilic interaction sites, and limited stabilities of most materials. Metal–organic frameworks (MOFs), a burgeoning class of porous materials, known for their high porosity and stability, could be potential candidates for designing humidity sensing devices. Herein, we report and detail the fabrication of a MOF-based capacitive dual sensor that can detect ultralow humidity levels and distinguish between polar and non-polar solvents. Solvent vapor adsorption experiments have been carried out to correlate the adsorption trends with the sensor's capability to detect different solvents such as water, methanol, ethanol, acetone, hexane, etc. [Eu(BTC)]-MOF exhibits higher water adsorption capacity over other polar and non-polar solvents. The detection limit of the sensor is as low as 0.84 ppm and it displays a very low hysteresis of ∼0.03% [ΔC/C0 (%)]. The device also shows an exceptional atmospheric stability over a period of one month with no decline in its performance. Additionally, the [Eu(BTC)]-MOF-based device has been investigated as a real-time humidity sensor for glove box-related applications and a suitable mechanism has been proposed for the exceptional sensing behavior of the MOF device.
1. Introduction
Humidity monitoring is critical for maintaining desirable atmospheric conditions for physiological survival and daily life activities. Notably, the real-time monitoring of humidity changes is of utmost importance in the fields of agriculture (grain storage), medicine, biotechnology, meteorology, and the manufacture of electrical goods.1–3 There has been a growing need for ultralow humidity sensors for maintaining highly inert conditions with no or exceptionally low moisture content for some prime applications like glove boxes in the range of 0–10 ppm. Similarly, for circuit fabrication and the functioning of transformer oil and plutonium trays, the moisture content should be in the range of 10–30 ppm.4–8 Nevertheless, it is highly challenging to design humidity sensors operating at such low concentrations due to their poor sensitivity, high noise, and challenging signal digitization. Limited hydrophilicity of the material is another important reason that restricts their operation at low humidity conditions.9,10 It is thus important to design low cost, stable, selective, and reliable humidity sensors that can rapidly and precisely detect small humidity changes in the ppm or even ppb ranges.The fabrication of ultralow humidity sensors necessitates careful selection of the sensing material that demonstrates excellent water stability and can adsorb a good amount of water molecules at low relative humidity levels (RH < 10%).11,12 This can be achieved by synthesizing materials that possess open metal sites or hydrophilic functional groups like OH and NH2, etc. Due to their unique structural characteristics and highly porous nature, metal–organic frameworks (MOFs), a unique class of hybrid porous materials, have piqued the interest of numerous researchers in various sectors such as catalysis, sensing, gas storage and separation.13–17 MOFs are frequently used in the field of humidity sensing because of their good water adsorption properties, uniform pore size, high stability, and versatile design possibilities compared to conventional amorphous materials, metal oxides, and polymers.18–22 MOFs such as HKUST-1, NH2-MIL-125(Ti), and MIL-96(Al) have been previously explored for humidity sensing due to their good water adsorption capacity and hydrophilicity.23–26 However, there are only a handful of reports on MOF-based capacitive-type humidity sensors that can operate under ultra-low relative humidity ranges of below 10%.27,28
Despite their excellent water adsorption capacities, MOF materials have been seldom used for fabrication of real-time humidity sensing devices. This is owing to their inherent low electrical conductivity. The electrical humidity sensors work on the principle of detecting changes in electrical signals produced by the transduction mechanism. The change in the output electrical signal brought by the adsorption of water molecules by the humidity-sensitive material of sensors can be expressed in numerous ways based on the choice of sensor type. Depending on different sensing platforms, humidity sensors can be capacitive, resistive, impedance, optical, electrical conductivity, and thermal-based.29 Out of these, capacitance-based sensors are more attractive than the other listed sensors because they are highly sensitive, operate at low cost, have fast response time, consume less power, and can be operated at room temperature.30–32 Moisture-induced changes in the dielectric properties of humidity-adsorbing materials are the basis for the operation of capacitive humidity sensors. The fabrication process of capacitance-based sensors is simple and can be well integrated with the sensing material even by simple drop-casting methods. In this work, we have developed a lanthanide-based MOF sensor, an [Eu(BTC)]-MOF [formulated as Eu(BTC)(H2O)·1.5H2O, BTC = benzene-1,3,5-tricarboxylate] coated-IDE sensor to detect ultra-low humidity levels using a capacitive sensing technique.
Additionally, the behaviour of the [Eu(BTC)]-MOF sensor has been investigated as a polarity sensor for detecting different solvent polarities. Solvent polarity and the local environment significantly impact the rates, kinetics, and product outcomes during chemical reactions. Solvent polarity also has profound effects on the spectral properties, such as absorbance, fluorescence, and optical properties of a molecule. Therefore, determining the polarity of a solvent is crucial.33 Generally, solvatochromic dyes such as pyridinium N-phenolate betaine dyes are used to determine the solvent polarity.34 However, the synthesis of these dyes is laborious, time-consuming, and costly. Thus, there is a need to design materials with facile synthesis conditions and analyze their behaviour with respect to the changes in the polarity of the solvent using a simple and rapid technique. The [Eu(BTC)]-MOF sensor in the present study functions as a dual sensor, effectively monitoring ultra-low humidity levels and accurately distinguishing between polar and non-polar solvents. Furthermore, to demonstrate the practical functionality of the sensor in environments like glove boxes, a real-time humidity device has been developed.
2. Experimental details
2.1 Materials
Europium(III) nitrate pentahydrate [Eu(NO3)3·5H2O] was purchased from Chem Scene chemicals, and 1,3,5-benzene tricarboxylic acid was purchased from TCI chemicals. All the solvents were purchased from SRL chemicals and used as such without further purification.2.2 Synthesis of [Eu(BTC)]-MOF
[Eu(BTC)]-MOF was prepared according to the reported procedure.35 Briefly, the MOF was synthesized by reacting [Eu(NO3)3·5H2O] metal salt (32 mg, 0.074 mmol) with 1,3,5-benzene tricarboxylic acid linker (15.6 mg, 0.074 mmol) in a scintillation vial containing the solvent mixture of DMF (3 mL), ethanol (3 mL) and water (2 mL). The vial was tightly sealed and placed in an oven at 80 °C after dissolving the contents completely. The vial was removed after 24 h and colorless crystals were obtained. The crystals were thoroughly washed with DMF and ethanol before proceeding to characterizations.2.3 Designing inter-digitated electrodes (IDE)
AutoCAD® was used to design the IDEs, which were then milled on a copper clad using a MITS PCB milling machine. Various finger dimensions and widths were tried with different milling settings, with the optimized dimensions being as follows: Finger width = 0.4 mm, spacing between fingers = 0.5 mm, and number of IDE fingers = 12.2.4 Fabrication of the MOF-coated IDE device
The fabricated IDEs were cleaned with isopropyl alcohol (IPA). Furthermore, to prepare a MOF-coated IDE sensor, MOF crystals were gently powdered using a mortar and pestle. MOF suspensions were prepared in ethanol and drop cast onto the IDE. The MOF-coated IDE was dried in an oven before proceeding to the characterization and sensing measurements.2.5 Details of the custom-built volatile organic compound (VOC) sensing setup
The setup consists of two mass flow controllers (MFCs), one with a maximum flow rate of 500 sccm (standard cubic centimeters per minute) and the other with a maximum flow rate of 20 sccm connected with the carrier gas, which is synthetic air in this case. The carrier gas passes through the solvent bubbler, generates vapors, and carries the vapors to the sample chamber. The electrodes of a thermostat were dipped in the solvent bubbler to record the temperature of the liquid bubbled into the sensing chamber. The humidity sensing measurements were carried out at 23 °C. The sensor in the chamber was connected to the LCR meter for recording capacitive measurements. The sensor's baseline capacitance value was recorded after dehumidifying the chamber by purging carrier gas. Different concentrations of solvent vapours were sent to the sample chamber by altering the flow rates in both the MFCs and the capacitance change was recorded with the help of an LCR meter. The carrier gas was purged through the chamber after each experiment to return the capacitance value to its baseline. In this way, the capacitance values were recorded for different ppm concentrations of each solvent and were represented as ΔC/C0 (%) where ΔC is the change in the capacitance of the sensor at the desired concentration (Cν) with respect to the baseline capacitance (C0).2.6 Characterization techniques
3. Results and discussion
3.1 Structural details and characterization of the MOF
Structural details and the coordination environment of the as-synthesized MOF were studied using the structure file from the literature.35 [Eu(BTC)]-MOF thus obtained crystallizes in the tetragonal P4(3)22 space group with each Eu metal atom coordinated to a water molecule and six carboxylate groups of the BTC linker. The removal of coordinated water molecules can render open metal sites in the framework. Fig. 1a shows the coordination environment of the MOF, with each BTC linker coordinating to six Eu metal clusters. The MOF structure displays tetragonal packing with square channels measuring 6.6 × 6.6 Å along the c axis (Fig. 1b). Fig. 1c and d depict the packing diagrams of the framework along the b and a axis, respectively.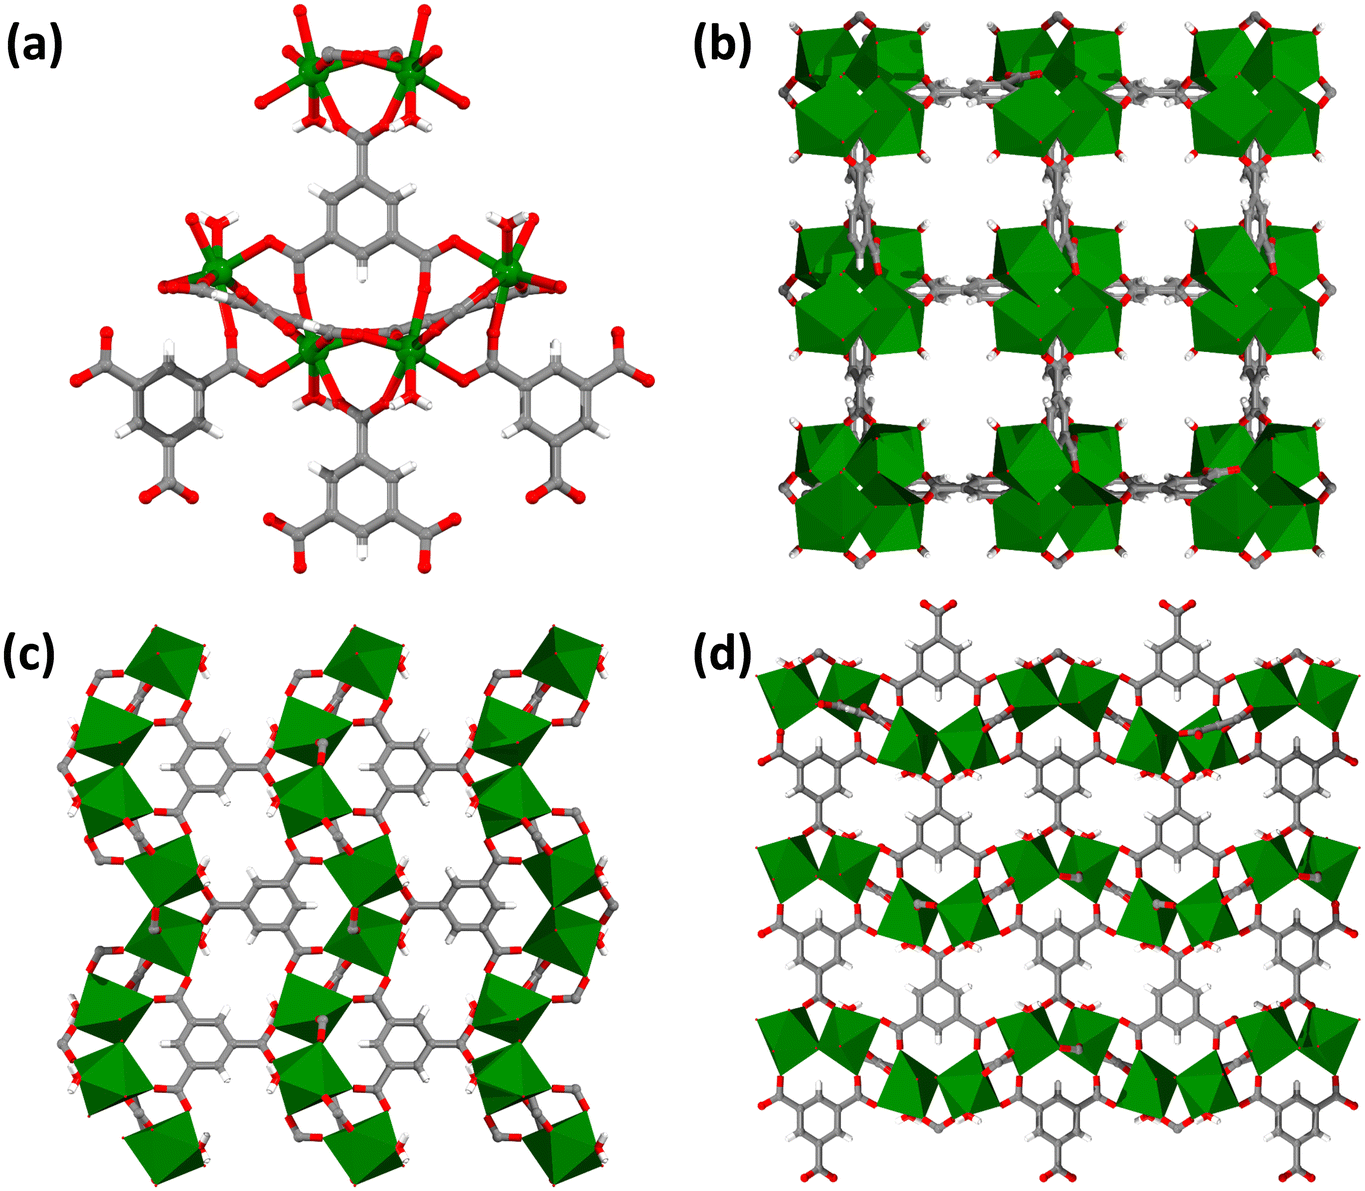 | ||
| Fig. 1 (a) Coordination environment of [Eu(BTC)]-MOF. Packing diagrams of [Eu(BTC)]-MOF (b) along the c axis, (c) along the b axis and (d) along the a axis. C, H, O, and Eu atoms have been shown in gray, white, red, and green, respectively. | ||
The as-synthesized MOF crystals were washed with DMF and ethanol. The PXRD pattern of the as-synthesized MOF crystals was recorded and compared with the simulated PXRD pattern collected from single crystal data. The as-synthesized PXRD pattern was in good agreement with the simulated PXRD pattern confirming the bulk purity of the MOF sample (Fig. 2c). The surface morphology and elemental composition of the MOF were studied using FE-SEM analysis. SEM images showed rod shaped crystals of [Eu(BTC)]-MOF ranging from 10–40 μm (Fig. 2a and b). Energy dispersive X-ray spectroscopy (EDS) and elemental mapping confirm the presence of Eu, C, and O elements in the framework (Fig. S1, S2 and Table S1, ESI†). Fig. S3a, ESI† shows the X-ray photoelectron spectroscopy (XPS) survey spectra of [Eu(BTC)]-MOF with the corresponding binding energies of Eu, C, and O elements. The high resolution XPS binding energy peaks at 1136 eV correspond to Eu3+ 3d5/2 and at 1166 eV correspond to Eu3+ 3d3/2, thus confirming the existence of Eu in the +3 oxidation state (Fig. S3b, ESI†). Fig. S3c and d, ESI† show the binding energies of C 1s and O 1s elements. The MOF crystals were solvent exchanged with ethanol and activated at 200 °C for 5 h under a dynamic vacuum before collecting the N2 adsorption isotherm at 77 K. The framework exhibited high porosity with a BET surface area of 397 m2 g−1, and an average pore volume of 0.164 cm3 g−1 (Fig. 2d). The thermal stability of the MOF crystals was studied with the help of thermogravimetric analysis (TGA), which showed the weight loss until 200 °C, followed by framework decomposition beyond 400 °C (Fig. S4, ESI†).
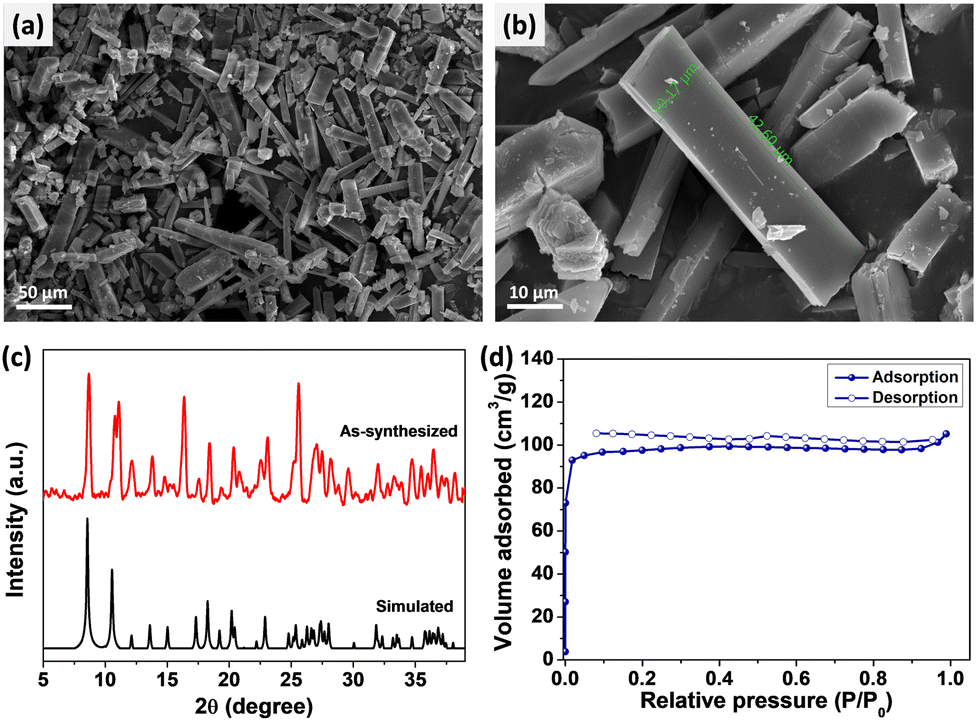 | ||
| Fig. 2 (a) and (b) SEM images of [Eu(BTC)]-MOF. (c) Comparison of simulated and as-synthesized PXRD patterns of [Eu(BTC)]-MOF to confirm the bulk phase purity, and (d) N2 adsorption isotherm of the MOF at 77 K. | ||
3.2 Water adsorption properties
The [Eu(BTC)]-MOF contains coordinated water molecules that can render open metal sites upon their removal from the cluster sites. These open metal sites can serve as potential adsorption sites in humidity sensing or for capturing water molecules. The MOF crystals were thus activated at 200 °C for 5 h under a dynamic vacuum to ensure all the water molecules are removed from the framework. The structural integrity of the activated framework was examined with the help of PXRD patterns (Fig. 3a). Before proceeding further to explore the water adsorption characteristics of the MOF, the framework was checked for its water stability. The PXRD pattern of the MOF sample was recorded after immersing the MOF crystals in water for 24 h. Fig. 3a shows that the structural integrity and the crystallinity of the framework remain unaltered, suggesting strong water stability. The water sorption isotherm of [Eu(BTC)]-MOF was recorded at 25 °C to check the water adsorption capacity of the framework. The framework displayed steep water uptake in the low P/P0 pressure ranges of 0 to 0.1, corresponding to low humidity ranges of 0 to 10% RH, indicating high water affinity of the MOF. [Eu(BTC)]-MOF exhibited an uptake of 130 cc g−1 at P/P0 = 0.1 (10% RH), which reached a maximum of 220 cc g−1 until P/P0 = 0.9 (Fig. 3b). Interestingly, the framework displayed more than half of its total water uptake at very low pressure P/P0 = 0.1. These results suggest that [Eu(BTC)]-MOF could be a potential material for humidity sensing, particularly at ultra-low humidity levels. Inspired by the high water affinity of the framework at very low humidity levels, we studied [Eu(BTC)]-MOF as an ultra-low humidity sensor using a capacitive transducer. | ||
| Fig. 3 (a) Comparison of the PXRD patterns of the as-synthesized (red), water exchanged (blue) and activated (pink) samples with the simulated PXRD pattern35 of [Eu(BTC)]-MOF. (b) Water sorption isotherm of [Eu(BTC)]-MOF. | ||
3.3 Ultra-low humidity sensing studies
Fig. 4a illustrates the schematic representation of the detailed fabrication process of preparing the MOF-coated IDE device. The structural integrity and crystallinity of the MOF on IDE was assessed through PXRD analysis before advancing to the sensing experiments. Fig. S5, ESI† shows that the recorded PXRD pattern was in good agreement with the as-synthesized and simulated patterns of the MOF affirming the structural integrity. Following the successful deposition of MOF onto the IDE and verification of the framework's structural integrity, sensing experiments were conducted using a custom-built setup, as depicted in Fig. 4b. | ||
| Fig. 4 (a) Schematic illustration of device fabrication. (b) Custom-built setup for VOC sensing with an LCR meter. | ||
The MOF-coated IDE's sensing capabilities towards water were examined in different concentration ranges of 0 to 2000 ppm. Fig. 5a shows the uncoated IDE and MOF-coated IDE sensor responses towards water in the low concentration ranges of 10–100 ppm. The sensor showed an exceptionally good capacitive response of 0.3% even at a 10 ppm (<0.1% RH) concentration of water and a capacitive response of 0.4% at 20 ppm (0.1% RH), corresponding to an increase in capacitance of 0.1% for a 10 ppm increase in concentration. A similar almost linear increase trend was seen in the whole concentration range of 10–100 ppm (relative humidity levels of 0.1% to 0.4% RH) with an increase in capacitive response from 0.3% to 0.6% (Fig. 5c). The sensor showed a sensitivity of 0.0027 ΔC/C0 (%)/ppm and a LOD of 0.84 ppm. This clearly signifies the high sensitivity of the MOF sensor at extremely low humidity levels. The sensing behavior of the MOF towards high concentration ranges of water was further studied. Fig. 5b shows the increase in capacitance response of the sensor for the water content in the range of 100–2000 ppm (relative humidity levels of 0.4% to 7.2% RH). The sensor also exhibited a linear trend for high concentration ranges of 100–400 ppm (relative humidity levels of 0.4% to 1.4% RH) with a sensitivity of 0.000947 ΔC/C0(%)/ppm (Fig. 5d).
 | ||
| Fig. 5 MOF-coated IDE sensor response (a) towards ultra-low concentrations of water vapor at 23 °C and (b) towards increased concentrations of water vapor measured at 23 °C. (c) Linear response of the sensor towards water in the concentration range of 10–100 ppm. (d) Linear response of the sensor towards water in the concentration range of 100–400 ppm. | ||
3.4 Sensing mechanism
The aforementioned findings show that the MOF system has a significant affinity for water even at such extremely low humidity conditions. This can be attributed to the highly porous nature of the MOF system with large pore size and pore volume. Also, the water sorption profile of the framework displayed a steep water uptake at a very low pressure of P/P0 = 0.1 (10% RH), exhibiting a high water affinity of the system. The presence of open metal sites is another significant factor contributing to this high water affinity. These open metal sites function as sites for host–guest interaction, which aids in capturing water molecules effectively, leading to good hydrophilic interactions with water even at ultra-low humidity levels. Moreover, the framework with a pore size of 8 Å can readily accommodate water molecules that have a kinetic diameter of 2.64 Å,36 exhibiting excellent water uptake. Therefore, there is a significant change in the capacitance of the MOF-coated IDE sensor even when exposed to low humidity levels. This shows that the MOF is water sensitive and the interactions of water molecules with the MOF system is predominant. On exposing the MOF-based sensor to increasing humidity levels, the water molecules are adsorbed onto the available active sites in the MOF system. The adsorbed water molecules get ionized and produce a large number of hydronium ions (H3O+) as charge carriers due to the amphoteric nature and auto-ionization of water (H2O + H+ → H3O+).37,38 As the humidity levels increase, more water molecules are adsorbed onto the surface of the materials, leading to more proton transfer. As a consequence, the dielectric constant of the material can be significantly altered due to the presence of these additional charged water species.39,40 These changes in the dielectric constant due to increased humidity levels and the presence of charged water species will enhance the capacitance of the sensing material.3.5 Response time, reliability and stability studies of the MOF-coated IDE sensor
Response and recovery time play an important role in assessing the efficiency of the sensor. The time required to reach 90% of the total capacitive response is considered as the response time. The sensor, on exposure to water vapor, showed a good response time of ∼270 s. The device could be revived back to its initial state by purging with air for 100 s (Fig. 6a). It is noteworthy that the sensor can display better response and recovery time, but is limited by the flow rate (100 cm3 min−1) used for purging in the study. Thus, humidification and dehumidification of the sample chamber of 1.5 L capacity requires a longer time.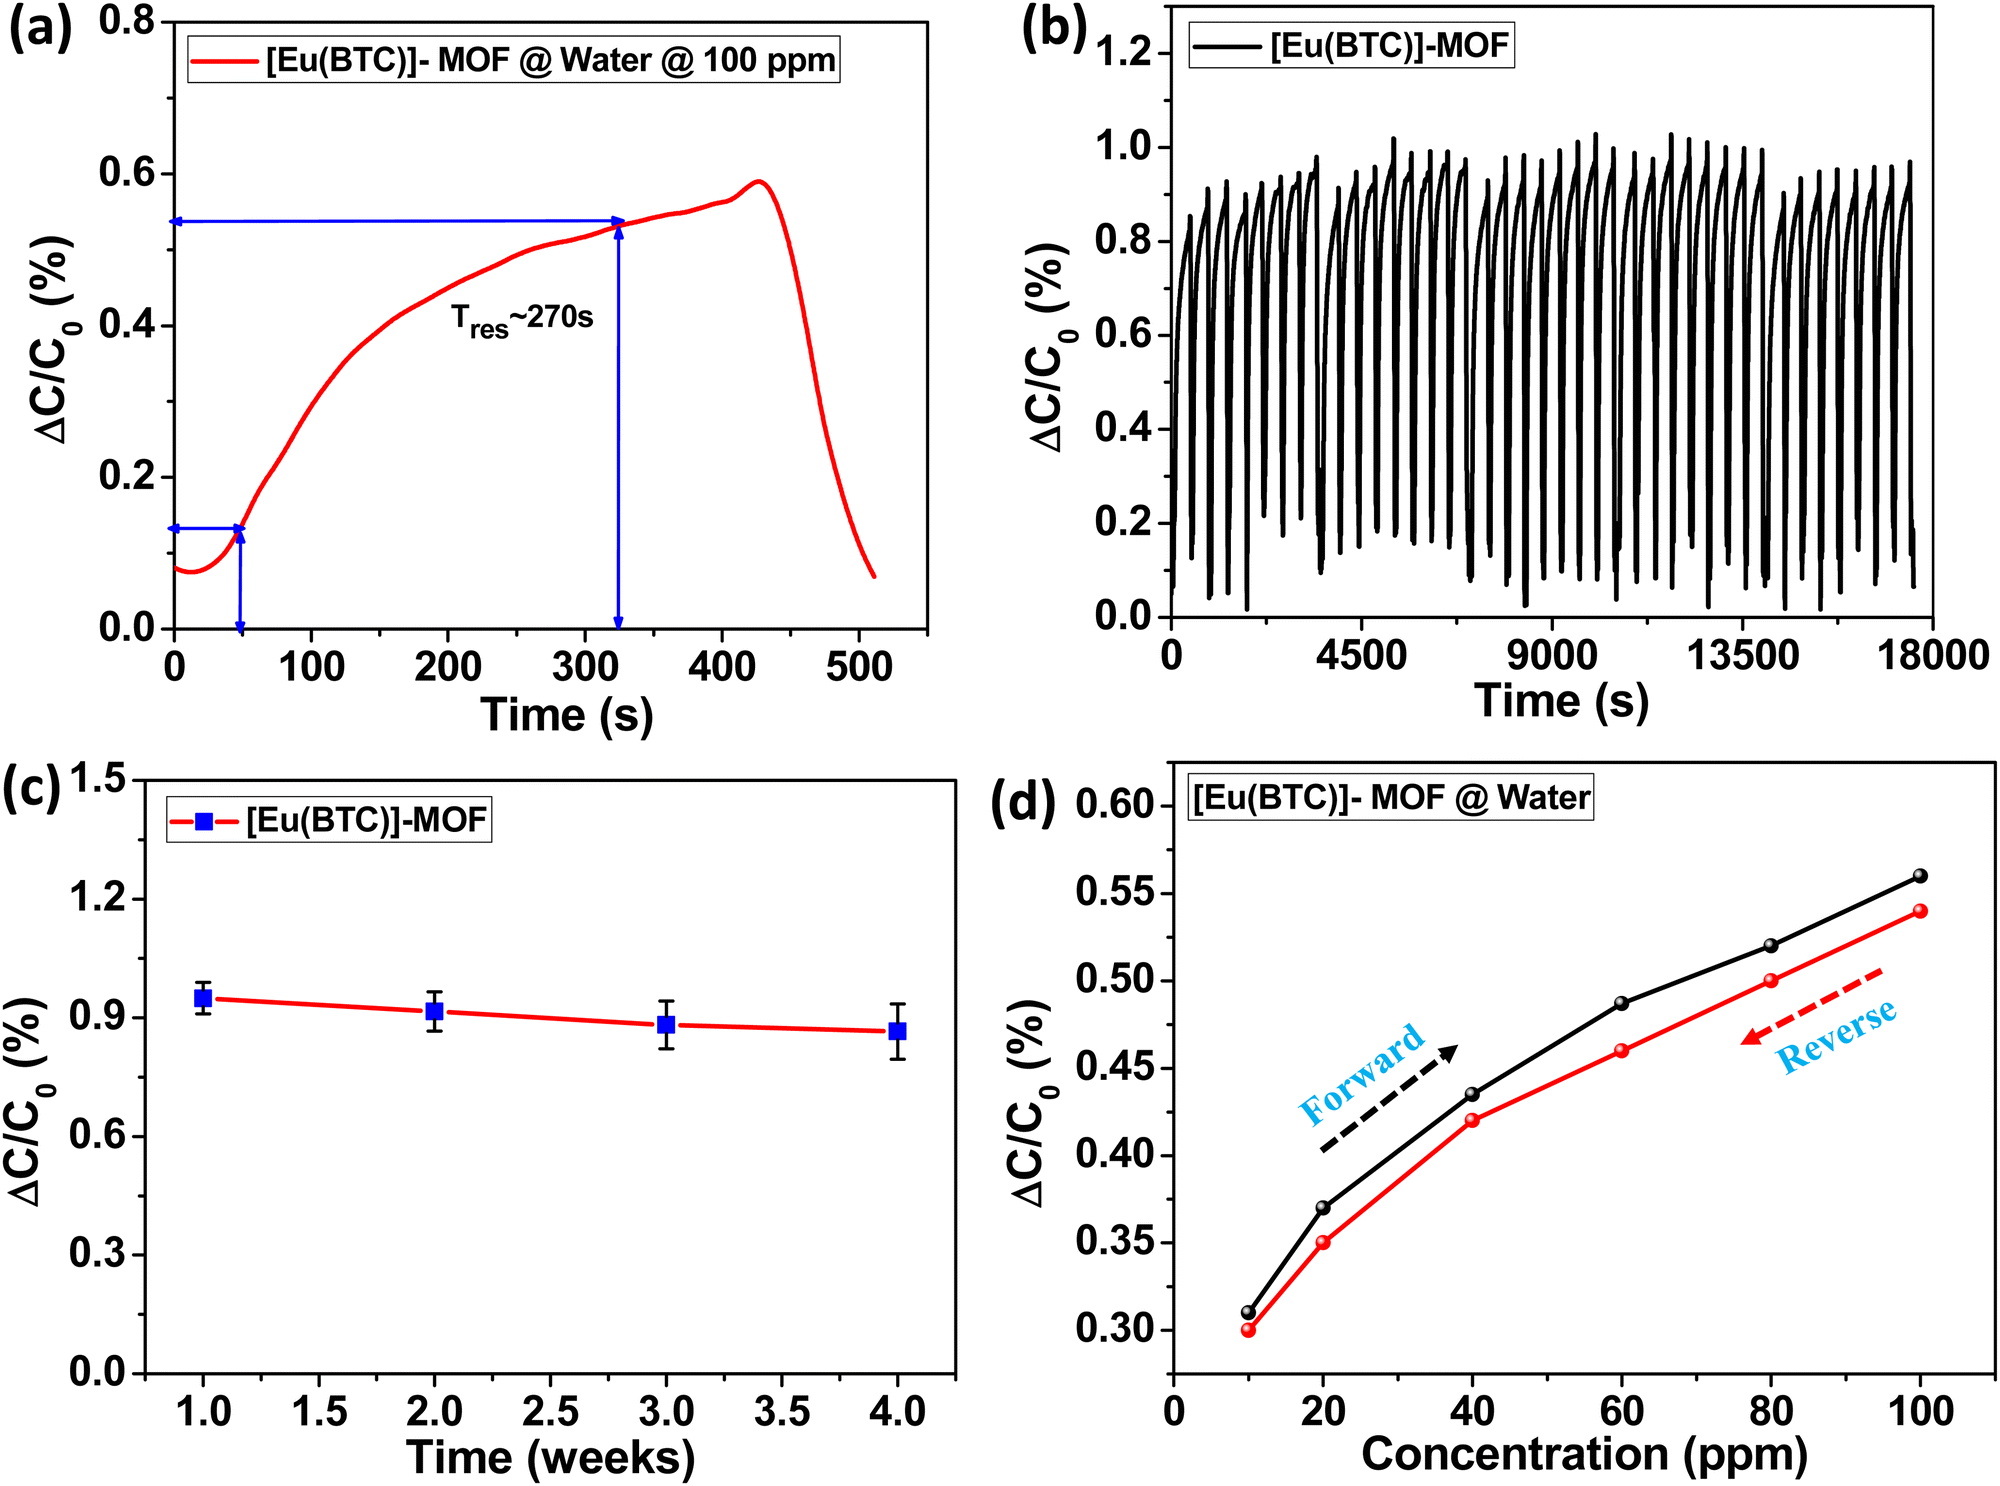 | ||
| Fig. 6 (a) Response time of the sensor towards water. (b) Capacitive response of the sensor showing stability towards 1500 ppm concentration of water. (c) Stability cycles of the sensor towards water over a period of 4 weeks. (d) Humidity hysteresis curve of the sensor. | ||
Reliability and stability are two crucial parameters that need to be considered in developing an effective sensor. It makes it more critical to design MOF-based humidity sensors with these features because many MOFs exhibit poor stability towards water, resulting in framework disintegration. However, the MOF system selected for this study showed good water stability. The sensor was examined for both short-term and long-term stability. Furthermore, to evaluate the short-term stability of the sensor, the first cycle was recorded by exposing the sensor to a relative humidity of 5.4% RH (1500 ppm concentration of water) for 6 minutes, and the sensor exhibited a capacitive response of 0.95%. The sensor exhibited nearly the same capacitive response of 0.95% for 40 cycles (or for a period of 4 h) with no deterioration in its response, as shown in Fig. 6b.
The aforementioned findings show that the sensor performs with exceptional sensitivity and accuracy. Long-term stability studies of the sensor were carried out for a period of 1 month. The capacitive response of the sensor on exposure to 1500 ppm concentration of water was checked once every week. The sensor showed excellent stability and displayed good performance over a period of 4 weeks with a very slight decline of capacitive response of ≤0.1% (Fig. 6c). This clearly demonstrates the sensor's long-term stability in detecting and operating in ultra-low humidity conditions.
The hysteresis curve, which is defined by the highest difference during the sensor's adsorption and desorption cycle, is an important measure for evaluating the performance of humidity sensors. The hysteresis curve is examined by recording the adsorption and desorption cycle of the MOF-based sensor to ultra-low humidity levels. The adsorption cycle (forward scan) was recorded by exposing the sensor to increasing concentrations of water (10 to 100 ppm), and the desorption cycle (reverse scan) was recorded by decreasing the concentration from 100 to 10 ppm. On comparing the adsorption and desorption cycles, the sensor showed very low hysteresis with a small capacitance shift of ∼0.03% (Fig. 6d), ascertaining a good reliability of the sensor.
The majority of the sensors reported in the literature have slow response times (Table 1). Our sensor offers a competitive advantage over other sensors in terms of operating under low humidity conditions with quick response and recovery time. The sensor's exceptionally low detection limits allow it to be used at ultra-low humidity levels while maintaining good sensitivity.
| MOF material | Sensing technique | Range | Response time | Features | Humidity & polarity dual sensor | Ref. |
|---|---|---|---|---|---|---|
| NH2 MIL 125(Ti) | Capacitance | 11–75% RH | 75 s | Silicon nanoporous pillar array as a template | NO | 24 |
| MIL-96 (Al) | Capacitance | 3.7–90% RH | ∼20 min | Textile sensor with LB film | NO | 26 |
| MIL-96 (Al) | Capacitance | 0–5000 ppm | 10–15 min | Si IDE, also selective to MeOH | NO | 27 |
| Cu-BTC | Capacitance | 20–100 ppm | ∼10 min | Parallel plate capacitor electrochemical coating of MOF | NO | 28 |
| Cu-BDC | Capacitance | 10–90% RH | Not evaluated | SAM modified, Si IDE | NO | 43 |
| [K8(ptca)3(H3O)4]n | 20–85% RH | Not evaluated | K-Pery as sensing layer on PET | NO | 44 | |
| Cu3TCPP | Capacitance | 60–98% RH | Not evaluated | Nano flake crystal-based sensor | NO | 45 |
| HKUST-1 nanoparticles | Capacitance | 5–50% RH | Not evaluated | Parallel-plate capacitor | NO | 46 |
| [Eu(BTC)]-MOF | Capacitance | 10–2000 ppm | ∼270 s | MOF coated IDE sensor | YES | This work |
3.6 [Eu(BTC)]-MOF as a polarity sensor
The MOF's remarkable water adsorption capacity inspired us to investigate its adsorption properties towards other solvents. We chose three categories of solvents to study the behavior of the MOF with respect to the polarity changes of the solvent. The first category consists of polar protic solvents such as ethanol and methanol. The second category consists of polar aprotic solvents such as acetonitrile and acetone. The third category consists of non-polar solvents such as toluene and hexane. Table S2, ESI† shows the relative solvent polarity index of the three categories of solvents. The sorption isotherms of the MOF towards different categories of solvents were collected (Fig. 7). The MOF system exhibited high uptake of 220 cc g−1 with water, which is highly polar, followed by methanol and ethanol, with uptake capacities of 85 and 80 cc g−1, respectively.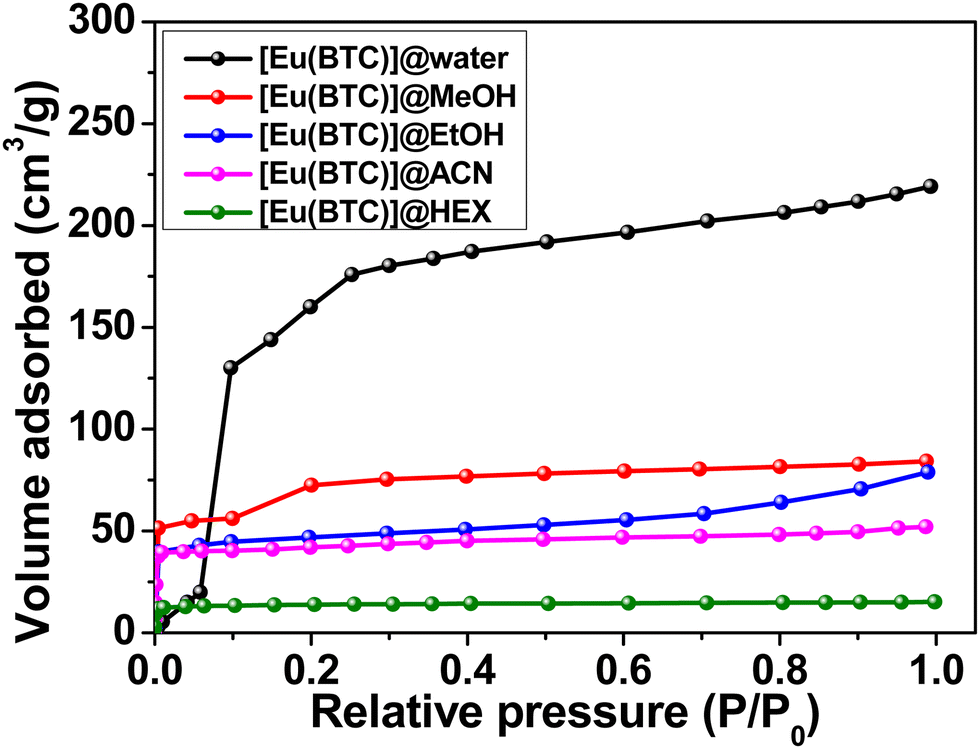 | ||
| Fig. 7 Vapor adsorption isotherm of [Eu(BTC)]-MOF towards solvents. | ||
Acetonitrile and hexane were chosen for the sorption studies from the polar aprotic and non-polar categories. Acetonitrile displayed a moderate affinity with uptake capacities less than polar protic solvents. With poor adsorption capacity, hexane showed the least affinity towards the MOF system. It is interesting to note that the MOF uptake capacity of ethanol was more compared to hexane despite having a similar kinetic diameter of ∼4.5 Å.41,42 This can be attributed to the difference in their solvent polarities, with ethanol being polar and exhibiting a strong affinity towards the MOF system, whereas hexane is non-polar and has a low affinity.
Inspired by the above observations, we went ahead to further investigate the sensing behavior of the MOF system towards solvents with different polarities. The capacitive response of the sensor towards the three categories of solvents in the concentration range of 100 to 2000 ppm was recorded and analyzed (Fig. 8a). The MOF-coated IDE, after each solvent run, was heated in an oven at 200 °C for 1 h to desorb the solvent adsorbed in the MOF system. The analysis showed that the capacitive response of the sensor increases linearly with an increase in solvent polarity. Fig. 8a details that the sensor shows the best capacitive response towards water compared to other solvents due to the high polarity of water and high affinity towards water due to its good hydrophilic interactions with the framework. The individual capacitive responses of the MOF system towards polar protic solvents (ethanol, methanol), polar aprotic solvents (acetonitrile, acetone), and non-polar solvents (toluene, hexane) are depicted in Fig. S6–S8, ESI.†Fig. 8b depicts that the sensor displays an almost linear capacitive response with an increase in the relative polarity values of the solvents chosen for the study.
 | ||
| Fig. 8 (a) Capacitance response of the sensor towards water and other solvents (ethanol, methanol, acetonitrile, acetone, toluene, and hexane). (b) Illustration of an increasing trend of the capacitive response of the sensor in agreement with the polarities of the solvents. | ||
Thus, the current MOF-based sensor acts as a simple, quick, handy, and efficient polarity sensor with high sensitivity for a known concentration. Table 1 presents a comprehensive analysis of MOF-based sensors in terms of their capabilities for detecting humidity and polarity. It is noteworthy to mention that our sensor functions as a dual sensor, exhibiting the capability to detect moisture while simultaneously serving as a solvent polarity sensor.
3.7 MOF-coated IDE as a real-time humidity device
The high sensitivity of the sensor towards ultra-low humidity levels and exceptionally low ppm levels of water encouraged us to develop a real-time humidity sensor to detect the moisture content in glove boxes. The need to maintain inert conditions in the glove boxes demands an efficient sensor to monitor and detect water content below 10 ppm. Furthermore, an electronic prototype has been designed to demonstrate the working of a real-time humidity sensor. The electronic prototype consists of a custom-built solvent jar filled with water connected to the MOF-coated IDE device enclosed in a transparent box. The MOF-coated IDE device was further connected to a TI FDC 1004 breakout board, which was directly connected to an Arduino UNO microcontroller. Additionally, a light-emitting diode (LED) was connected to the microcontroller as an output to visualize the changes in the sensor on exposure to humidity.The prototype functions by exposing the MOF-coated IDE device to the humidity conditions created by the solvent bubbler and measuring the real-time capacitance changes with the help of FDC. The role of FDC is to supply and receive AC signals, since capacitance measurement is not possible through direct interfacing of the IDE with the Arduino UNO as the latter uses direct current. The FDC in connection with the IDE and the Arduino UNO can act as a sensor that triggers a red LED when the humidity crosses a set threshold. This humidity scale corresponds to a certain measured capacitance, and the threshold capacitance can be written into the Arduino as a code, which further prints the capacitance value (in the pF) on the serial monitor, as well by triggering an alarm by turning on a red LED. Fig. 9 shows the schematic representation of the real-time humidity sensor layout and the sensor response to humidity. The performance of the sensor was initially checked with extremely low humidity levels of (≤0.1% RH, 10–20 ppm); we found that there was too much inherent variability in the capacitance readings, and this couldn’t be reduced due to the limitations of the real-time setup. The sensor was further checked on exposure to higher humidity levels of 7% RH and the sensor displayed good capacitance changes in response to the humidity. The capacitance response thus recorded was above the set threshold capacitance written as code and consequently, the alarm is triggered in the form of LED ON, as depicted in Fig. 9b. Fig. 9a shows that the sensor does not trigger an alarm when the set threshold capacitance is not reached and thus, the LED is OFF. Movie S1, ESI† features a live demonstration of the electronic prototype for monitoring humidity. This work exemplifies the potential of a MOF material as a real-time ultralow humidity device.
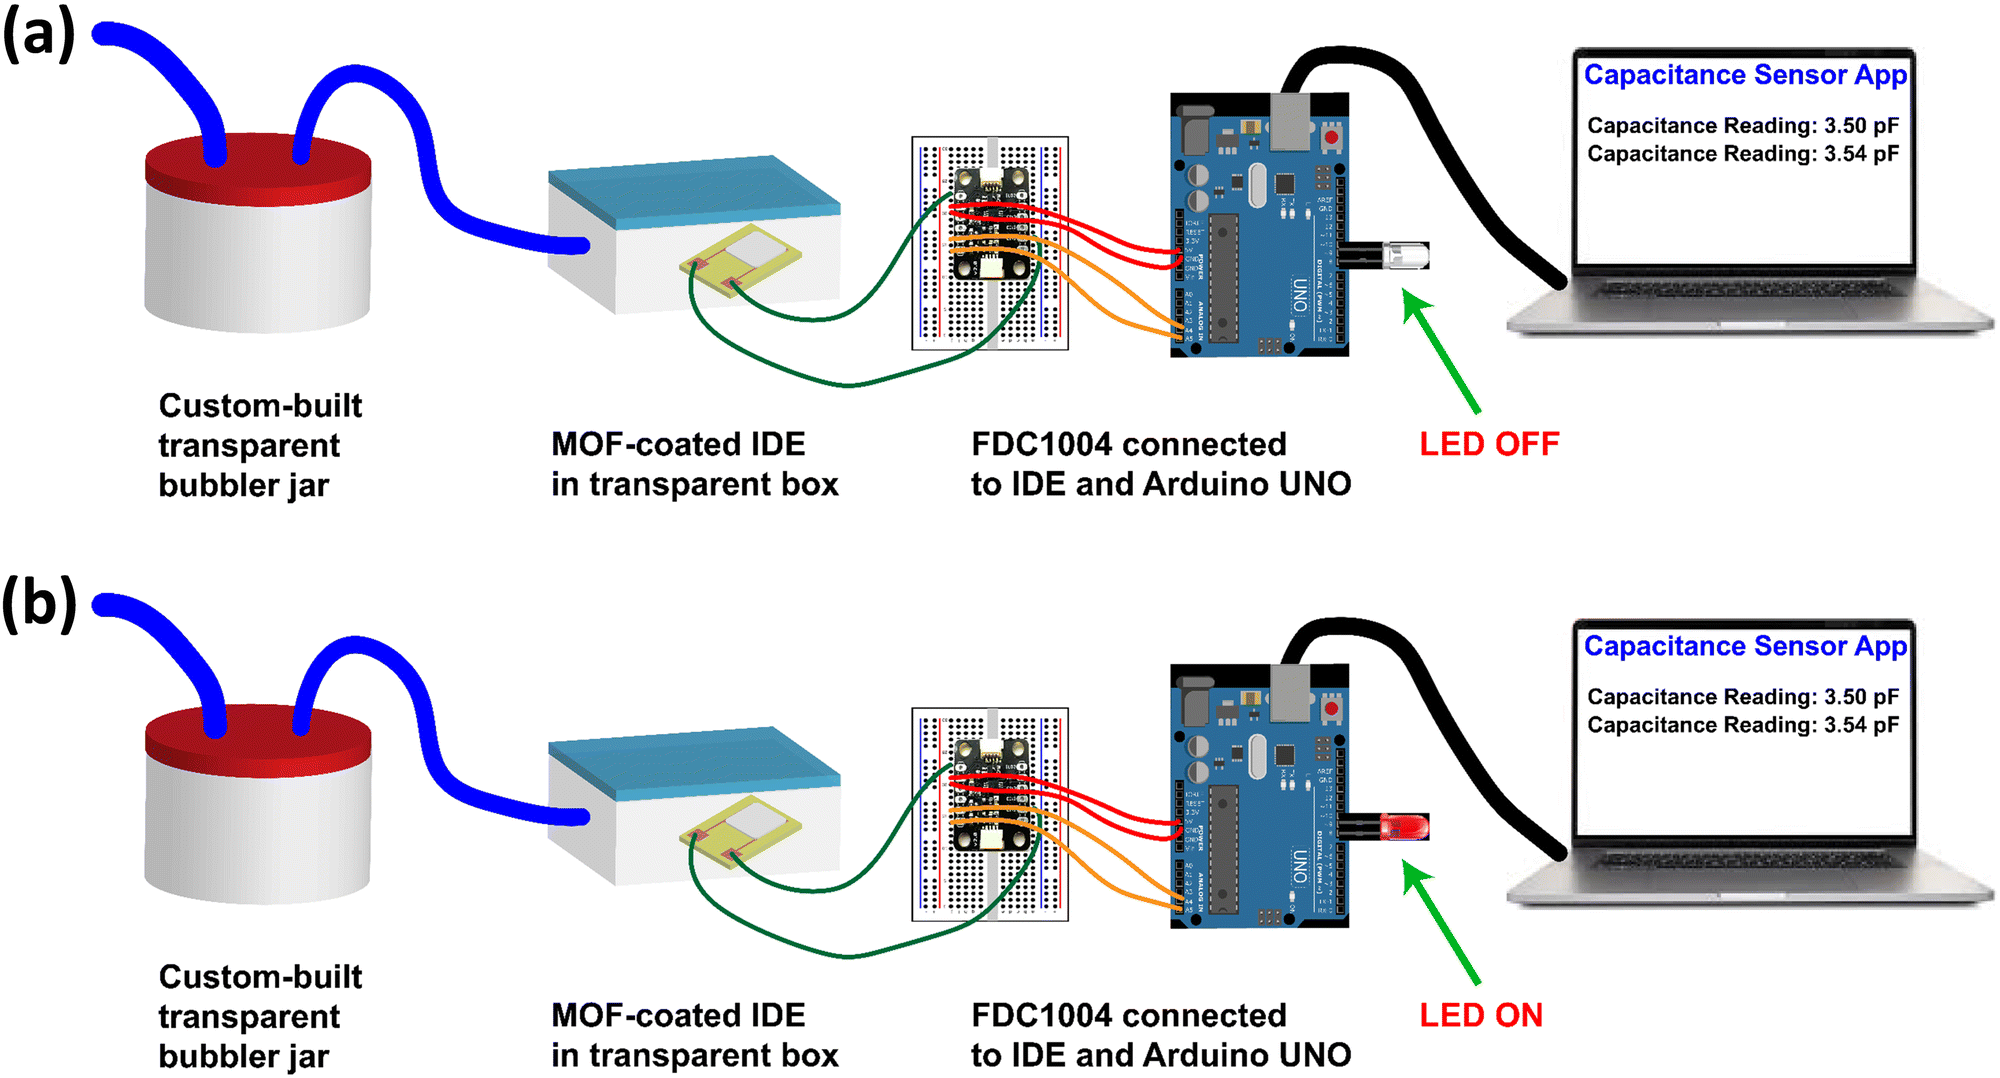 | ||
| Fig. 9 Illustration of operation of the real-time humidity sensor in response to humidity depicted with (a) LED OFF (in the presence of negligible humidity levels) and (b) LED ON (in the presence of humidity). | ||
4. Conclusions
In summary, we have developed a lanthanide MOF-based capacitive sensor and demonstrated it as an efficient and highly sensitive sensor for monitoring ultra-low humidity levels at ambient temperature. The sensor exhibits a very quick response time of ∼270 s and can detect low humidity levels as low as 0.1% RH. The sensor exhibits excellent atmospheric stability for a period of 1 month with no deterioration in its performance. The capacitive response of the sensor was also studied upon exposing it to solvents of different polarities. Interestingly, the sensor demonstrates the capability to distinguish between polar and non-polar solvents, effectively functioning as a polarity sensor. We further developed a real-time humidity sensor for monitoring ultra-low humidity levels, which can offer practical utility in environments such as glove boxes. Ultra-low humidity sensing devices with long term stability are highly warranted for a sustainable and green future. The current work successfully demonstrates the dual sensing potential of MOF-based sensors for monitoring ultra-low humidity levels with good precision and distinguish polar and non-polar solvents. We believe that this work will encourage more reports on the usage of MOFs as humidity sensors. Such studies may also pave the way for the commercialization of MOF-based humidity sensors and polarity sensors in the near future.Author contributions
T. L. conceptualized the idea and wrote the first draft. T. L., P. N. S., and M. T. carried out all the experimental work. H. A. and K. C. N. helped in preparing and improving the manuscript. All authors have given approval for the final version of the manuscript.Conflicts of interest
There are no conflicts to declare.Acknowledgements
HA thanks DST-SERB for funding (grant sanction order number CRG/2022/004414) and TL thanks BITS-Pilani, Hyderabad for research fellowship. Authors thank BITS-Pilani, Hyderabad Campus Central Analytical Laboratory for access to all the state of the art facilities.References
- S. Kolpakov, N. Gordon, C. Mou and K. Zhou, Sensors, 2014, 14, 3986–4013 CrossRef PubMed.
- D. Zhang, Y. Sun, P. Li and Y. Zhang, ACS Appl. Mater. Interfaces, 2016, 8, 14142–14149 CrossRef CAS PubMed.
- K. Sharma, N. Alam and S. Islam, Nanoscale Adv., 2020, 2, 2564–2576 RSC.
- M. Pandey, P. Mishra, D. Saha, K. Sengupta, K. Jain and S. Islam, J. Sol-Gel Sci. Technol, 2013, 68, 317–323 CrossRef CAS.
- L. Kumar, T. Islam and S. C. Mukhopadhyay, Electronics, 2017, 6, 41 CrossRef.
- T. Islam, L. Kumar and S. A. Khan, Sens. Actuators, B, 2012, 173, 377–384 CrossRef CAS.
- L. Kumar, D. Saha, S. A. Khan, K. Sengupta and T. Islam, IEEE Sens. J., 2011, 12, 1625–1632 CrossRef PubMed.
- T. Islam, M. R. Mahboob and S. A. Khan, IEEE Sens. J., 2014, 15, 3004–3013 Search PubMed.
- X. Guan, Z. Hou, K. Wu, H. Zhao, S. Liu, T. Fei and T. Zhang, Sens. Actuators, B, 2021, 339, 129879 CrossRef CAS.
- V. Panwar, S. Mohanty and G. Anoop, Sens. Actuators, A, 2021, 325, 112716 CrossRef CAS.
- Y. Zhang, J. Ren, Y. Wu, X. Zhong, T. Luo, J. Cao, M. Yin, M. Huang and Z. Zhang, Sens. Actuators, B, 2020, 309, 127769 CrossRef CAS.
- L. Huang, Y. Yang, P. Ti, G. Su and Q. Yuan, Carbohydr. Polym., 2022, 288, 119312 CrossRef CAS PubMed.
- V. Pascanu, G. González Miera, A. K. Inge and B. Martín-Matute, J. Am. Chem. Soc., 2019, 141, 7223–7234 CrossRef CAS PubMed.
- T. Leelasree, M. Dixit and H. Aggarwal, Chem. Mater., 2023, 35, 416–423 CrossRef CAS.
- T. Leelasree, S. Goel and H. Aggarwal, ACS Appl. Nano Mater., 2022, 5, 16753–16759 CrossRef CAS.
- D. P. Van Heerden, V. J. Smith, H. Aggarwal and L. J. Barbour, Angew. Chem., Int. Ed., 2021, 60, 13430–13435 CrossRef CAS PubMed.
- H. Li, L. Li, R.-B. Lin, W. Zhou, Z. Zhang, S. Xiang and B. Chen, EnergyChem, 2019, 1, 100006 CrossRef.
- T. Islam, M. R. Mahboob and S. A. Khan, IEEE Sens. J., 2014, 15, 3004–3013 Search PubMed.
- T. Islam, A. Nimal, U. Mittal and M. Sharma, Sens. Actuators, B, 2015, 221, 357–364 CrossRef CAS.
- C. Lv, C. Hu, J. Luo, S. Liu, Y. Qiao, Z. Zhang, J. Song, Y. Shi, J. Cai and A. Watanabe, Nanomaterials, 2019, 9, 422 CrossRef CAS PubMed.
- M. R. Mahboob, Z. H. Zargar and T. Islam, Sens. Actuators, B, 2016, 228, 658–664 CrossRef CAS.
- R. Liang, A. Luo, Z. Zhang, Z. Li, C. Han and W. Wu, Sensors, 2020, 20, 5601 CrossRef CAS PubMed.
- K. N. Chappanda, O. Shekhah, O. Yassine, S. P. Patole, M. Eddaoudi and K. N. Salama, Sens. Actuators, B, 2018, 257, 609–619 CrossRef CAS.
- Y. Liu, L. Yan, H. Cai, H. Zong and L. Chen, MRS Commun., 2021, 11, 504–509 CrossRef CAS.
- J. Liu, F. Sun, F. Zhang, Z. Wang, R. Zhang, C. Wang and S. Qiu, J. Mater. Chem., 2011, 21, 3775–3778 RSC.
- S. Rauf, S. Rauf, M. T. Vijjapu, M. A. Andres, I. Gascon, O. Roubeau and M. Eddaoudi, ACS Appl. Mater. Interfaces, 2020, 12, 29999–30006 CrossRef CAS PubMed.
- M. A. Andrés, M. T. Vijjapu, S. G. Surya, O. Shekhah, K. N. Salama, C. Serre, M. Eddaoudi, O. Roubeau and I. Gascón, ACS Appl. Mater. Interfaces, 2020, 12, 4155–4162 CrossRef PubMed.
- M. S. Hosseini and S. Zeinali, J. Mater. Sci.: Mater. Electron., 2019, 30, 3701–3710 CrossRef CAS.
- K. Wu, T. Fei and T. Zhang, Nanomaterials, 2022, 12, 4208 CrossRef CAS PubMed.
- N. Takeda, P. Carroll, Y. Tsukahara, S. Beardmore, S. Bell, K. Yamanaka and S. Akao, Meas. Sci. Technol., 2020, 31, 104007 CrossRef CAS.
- T. Islam, A. U. Khan, J. Akhtar and M. Z. U. Rahman, IEEE Trans. Ind. Electron., 2014, 61, 5599–5605 Search PubMed.
- T. Islam, M. R. Mahboob, S. A. Khan and L. Kumar, IEEE Sens. J., 2013, 14, 1148–1153 Search PubMed.
- J. R. Lakowicz. Principles of Fluorescence Spectroscopy, Springer, 2006, pp. 185–186 Search PubMed.
- V. G. Machado, R. I. Stock and C. Reichardt, Chem. Rev., 2014, 114, 10429–10475 CrossRef CAS PubMed.
- B. Chen, Y. Yang, F. Zapata, G. Lin, G. Qian and E. B. Lobkovsky, Adv. Mater., 2007, 19, 1693–1696 CrossRef CAS.
- J. R. Li, R. J. Kuppler and H. C. Zhou, Chem. Soc. Rev., 2009, 38, 1477–1504 RSC.
- N. C. Jeong, B. Samanta, C. Y. Lee, O. K. Farha and J. T. Hupp, J. Am. Chem. Soc., 2012, 134, 51–54 CrossRef CAS PubMed.
- H. Farahani, R. Wagiran and M. N. Hamidon, Sensors, 2014, 14, 7881–7939 CrossRef PubMed.
- S. Borini, R. White, D. Wei, M. Astley, S. Haque, E. Spigone, N. Harris, J. Kivioja and T. Ryhanen, ACS Nano, 2013, 7, 11166–11173 CrossRef CAS PubMed.
- X. Zhao, X. Chen, F. Liu, X. Ding, X. Yu, K. Tang and G. Li, Sens. Actuators, B, 2022, 371, 132396 CrossRef CAS.
- F. Jiménez-Cruz and G. C. Laredo, Fuel, 2004, 83, 2183–2188 CrossRef.
- G. Zhu, Y. Li, H. Zhou, J. Liu and W. Yang, Mater. Lett., 2008, 62, 4357–4359 CrossRef CAS.
- C. Sapsanis, H. Omran, V. Chernikova, O. Shekhah, Y. Belmabkhout, U. Buttner, M. Eddaoudi and K. N. Salama, Sensors, 2015, 15, 18153–18166 CrossRef CAS PubMed.
- J. M. Seco, E. S. Sebastián, J. Cepeda, B. Biel, A. Salinas-Castillo, B. Fernández, D. P. Morales, M. Bobinger, S. Gómez-Ruiz, F. C. Loghin, A. Rivadeneyra and A. Rodríguez-Diéguez, Sci. Rep., 2018, 8, 14414 CrossRef PubMed.
- M. Tian, Z. H. Fu, B. Nath and M. S. Yao, RSC Adv., 2016, 6, 88991–88995 RSC.
- S. Homayoonnia and S. Zeinali, Sens. Actuators, B, 2016, 237, 776–786 CrossRef CAS.
Footnote |
| † Electronic supplementary information (ESI) available. See DOI: https://doi.org/10.1039/d4tc00454j |
| This journal is © The Royal Society of Chemistry 2024 |