
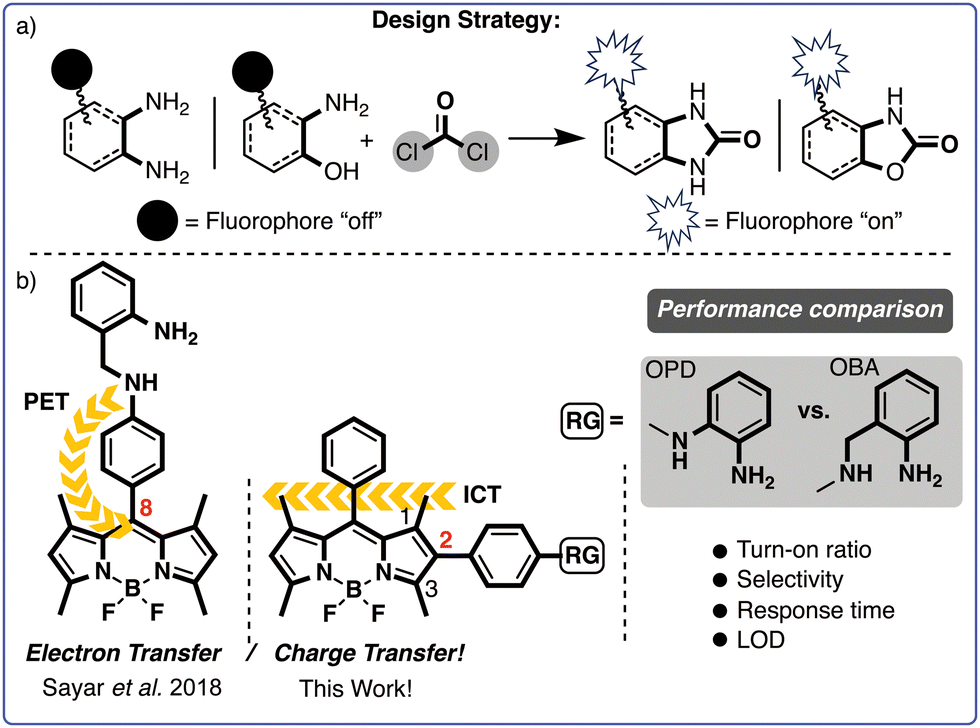
Tailored BODIPY-based fluorogenic probes for phosgene detection: a comparative evaluation of recognition sites†
Suay
Dartar
*a,
Beraat Umur
Kaya
a,
Yanki Öncü
Yayak
a,
Ezgi
Vural
a and
Mustafa
Emrullahoğlu
 b
b
aDepartment of Chemistry, Faculty of Science, Izmir Institute of Technology, Urla 35430, Turkiye. E-mail: mustafaemrullahoglu@iyte.edu.tr
bDepartment of Photonics, Faculty of Science, Izmir Institute of Technology, Turkiye
First published on 22nd October 2024
Abstract
We constructed two novel boron-dipyrromethene (BODIPY)-based fluorescent probes, BOPD and BOBA, each equipped with the phosgene specific recognition units o-phenylenediamine (OPD) and o-aminobenzylamine (OBA) at the 2-position of the BODIPY core. BOPD and BOBA represent rare examples of BODIPY-based probes that operate by modulating an intramolecular charge transfer process (ICT), as validated by computational studies. We systematically compared the analytic performance of those recognition units while focusing on selectivity, fluorescence turn-on ratios and response times. Probe BOBA, equipped with OBA as the recognition unit, demonstrated a remarkably low detection limit (i.e., 1.40 nM) and a rapid response time (<10 s) for triphosgene. By comparison, BOPD, featuring an OPD unit, showed superior selectivity towards triphosgene, with a detection limit of 93 nM and a response time of up to 30 s. A portable sensing platform was developed by loading BOPD onto test strips made of TLC plates, nonwoven materials and small-headed cotton swabs, which were assessed for their effectiveness in detecting phosgene. We additionally performed the first successful application of a fluorescent probe, namely BOPD, for monitoring the accumulation of phosgene in plants.
1 Introduction
Phosgene is a highly toxic, reactive gaseous chemical that when inhaled induces noncardiogenic pulmonary oedema, pulmonary emphysema and asphyxia.1,2 Notorious for its use as a chemical weapon in the first world war, phosgene is now widely used in manufacturing industrial chemicals and pharmaceuticals. Unlike other nerve agents such as sarin and soman, availability and unregulated use of phosgenes underscore the urgent need to develop reliable analytical tools to effectively detect and monitor the chemical.3–5Conventional approaches of detecting phosgene rely heavily on complex instrumentation and experimental setups,6,7 the operation of which requires highly trained individuals, and which usually fall short in terms of mobility and the duration of analysis. By contrast, methods of detection built upon small molecule-based fluorescent probes present a viable complementary option for quick security screening during in-field applications given their high sensitivity, ease of use, affordability, rapid response time and efficiency.8,9
In recent years, considerable efforts have also been devoted to developing fluorescent probes for phosgene.10–14 In general, probes designed to detect phosgene incorporate a recognition site (e.g. hydroxy and amine functional groups) in their skeleton that suppresses the emission of the fluorophore via several photophysical quenching mechanisms, including intramolecular charge transfer (ICT) and photo-induced electron transfer (PET). In most cases, a chemical reaction between a probe reactive site and phosgene promotes a structural change accompanied by a fluorescence output.15–28
Another key factor influencing the performance of such probes is the photophysical properties of the fluorophore in its skeleton. As an ideal chemical platform for designing fluorescent probes, the BODIPY fluorophore has recently garnered considerable attention owing to its tunable fluorescent properties, ease of chemical modification, high quantum yields and remarkable chemical stability.29–31 BODIPY-based probes for phosgene usually incorporate the reactive unit at the meso-position of the BODIPY core, although some alternatively place it at the 3-position (Scheme 1). The quenching mechanism mostly relies on a PET quenching process, which can be inhibited upon interaction with phosgene.32–43
 | ||
| Scheme 1 Selected examples of BODIPY-based phosgene probes. | ||
As part of our efforts in the field, we recently introduced o-aminobenzylamine (OBA) as a promising alternative to the more commonly used o-phenylenediamine (OPD). We developed a fluorescent probe featuring an OBA unit at the meso-phenyl position of the BODIPY core and assessed its effectiveness in detecting phosgene (Scheme 2b).44 The probe likely operates by modulating a PET process and has demonstrated exceptional performance in terms of selectivity, sensitivity and response time (i.e., <10 s). However, the analytic performance of probes with OPD and OBA units has yet to be systematically compared.
 | ||
| Scheme 2 (a) Probe design strategies and (b) our design strategy for trapping phosgene. | ||
Despite considerable progress in phosgene sensing, overcoming persistent challenges such as low sensitivity, weak turn-on ratios, slow response times and cross-talk with similar molecules continues to be a major hurdle. New probes with improved analytic performance are therefore necessary. Bearing that in mind, we devised two novel probes with the recognition unit OBA or OPD attached at the 2-position of the BODIPY core. Although BODIPY's 2-position remains relatively unexplored, especially in the context of designing fluorescent probes, recent studies have indicated that electron-donating groups on BODIPY's 2-position can significantly quench fluorescence emissions via an ICT.
Given that dynamics, we anticipated that the BOPD and BOBA probes would exhibit minimal fluorescence due to ICT. Interaction with phosgene was also expected to disrupt ICT and thereby restore the fluorescence emission of the probes (see Scheme 2).
2 Experimental
2.1 Materials and measurements
All chemicals were purchased from Sigma-Aldrich or Merck and used without any purification. The NMR spectra of compounds were measured on an Agilent 400 MHz Nuclear Magnetic Resonance Spectrometer, with CDCl3 used as a solvent and tetramethylsilane (TMS) as an internal standard. UV absorption spectra and fluorescence emission spectra were obtained using a Horiba-Duetta, two-in-one fluorescence and absorbance spectrometer. The samples were measured in 10.0 mm path length quartz cuvettes with a volume of 2.0 mL. Mass spectra were recorded on an Agilent 6530 Accurate-Mass QTOF LC/MS. All measurements were conducted at least in triplicate. Fluorescence imaging was performed with a Zeiss Axio Observer inverted fluorescence microscope. SEM imaging was performed with FEI-Quanta 250-FEG.2.2 Synthesis and characterization of probes
Compound 145 and 1-(bromomethyl)-2-nitrobenzene44 were synthesized according to literature procedures.![[thin space (1/6-em)]](https://www.rsc.org/images/entities/char_2009.gif) :1, v/v) to afford 2 (130 mg, 70% yield) as a solid. 1H NMR (400 MHz, CDCl3) δ 7.50–7.44 (m, 3H), 7.33–7.28 (m, 2H), 6.92 (d, J = 8.6 Hz, 2H), 6.68 (d, J = 8.5 Hz, 2H), 3.68 (s, 2H), 2.56 (s, 3H), 2.49 (s, 3H), 2.31 (q, J = 7.5 Hz, 2H), 1.30 (s, 3H), 1.26 (s, 3H), 0.99 (t, J = 7.6 Hz, 3H).
:1, v/v) to afford BOPD (30 mg, 64% yield) as a red solid. 1H NMR (400 MHz, CDCl3) δ 7.51–7.45 (m, 3H), 7.33–7.29 (m, 2H), 7.16–7.13 (m, 1H), 7.04–7.00 (m, 1H), 6.99–6.95 (m, 2H), 6.82–6.79 (m, 1H), 6.79–6.71 (m, 3H), 2.57 (s, 3H), 2.52 (s, 3H), 2.32 (q, J = 7.6 Hz, 2H), 1.31 (s, 3H), 1.28 (s, 3H), 1.00 (t, J = 7.6 Hz, 3H). 13 C NMR (101 MHz, CDCl3) δ 155.01, 153.25, 144.38, 142.09, 140.94, 139.15, 138.32, 135.82, 133.42, 133.22, 131.46, 131.22, 130.79, 129.20, 128.94, 128.45, 128.33, 125.96, 125.09, 124.65, 119.29, 116.34, 114.95, 19.42, 17.23, 14.69, 14.04, 12.81, 11.83 (Fig. S5, ESI†). MS: calcd 534.2766, found 534.28612 ([M + H]+) (Fig. S10, ESI†).
:1, v/v) and concentrated under reduced pressure to afford 3 (50 mg, 38% yield). 1H NMR (400 MHz, CDCl3) δ 8.07 (d, J = 8.2 Hz, 1H), 7.69 (d, J = 7.9 Hz, 1H), 7.59 (t, J = 7.6 Hz, 1H), 7.48–7.40 (m, 4H), 7.30 (d, J = 7.8 Hz, 2H), 6.92 (d, J = 7.2 Hz, 2H), 6.57 (d, J = 7.2 Hz, 2H), 4.73 (s, 2H), 4.38 (s, 1H), 2.55 (s, 3H), 2.49 (s, 3H), 2.31 (q, J = 7.5 Hz, 2H), 1.29 (s, 3H), 1.25 (s, 3H), 0.99 (t, J = 7.6 Hz, 3H).
:1, v/v) and the collected fraction was crystallized in hexane to afford BOBA (40 mg, 64% yield) as a reddish solid. 1H NMR (400 MHz, CDCl3) δ 7.51–7.45 (m, 3H), 7.34–7.29 (m, 2H), 7.19–7.13 (m, 2H), 7.03–6.97 (m, 2H), 6.79–6.70 (m, 4H), 4.23 (s, 2H), 4.12 (s, 2H), 3.73 (s, 1H), 2.57 (s, 3H), 2.52 (s, 3H), 2.32 (q, J = 7.5 Hz, 2H), 1.30 (s, 3H), 1.28 (s, 3H), 1.00 (t, J = 7.5 Hz, 3H) (Fig. S7, ESI†). MS: calcd 548.2923, found 548.30212 ([M + H]+) (Fig. S9, ESI†).
:1, v/v) to afford BOPD-PHOS (10 mg, 60% yield). 1H NMR (400 MHz, CDCl3) δ 8.71 (s, 1H), 7.59–7.46 (m, 5H), 7.38–7.31 (m, 4H), 7.15–7.03 (m, 4H), 2.58 (d, J = 9.5 Hz, 6H), 2.33 (q, J = 7.6 Hz, 2H), 1.33 (s, 6H), 1.01 (t, J = 7.6 Hz, 3H). 13C NMR (100 MHz, CDCl3) δ 154.19, 151.90, 141.36, 135.65, 134.09, 133.87, 133.13, 131.50, 130.64, 130.07, 130.04, 129.34, 129.12, 128.28, 127.73, 125.88, 122.49, 121.88, 109.71, 109.24, 22.84, 17.26, 14.65, 14.27, 12.79, 11.95 (Fig. S6, ESI†).
:1, v/v) to afford BOBA-PHOS (10 mg, 58% yield). 1H NMR (400 MHz, CDCl3) δ 7.61–7.55 (m, 3H), 7.50–7.44 (m, 2H), 7.43–7.39 (m, 2H), 7.35 (s, 1H), 7.30 (d, J = 9.5 Hz, 2H), 7.18 (d, J = 7.7 Hz, 1H), 7.07 (d, J = 7.5 Hz, 1H), 6.85 (d, J = 7.7 Hz, 1H), 4.95 (s, 2H), 2.66 (s, 3H), 2.61 (s, 3H), 2.45–2.39 (m, 2H), 1.40 (s, 3H), 1.38 (s, 3H), 1.09 (t, J = 7.6 Hz, 3H). 13 C NMR (100 MHz, CDCl3) δ 153.95, 152.28, 141.26, 140.81, 139.74, 138.22, 136.68, 135.69, 133.88, 132.28, 132.00, 131.82, 131.82, 131.53, 130.91, 129.30, 129.07, 128.65, 128.29, 125.64, 124.97, 122.53, 118.46, 113.72, 51.60, 17.25, 14.66, 13.39, 12.86, 12.77, 11.91 (Fig. S8, ESI†).
:1, v/v) to afford 2 (130 mg, 70% yield) as a solid. 1H NMR (400 MHz, CDCl3) δ 7.50–7.44 (m, 3H), 7.33–7.28 (m, 2H), 6.92 (d, J = 8.6 Hz, 2H), 6.68 (d, J = 8.5 Hz, 2H), 3.68 (s, 2H), 2.56 (s, 3H), 2.49 (s, 3H), 2.31 (q, J = 7.5 Hz, 2H), 1.30 (s, 3H), 1.26 (s, 3H), 0.99 (t, J = 7.6 Hz, 3H).
:1, v/v) to afford BOPD (30 mg, 64% yield) as a red solid. 1H NMR (400 MHz, CDCl3) δ 7.51–7.45 (m, 3H), 7.33–7.29 (m, 2H), 7.16–7.13 (m, 1H), 7.04–7.00 (m, 1H), 6.99–6.95 (m, 2H), 6.82–6.79 (m, 1H), 6.79–6.71 (m, 3H), 2.57 (s, 3H), 2.52 (s, 3H), 2.32 (q, J = 7.6 Hz, 2H), 1.31 (s, 3H), 1.28 (s, 3H), 1.00 (t, J = 7.6 Hz, 3H). 13 C NMR (101 MHz, CDCl3) δ 155.01, 153.25, 144.38, 142.09, 140.94, 139.15, 138.32, 135.82, 133.42, 133.22, 131.46, 131.22, 130.79, 129.20, 128.94, 128.45, 128.33, 125.96, 125.09, 124.65, 119.29, 116.34, 114.95, 19.42, 17.23, 14.69, 14.04, 12.81, 11.83 (Fig. S5, ESI†). MS: calcd 534.2766, found 534.28612 ([M + H]+) (Fig. S10, ESI†).
:1, v/v) and concentrated under reduced pressure to afford 3 (50 mg, 38% yield). 1H NMR (400 MHz, CDCl3) δ 8.07 (d, J = 8.2 Hz, 1H), 7.69 (d, J = 7.9 Hz, 1H), 7.59 (t, J = 7.6 Hz, 1H), 7.48–7.40 (m, 4H), 7.30 (d, J = 7.8 Hz, 2H), 6.92 (d, J = 7.2 Hz, 2H), 6.57 (d, J = 7.2 Hz, 2H), 4.73 (s, 2H), 4.38 (s, 1H), 2.55 (s, 3H), 2.49 (s, 3H), 2.31 (q, J = 7.5 Hz, 2H), 1.29 (s, 3H), 1.25 (s, 3H), 0.99 (t, J = 7.6 Hz, 3H).
:1, v/v) and the collected fraction was crystallized in hexane to afford BOBA (40 mg, 64% yield) as a reddish solid. 1H NMR (400 MHz, CDCl3) δ 7.51–7.45 (m, 3H), 7.34–7.29 (m, 2H), 7.19–7.13 (m, 2H), 7.03–6.97 (m, 2H), 6.79–6.70 (m, 4H), 4.23 (s, 2H), 4.12 (s, 2H), 3.73 (s, 1H), 2.57 (s, 3H), 2.52 (s, 3H), 2.32 (q, J = 7.5 Hz, 2H), 1.30 (s, 3H), 1.28 (s, 3H), 1.00 (t, J = 7.5 Hz, 3H) (Fig. S7, ESI†). MS: calcd 548.2923, found 548.30212 ([M + H]+) (Fig. S9, ESI†).
:1, v/v) to afford BOPD-PHOS (10 mg, 60% yield). 1H NMR (400 MHz, CDCl3) δ 8.71 (s, 1H), 7.59–7.46 (m, 5H), 7.38–7.31 (m, 4H), 7.15–7.03 (m, 4H), 2.58 (d, J = 9.5 Hz, 6H), 2.33 (q, J = 7.6 Hz, 2H), 1.33 (s, 6H), 1.01 (t, J = 7.6 Hz, 3H). 13C NMR (100 MHz, CDCl3) δ 154.19, 151.90, 141.36, 135.65, 134.09, 133.87, 133.13, 131.50, 130.64, 130.07, 130.04, 129.34, 129.12, 128.28, 127.73, 125.88, 122.49, 121.88, 109.71, 109.24, 22.84, 17.26, 14.65, 14.27, 12.79, 11.95 (Fig. S6, ESI†).
:1, v/v) to afford BOBA-PHOS (10 mg, 58% yield). 1H NMR (400 MHz, CDCl3) δ 7.61–7.55 (m, 3H), 7.50–7.44 (m, 2H), 7.43–7.39 (m, 2H), 7.35 (s, 1H), 7.30 (d, J = 9.5 Hz, 2H), 7.18 (d, J = 7.7 Hz, 1H), 7.07 (d, J = 7.5 Hz, 1H), 6.85 (d, J = 7.7 Hz, 1H), 4.95 (s, 2H), 2.66 (s, 3H), 2.61 (s, 3H), 2.45–2.39 (m, 2H), 1.40 (s, 3H), 1.38 (s, 3H), 1.09 (t, J = 7.6 Hz, 3H). 13 C NMR (100 MHz, CDCl3) δ 153.95, 152.28, 141.26, 140.81, 139.74, 138.22, 136.68, 135.69, 133.88, 132.28, 132.00, 131.82, 131.82, 131.53, 130.91, 129.30, 129.07, 128.65, 128.29, 125.64, 124.97, 122.53, 118.46, 113.72, 51.60, 17.25, 14.66, 13.39, 12.86, 12.77, 11.91 (Fig. S8, ESI†).
| ΦF(X) = ΦF(S)(ASFX/AXFS)(nX/nS)2 |
2.3 Density functional theory calculations
Density functional theory (DFT) calculations were performed using the Gaussian1646 software package. The B3LYP functional with the 6-31G(d,p) basis set was employed to optimize molecular geometries and obtain electronic properties. Calculations were conducted in both the gas phase and solvent phase, where the implicit solvation model IEFPCM (integral equation formalism polarizable continuum model) was used to simulate the solvent environment. Acetonitrile was chosen as the solvent in the IEFPCM model to closely mimic the experimental conditions. All structures were optimized to a minimum, confirmed by the absence of imaginary frequencies in the frequency calculations.3 Results and discussion
BOPD and BOBA were prepared through a straightforward synthetic route, as detailed in Scheme 3. Using a Suzuki coupling protocol compound 1 was first coupled with 4-aminophenylboronic acid to yield compound 2. Intermediate 2, was then reacted with 1-fluoro-2-nitrobenzene and subsequently reduced with hydrazine hydrate and Pd/C to compound 3 to produce BOPD. In parallel, BOBA was synthesized by reacting compound 2 with 1-bromomethyl-2-nitrobenzene, followed by reduction of the NO2-phenyl BODIPY derivative. The structures of both compounds were unequivocally confirmed thorough NMR spectroscopy and HRMS. | ||
| Scheme 3 Synthetic pathway of BOBA and BOPD. | ||
With the two target probes in hand, we first assessed their spectral properties using UV and fluorescence spectroscopy. As shown in Fig. 1, the UV spectrum of both probes in acetonitrile displayed absorption bands at 525 nm as is characteristic of a BODIPY fluorophore. Meanwhile, no emission bands were recorded in the fluorescence spectrum upon excitation at 500 nm, which indicates that the quenching effect of both recognition groups is remarkably strong when positioned at the 2-position of the BODIPY core.
 | ||
| Fig. 1 Absorbance spectra of (a) BOPD (5 μM) and (b) BOBA (5 μM) in the absence and presence of 5 equiv. (25 μM) of triphosgene CH3CN. Titration experiments of (c) BOPD and (d) BOBA with the addition of 1–10 equiv. of triphosgene in CH3CN. The insets show the final and initial ratio of fluorescence intensities. | ||
By contrast, introducing triphosgene – a safer, non-volatile analogue of phosgene – induced a change in the colour of the probes’ solution accompanied by the emergence of a green emission under UV light. The green emission provided clear evidence of a structural alteration in BODIPY's π-electronic system. In spectroscopic analysis, adding triphosgene caused a minor hypsochromic shift of approximately 5 nm in the absorption band, as observed in the UV spectrum, which suggests an interaction between the probes and triphosgene that could alter the electronic environment of the chromophores. Adding triphosgene also significantly elevated the emission intensity at 547 nm for BOBA and at 552 nm for BOPD, with a linear relationship observed across the range of added concentration. Although the emission intensity plateaued after 30 s, it had increased by 20-fold for BOPD and by 4000-fold and with a much quicker response (i.e., <10 s, see Fig. S2, ESI†) for BOBA with the addition of 5 equivalents of triphosgene.
The data gathered from fluorescence measurements revealed detection limits of 93 nM and 1.40 nM (i.e., based on S/N 3σ/k) for BOPD and BOBA, respectively, which were well below the fatal concentration for each probe. Those findings suggest that both BOPD and BOBA are effective in quantitatively detecting phosgene (Table 1).
The selectivity profile of both probes was tested under the same sensing conditions in the presence of other potentially reactive species, including formaldehyde, nerve agent mimic diethyl chlorophosphite, DEA/NONOate and chlorine-containing electrophiles such as tosyl chloride, acetyl chloride, oxalyl chloride, thionyl chloride and phosphorus oxychloride. Between the two probes, BOPD displayed exceptional selectivity towards triphosgene and no spectral responses towards other tested species (Fig. 2a), including DEA/NONOate, a source of NO that typically interferes with OPD-based probes.
 | ||
| Fig. 2 Fluorescence intensity change of (a) BOPD (5 μM, λex = 500 nm, slit width: 5) and (b) BOBA (5 μM, λex = 500 nm, slit width: 3) in CH3CN recorded after the addition of various analytes (10 equiv.). (1) Probe only, (2) FA, (3) DCP, (4) p-TsCl, (5) DEA/NONOate, (6) CH3COCl, (7) (COCl)2, (8) SOCl2, (9) POCl3, and (10) triphosgene. (c) Time-dependent fluorescence change of BOBA (5 μM, λex = 500 nm) and BOPD (5 μM, λex = 500 nm) in the presence of triphosgene (5 equiv.) in CH3CN. | ||
Against our expectations, despite BOBAs significantly faster response time and higher fluorescence turn-on ratio than BOPD's, its selectivity was notably inferior, for it strongly interfered with electrophiles such as acetyl chloride. The distinct selectivity of BOPD for phosgene, compared to other carbonyl compounds, can be primarily attributed to the lower pKa of the reactive amines (pKa = 0.78)47 involved in the deactivation of the ICT process. This lower pKa allows BOPD to form more specific interactions with phosgene, thereby improving its selectivity and minimizing interference from other compounds. In contrast, as shown in Fig. 2b, BOBA, due to the higher pKa and increased reactivity of its amines (pKa = 4.04),48 exhibited a significantly reduced ability to differentiate between reactive analytes, leading to lower specificity towards compounds such as CH3COCl, SOCl2, COCl2, and POCl3. Consequently, BOPD's lower pKa is a critical factor driving its superior selectivity for phosgene in complex environments. Those findings demonstrate that, at least in that particular instance, the o-phenylenediamine (OPD)-based recognition unit exhibited superior selectivity over the o-aminobenzylamine (OBA)-based unit, which runs counter to our result reported earlier.44
Building on earlier reports,14,16–18,44 we hypothesised that a probe's recognition of phosgene proceeds via a mechanism initiated by the carbonylation of one of the reactive amines, which leads to an intramolecular cyclisation with the neighbouring amine group and consequently results in the formation of a five-membered quinazolinone ring. To verify the proposed mechanism, we analysed spectral changes in the 1H-NMR spectrum of BOBA (i.e., in CDCl3) after adding triphosgene. The partial 1H-NMR spectra of BOBA before and after reacting with phosgene, denoted as “BOBA-PHOS”, appear in Fig. 3. As observed, the signals at 10.47 ppm (–NH2) and 8.07 ppm (–NH), corresponding to the amine protons, disappeared following treatment with phosgene, which clearly indicates a reaction at the nucleophilic amine sites of BODIPYs core. Likewise, the peak at 4.23 ppm (Ha), attributed to benzylic hydrogens, shifted downfield to 4.95 ppm (Ha), which further suggests that a reaction occurred near the site. Data from high-resolution mass spectrometry, along with the results of NMR, confirmed the formation of the quinazolinone-appended BODIPY derivative. That transformation was consistent with the coupling of the –NH2 and –NH groups with phosgene, which led to the closure of the ring structure.
 | ||
| Fig. 3 Partial 1H NMR spectra of BOBA (bottom) and BOBA-PHOS (top) in CDCl3. | ||
Calculations based on density functional theory (DFT) were performed to illuminate the photophysical mechanisms underlying the sensing behaviour of BOPD and BOBA. The optimised molecular structures, electron density distributions and frontier orbitals of BOPD, BOBA and BOD-SYR, both before and after exposure to phosgene, appear in Fig. 4. The analysis of HOMO–LUMO indicates that the sensing mechanisms for BOPD and BOBA were comparable. In BOPD’s HOMO state, the charge density, albeit distributed across the entire molecule, was concentrated on the recognition unit. Conversely, in the LUMO state, the electron density was localised to BODIPYs core and thus initiated ICT. Consequently, ICT reduced the orbital overlap between the HOMO and LUMO states, which led to a significantly lower radiative transition rate and a quenched fluorescence emission. In contrast, the interaction of BOPD with phosgene promoted a cyclisation reaction that altered both the geometry and electronic structure of BOPD. Following that structural reorganisation, the electron density on BODIPYs core increased dramatically in the HOMO state compared with its unmodified form, and the increase resulted in a more effective overlap between the HOMO and LUMO that enhanced the radiative transitions and consequently increased the efficiency of fluorescence. Meanwhile, the HOMO–LUMO configuration of BOD-SYR displayed a characteristic PET mechanism, in which the charge density was fully transferred from the recognition unit to BODIPY's core. Those findings clearly demonstrate that BOD-SYR, due to featuring a recognition unit at the meso-phenyl position of BODIPY, operates via a PET mechanism, whereas BOBA and BOPD, with the recognition unit at the 2-position, follow a different emission mechanism, one that specifically proceeds via the modulation of an ICT.
 | ||
| Fig. 4 Frontier molecular orbital (FMO) analysis of the HOMO and LUMO for BOBA, BOBA-PHOS, BOD-SYR, and BOD-SYR-PHOS. Molecules shown in gray (BOBA and BOD-SYR) exhibit no fluorescence emission, attributed to intramolecular charge transfer (ICT) and the presence of a photoinduced electron transfer (PET) process. Molecules shown in green (BOBA-PHOS and BOD-SYR-PHOS) exhibit fluorescence emission due to weak ICT and the absence of PET. | ||
Building on BOPD’s remarkable analytic performance relative to examples in the literature (Table S1, ESI†), we recognised the need to develop a portable sensing platform that would enable real-time monitoring in environments where exposure to phosgene is a concern. Incorporating small-molecule fluorescent sensors into solid-based materials, fabrics and fibres allows the development of versatile, highly sensitive detection platforms that are particularly advantageous for detecting toxic gases such as phosgene. With that in mind, for our design we used small-headed cotton swabs as the supporting surface due to their inherent high surface area and mobility, which make them particularly suited for on-site applications. By embedding BOPD on the swabs surface (for TLC plates, see Fig. S3, ESI†) we fabricated a portable sensing system that responded to triphosgene in solution. When swabs containing BOPD were dipped into triphosgene solutions, a bright green fluorescence was instantly observed under UV light. The fluorescence emission intensified as the concentration of triphosgene increased, which indicates a clear correlation between the amount of triphosgene present and the fluorescent response of the swabs.
Although BOPD-embedded cotton swaps efficiently detected triphosgene in the liquid phase, expanding its application beyond the liquid phase to enable the detection of phosgene in its gaseous state continued to be a challenge. Fibrous materials, including nonwoven ones, offer a high surface area and porosity, which enhances the interaction between the sensing material and the target analytes, thereby improving sensitivity and detection limits. Bearing that in mind, we treated polypropylene-derived, nonwoven strips with a fixed concentration of BOPD to create a physiosorbed layer of the probe and subsequently exposed them, under sealed conditions, to varying concentrations of phosgene generated in situ from triphosgene-Et3N (Fig. 5).
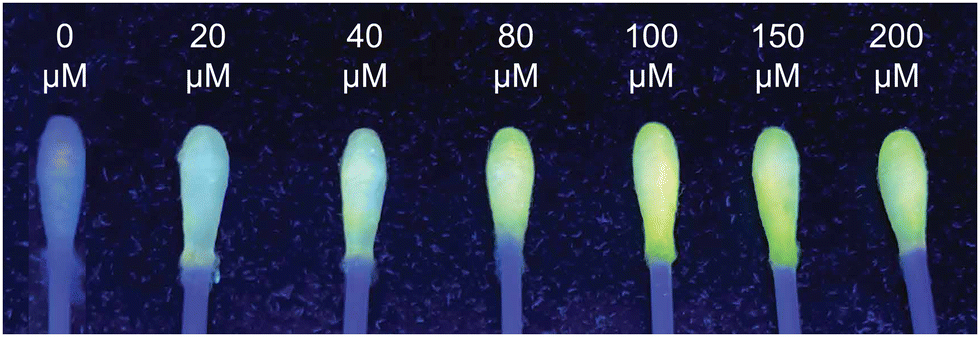 | ||
| Fig. 5 Image depicting fluorometric detection of BOPD-loaded medical cotton swabs (20 μM) with different concentrations of triphosgene in solution (1–10 equiv.) under UV light. | ||
The fluorescence images and SEM images of the nonwoven strips were captured before and after exposure to phosgene. As Fig. 6 shows, bright-field and SEM images of the nonwoven materials revealed no morphological changes after exposure to phosgene gas. In contrast, fluorescence images showed that the BOPD-adsorbed nonwoven materials initially exhibited no fluorescence emission; however, after exposure to 30 ppm of phosgene gas—well below the lethal concentration—a remarkably strong green emission was observed. Such an instant, observable change in fluorescence underscored the effectiveness of BOPD-fabricated nonwoven strips as practical, sensitive tools for the on-site detection of gaseous phosgene.
 | ||
| Fig. 6 Bright-field images of (a) the nonwoven mask treated with BOPD and (b) with BOPD and triphosgene.Fluorescence images of (c) the nonwoven mask treated with BOPD and (d) BOPD and triphosgene. SEM images showing the surface morphology of the nonwoven mask (e) before and after (f) treatment with BOPD, and (g) with BOPD and triphosgene. | ||
Phosgene's accumulation in the environment has profound detrimental effects on ecosystems. Once phosgene enters soil or water, it likely hydrolyses into HCl and CO2 which acidifies soil. That process interferes with plant metabolism and ultimately hinders plant growth. To gain insights into how plant roots might absorb phosgene, it is essential to monitor its trafficking in plant systems. However, imaging phosgene in plant tissue poses significant challenges due to its highly reactive nature. Nevertheless, using phosgene-specific fluorescent probes, which can be embedded in plant tissues, could theoretically allow detecting phosgene and enhance current understandings of its interactions with the root systems of plants. To our knowledge, no literature addresses the use of a fluorescent probe to monitor the accumulation of phosgene in plants.
Encouraged by BOPD’s remarkable performance in both solution and solid matrices, we sought to explore its potential for monitoring the uptake of phosgene by plant cells. To that end, the roots of 10-day-old Arabidopsis thaliana were incubated for 10 min in an aqueous solution containing BOPD, followed by incubation with the nuclear staining dye, DAPI, for 10 min. After subsequent exposure to triphosgene for 10 min, the root tips were rinsed with PBS and analysed using fluorescence microscopy. As Fig. 7 clearly shows, root cells exposed to BOPD displayed no fluorescence emission. However, upon incubation with triphosgene, the root cells rapidly developed a green florescence reflecting the probes typical behaviour in solution. The results of our preliminary plant cell imaging study suggest that plant cells can efficiently absorb BOPDvia their root systems and have considerable potential for imaging phosgene in plant tissues.
 | ||
| Fig. 7 Fluorescence images of the Arabidopsis thaliana roots. (a) Incubated with only BOPD (10 μM); (b) treated with BOPD and triphosgene (5 equiv.); (c) treated with DAPI (10 μM). | ||
4 Conclusions
In sum, we constructed two novel phosgene-specific fluorescent probes – BOPD and BOBA – each equipped with phosgene-specific recognition units (i.e., OPD and OBA, respectively) at the 2-position of BODIPY's core. A systematic study comparing the analytic performance of the recognition units showed that BOBA, equipped with OBA as the recognition unit, demonstrated a remarkably low detection limit and a rapid response time (<10 s) for triphosgene. By comparison, BOPD, featuring an OPD unit, showed superior selectivity towards triphosgene, with a detection limit of 93 nM and a response time of up to 30 s. The detection of triphosgene proceeded via its capture through a sequential substitution–cyclisation process. The fluorescent turn-on response of the probes was attributed to the modulation of an ICT, as validated by computational studies based on DFT. Beyond that, we developed a portable sensing platform by loading BOPD onto test strips made of TLC plates, nonwoven materials and small-headed cotton swabs. Lastly, we demonstrated the first successful application of a fluorescent probe, namely BOPD, for monitoring phosgene accumulation in plants, specifically Arabidopsis thaliana.Author contributions
Suay Dartar: synthesis, implementation of experiments and analytical studies, data analysis, implementation of plant and melt-blown nonwovens imaging experiments and manuscript preparation. Beraat Umur Kaya: implementation of plant and melt-blown nonwovens imaging experiments, data analysis, and manuscript preparation. Yank Öncü Yayak: theoretical calculations, data analysis, and manuscript preparation. Ezgi Vural: synthesis of BOBA. Mustafa Emrullahoğlu: inception of the concept and management of the project, writing and editing.Data availability
The data supporting this article have been included as part of the ESI.†Conflicts of interest
There are no conflicts to declare.Acknowledgements
This work was granted by the İzmir Institute of Technology (IZTECH) through project “YÖK AÜDP-2022IYTE-2-0007”. We gratefully acknowledge the support and thank the IZTECH Nuclear Magnetic Resonance Application and Research Center (IZTECH-NMRM) and the IZTECH Center for Materials Research (IZTECH-CMR). Computational resources were provided by TUBITAK ULAKBIM, High Performance and Grid Computing Center (TR-Grid e-Infrastructure).Notes and references
- S. A. Cucinell and E. Arsenal, Arch. Environ. Health, 1974, 28, 272–275 Search PubMed.
- S. Aggarwal, T. Jilling, S. Doran, I. Ahmad, J. E. Eagen, S. Gu, M. Gillespie, C. J. Albert, D. Ford and J.-Y. Oh, et al. , Toxicol. Lett., 2019, 312, 204–213 Search PubMed.
- R. C. Gupta, Handbook of toxicology of chemical warfare agents, Academic Press, 2015 Search PubMed.
- M. C. Winternitz, Pathology of War Gas Poisoning, Yale University Press, New Haven, CT, 1920, pp. 33–66 Search PubMed.
- A. M. Prentiss, Chemicals in War, McGraw-Hill, New York, 1st edn, 1937, pp. 216–217 Search PubMed.
- J. M. Bissinger, K. T. Rullo, J. T. Stoklosa, C. M. Shearer and N. J. DeAngelis, J. Chromatogr. A, 1983, 268, 102–106 Search PubMed.
- R. M. Black, R. J. Clarke, R. W. Read and M. T. Reid, J. Chromatogr. A, 1994, 662, 301–321 Search PubMed.
- J. Chan, S. C. Dodani and C. J. Chang, Nat. Chem., 2012, 4, 973–984 Search PubMed.
- M. Hee Lee, J. Seung Kim and J. Sessler, Chem. Soc. Rev., 2015, 44, 4185–4191 Search PubMed.
- J. Tan, Z. Li, Z. Lu, R. Chang, Z. Sun and J. You, Dyes Pigm., 2021, 193, 109540 Search PubMed.
- B. Zhu, R. Sheng, T. Chen, J. Rodrigues, Q.-H. Song, X. Hu and L. Zeng, Coord. Chem. Rev., 2022, 463, 214527 Search PubMed.
- X. Hu, Y. Ke, H. Ye, B. Zhu, J. Rodrigues and R. Sheng, Dyes Pigm., 2023, 216, 111379 Search PubMed.
- W.-Q. Meng, A. C. Sedgwick, N. Kwon, M. Sun, K. Xiao, X.-P. He, E. V. Anslyn, T. D. James and J. Yoon, Chem. Soc. Rev., 2023, 52, 601–662 Search PubMed.
- S. Shanmugaraju, N. M. Kunhumon, A. V. Krishna and T. Gunnlaugsson, Sens. Diagn., 2024, 3, 783–798 Search PubMed.
- X. Wu, Z. Wu, Y. Yang and S. Han, Chem. Commun., 2012, 48, 1895–1897 Search PubMed.
- H.-C. Xia, X.-H. Xu and Q.-H. Song, ACS Sens., 2017, 2, 178–182 Search PubMed.
- Y. Hu, L. Chen, H. Jung, Y. Zeng, S. Lee, K. M. K. Swamy, X. Zhou, M. H. Kim and J. Yoon, ACS Appl. Mater. Interfaces, 2016, 8, 22246–22252 Search PubMed.
- X. Zhou, Y. Zeng, C. Liyan, X. Wu and J. Yoon, Angew. Chem., Int. Ed., 2016, 55, 4729–4733 Search PubMed.
- L. Chen, D. Wu, J.-M. Kim and J. Yoon, Anal. Chem., 2017, 89, 12596–12601 Search PubMed.
- S.-L. Wang, L. Zhong and Q.-H. Song, Chem. Commun., 2017, 53, 1530–1533 Search PubMed.
- P. Liu, N. Liu, C. Liu, Y. Jia, L. Huang, G. Zhou, C. Li and S. Wang, Dyes Pigm., 2019, 163, 489–495 Search PubMed.
- B. Sen, S. K. Patra and S. Khatua, Inorg. Chem., 2021, 60, 19175–19188 Search PubMed.
- Z.-J. Li, W.-J. Zhang, W.-Z. Bi, Q.-J. Ma, S.-X. Feng, X.-L. Chen and L.-B. Qu, RSC Adv., 2021, 11, 10836–10841 Search PubMed.
- L. Yang, F. Wang, J. Zhao, X. Kong, K. Lu, M. Yang, J. Zhang, Z. Sun and J. You, Talanta, 2021, 221, 121477 Search PubMed.
- L. Da-Xue, L. Dan, Z. Liang, X. Yan-Hua, S. Shao-Hui, Z. Bo, L. Rui, Z. Hong-Ling, L. Jian and H. Zhi-Ping, et al. , Chem. Commun., 2022, 58, 5296–5299 Search PubMed.
- N. Vijay, S. P. Wu and S. Velmathi, Sens. Actuators, B, 2022, 371, 132567 Search PubMed.
- N. Vijay, G. Balamurugan, P. Jerome and T. H. Oh, J. Photochem. Photobiol., A, 2024, 454, 115722 Search PubMed.
- K. Magesh, S. P. Wu and S. Velmathi, Microchem. J., 2024, 201, 110686 Search PubMed.
- A. Loudet and K. Burgess, Chem. Rev., 2007, 107, 4891–4932 Search PubMed.
- G. Ulrich, R. Ziessel and A. Harriman, Angew. Chem., Int. Ed., 2008, 47, 1184–1201 Search PubMed.
- S. Kolemen and E. U. Akkaya, Coord. Chem. Rev., 2018, 354, 121–134 Search PubMed.
- H.-C. Xia, X.-H. Xu and Q.-H. Song, Anal. Chem., 2017, 89, 4192–4197 Search PubMed.
- Y. Zhang, A. Peng, X. Jie, Y. Lv, X. Wang and Z. Tian, ACS Appl. Mater. Interfaces, 2017, 9, 13920–13927 Search PubMed.
- T.-I. Kim, B. Hwang, J. Bouffard and Y. Kim, Anal. Chem., 2017, 89, 12837–12842 Search PubMed.
- T.-I. Kim, D. Kim, J. Bouffard and Y. Kim, Sens. Actuators, B, 2019, 283, 458–462 Search PubMed.
- T. Cao, D. Gong, L. Zheng, J. Wang, J. Qian, W. Liu, Y. Cao, K. Iqbal, W. Qin and A. Iqbal, Anal. Chim. Acta, 2019, 1078, 168–175 Search PubMed.
- X.-Z. Wei, Y.-L. Fu, M.-J. Xue and Q.-H. Song, Org. Lett., 2019, 21, 9497–9501 Search PubMed.
- T. Chen, L. Jiang, J.-T. Hou, W. Wang, L. Zeng and G.-M. Bao, J. Mater. Chem. A, 2020, 8, 24695–24702 Search PubMed.
- Y.-L. Fu, Y.-Y. Chong, H. Li, W. Feng and Q.-H. Song, Chem. – Eur. J., 2021, 27, 4977–4984 Search PubMed.
- J. Tan, Z. Li, W. Yao, Z. Ji, Z. Sun and J. You, Dyes Pigm., 2021, 187, 109138 Search PubMed.
- Y. Bian, Y. Wang, H. Yuan, G.-M. Bao and D. Su, Dyes Pigm., 2022, 198, 110009 Search PubMed.
- L. Zeng, T. Chen, B. Zhu, S. Koo, Y. Tang, W. Lin, T. D. James and J. S. Kim, Chem. Sci., 2022, 13, 4523–4532 Search PubMed.
- B. Zhu, X. Yang, L. Jiang, T. Chen, S. Wang and L. Zeng, Chin. Chem. Lett., 2024, 110222 Search PubMed.
- M. Sayar, E. Karakus, T. Güner, B. Yildiz, U. H. Yildiz and M. Emrullahoğlu, Chem. – Eur. J., 2018, 24, 3136–3140 Search PubMed.
- M. Çevik Eren, A. Eren, S. Dartar, B. Buse Tütüncü and M. Emrullahoğlu, Eur. J. Inorg. Chem., 2022, e202200093 Search PubMed.
- M. J. Frisch, G. W. Trucks, H. B. Schlegel, G. E. Scuseria, M. A. Robb, J. R. Cheeseman, G. Scalmani, V. Barone, G. A. Petersson, H. Nakatsuji, X. Li, M. Caricato, A. V. Marenich, J. Bloino, B. G. Janesko, R. Gomperts, B. Mennucci, H. P. Hratchian, J. V. Ortiz, A. F. Izmaylov, J. L. Sonnenberg, D. Williams-Young, F. Ding, F. Lipparini, F. Egidi, J. Goings, B. Peng, A. Petrone, T. Henderson, D. Ranasinghe, V. G. Zakrzewski, J. Gao, N. Rega, G. Zheng, W. Liang, M. Hada, M. Ehara, K. Toyota, R. Fukuda, J. Hasegawa, M. Ishida, T. Nakajima, Y. Honda, O. Kitao, H. Nakai, T. Vreven, K. Throssell, J. A. Montgomery, Jr., J. E. Peralta, F. Ogliaro, M. J. Bearpark, J. J. Heyd, E. N. Brothers, K. N. Kudin, V. N. Staroverov, T. A. Keith, R. Kobayashi, J. Normand, K. Raghavachari, A. P. Rendell, J. C. Burant, S. S. Iyengar, J. Tomasi, M. Cossi, J. M. Millam, M. Klene, C. Adamo, R. Cammi, J. W. Ochterski, R. L. Martin, K. Morokuma, O. Farkas, J. B. Foresman and D. J. Fox, Gaussian∼16 Revision C.01, 2016, Gaussian Inc., Wallingford CT Search PubMed.
- J. Sangster, J. Phys. Chem. Ref. Data, 1989, 18, 1111–1229 Search PubMed.
- E. Folkers and O. Runquist, J. Org. Chem., 1964, 29, 830–832 Search PubMed.
Footnote |
| † Electronic supplementary information (ESI) available. See DOI: https://doi.org/10.1039/d4tb02040e |
| This journal is © The Royal Society of Chemistry 2024 |