
A versatile fluorescent probe for hydrogen peroxide in serotonergic neurons of living brains of mice with depression†
Feida
Che‡
a,
Xiaoming
Zhao‡
a,
Qi
Ding
a,
Xiwei
Li
a,
Wen
Zhang
 a,
Ping
Li
*ab,
Xin
Wang
*ac and
Bo
Tang
ad
a,
Ping
Li
*ab,
Xin
Wang
*ac and
Bo
Tang
ad
aCollege of Chemistry, Chemical Engineering and Materials Science, Collaborative Innovation Center of Functionalized Probes for Chemical Imaging in Universities of Shandong, Key Laboratory of Molecular and Nano Probes, Ministry of Education, Institutes of Biomedical Sciences, Shandong Normal University, Jinan 250014, Shandong, People's Republic of China. E-mail: lip@sdnu.edu.cn; xinwang@sdnu.edu.cn
bCollege of Chemistry and Chemical Engineering, Northwest Normal University, Lanzhou 730070, People's Republic of China
cState Key Laboratory of Molecular Engineering of Polymers, Fudan University, People's Republic of China
dLaoshan Laboratory, Qingdao 266237, Shandong, People's Republic of China
First published on 16th September 2024
Abstract
Depression, a prevalent mental illness, is intricately linked with the neurotransmitters in the brain, while serotonin as a crucial regulator of mood, energy levels, and memory, has been implicated in depression. So, the release of serotonin by serotonergic neurons plays a significant role in the development of depression. Notably, the foremost marker of oxidative stress, hydrogen peroxide (H2O2), can interfere with the functioning of serotonergic neurons and potentially contribute to depression. Investigating the impact of H2O2 on serotonergic neurons could offer valuable insights into the mechanisms underlying depression. However, there have been no effective tools for selectively imaging H2O2 in these neurons so far. To address this gap, we created a small molecular fluorescent probe, PF-H2O2, designed specifically for imaging H2O2 in serotonergic neurons under oxidative stress. PF-H2O2 exerts excellent serotonergic neuron-targetability and notable selectivity for H2O2. Furthermore, we discovered increased H2O2 in serotonergic neurons of mice with depressive symptoms. Altogether, this endeavour unveils a pioneering tool for exploring pathophysiology linked to serotonergic neuronal dysfunction.
Introduction
Depression is a widespread and often recurrent mental health disorder, with a global prevalence rate of 4.4%.1 Major depressive disorder (MDD) significantly affects various aspects of life, including educational attainment, interpersonal relationships, and occupational functioning.2 Additionally, it may be associated with comorbid conditions such as obesity and cardiovascular diseases, as well as an increased risk of premature mortality, including suicide.3 Nevertheless, the etiology of depression is multifaceted, and elucidating its pathogenesis remains a significant challenge.The brain exhibits a pronounced sensitivity to oxidative stress due to its high lipid content and extensive oxygen metabolism.4 Oxidative stress refers to a pathological imbalance resulting from the accumulation of reactive oxygen species (ROS) within the body, which surpasses the capacity of endogenous antioxidant defenses.5,6 This imbalance can lead to cellular damage and functional impairments, with neurons being particularly vulnerable to such detrimental effects.7 Neuronal dysfunction is one of the important pathological mechanisms of brain diseases such as depression. Serotonergic neurons are responsible for the synthesis and release of serotonin (5-HT), which regulates mood, sleep, and memory, and their dysfunction is strongly linked to depression.8,9 Hydrogen peroxide (H2O2) is an important intracellular redox signaling molecule that is normally involved in cell signaling and functional regulation.10 However, elevated H2O2 levels caused by oxidative stress can damage DNA, proteins, and lipids, ultimately leading to cell apoptosis.10 In the nervous system, excessive accumulation of H2O2 may lead to dysfunction of neurons such as serotonergic ones, which can induce or worsen depression. Therefore, understanding the changes in H2O2 levels in serotonergic neurons during the occurrence and development of depression is crucial for comprehending the pathological mechanism of depression.
Currently, several methods are available to detect H2O2 in the brain. For example, Kasai et al. designed an electrochemical sensor to monitor H2O2 levels in rat hippocampal slices,11 while Michael et al. employed an electrical current sensor to track H2O2 concentrations in the environment surrounding brain cells.12 However, these methods require in vitro testing or minimally invasive surgery on living brains and cannot simultaneously provide temporal and spatial information about hydrogen peroxide. In contrast, fluorescence imaging offers advantages such as high sensitivity, high resolution, non-invasiveness, and real-time in situ monitoring, making it a powerful tool for the real-time detection of H2O2.13–18 For example, Chang et al. developed a borate fluorescent probe to detect changes in H2O2 concentration in living cells, including hippocampal neurons, using confocal microscopy and two-photon microscopy.19 Additionally, they created an H2O2 sensor that visualizes cellular redox signaling in microglia–neuron co-culture cell models.20 However, effective fluorescent probes for the real-time and in situ detection of H2O2 in serotonergic neurons are still lacking.
Therefore, in order to reveal the changes in H2O2 levels in brain serotonergic neurons, we have designed and synthesized a novel fluorescent probe (PF-H2O2) that specifically detects H2O2 in serotonergic neurons. The probe is divided into 3 parts: (1) since the serotonin transporter (SERT) is a transmembrane protein unique to serotonergic neurons,21,22 we used paroxetine, a specific inhibitor of SERT,23 as the specific targeting group of serotonergic neurons. (2) We used fluorescein with a high quantum yield as the fluorophore. (3) We employed phenylborate as the H2O2 recognition group (Fig. 1). The incorporation of phenylborate groups at the 3′ and 6′ positions of a xanthenone scaffold would compel this platform to assume a closed, colorless, and non-fluorescent lactone configuration. Upon exposure to H2O2, the hydrolytic deprotection of the phenylborate would result in the formation of an open, colored, and fluorescent fluorescein product (Fig. 1). Using PF-H2O2, we visualized changes in the levels of H2O2 in serotonergic neurons and found elevated levels of H2O2 in serotonergic neurons in depressed mouse brains through in vivo imaging.
 | ||
| Fig. 1 Structure and recognition mechanism of PF-H2O2. | ||
Experimental section
Apparatus and reagents
Details regarding the apparatus and reagents used in this study can be found in the ESI.†Synthesis of PF
5-Carboxyfluorescein (0.3763 g, 1 mmol) was dissolved in 6 ml N,N-dimethylformamide (DMF), with DMAP (0.122 g, 1 mmol) and DCC (0.26 g, 1 mmol) and stirred for 30 min. Paroxetine (0.3748 g, 1 mmol) was then added and stirred at room temperature for 24 h. The compound PF (0.42 g, 60% yield) was purified by thin layer chromatography. PF: 1H NMR (400 MHz, DMSO-d6) δ 8.03–7.87 (m, 1H), 7.47–7.24 (m, 2H), 7.13 (dt, J = 8.8, 4.1 Hz, 2H), 6.57 (dd, J = 9.3, 2.6 Hz, 1H), 6.12–5.98 (m, 2H), 5.98–5.85 (m, 3H), 5.82 (d, J = 7.9 Hz, 3H), 3.58 (s, 1H), 3.16 (s, 3H), 2.89 (s, 2H), 2.73 (s, 2H), 1.75–1.68 (m, 4H), 1.66–1.55 (m, 4H).13C NMR (101 MHz, DMSO-d6) δ 181.20, 180.85, 162.78, 157.89, 157.87, 148.34, 141.66, 124.12, 124.12, 123.31, 115.78, 115.78, 115.56, 103.58, 102.97, 101.45, 52.74, 49.05, 47.97, 40.61, 40.40, 40.19, 39.98, 39.77, 39.56, 39.36, 36.25, 33.81, 31.75, 31.24, 31.24, 29.58, 29.48, 29.16, 29.04, 28.90, 27.02, 25.81, 25.71, 25.57, 25.39, 24.98, 24.94, 22.56, 14.42. HRMS (ESI), m/z calculated for C40H30FNO9 [M]− 686.1821, found: 686.1931.Synthesis of PF-H2O2
0.3435 g (0.5 mM) of PF was dissolved in 5 mL of DMF, 0.2969 g (1 mM) of 4-bromomethylphenylboronic acid pinacol ester, and 0.65 g (2 mM) of cesium carbonate at 80 °C for 18 h, and purified by TLC to obtain PF-H2O2 (0.18 g, 0.18 g), yield 32%. PF-H2O2: 1H NMR (400 MHz, DMSO-d6) δ 8.08 (s, 1H), 7.96 (s, 3H), 7.80 (d, J = 7.8 Hz, 2H), 7.74 (d, J = 8.0 Hz, 4H), 7.63 (d, J = 8.0 Hz, 4H), 7.33 (d, J = 8.0 Hz, 6H), 7.27 (d, J = 8.0 Hz, 3H), 5.76 (s, 2H), 5.21 (dt, J = 32.9, 5.7 Hz, 4H), 4.59–4.46 (m, 6H), 3.17 (d, J = 5.2 Hz, 2H), 2.89 (s, 1H), 2.74 (s, 1H), 1.29 (s, 24H).13C NMR (101 MHz, DMSO-d6) δ 162.79, 157.22, 148.27, 146.56, 146.56, 141.65, 134.73, 127.41, 126.13, 101.44, 83.97, 74.02, 63.17, 56.46, 47.93, 40.67, 40.62, 40.46, 40.41, 40.20, 39.99, 39.78, 39.57, 39.36, 36.26, 33.81, 31.24, 29.49, 29.16, 26.16, 25.82, 25.44, 25.16, 24.91, 19.03. HRMS (ESI), m/z calculated for C65H62B2FNO13 [M]+ 1120.4641, found: 1120.4799.Results and discussion
To test the ability of PF-H2O2 to detect H2O2, we investigated the photophysical properties of the probe. First, we tested the UV absorption spectra and fluorescence emission spectra of PF-H2O2 under simulated physiological conditions (10 mM, pH 7.4, phosphate buffered saline). As shown in Fig. 2a, there is a weak absorption peak near 490 nm, and when 50 μM H2O2 is added, the absorption peak at 490 nm increases significantly (about 8.4-fold). In Fig. 2b, in the absence of H2O2, only weak fluorescence emission near 525 nm can be observed at 490 nm excitation. However, the addition of 50 μM H2O2 resulted in an enhancement of fluorescence at 525 nm (about 8-fold). The fluorescence intensity at 525 nm increases linearly with the increase in H2O2 concentration (0–50 μM), and the linear equation is represented as F = 33.60[H2O2] (μM) + 42.39 (R2 = 0.998). The detection limit of PF-H2O2 for H2O2 was found to be 1.1 μM (Fig. 2c and d). The above results show that PF-H2O2 can sensitively detect H2O2. Subsequently, we tested the photostability of PF-H2O2 and fluorescence intensity vs. the reaction time of PF-H2O2. As shown in Fig. 2e and f, the fluorescence intensity of PF-H2O2 reached a plateau after reacting with H2O2 for 50 minutes and demonstrated excellent light stability.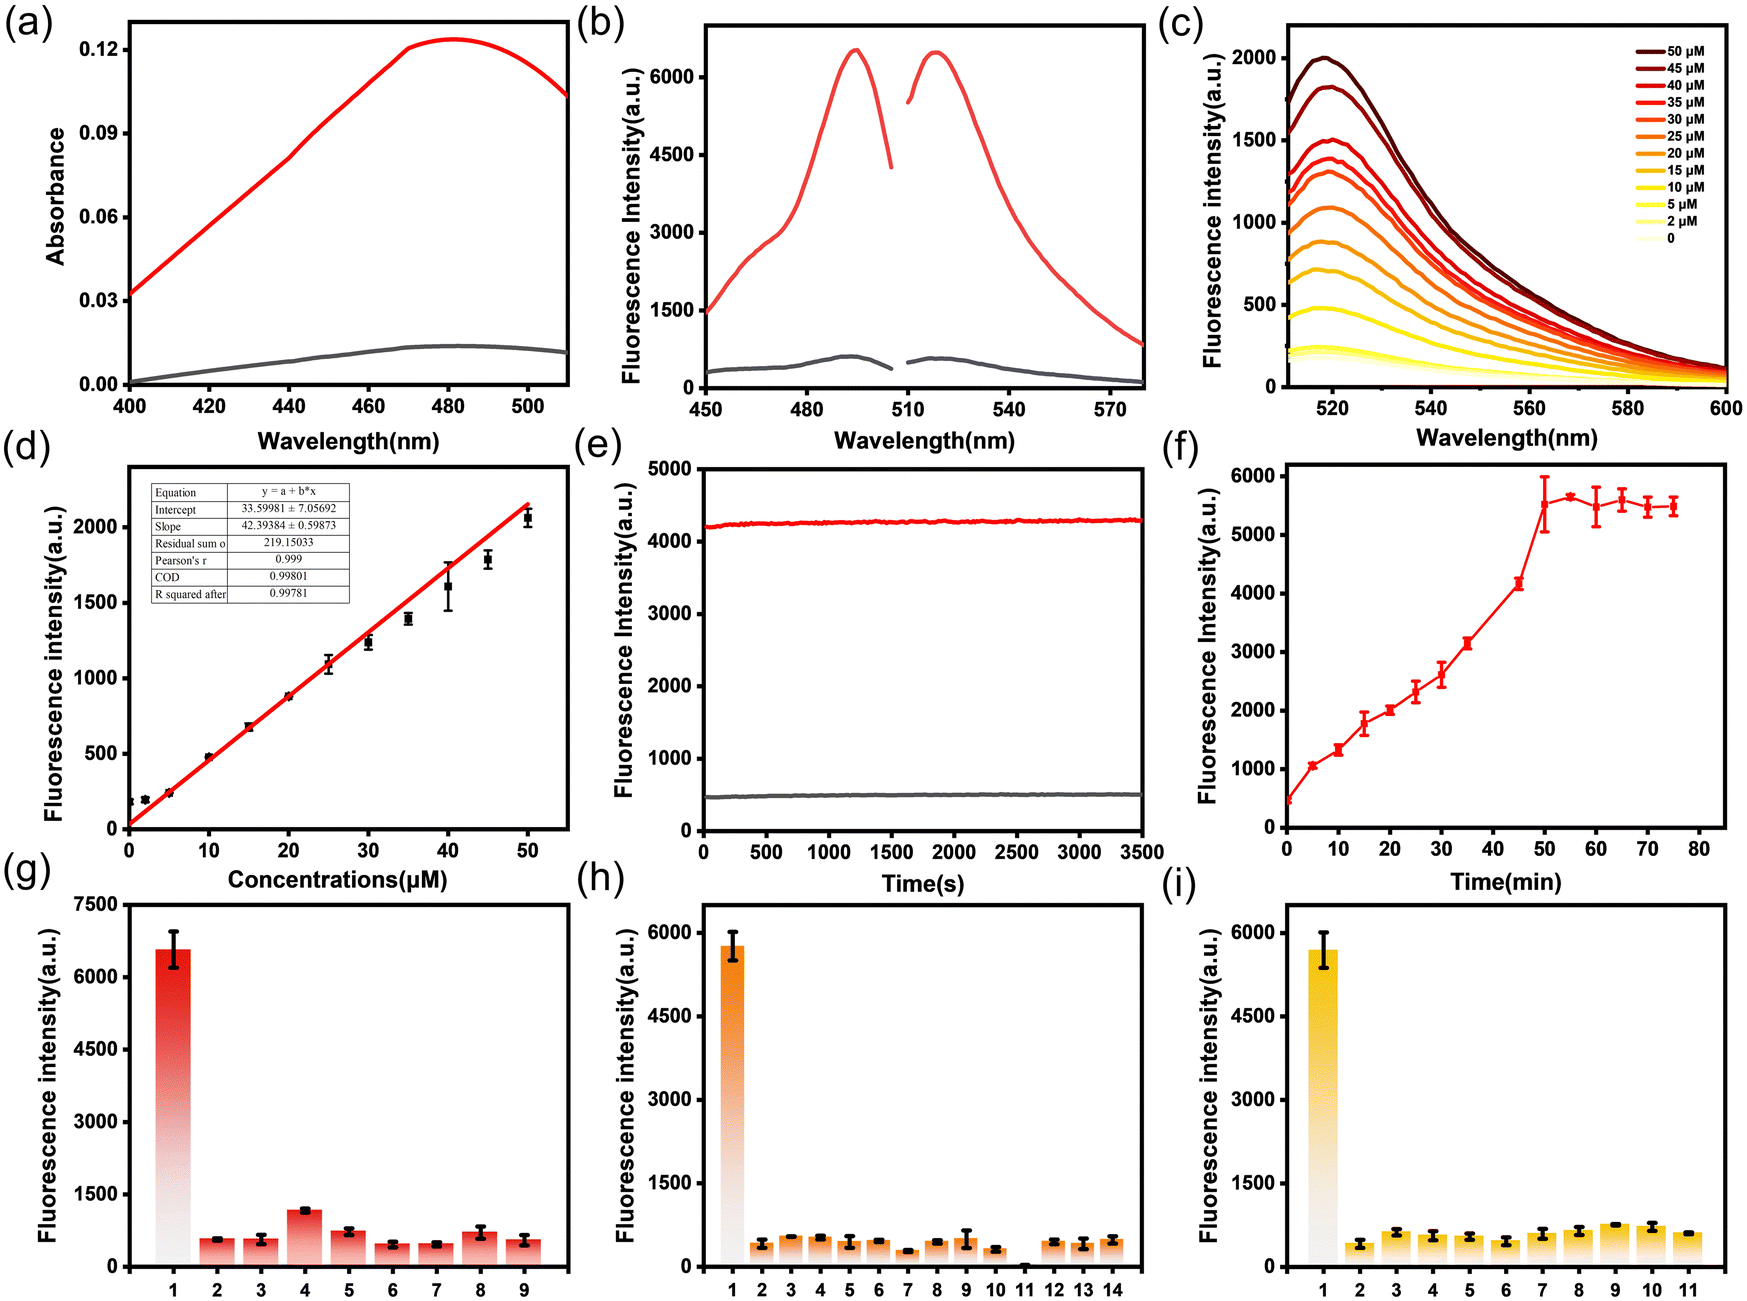 | ||
| Fig. 2 Optical properties of PF-H2O2. (a) Absorption spectra of PF-H2O2 before (black) and after (red) reaction with 50 μM H2O2. (b) Fluorescence excitation and emission spectra before (black) and after (red) reaction of PF-H2O2 with 50 μM H2O2. (c) Fluorescence spectra of PF-H2O2 after reaction with H2O2 (0–50 μM). (d) Linear relation of fluorescence intensity and H2O2 concentration. (e) Photostability experiment of PF-H2O2 (f) Plots of fluorescence intensity vs. the reaction time of the probe PF-H2O2 (25 μM) with 50 μM H2O2 (λex/em = 490 nm/525 nm) in modified PBS buffer solution. (g) Fluorescence response of PF-H2O2 (25 μM) with ROS [1: 50 μM H2O2 2: blank-only PF-H2O2 3: 2 mM NO 4: 100 μM TBHP 5: 100 μM NaClO 6: 2 mM ˙OH 7: 1 mM GSH 8: 10 μM 1O2 9: 2 μM O2˙−]. (h) Fluorescent response of PF-H2O2 (25 μM) to amino acids and neurotransmitters. [1: 50 μM H2O2 2: blank-only PF-H2O2 3: 100 μM Thr 4: 100 μM Phe 5: 100 μM Gln 6: 100 μM lle 7: 100 μM Pro 8: 100 μM Met 9: 100 μM Ala 10: 100 μM Glu 11: 100 μM Val 12: 100 μM DA 13: 100 μM 5-HT 14: 100 μM NE]. (i) Fluorescence response of PF-H2O2 (25 μM) with metal ions. [1: 50 μM H2O2 2: blank-only PF-H2O2 3: 1 mM K+ 4: 1 mM Mg2+ 5: 1 mM Na+ 6: 1 mM Zn2+ 7: 1 mM Fe2+ 8: 1 mM Fe3+ 9: 1 mM Cu+ 10: 1 mM Cu2+ 11: 1 mM Ca2+]. All spectra were acquired in 40 mM PBS (pH 7.4) at λex = 490 nm using an FLS-980 Edinburgh fluorescence spectrometer. Similar results were observed in five independent experiments. The data are expressed as the mean ± SD. | ||
To evaluate the specific and selective recognition of H2O2 by PF-H2O2, we investigated the fluorescence reaction of PF-H2O2 with other competing molecules, such as reactive oxygen species, metal ions, and amino acids. As shown in Fig. 2g–l, PF-H2O2 exhibits weak fluorescence in the presence of various reactive oxygen species, metal ions, amino acids, and neurotransmitters. Only after the addition of H2O2 was the fluorescence intensity significantly enhanced (about 8-fold), demonstrating its specific recognition of H2O2. These experiments indicate that PF-H2O2 can detect H2O2 with high sensitivity and selectivity in vitro and has potential applications in cells and diseased tissues.
In order to evaluate whether PF-H2O2 can be applied in cell experiments, we used cell-counting-kit-8 (CCK8) assay to evaluate its cytotoxicity (Fig. S2, ESI†) and obtained an IC50 value of 2.913 × 10⁷ μM. These results indicate that PF-H2O2 has low biotoxicity and good biocompatibility, making it suitable for subsequent cell experiments. To know when the reaction between PF-H2O2 and intracellular H2O2 was complete, we tested the change in the fluorescence intensity of PF-H2O2 in cells over time. As illustrated in Fig. S3 (ESI†), the fluorescence intensity of PF-H2O2 reached a plateau within one hour. Therefore, for the subsequent cell experiment, the probe's incubation time was set to one hour.
In the brain, the serotonin transporter (SERT) is a transmembrane protein specific to serotonergic neurons.9 Therefore, we utilized SERT-expressing HEK293 cells to mimic serotonergic neurons. Initially, HEK293 cells were transfected with the hsert-pcDNA3 plasmid to induce SERT expression, resulting in hsert-HEK293 cells. Western blot analysis was conducted to extract proteins from both HEK293 cells and hsert-HEK293 cells. As depicted in Fig. S4 (ESI†), in comparison with untreated HEK293 cells, hsert-HEK293 cells exhibited significantly higher SERT expression. Research has demonstrated that elevated glutamate levels can lead to neuronal dysfunction, consequently triggering oxidative stress and causing an overproduction of ROS.24 Hence, in our experiments, we employed high concentrations of glutamate (10 mM) to stimulate cells and simulate oxidative stress environments.
We initially investigated whether PF-H2O2 could detect changes in H2O2 levels in hsert-HEK293 cells. We stimulated the hsert-HEK293 cells with 10 mM glutamate and then incubated them with 25 μM PF-H2O2. As illustrated in Fig. 3a, the fluorescence intensity of hsert-HEK293 cells stimulated by glutamate (glutamate) was higher than (about 1.54-fold) that of hsert-HEK293 cells not stimulated by glutamate (control), indicating that PF-H2O2 could sensitively detect changes in H2O2 levels in hsert-HEK293 cells. To demonstrate that the fluorescence change was a result of the fluctuation in H2O2 levels within the cell, we employed N-acetylcysteine (NAC, a direct scavenger of H2O2) to clear H2O2.25–27 In comparison with glutamate-stimulated hsert-HEK293 cells, the fluorescence intensity of hsert-HEK293 cells with the addition of NAC to clear H2O2 decreased (Fig. 3a, about 0.65-fold), further confirming that PF-H2O2 could effectively detect changes in H2O2 levels in hsert-HEK293 cells. Next, we investigated whether PF-H2O2 could specifically enter cells via SERT to image H2O2. Similar to the above treatment, we treated HEK293 and hsert-HEK293 cells with glutamate and PF-H2O2, respectively. The results showed (Fig. 3a) that compared with HEK293 cells that did not express SERT, the fluorescence intensity of hsert-HEK293 cells that could express SERT was increased (about 2.71-fold), indicating that PF-H2O2 could target SERT-expressing cells and effectively image H2O2 in cells.
 | ||
| Fig. 3 The targeting ability of PF-H2O2 to SERT. (a) Fluorescence imaging of HEK293 and hsert-HEK293 cells by PF-H2O2. Control group: 25 μM PF-H2O2 incubated for 1 h, glutamate group: 10 mM glutamate incubated for 12 h, 25 μM PF-H2O2 treated cells for 1 h, glutamate + NAC group: 10 mM glutamate incubated for 12 h, 1 mM NAC incubated for 1 h, 25 μM PF-H2O2 incubated for 1 h, and 480 nm stimulated images were obtained, scale = 50 μm. (b) Confocal fluorescence images of H2O2. Cells were incubated with 25 μM PF-H2O2 for 1 h (control). The cells were incubated with 10 mM glutamate for 12 h and 25 μM PF-H2O2 for 1 h (glutamate). Incubation with 10 mM glutamate for 12 h, incubation with 78 μg mL−1 fluoxetine for 2 h, and incubation with 25 μM PF-H2O2 for 1 h (fluoxetine). The cells were incubated with 10 mM glutamate for 12 h, then with 60 μg mL−1 paroxetine for 2 h, and with 25 μM PF-H2O2 for 1 h (paroxetine), scale = 100 μm. (c) Fluorescence imaging of hsert-HEK293 cells, scale = 50 μm. PF: the green channel is the fluorescent signal emitted by the dye PF. Images acquired by excitation at 480 nm. Fluorescence emission windows: λem = 510–540 nm. SERT: The red channel is the fluorescent signal emitted by the serotonin transporter antibodies. Images acquired by excitation at 560 nm. Fluorescence emission windows: λem = 570–590 nm. (d) Relative fluorescence intensity output of a. (e) Relative fluorescence intensity output of b. Similar results were observed in five independent experiments. **P < 0.01 and ***P < 0.001 is compared with the control group. | ||
Next, we further verified the specificity of PF-H2O2 for SERT-expressing cells. Paroxetine and fluoxetine, which are SERT inhibitors, can inhibit the transport capacity of SERT.28 Therefore, we incubated hsert-HEK293 cells with 60 ng ml−1 paroxetine and 80 ng ml−1 fluoxetine, respectively. The fluorescence intensity of hsert-HEK293 cells incubated with paroxetine and fluoxetine was reduced (about 0.48-fold) compared with the control group (Fig. 3b), indicating that the entry of PF-H2O2 into the cells after SERT inhibition was significantly reduced. These results indicate that PF-H2O2 can enter hsert-HEK293 cells through SERT, allowing for the in situ observation of changes in H2O2.
To further verify the targeting ability of PF-H2O2, we also conducted fluorescence co-localization experiments of probe PF-H2O2 and SERT protein. We immobilized hsert-HEK293 cells and incubated them with serotonin transporter antibodies for 24 hours. Subsequently, the fluorescent secondary antibody was incubated at room temperature for two hours, followed by a 2-hour incubation with PF-H2O2. Confocal microscopy imaging revealed significant co-localization between green fluorescence (PF-H2O2) and red fluorescence (SERT), with a Pearson coefficient of 0.81. This indicates that PF-H2O2 can target SERT-expressing cells (Fig. 3c) and has the potential to target serotonergic neurons.
After validating the effectiveness of PF-H2O2 in the hsert-HEK293 cell model, we then applied it to mouse primary neurons in vitro. Firstly, we evaluated the targeting effect of PF-H2O2 on serotonergic neurons by conducting fluorescence co-localization experiments of PF-H2O2 and SERT proteins in neurons. The results (Fig. 4a) showed good co-localization between green fluorescence (PF-H2O2) and red fluorescence (SERT), with a Pearson coefficient of 0.89, confirming that PF-H2O2 could effectively target serotonergic neurons. We then examined whether PF-H2O2 could image H2O2 in serotonergic neurons. Neurons were incubated with 10 mM glutamate to induce oxidative stress and imaged using 25 μM PF-H2O2. The findings presented in Fig. 4b and c demonstrate that the fluorescence intensity of glutamate-stimulated neurons (glutamate) was significantly higher than that of the control group (control). Furthermore, the introduction of NAC to eliminate H2O2 resulted in a reduced fluorescence intensity in the neurons compared to those stimulated by glutamate. These results indicate that PF-H2O2 can effectively detect changes in H2O2 levels in neurons. In summary, our findings suggest that PF-H2O2 can target primary serotonergic neurons in mice and effectively detect changes in H2O2 levels within them.
 | ||
| Fig. 4 Fluorescent imaging of primary mouse neurons. (a) Fluorescence imaging of serotonergic neurons, scale = 50 μm. PF-H2O2: the green channel is the fluorescent signal emitted by the probe PF-H2O2. Images acquired by excitation at 480 nm. Fluorescence emission windows: λem = 510–540 nm. SERT: the red channel is the fluorescent signal emitted by the serotonin transporter antibodies. Images acquired by excitation at 560 nm. Fluorescence emission windows: λem = 570–590 nm. (b) Fluorescence imaging of serotonergic neurons by PF-H2O2. Control group: 25 μM PF-H2O2 incubated for 1 h, glutamate group: 10 mM glutamate incubated for 12 h, 25 μM PF-H2O2 treated neurons for 1 h, glutamate + NAC group: 10 mM glutamate incubated for 12 h, 1 mM NAC incubated for 1 h, 25 μM PF-H2O2 incubated for 1 h, and 480 nm stimulated images were obtained, scale = 250 μm. (c) Relative fluorescence intensity output of b. Similar results were observed in five independent experiments. **P < 0.01 and ***P < 0.001 is compared with control group. | ||
To evaluate the ability of PF-H2O2 to target serotonergic neurons within biological tissues, we performed immunofluorescence imaging colocalization experiments on brain tissue sections. After perfusing the mouse heart, brain tissue was extracted, dehydrated, and sliced into 50 μm sections. These sections were then incubated with serotonin transporter antibodies for 24 hours and subsequently exposed to fluorescent secondary antibodies at room temperature for two hours. Subsequently, they were incubated with PF (the dye that we synthesized to target SERT) for two hours. The results obtained are shown in Fig. 5b. There is clear fluorescence co-localization between the green fluorescence (PF) and the red fluorescence (SERT), with a Pearson coefficient of 0.78, indicating that PF-H2O2 can effectively target serotonergic neurons in tissue sections.
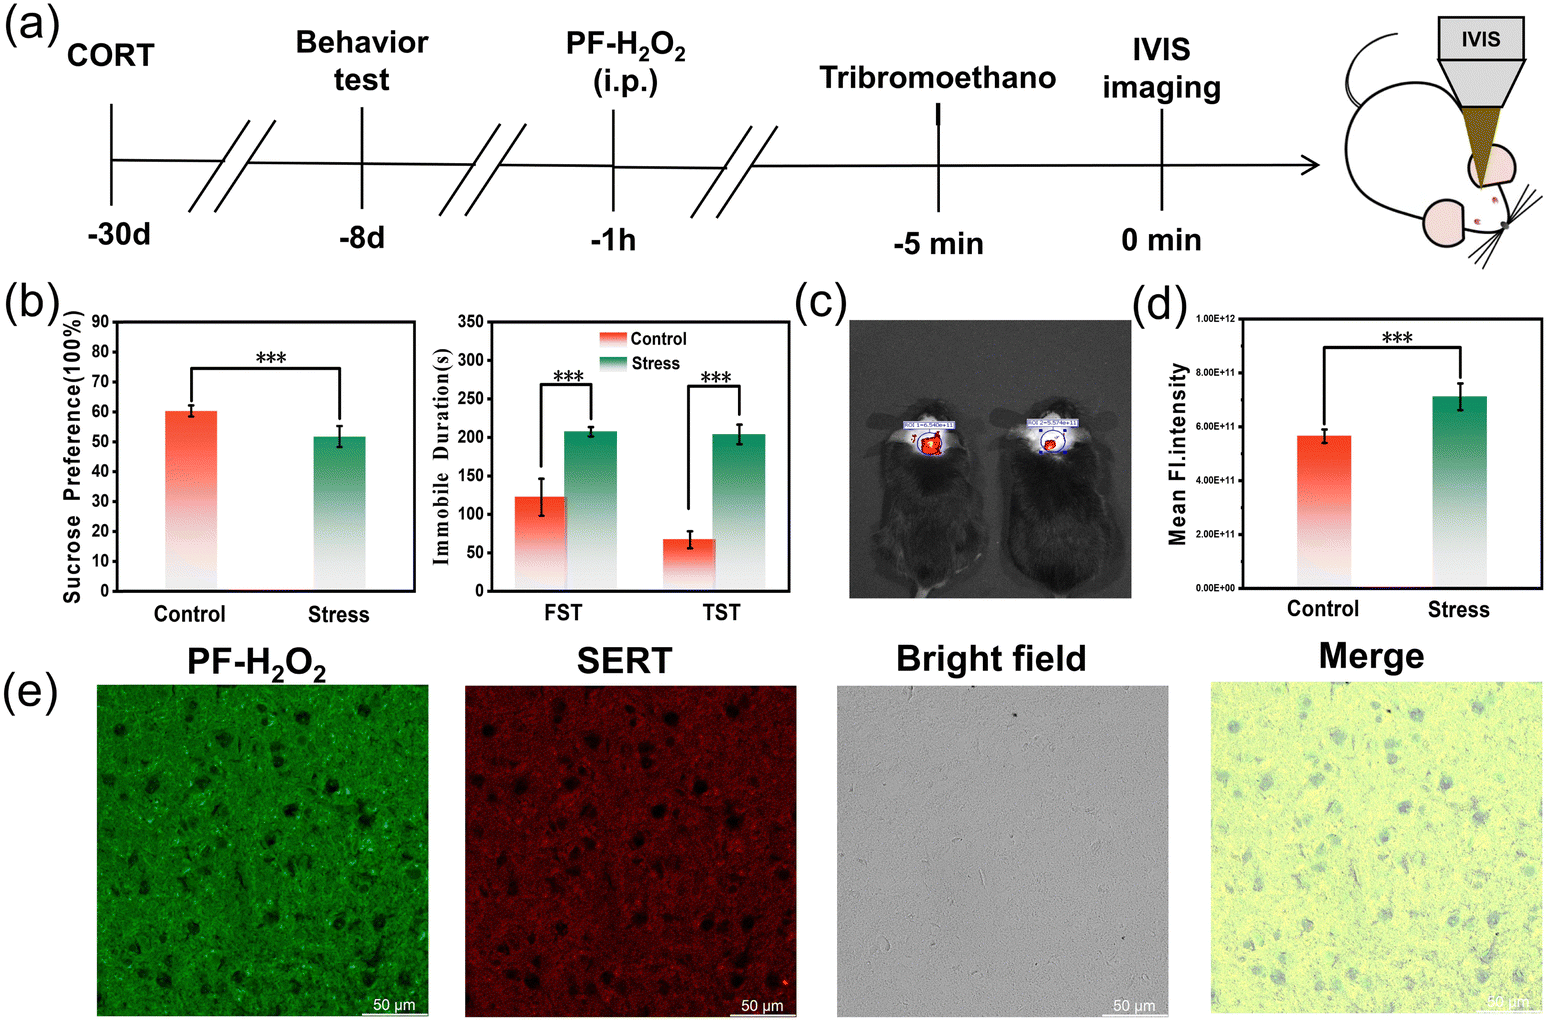 | ||
| Fig. 5 Mouse brain imaging in vivo and immunofluorescence experiment of mouse brain tissue section. (a) Mouse processing flowchart. (b) Depression-like behavior test in mice. Sucrose preference test in mice with and without CORT (left). Immobility time for forced swim test and tail suspension test in behavioral tests (right). (c) Fluorescence imaging of the brains of mice in stress group (left) and control group (right). Control group: mice without drug administration. Stress group: mice that received continuous CORT administration for 21 days. (d) Relative fluorescence intensity output of c. (e) Confocal fluorescence images of mouse brain tissue section. PF-H2O2: the green channel is the fluorescent signal emitted by the dye PF. Images acquired by excitation at 480 nm. Fluorescence emission windows: λem = 510–540 nm. SERT: the red channel is the fluorescent signal emitted by the serotonin transporter antibodies. Images acquired by excitation at 560 nm. Fluorescence emission windows: λem = 570–590 nm. Scale bar = 50 μm. Similar results were observed in five independent experiments. *P <0.05 and ***P <0.001 is compared with the control group. | ||
These results encouraged us to apply PF-H2O2 at the mouse level. We first performed in vivo toxicity assessment in mice. By injecting 0.7 mg kg−1 of PF-H2O2 intraperitoneally for 7 consecutive days, the body weight of mice in both groups did not change significantly (Fig. S5, ESI†), and the hair color of mice in both groups did not change significantly upon observation with the naked eye, indicating that PF-H2O2 could be applied in mouse experiments. We established a depression model by dosing corticosterone (CORT, 100 μg mL−1) for 21 consecutive days and validated the model through depression-like behavioral tests (forced swimming test, tail suspension test, sugar water preference test) (Fig. 5c).29 We imaged the changes in H2O2 levels in serotonergic neurons of depressed mice and normal mice. 0.5 mg kg−1 of PF-H2O2 was injected intraperitoneally, and in vivo imaging was performed 1 hour later. As shown in Fig. 5d and e, the level of H2O2 in the brains of depressed mice was higher than that in normal mice. Next, we removed the brain tissue and cut it into 50 μm slices using frozen section technology. Confocal imaging showed that the fluorescence intensity of depressed mice was also higher than that of normal mice (Fig. S6, ESI†). These results suggest that PF-H2O2 can effectively detect H2O2 levels in serotonergic neurons in mice. Additionally, these experiments also revealed that H2O2 levels in serotonergic neurons of depressed mice were higher than those in normal mice, indicating that oxidative stress in serotonergic neurons is an important factor affecting the development of depression.
Conclusions
In summary, we developed a novel small molecule fluorescent probe (PF-H2O2) designed to specifically target serotonergic neurons and visualize dynamic changes in H2O2 levels. PF-H2O2 incorporates paroxetine as the targeting moiety, luciferin as the fluorophore, and phenylborate for H2O2 recognition. At the cellular level, we found that H2O2 levels increased in SERT-expressing hsert-HEK293 cells under oxidative stress. Similarly, primary serotonergic neurons cultured in vitro showed elevated H2O2 levels in response to high glutamate stimulation. Additionally, in vivo imaging revealed increased H2O2 levels in serotonergic neurons of depressed mice. This study offers an effective approach to exploring redox signaling pathways in serotonergic neurons and suggests that our imaging tool could be a valuable resource for investigating serotonergic neuron-related diseases.Author contributions
Feida Che: conceptualization, methodology, investigation, and writing – original draft. Xiaoming Zhao: visualization and investigation. Qi Ding: investigation. Xiwei Li: investigation. Wen Zhang: supervision and reviewing. Xin Wang: supervision, reviewing and editing. Ping Li: supervision, reviewing and editing. Bo Tang: supervision and reviewing.Data availability
The data supporting this article have been included as part of the ESI.†Conflicts of interest
There are no conflicts to declare.Acknowledgements
This work was supported by the National Natural Science Foundation of China (22134004, 22074083, 22304107, and 22377070) and the Natural Science Foundation of Shandong Province of China (ZR2023ZD31, ZR2023YQ016, and ZR2021QB042).Notes and references
- S. Marwaha, E. Palmer, T. Suppes, E. Cons, A. H. Young and R. Upthegrove, Lancet, 2023, 401, 141–153 CrossRef CAS PubMed.
- C. Otte, S. M. Gold, B. W. Penninx, C. M. Pariante, A. Etkin, M. Fava, D. C. Mohr and A. F. Schatzberg, Nat. Rev. Dis. Primers, 2016, 2, 16065 CrossRef.
- S. Law and P. Liu, Curr. Psychiatry Rep., 2008, 10, 80–86 CrossRef.
- N. G. Rummel and D. A. Butterfield, Antioxid. Redox Signaling, 2021, 36, 1289–1305 CrossRef PubMed.
- H. Peng, T. Wang, G. Li, J. Huang and Q. Yuan, Anal. Chem., 2022, 94, 1070–1075 CrossRef CAS.
- H. Sies, C. Berndt and D. P. Jones, Annu. Rev. Biochem., 2017, 86, 715–748 CrossRef CAS.
- H. Xiao, P. Li, X. Hu, X. Shi, W. Zhang and B. Tang, Chem. Sci., 2016, 7, 6153–6159 RSC.
- L. C. Daws and G. G. Gould, Pharmacol. Ther., 2011, 131, 61–79 CrossRef CAS PubMed.
- A. Sørensen, H. G. Ruhé and K. Munkholm, Mol. Psychiatry, 2022, 27, 192–201 CrossRef.
- S. G. Rhee, Science, 2006, 312, 1882–1883 CrossRef PubMed.
- N. Kasai, C. Han and K. Torimitsu, Sens. Actuators, B, 2005, 108, 746–750 CrossRef CAS.
- N. V. Kulagina and A. C. Michael, Anal. Chem., 2003, 75, 4875–4881 CrossRef CAS PubMed.
- E. W. Miller, O. Tulyathan, E. Y. Isacoff and C. J. Chang, Nat. Chem. Biol., 2007, 3, 263–267 CrossRef CAS.
- J. Zhang, C. Wickizer, W. Ding, R. Van, L. Yang, B. Zhu, J. Yang, Y. Wang, Y. Wang, Y. Xu, C. Zhang, S. Shen, C. Wang, Y. Shao and C. Ran, Proc. Natl. Acad. Sci. U. S. A., 2023, 120, 4099–4100 Search PubMed.
- L. Zhu, Y. Pan, Z. Hua, Y. Liu and X. Zhang, J. Am. Chem. Soc., 2024, 146, 14307–14317 CrossRef CAS PubMed.
- S. Zeng, Y. Wang, C. Chen, H. Kim, X. Liu, M. Jiang, Y. Yu, Y. S. Kafuti, Q. Chen, J. Wang, X. Peng, H. Li and J. Yoon, Angew. Chem., Int. Ed., 2024, 63, e202316487 CrossRef CAS PubMed.
- W. Zhang, T. Liu, F. Huo, P. Ning, X. Meng and C. Yin, Anal. Chem., 2017, 89, 8079–8083 CrossRef CAS PubMed.
- X. X. Zhang, F. Yang, X. Zhao, Q. Wu, L. He, Z. Li, Z. Zhou, T. B. Ren, X. B. Zhang and L. Yuan, Angew. Chem., Int. Ed., 2024, e202410666 Search PubMed.
- E. W. Miller, A. E. Albers, A. Pralle, E. Y. Isacoff and C. J. Chang, J. Am. Chem. Soc., 2005, 127, 16652–16659 CrossRef CAS.
- H. Iwashita, E. Castillo, M. S. Messina, R. A. Swanson and C. J. Chang, Proc. Natl. Acad. Sci. U. S. A., 2021, 118, e2018513118 CrossRef CAS PubMed.
- J. H. Meyer, A. A. Wilson, S. Sagrati, D. Hussey, A. Carella, W. Z. Potter, N. Ginovart, E. P. Spencer, A. Cheok and S. Houle, Am. J. Psychiat., 2004, 161, 826–835 CrossRef.
- D. Yang and E. Gouaux, Sci. Adv., 2021, 7, eabl3857 CrossRef CAS.
- S. Tavoulari, L. R. Forrest and G. Rudnick, J. Neurosci., 2009, 29, 9635–9643 CrossRef CAS PubMed.
- J. T. Coyle and P. Puttfarcken, Science, 1993, 262, 689–695 CrossRef CAS PubMed.
- B. Kalyanaraman, Redox Biol., 2022, 57, 102497 CrossRef CAS.
- Y. Chen, X. Shi, Z. Lu, X. Wang and Z. Wang, Anal. Chem., 2017, 89, 5278–5284 CrossRef CAS.
- M. Berk, G. S. Malhi, L. J. Gray and O. M. Dean, Trends Pharmacol. Sci., 2013, 34, 167–177 CrossRef CAS PubMed.
- R. E. Presby, R. A. Rotolo, E. M. Hurley, S. M. Ferrigno, C. E. Murphy, H. P. McMullen, P. A. Desai, E. M. Zorda, F. B. Kuperwasser, C. C. Ros, M. Correa and J. D. Salamone, Pharmacol., Biochem. Behav., 2021, 202, 173115 CrossRef CAS.
- H. Ding, X. Y. Cui, S. Y. Cui, H. Ye, X. Hu, H. L. Zhao, Y. T. Liu and Y. H. Zhang, Neurosci. Lett., 2018, 687, 202–206 CrossRef CAS.
Footnotes |
| † Electronic supplementary information (ESI) available. See DOI: https://doi.org/10.1039/d4tb01828a |
| ‡ Those authors contributed equally. |
| This journal is © The Royal Society of Chemistry 2024 |