DOI:
10.1039/D4TB01745E
(Paper)
J. Mater. Chem. B, 2024,
12, 10616-10623
Recognition of specific monosaccharides by fluorescence change through the suppression effect on excited-state intermolecular proton transfer reactions†
Received
6th August 2024
, Accepted 16th September 2024
First published on 18th September 2024
Abstract
Pyrene–urea derivatives and acetate anions were used to investigate the excited-state intermolecular proton transfer (ESPT) reaction, where a molecule undergoes intermolecular proton transfer to form a tautomer species in the excited state. Since ESPT occurs when intermolecular hydrogen bonds exist between urea compounds and acetate species, we hypothesize that this reaction might be influenced by compounds with hydroxy groups. In this study, cyclodextrins, saccharides, and ethanol were examined to assess the effects of hydroxy groups on the ESPT reaction. After introducing various hydroxy compounds into the urea–acetate system in dimethylformamide, we observed differences in the fluorescence spectra and fluorescence decay curves. These differences indicate varying interactions between the hydroxy compounds and complexes, leading to distinct fluorescence lifetime behaviors, which makes fluorescence lifetime imaging technology particularly suitable.
Introduction
Saccharides are essential components of plants and humans. For instance, glucose serves as an energy source for cellular activation and as an intermediate in biological metabolism, making it a vital nutrient in vivo.1–8 Sensors that exploit interactions with hydroxy groups, such as those involving boronic acid, have been developed to detect carbohydrates based on the characteristic spatial structures of these groups.9–12 However, designing fluorescent sensors to differentiate specific saccharide compounds remains challenging because these compounds have similar acidities and chemical structures.13
Recently, fluorescence lifetime imaging (FLIM) has received considerable attention in bioimaging because of its ability to accurately detect specific molecules, regardless of their concentration.14–22 This is because the fluorescence lifetime is an absolute measurement that can be consistently repeated in various experimental environments, considering the instrument response function (IRF) of the devices. The fluorescence lifetime can be measured using time-domain and frequency-domain methods. In this study, time-domain lifetime measurements were chosen based on their direct association with the commonly used FLIM technique known as time-correlated single-photon counting (TCSPC).23,24 In TCSPC, the time interval between excitation and emission photons is measured by a time–amplitude converter circuit, which transforms the data into a voltage for recording. Consequently, multiple excitation pulses are employed to construct a histogram in time-domain methods while detecting individual fluorescence photons across several excitation pulses.25
In the various photochemical reactions used in FLIM technology, the excited-state intermolecular proton transfer (ESPT) reaction is particularly notable because it causes remarkable changes in the fluorescence lifetime due to the formation of a new fluorescence species in the excited state.26–29 Specifically, after photoexcitation, a complex formed by a proton donor and a proton acceptor through intermolecular hydrogen bonding in the ground state produces a tautomer with different fluorescence lifetimes due to intermolecular proton transfer in the excited state. Previous studies have investigated the effects of the structure of urea compounds and solvents on proton transfer reaction rate constants. For instance, it was found that an electron-donating group on the opposite side of the fluorescent dye enhances the charge transfer within the proton transfer reaction, thereby boosting the ESPT reaction.30 Additionally, the electron-donating property of dimethyl sulfoxide (DMSO) may explain the considerably hindered reverse ESPT in DMSO.31 However, negligible changes in the fluorescence lifetimes were noted in these studies, which hinders the application of these findings to the design of specific fluorescent probes. In contrast, introducing a compound that inhibits the formation of the complex or tautomer into the ESPT system is expected to suppress the significant changes in fluorescence lifetime due to the ESPT reaction. Therefore, monitoring the fluorescence lifetime of the tautomer formed in the excited state through the ESPT reaction presents a practical application of FLIM technology.
In a previous study, we investigated the effects of solvents on ESPT reactions by adding β-cyclodextrin (β-CD) to the ESPT system and observed varying suppression effects in the presence of DMSO and dimethylformamide (DMF).31 Specifically, due to the unique structure formed between the urea compound and DMSO, β-CD's suppression effect on the ESPT reaction was less pronounced in DMSO than in DMF. Therefore, because the strong interactions among DMSO, urea compounds, and acetate anions diminish the influence of hydroxy groups, we selected DMF as the solvent for this study.
Despite several studies on the suppression effects of hydroxy compounds on the ESPT reaction, the relationship between the suppression strength and acidity of the hydroxy groups is unclear. It is generally believed that the suppression of the ESPT reaction upon adding hydroxy compounds results from the preferential interaction between the hydroxy group and the acetate anion, which leads to the dissociation of the complex formed by hydrogen bonding between the acetate anion and the urea compound. Consequently, ethanol, which is more acidic than β-CD, is expected to exhibit a more pronounced suppression effect on the ESPT reaction. To explore the factors influencing the suppression effect of hydroxy compounds, we used α-CD and β-CD, four saccharide compounds, and ethanol. To confirm the progress of the ESPT reactions, we measured the absorption and fluorescence spectra of m-CF3-1PUP in the presence and absence of tetrabutylammonium acetate (TBAAc). Additionally, we investigated the effects of hydroxy compounds on the urea–TBAAc system in both the ground and excited states by measuring the absorption and fluorescence spectra with α-CD and β-CD, fructose, glucose, lyxose, arabinose, and ethanol. We also analyzed the fluorescence decay curves and calculated the changes in the fluorescence lifetime after the addition of the hydroxy compounds to illustrate the potential applications of FLIM. Finally, we examined the irrelativity between hydroxyl acidity and the suppression effect of hydroxy compounds on the ESPT reaction, offering possible insights from the perspective of structural changes in the ESPT process.
Experimental
Materials.
Spectroscopic grade DMF (FUJIFILM Wako Pure Chemical Industries, Japan) was used as the solvent without further purification. Acetate anions were provided as TBAAc (Sigma-Aldrich, Japan). Other chemicals such as α-CD, β-CD, fructose, glucose, lyxose, arabinose, and ethanol were purchased from FUJIFILM Wako Pure Chemical Industries, Japan. Synthesis of m-CF3-1PUP (Fig. S1, ESI†) was described in a previous study.31
Instrumentation and general methods.
The absorption and fluorescence spectra were recorded using a Shimadzu UV-2550 spectrophotometer and a Hitachi F-7000 fluorescence spectrometer, respectively. Fluorescence decay measurements were conducted using the TCSPC method. A diode laser (PicoQuant, LDH-P-C-375) with a power control unit (PicoQuant, PDL 800-B) and a repetition rate of 2.5 MHz was used for the 375-nm excitation. The temporal profiles of fluorescence decay were captured using a microchannel plate photomultiplier (Hamamatsu, R3809U) and a TCSPC computer board module (Becker and Hickl, SPC630). Fluorescence lifetime measurements were performed at room temperature under an argon atmosphere.
Results
Interaction of m-CF3-1PUP with TBAAc.
Absorption spectra.
To confirm the formation of the complex in the ground state, the absorption spectrum of m-CF3-1PUP was measured by titration with TBAAc in DMF (Fig. S2, ESI†). In the absorption spectra, a redshift and an isosbestic point were observed after adding TBAAc, indicating the formation of a complex with a new electronic state in the ground state. The complex was speculated to be formed by TBAAc and m-CF3-1PUP through hydrogen bonding between the acetate anion and the urea moiety, as previously reported.31
Fluorescence spectra.
To investigate the interaction between CF3-1PUP and TBAAc in the excited state, the fluorescence spectra of m-CF3-1PUP were recorded without and with TBAAc (Fig. S3, ESI†). In DMF, the fluorescence intensity observed at approximately 400 nm decreased with increasing TBAAc concentration, followed by the appearance of a new band maximized at approximately 500 nm. Additionally, a redshift was observed in the fluorescence spectra at relatively short wavelengths, and the fluorescence maximum shifted to 400 nm with a decrease in the fluorescence intensity after the addition of TBAAc. The degree of the redshift corresponded to that observed in the absorption spectra in DMF, which indicated that the change in fluorescence at short wavelengths may be attributed to the emission of the complex formed with the acetate anion. The significant decrease in the fluorescence intensity at short wavelengths with the addition of TBAAc may be ascribed to the increasing concentration of the complex with a remarkably low fluorescence quantum yield. Another factor is the decreasing concentration of the free form of m-CF3-1PUP with a high fluorescence quantum yield. Additionally, the increase in fluorescence intensity at long wavelengths was due to the formation of a tautomer by the ESPT reaction.31
Fluorescence lifetime.
The fluorescence lifetimes in DMF were determined by measuring the fluorescence decay curves of m-CF3-1PUP with TBAAc (Table S1, ESI†). With TBAAc, a biexponential decay function was used to analyze the fluorescence decay curves of m-CF3-1PUP at 410 and 520 nm. Additionally, the fluorescence decay curves observed at 520 nm consisted of a one-component rise and decay. The rise in the fluorescence decay curve indicated the generation of fluorescent species with an emission wavelength of approximately 500 nm in the excited state. In previous studies, the fluorescent species exhibited at long wavelengths after adding acetate anions were attributed to the tautomer generated through the ESPT reaction rather than the direct excitation of the ground state species.31
Interaction of the ESPT system with saccharide compounds
Before investigating the effects of saccharide compounds on the ESPT system, we measured the fluorescence spectra before and after the addition of CDs, saccharide compounds, and ethanol without TBAAc. The results are shown in Fig. S4 (ESI†). After the addition of all hydroxy compounds, negligible change is observed in the spectra of m-CF3-1PUP, which indicates that these hydroxy compounds hardly interact with urea compounds directly.
Fluorescence spectra.
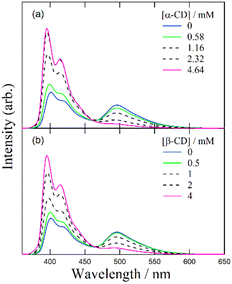
To investigate the difference in the interaction between the hydroxy compounds and m-CF3-1PUP–TBAAc system in DMF, the fluorescence spectra of m-CF3-1PUP after the addition of TBAAc were measured at different concentrations of CDs, saccharide compounds, and ethanol. Since the excited-state proton transfer (ESPT) reaction is speculated to be suppressed by the hydroxy groups from the previous study, to make sure that the hydroxy group concentrations of hydroxy compounds are the same while investigating other factors which may influence the ESPT reaction of these compounds is necessary. Therefore, the spectra were measured after each addition under same concetration of hydroxy group. The results are shown in Fig. 1–3. The complex ratio before the addition of the hydroxy compounds was similar (∼95%), resulting in similar fluorescence intensities at short wavelengths. After the addition of α-CD, β-CD, fructose, glucose, and ethanol, the fluorescence intensities at approximately 400 and 500 nm increased and decreased, respectively, with increasing concentrations of these hydroxy compounds. Therefore, the addition of α-CD, β-CD, fructose, glucose, and ethanol resulted in the complex returning to its free form. Specifically, the hydroxy groups in these compounds were expected to attach to the acetate anion instead of the urea moiety of m-CF3-1PUP. However, such spectral changes were not observed in the hydroxy compounds with the five carbon ring structures of lyxose and arabinose. The fluorescence spectra after the addition of lyxose and arabinose showed minimal changes in the fluorescence intensities at approximately 400 and 500 nm. This indicates that the suppression effect on the ESPT reaction failed to be observed after the addition of pentoses despite their hydroxyl groups same as α-CD, β-CD, fructose, glucose, and ethanol. Specifically, the concentrations of both the complex and tautomer remained constant after the addition of the two saccharide compounds, which might be attributed to the effects of the unique five carbon ring structures of hydroxy compounds which lyxose and arabinose have. Additionally, among these hydroxy compounds, ethanol failed to exhibit the most effective suppression of the ESPT reaction despite its high acidity. Remarkable fluorescence changes after the addition of ethanol were not observed compared with those after the addition of α-CD, β-CD, fructose, and glucose. This indicates that factors other than the acidity of the hydroxy compounds may influence the suppression of the ESPT reaction.
 |
| | Fig. 1 Fluorescence spectra of m-CF3-1PUP with tetrabutylammonium acetate (TBAAc, complex proportion: 95%) upon the addition of various concentrations of (a) α-cyclodextrin (CD) and (b) β-CD in dimethylformamide (DMF). | |
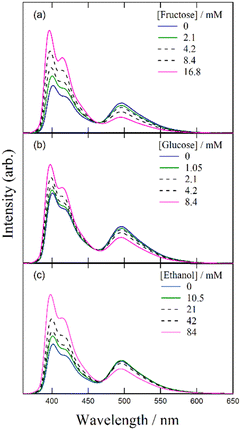 |
| | Fig. 2 Fluorescence spectra of m-CF3-1PUP with tetrabutylammonium acetate (TBAAc, complex proportion: 95%) upon the addition of various concentrations of (a) fructose, (b) glucose, and (c) ethanol in dimethylformamide (DMF). | |
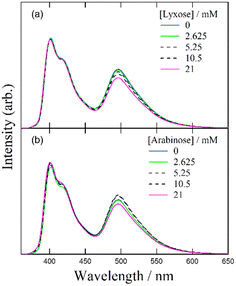 |
| | Fig. 3 Fluorescence spectra of m-CF3-1PUP with tetrabutylammonium acetate (TBAAc, complex proportion: 95%) upon the addition of various concentrations of (a) lyxose and (b) arabinose in dimethylformamide (DMF). | |
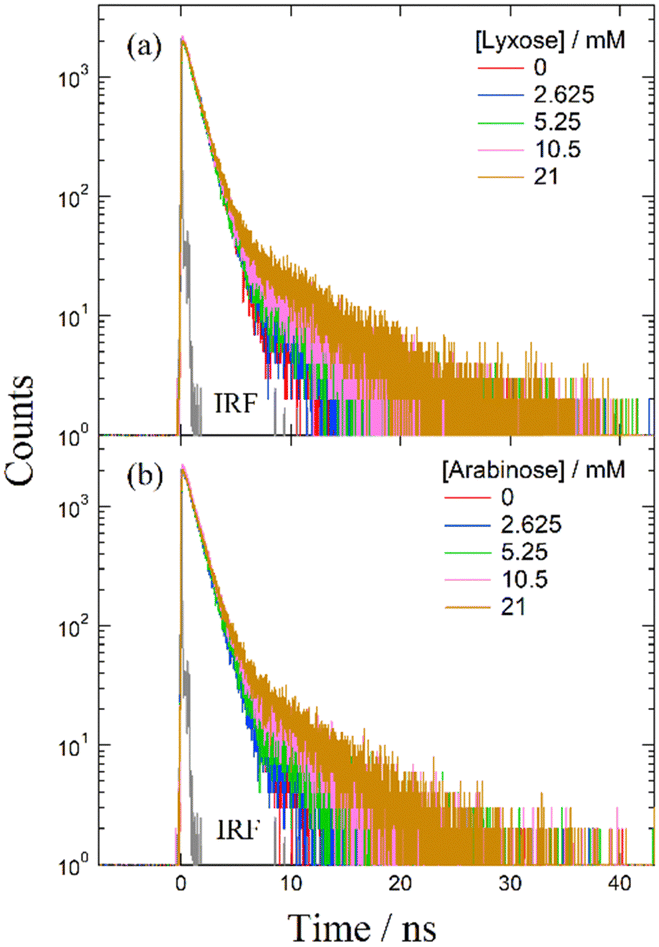
Fluorescence decay curves.
The fluorescence decay curves of m-CF3-1PUP in DMF with various concentrations of α-CD, β-CD, fructose, glucose, ethanol, lyxose, and arabinose were derived by measuring the fluorescence in the presence of a 95% complex ratio with TBAAc. The decay curves are shown in Fig. 4–6. A biexponential decay of m-CF3-1PUP was observed in DMF at 410 nm with the addition of all hydroxy compounds. The fluorescence decay curves with the addition of all hydroxy compounds to DMF showed little change in the lifetime, as presented in Table S2 (ESI†). Additionally, remarkable or negligible changes observed in the fluorescence decay curve with increasing concentrations of hydroxy compounds may be ascribed to significant or slight changes in the corresponding amplitudes, respectively. Further, according to the fluorescence lifetimes illustrated in the following section, significant changes in amplitude were observed during the addition of α-CD, β-CD, fructose, glucose, and ethanol, whereas little change was observed for lyxose and arabinose.
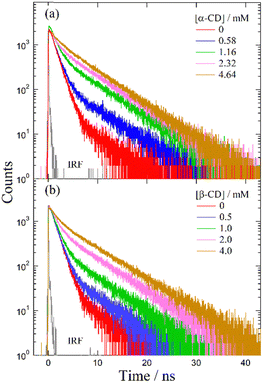 |
| | Fig. 4 Fluorescence decay curves of m-CF3-1PUP with tetrabutylammonium acetate (TBAAc, complex proportion: 95%) after the addition of various concentrations of (a) α-cyclodextrin (CD) and (b) β-CD in dimethylformamide (DMF). | |
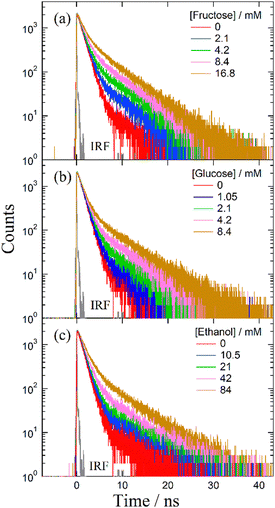 |
| | Fig. 5 Fluorescence decay curves of m-CF3-1PUP with tetrabutylammonium acetate (TBAAc, complex proportion: 95%) after the addition of various concentrations of (a) fructose, (b) glucose, and (c) ethanol in dimethylformamide (DMF). | |
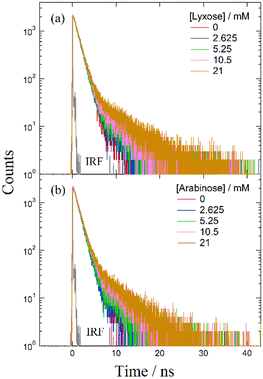 |
| | Fig. 6 Fluorescence decay curves of m-CF3-1PUP with tetrabutylammonium acetate (TBAAc, complex proportion: 95%) after the addition of various concentrations of (a) lyxose and (b) arabinose in dimethylformamide (DMF). | |
Fluorescence lifetimes.
The fluorescence lifetimes in DMF in the presence of different concentrations of α-CD, β-CD, fructose, glucose, ethanol, lyxose, and arabinose were derived by measuring the fluorescence decay curves of m-CF3-1PUP in the presence of TBAAc (Table S2, ESI†). Upon increasing the concentration of the hydroxy compounds, a biexponential decay function was employed to analyze the fluorescence decay curves of m-CF3-1PUP observed at 410 and 520 nm. Additionally, to compare the changes in the fluorescence lifetimes and corresponding amplitudes upon the addition of the hydroxy compounds at 410 nm, we presented the data versus the concentrations of the hydroxy compounds, as shown in Fig. 7–9. After the addition of α-CD, β-CD, fructose, glucose, and ethanol, the amplitude of the short-lived component decreased with a simultaneous increase in that of the long component in DMF, whereas negligible changes were observed in the lifetimes of both components. The decrease in the amplitude of the short-lived component at 410 nm after adding these five hydroxy compounds may be attributed to a decrease in the concentration of the complex formed by m-CF3-1PUP and the acetate anion. This implies that the hydroxy groups may interact with the acetate anions, leading to the complex deformation of the free form of m-CF3-1PUP in the ground state. However, the changes in the amplitudes observed at 410 nm upon the addition of lyxose and arabinose were less pronounced than those observed upon the addition of the same concentration of the other hydroxy compounds. This indicates a unique interaction between the five carbon saccharide compounds and the complexes in DMF.
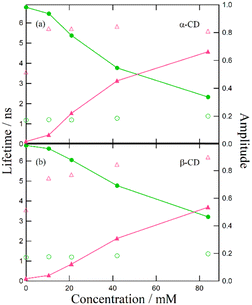 |
| | Fig. 7 Fluorescence lifetimes and amplitudes of m-CF3-1PUP with tetrabutylammonium acetate (TBAAc, complex proportion: 95%) after the addition of various concentrations of (a) α-cyclodextrin (CD) and (b) β-CD in dimethylformamide (DMF). Hollow circles and triangles are the lifetimes of short-lived and long-lived components, respectively. Filled circles and triangles with lines are the amplitudes of short-lived and long-lived components, respectively. | |
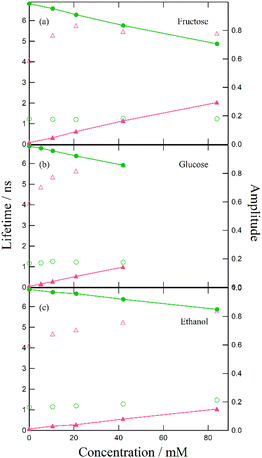 |
| | Fig. 8 Fluorescence lifetimes and amplitudes of m-CF3-1PUP with tetrabutylammonium acetate (TBAAc, complex proportion: 95%) after the addition of various concentrations of (a) fructose, (b) glucose and (c) ethanol in dimethylformamide (DMF). Hollow circles and triangles are the lifetimes of short-lived and long-lived components, respectively. Filled circles and triangles with lines are the amplitudes of short-lived and long-lived components, respectively. | |
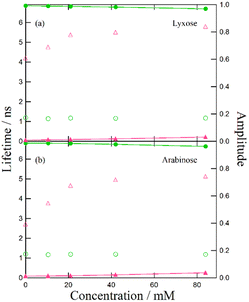 |
| | Fig. 9 Fluorescence lifetimes and amplitudes of m-CF3-1PUP with tetrabutylammonium acetate (TBAAc, complex proportion: 95%) after the addition of various concentrations of (a) lyxose and (b) arabinose in dimethylformamide (DMF). Hollow circles and triangles are the lifetimes of short-lived and long-lived components, respectively. Filled circles and triangles with lines are the amplitudes of short-lived and long-lived components, respectively. | |
Discussion
The interaction between hydroxy compounds and the ESPT system warrants a discussion because the changes in the fluorescence spectra and fluorescence lifetime observed after adding α-CD, β-CD, fructose, glucose, and ethanol showed remarkable differences from those of lyxose and arabinose. Therefore, based on the analysis of the suppression effect of β-CD on the ESPT system illustrated in a previous study, we first discuss the common principle of the suppression effect of hydroxy compounds on the ESPT reaction.
Common suppression effect of hydroxy compounds on the ESPT reaction.
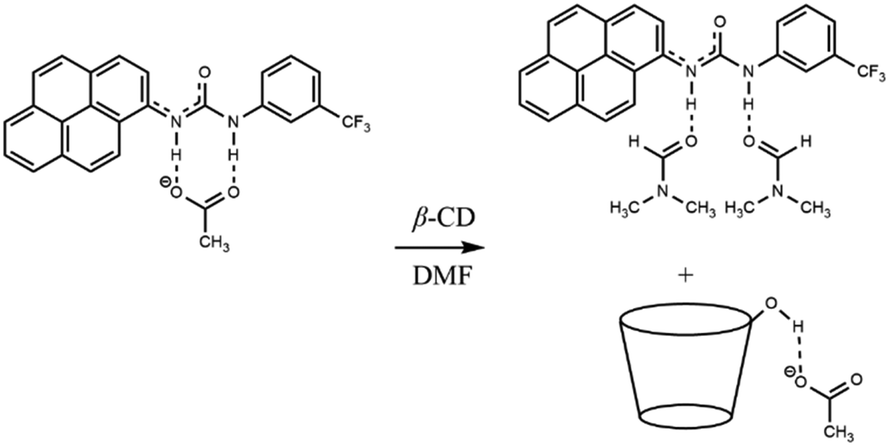
In our previous study on the reaction between the complex and β-CD, it was suggested that the hydrogen atoms of the hydroxy groups on β-CD exhibit higher reactivity than those on the urea moiety, leading to the dissociation of the complex in the ground state. Similar changes in fluorescence spectra and lifetimes were observed upon the addition of α-CD, fructose, glucose, and ethanol, indicating that the hydroxy groups in these compounds behave similarly to those in β-CD. Specifically, acetate anions preferentially form hydrogen bonds with hydroxy groups, resulting in the separation of acetate anions from urea compounds and ultimately leading to the formation of a free form (Scheme 1). Previous research on 2-naphthylamine-6-sulfonate demonstrated that a blue shift in the fluorescence spectrum and an increase in the fluorescence quantum yield indicated the inclusion of the compound in β-CD.32 However, in the present study, increasing the concentration of β-CD in the m-CF3-1PUP solution did not cause a blue shift or increase the fluorescence quantum yield. This suggests that m-CF3-1PUP was not encapsulated in the β-CD cavity. Therefore, the spectral changes observed upon the addition of CDs are unlikely to be related to an encapsulation effect.
 |
| | Scheme 1 The reaction between the ground state complex and β-cyclodextrin (CD) in dimethylformamide. | |
Despite the similar reaction mechanisms, the slight differences in the suppression effects among the hydroxy compounds are noteworthy. The fluorescence spectra and lifetimes revealed that α- and β-CDs produced the most significant suppression effects, whereas ethanol, fructose, and glucose showed moderate suppression. In contrast, lyxose and arabinose exhibited minimal suppression of the ESPT reaction.
Suppression effect of α-CD and β-CD on the ESPT reaction.
We previously reported that the suppression effect of β-CD on the ESPT reaction could be attributed to its preferential hydrogen bonding with acetate anions. In contrast, the current study shows that α- and β-CDs exhibit a more profound suppression effect than ethanol, despite ethanol's higher acidity. This substantial difference suggests that other factors may have contributed to the observed suppression.
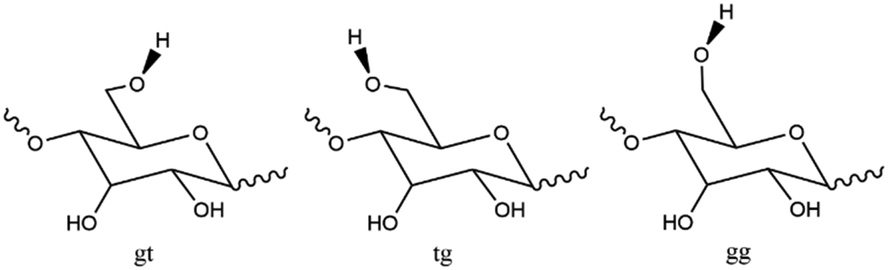
In a study on cellulose dissolution in ionic liquids, the rotation of the hydroxymethyl group on polysaccharide chains was analyzed in relation to their interactions with anions.33–38 The hydroxymethyl group can be oriented in three directions: gauche–trans (gt), trans–gauche (tg), and gauche–gauche (gg) (Fig. 10). When interacting with the acetate anion, the saccharide adopts the gt form, allowing the anion's oxygen atom to interact with two hydroxy groups on the cellulose. Given that CDs and cellulose are both polymers of hexose saccharides, it is reasonable to assume that the interaction between acetate anions and CDs resembles that between acetate anions and cellulose. We propose a structure for the complex formed by hydrogen bonding between acetate anions and CDs (Fig. 11), where the oxygen atom of the acetate anion is associated with two hydroxy groups in adjacent saccharide moieties.
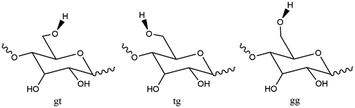 |
| | Fig. 10 The structure of gauche–trans (gt), trans–gauche (tg), and gauche–gauche (gg) rotamers. | |
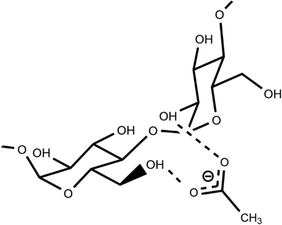 |
| | Fig. 11 Configurations for the interaction between an acetate anion and a cyclodextrin. | |
Suppression effect of lyxose and arabinose on the ESPT reaction
In monosaccharides such as deoxyhexose sugars, the conjugate bases of lyxose and arabinose are stabilized by split intramolecular hydrogen bonds, leading to stronger acidities than those of ethanol.39 However, in reactions involving complexes and saccharides, including CDs, hexoses, and ethanol, it is generally observed that the hydrogen atoms of the hydroxy groups exhibit higher reactivity than those of the urea moiety, causing the dissociation of the complex.
We attribute this phenomenon to the interaction between hydroxy compounds and solvents. Molecular dynamics simulations of glucose solvation in DMF revealed a strong solvation shell around glucose molecules.40,41 The preferential arrangement of DMF molecules around glucose likely strengthens hydrogen bonds between sugar and solvent molecules, reducing the likelihood that sugar molecules interact with other molecules to undergo intermolecular reactions. The less pronounced suppression effect of β-CD on the ESPT reaction in DMSO compared to DMF may be due to DMSO's higher proton-accepting ability.42 Specifically, in DMSO, solvent molecules strongly interact with hydroxy compounds, creating a stable solvation shell that prevents their interaction with acetate anions. Conversely, DMF molecules interact more weakly with hydroxy compounds, leading to a less stable solvation shell that can be disrupted by other reactive molecules such as acetate anions. For monosaccharides, the stabilized conjugate structure of lyxose and arabinose may further enhance interactions with the solvent, forming a robust solvation shell in DMF that impedes the interaction between hydroxy groups and acetate anions.
In this section, we examine the unique interactions between hydroxy compounds and CDs and discuss the solvent effects that may explain the negligible suppression effect of monosaccharides on the ESPT reaction. This phenomenon also highlights the potential of using FLIM technology to differentiate monosaccharides from hexoses based on their distinct fluorescence lifetimes during ESPT reaction suppression.
Conclusions
To investigate the effect of hydroxy compounds on ESPT reactions, we compared the spectroscopic data of the urea–TBAAc system before and after adding α- and β-CDs, fructose, glucose, lyxose, arabinose, and ethanol. We confirmed the formation of free forms in the ground state and the deformation of tautomer forms in the excited state with increasing concentrations of these compounds. Based on previous studies, we hypothesized that the suppression of the ESPT reaction could be attributed to the preferential interaction between the hydroxy group and TBAAc. However, in this study, the suppression effect of monosaccharides like lyxose and arabinose was negligible despite their similar acidity to those of other hydroxy groups. This indicates that factors other than the acidity of the hydroxy groups may influence the ESPT reaction.
Fluorescence lifetime analysis revealed that although lifetime changes were minimal across different hydroxy compounds at the same concentration, variations in amplitude were observed for CDs, ethanol, hexoses, and monosaccharides. These results highlight the potential applications of monosaccharide reactions in FLIM technology. We propose a mechanism by which the hydroxymethyl group on CDs undergoes structural twisting during hydrogen bonding with acetate anions, leading to a more stable configuration. Additionally, the solvation shell formed between the monosaccharide molecules and DMF may explain the reduced interaction between the hydroxy groups and the acetate anions in the ESPT system.
However, direct experimental evidence supporting the rotation of hydroxy groups in CDs during hydrogen bonding and the formation of a solvation shell between monosaccharides and DMF is lacking. Therefore, further studies using infrared spectroscopy and density functional theory calculations are needed. These findings offer valuable insights into the design of fluorescent probes for hexoses and monosaccharides based on ESPT reactions.
Author contributions
Leyun Huang: investigation, methodology, formal analysis, visualization, writing – original draft. Yoshinobu Nishimura: resources, project administration, supervision, writing – review & editing.
Data availability
The data that support the findings of this study are available from the corresponding author upon reasonable request.
Conflicts of interest
There are no conflicts to declare.
Acknowledgements
We gratefully acknowledge the financial support provided by JST SPRING, Grant Number JPMJSP2124.
Notes and references
- H. Koepsell, Pflug Arch Eur J Phy., 2020, 472, 1299–1343 CrossRef CAS PubMed.
- M. Macheda, S. Rogers and J. Best, J. Cell. Physiol., 2005, 202, 654–662 CrossRef CAS.
- B. Thorens and M. Mueckler, Am. J. Physiol. Endocrinol. Metab., 2010, 298, E141–E145 CrossRef CAS.
- A. Brown and B. Ransom, Glia, 2007, 55, 1263–1271 CrossRef PubMed.
- G. Ashrafi and T. Ryan, Curr. Opin. Neurobiol., 2017, 45, 156–161 CrossRef CAS.
- C. Depre, J. Vanoverschelde and H. Taegtmeyer, Circulation, 1999, 99, 578–588 CrossRef CAS PubMed.
- M. Mueckler, Eur. J. Biochem., 1994, 219, 713–725 CrossRef.
- F. Rolland, E. Baena-Gonzalez and J. Sheen, Annu. Rev. Plant Biol., 2006, 57, 675–709 Search PubMed.
- J. Norrild and I. Sotofte, J. Chem. Soc., Perkin Trans., 2002, 2, 303–311 RSC.
- W. Zhai, X. Sun, T. James and J. Fossey, Chem. Asian J., 2015, 10, 1836–1848 CrossRef.
- C. Zhang, M. Losego and P. Braun, Chem. Mater., 2013, 25, 3239–3250 CrossRef.
- C. Gray and T. Houston, J. Org. Chem., 2002, 67, 5426–5428 CrossRef PubMed.
- A. Sedgwick, L. Wu, H. Han, S. Bull, X. He, T. James, J. Sessler, B. Tang, H. Tian and J. Yoon, Chem. Soc. Rev., 2018, 47, 8842–8880 RSC.
- R. Datta, T. Heaster, J. Sharick, A. Gillette and M. Skala, J. Biomed. Opt., 2020, 25, 071203 CAS.
- K. Okabe, N. Inada, C. Gota, Y. Harada, T. Funatsu and S. Uchiyama, Nat. Commun., 2012, 3, 705 CrossRef.
- M. Berezin and S. Achilefu, Chem. Rev., 2010, 110, 2641–2684 CrossRef.
- T. Gadella, T. Jovin and R. Clegg, Biophys. Chem., 1993, 48, 221–239 CrossRef.
- M. Digman, V. Caiolfa, M. Zamai and E. Gratton, Biophys. J., 2008, 94, L14–L16 CrossRef.
- H. Wallrabe and A. Periasamy, Curr. Opin. Biotechnol, 2005, 16, 19–27 CrossRef.
- T. Luo, T. Zhou, Y. Zhao, L. Liu and J. Qu, J. Mater. Chem. B, 2018, 6, 1912–1919 RSC.
- Y. Liang, Y. Zhao, C. Lai, X. Zou and W. Lin, J. Mater. Chem. B, 2021, 9, 8067–8073 RSC.
- J. Lakowicz, H. Szmacinski, K. Nowaczyk, K. Berndt and M. Johnson, Anal. Biochem., 1992, 202, 316–330 CrossRef CAS PubMed.
- W. Becker, J. Microsc., 2012, 247, 119–136 CrossRef CAS.
- J. Sytsma, J. Vroom, C. De Grauw and H. Gerritsen, J. Microsc., 1998, 191, 39–51 CrossRef CAS.
- W. Becker, A. Bergmann, M. Hink, K. König, K. Benndorf and C. Biskup, Microsc. Res. Tech., 2004, 63, 58–66 CrossRef CAS.
- K. Choi and A. D. Hamilton, Angew. Chem., Int. Ed., 2001, 40, 3912–3915 CrossRef CAS PubMed.
- P. Leiderman, L. Genosar and D. Huppert, J. Phys. Chem. A, 2005, 109, 5965–5977 CrossRef CAS PubMed.
- X. Zhang, L. Guo, F. Y. Wu and Y. B. Jiang, Org. Lett., 2003, 5, 2667–2670 CrossRef CAS PubMed.
- V. Amendola, G. Bergamaschi, M. Boiocchi, L. Fabbrizzi and L. Mosca, J. Am. Chem. Soc., 2013, 135, 6345–6355 CrossRef.
- K. Togasaki, T. Arai and Y. Nishimura, Photochem. Photobiol. Sci., 2021, 20, 523–532 CrossRef PubMed.
- L. Huang, M. Yoshida and Y. Nishimura, J. Mol. Liq., 2024, 398, 124268 CrossRef.
- A. Abdel-Shafi, Spectrochim. Acta, Part A, 2007, 66, 1228–1236 CrossRef.
- Y. Zhao, X. Liu, J. Wang and S. Zhang, Carbohydr. Polym., 2013, 94, 723–730 CrossRef PubMed.
- Y. Li, J. Wang, X. Liu and S. Zhang, Chem. Sci., 2018, 9, 4027–4043 RSC.
- H. Wang, G. Gurau and R. Rogers, Chem. Soc. Rev., 2012, 41, 1519–1537 RSC.
- B. Rabideau, A. Agarwal and A. Ismail, J. Phys. Chem. B, 2014, 118, 1621–1629 CrossRef CAS PubMed.
- H. Liu, K. Sale, B. Holmes, B. Simmons and S. Singh, J. Phys. Chem. B, 2010, 114, 4293–4301 CrossRef CAS.
- A. Pinkert, K. Marsh, S. Pang and M. Staiger, Chem. Rev., 2009, 109, 6712–6728 CrossRef CAS.
- Z. Kotena and A. Fattahi, J. Phys. Org. Chem., 2020, 33, e4094 CrossRef CAS.
- V. Vasudevan and S. Mushrif, RSC Adv., 2015, 5, 20756–20763 RSC.
- Q. Lin, S. Liao, L. Li, W. Li, F. Yue, F. Peng and J. Ren, Green Chem., 2020, 22, 532–539 RSC.
- H. Matsumoto, S. Ikedu, T. Tosaka, Y. Nishimura and T. Arai, Photochem. Photobiol. Sci., 2018, 17, 561–569 CrossRef CAS.
|
| This journal is © The Royal Society of Chemistry 2024 |
Click here to see how this site uses Cookies. View our privacy policy here. 
 *
*