
 Open Access Article
 This Open Access Article is licensed under a Creative Commons Attribution-Non Commercial 3.0 Unported Licence
Advancing rhodium nanoparticle-based photodynamic cancer therapy: quantitative proteomics and in vivo assessment reveal mechanisms targeting tumor metabolism, progression and drug resistance†
Andres
Machuca
 a,
Gabriel A.
Peñalver
a,
Roberto Alvarez-Fernandez
Garcia
a,
Angelica
Martinez-Lopez
b,
Sonia
Castillo-Lluva
b,
Estefania
Garcia-Calvo
a and
Jose L.
Luque-Garcia
*a
a,
Gabriel A.
Peñalver
a,
Roberto Alvarez-Fernandez
Garcia
a,
Angelica
Martinez-Lopez
b,
Sonia
Castillo-Lluva
b,
Estefania
Garcia-Calvo
a and
Jose L.
Luque-Garcia
*a
aDepartment Analytical Chemistry, Faculty of Chemical Sciences, Complutense University of Madrid, 28040, Madrid, Spain. E-mail: jlluque@ucm.es; Tel: +34913944212
bDepartment Biochemistry and Molecular Biology, Faculty of Chemical Sciences, Complutense University of Madrid, 28040, Madrid, Spain
First published on 21st October 2024
Abstract
Rhodium nanoparticles have been recently discovered as good photosensitizers with great potential in cancer photodynamic therapy by effectively inducing cytotoxicity in cancer cells under near-infrared laser. This study evaluates the molecular mechanisms underlying such antitumoral effect through quantitative proteomics. The results revealed that rhodium nanoparticle-based photodynamic therapy disrupts tumor metabolism by downregulating key proteins involved in ATP synthesis and mitochondrial function, leading to compromised energy production. The treatment also induces oxidative stress and apoptosis while targeting the invasion capacity of cancer cells. Additionally, key proteins involved in drug resistance are also affected, demonstrating the efficacy of the treatment in a multi-drug resistant cell line. In vivo evaluation using a chicken embryo model also confirmed the effectiveness of the proposed therapy in reducing tumor growth without affecting embryo viability.
1. Introduction
For many years, great research efforts have been put into the development of new therapeutic procedures for cancer treatment aiming to achieve greater selectivity toward malignant cells and reduce undesired side effects on surrounding tissues. On this behalf, nanomaterials have recently emerged as a new tool with great potential yet to be completely discovered.1,2 Metallic nanoparticles have gained much attention recently as they are easy to synthesize with tunable properties such as particle size and shape.3,4 Recently, the optical properties of these type of materials are being under investigation due to its potential applications in photodynamic therapy as direct photosensitizers.5 This kind of therapy makes use of the ability of some compounds or materials called photosensitizers, to absorb external electromagnetic radiation within the UV to infrared range, and transfer this energy to molecular oxygen to generate highly reactive singlet oxygen, or other reactive oxygen species; thus inducing a cytotoxic cascade response that leads to cell death. The main advantage of this kind of therapy is that, as the cytotoxic effect is only achieved when an external light source radiation is used, higher selectivity is accomplished, since it is possible to treat only a confined area of interest without harming surrounding healthy tissues, thus avoiding harmful side effects.6 One of the big advantages of nanomaterials over conventional photosensitizers is to overcome solubility issues, as most of them are organic molecules with poor aqueous solubility. Therefore, the use of nanomaterials could significantly improve the therapeutic effects and minimize the dosage required for clinical applications. Among the various types of metallic nanoparticles studied as photosensitizers, rhodium nanoparticles (RhNPs) have recently been identified as promising candidates. It is important to note that RhNPs alone have been demonstrated to be non-cytotoxic in a wide range of concentrations;7 however, when exposed to near-infrared radiation, they can induce a significant photodynamic effect through the generation of singlet oxygen, demonstrating their potential in therapeutic applications.7,8When proposing the use of new nanomaterials for therapeutic purposes, it is important to decipher the molecular mechanisms by which the material exerts its action. In this sense, proteomics, and specifically quantitative proteomics, is a very valuable tool, since it allows the identification of the set of proteins whose expression is altered as a consequence of exposure to the nanomaterial. This, therefore, makes it possible to identify the specific molecular mechanisms as well as the main cellular processes responsible for the observed effects.9 Among the different quantitative proteomics strategies, the stable isotopic labeling by amino acids in cell culture (SILAC) strategy is still the alternative with the greatest accuracy, thus providing highly reliable results.10
Preclinical trials of new antitumoral therapies requires the use of both in vitro and in vivo models for further understanding of the potential clinical applications. However, although mice models are the most commonly used, they are time-consuming, highly-costing and its use arise several ethical concerns. On the other hand, chicken chorioallantoic membrane (CAM) in vivo models are more rapid and cost-effective models which can bridge the gap between the in vitro system and the high complexity of a living mammal organism. Additionally, this in vivo models are not subjected to most animal experimentation restrictions when conducting the experiment within the earlier stages of embryonic development.11
In this work, a deeper insight into the biomolecular mechanisms involved in the cellular response to the photodynamic treatment based on rhodium nanoparticles is provided by a SILAC-based proteomic study. Alternative assays, including an in vivo experiment, have also been carried out to confirm the evidences resulting from the proteomics approach that point to certain processes involved in the efficacy of the photodynamic treatment based on RhNPs.
2. Experimental
2.1. Synthesis of RhNPs
RhNPs were synthesized following a previously outlined procedure.7 In brief, PVP (MW = 10![[thin space (1/6-em)]](https://www.rsc.org/images/entities/char_2009.gif) 000; 53 mg) was dissolved in MilliQ water (18.2 MΩ cm; 1 mL) and subsequently combined with ethylene glycol (10 mL) in a round-bottomed flask. The mixture was then heated to 196 °C, after which RhCl3 (10.5 mg) was introduced and allowed to reflux for 1 h. The resulting solid was collected via centrifugation, subjected to multiple washes with EtOH:H2O, dried, and ultimately suspended in MilliQ water. A TEM micrograph of the synthesized RhNPs together with their hydrodynamic size distribution obtained by DLS is provided in ESI,† Fig. S1.
000; 53 mg) was dissolved in MilliQ water (18.2 MΩ cm; 1 mL) and subsequently combined with ethylene glycol (10 mL) in a round-bottomed flask. The mixture was then heated to 196 °C, after which RhCl3 (10.5 mg) was introduced and allowed to reflux for 1 h. The resulting solid was collected via centrifugation, subjected to multiple washes with EtOH:H2O, dried, and ultimately suspended in MilliQ water. A TEM micrograph of the synthesized RhNPs together with their hydrodynamic size distribution obtained by DLS is provided in ESI,† Fig. S1.
2.2. Cell culture and exposure conditions
HeLa, ES-2 and T47D cells were obtained from the American Type Culture Collection (ATCC) and maintained using Dubelcco's modified Eagle media (DMEM), McCoy's 5A media, and RPMI media, respectively. In all cases, media was supplemented with 10% FBS and 100 U mL−1 penicillin/streptomycin and cells were cultured at 37 °C and 5% CO2.To carry out the photodynamic treatment, cells were seeded in P96 plates at a rate of 3 × 10³ cells per well and exposed to 5 mg L−1 RhNPs for 24 h. Then, the media was replaced to remove non-internalized NPs and irradiated using an 800 nm NIR laser operating at 2.5 W cm−2 for 10 min, followed by a post-incubation period of 48 h.
2.3. SILAC-based quantitative proteomics analysis
:1 ratio. Direct (12C wild type control and 13C-labeled treated cells) and reverse (13C-labeled controls and 12C wild type treated cells) SILAC mixes were prepared. Total protein extracts were obtained by complete cell lysis using a lysis buffer containing protease inhibitors. Total protein concentration was quantified by the Bradford method and equal amounts of protein were concentrated by SDS-PAGE using 10% polyacrylamide gels. Electrophoresis was stopped after the protein migration front reached the top of the running gel, thus concentrated single bands containing all proteins were obtained and visualized with Coomassie blue staining. Bands were excised and cut into small pieces, then in-gel protein digestion was performed using 12.5 μg mL−1 trypsin in 25 mM NH4HCO3 and incubated overnight at 37 °C with gentle agitation (300 rpm) in a thermomixer. Digestion was quenched by freezing the samples at −80 °C for 1 h and the generated peptides were subsequently extracted from the gel using acetonitrile and 5% formic acid. Peptide extracts were dried by vacuum centrifugation.
000 resolution in full scan MS mode, with a mass range of 350–2000 Da. MS/MS data were acquired in data-dependent acquisition (DDA) mode from MS. Peptide fragmentation was achieved by high collision dissociation (HCD) with a normalized collision energy of 27%. MS/MS spectra were acquired in positive mode.
Statistical significances were stablished using the student's t-test at a significance level of 0.05, with further P-value correction by Benjamin–Hochberg ad hoc test to discard false positive changes. Only those proteins with an abundance ratio variability < 30%, p value < 0.05 and log SILAC ratio > 0.17 were considered as differentially expressed.
2.4. Intracellular ROS detection by electric paramagnetic resonance spectroscopy
Intracellular ROS detection was performed according to Scheinok et al.12 Briefly, cells were harvested from P96 wells after treatment, centrifuged and resuspended in PBS containing 1 mM DTPA to a final concentration of 107 cells mL−1. Then, either cytosolic (CMH) or mitochondrial (mitoTEMPO-H) spin probes were added to each sample to a final concentration of 0.5 mM and 160 μM, respectively. Probes were added to each sample immediately before analysis and electronic paramagnetic resonance (EPR) spectra were obtained after 10 min on a RSE Bruker EMX instrument. For obtaining the EPR spectra of both cytosolic and mitochondrial probes, microwave power was set at 20 mW, modulation frequency and amplitude were 100 kHz and 1G, respectively, and time constant was 20.48 ms. Conversion times were 40.96 ms and 20.48 ms for CMH and mitoTEMPO-H probes, respectively. Resolution in X was 1024 and sweep field was set at 100G.For each sample, the intensities of the three EPR signals were measured using the “screen reader” tool from Origin software. Statistical analysis was performed by a two-way Student's t-test at 95% confidence using GraphPad Prism 5 software.
2.5. Evaluation of intracellular Ca2+ levels
Both cytosolic and mitochondrial calcium ion levels were evaluated using Fluo-3-AM and Rhod-2-AM as calcium-selective molecular probes, respectively. After exposure to RhNPs and NIR, HeLa cells were incubated in the dark for 45 min at 37 °C with either 5 μM Fluo-3-AM or 1 μM Rhod-2-AM on DMEM without FBS supplementation. Cells were then harvested and resuspended in PBS, transferred into flow cytometry tubes and finally analyzed on a Cytek Aurora Spectral CS flow cytometer.2.6. Boyden chamber invasion assay
Invasion ability was evaluated on HeLa cells after treatment with RhNPs and NIR by a slightly modified Boyden chamber assay. This methodology allows for the assessment of the ability of cancer cells to degrade the extracellular matrix simulated by Matrigel® coating and migrate through the pores of the transwell insert membrane, therefore replicating the cancer cell invasive performance. In this assay, a chemotactic gradient is employed to stimulate cell migration towards the lower chamber by using FBS-free media only on the upper chamber of the transwell where the cells are seeded.Briefly, cells were seeded in P96 at a rate of 2 × 10³ cells per well and exposed to RhNPs and NIR as previously described. After exposure, cells were detached, resuspended in conditioned media (without FBS supplementation) and transferred to the upper chamber of P96 transwell inserts (8 μm pore sized polyethylene membrane) previously coated with a thin layer of Matrigel® matrix. Complete growth media (DMEM 10% FBS) was added to the lower chamber to create a chemotactic gradient between chambers. Cells were then incubated for 48 h prior cell fixation with chilled MeOH (−20 °C) for 10 min. Cells that remained on the top side of the matrix after fixation were removed using cotton swabs and membrane was covered with 0.1% crystal violet for 10 min. After staining, membranes were washed with MilliQ H2O and images were obtained with an EVOS FL Auto Imaging System using a 4× objective. Cell counting was performed using the “Analyze Particles” tool of the ImageJ software (version 1.52a, National Institute of Health, USA). Statistical analysis was performed by two-way Student's t-test at 95% confidence using GraphPad Prism 5 software.
2.7. Evaluation of metalloproteinase activity using gelatin zymography
Cells were seeded and exposed as previously described with minor changes. For this assay, conditioned media (DMEM without FBS) was used for the incubation after RhNPs exposure. After incubation, media was collected and concentrated 10× under vacuum at 30 °C on a concentrator (Concentrator plus, Eppendorf®). Then, total protein content was quantified using the Bradford assay and equal amounts of protein for each sample were separately mixed with non-reducing sample buffer and loaded on a 7.5% acrylamide gel containing 1 mg mL−1 gelatin. The gel was electrophoresed and then washed twice using 2.5% Triton X-100, 50 mM trisHCl pH 7.5, 5 mM CaCl2, 1 μM ZnCl2 washing buffer for 30 min to remove SDS from the acrylamide gel before overnight incubation at 37 °C with 1% Triton X-100, 50 mM TrisHCl pH 7.5, 5 mM CaCl2, 1 μM ZnCl2 incubation buffer. After incubation, gel was stained using Coomassie blue staining solution for 1 h at room temperature and de-stained with 40% MeOH, 10% acetic acid in H2O until bands were visible. Gel images were taken on an Alpha Innotech FluorChemQ MultiImage III. Band densities were measured using the ImageJ software (version 1.52a, National Institute of Health, USA). Statistical analysis was performed by two-way Student's t-test at 95% confidence using GraphPad Prism 5 software.2.8. Multidrug cell viability assay
A multidrug-resistant cell line (ES-2 cells) and HeLa cells were plated onto 96-well plates at a density of 2 × 10³ cells per well and treated with either RhNPs and NIR (under the same conditions as previously described), 5 μM of CisPt, 5 μM of etoposide or 1 μM of doxorubicin. Subsequently, cell viability under each condition was assessed using the MTT assay. In brief, 20 μL of 5 mg mL−1 MTT solution were added to each well and incubated for 4 h at 37 °C. Afterward, the media was aspirated, and 100 μL of DMSO were added to dissolve the formazan crystals. Absorbance was then measured at 595 nm using a Sunrise microplate reader (Tecan).2.9. Internalization of RhNPs by ICP-MS
To evaluate the cellular uptake of RhNPs, total Rh content was assessed in HeLa cells pellet after exposure. Briefly, 1.5 × 10⁶ HeLa cells were plated in P100 culture dishes, and exposed to 5 mg L−1 of RhNPs for 24 h. Then, cells were thoroughly washed with PBS several times to remove non-internalized RhNPs and harvested by trypsinization. At this point, cells were counted for further sample normalization. Whole cell pellets were then digested by boiling on H2SO4 until complete evaporation of the liquid for complete RhNPs dissolution. Finally, samples were reconstituted in 1% HNO3 and total Rh content was analyzed by ICP-MS on a Bruker Aurora Elite instrument equipped with a quadrupole mass analyzer. Samples were prepared on triplicates.2.10. Chicken chorioallantoic membrane assay
Chicken embryo chorioallantoic membrane assay was used as in vivo model to evaluate the potential of RhNPs to stop tumor development in a living organism. using breast cancer cell line T47D to induce the tumor.Fertilized eggs were purchased from a local provider and maintained for 10 days in an incubator at 37 °C and 70% humidity, rotating every 1 h to avoid embryo attachment to the eggshell. Breast carcinoma T47D cells were maintained in RPMI medium supplemented with 10% FBS and exposed to 10 mg L−1 RhNPs for 24 h prior to inoculation. At day 10, a small window (1 cm2) was carefully created on the egg shells without damaging the inner membrane. A suspension of 1 × 10⁶ T47D cells on 25 μL PBS was mixed 1:1 with Matrigel® and the whole volume was placed on a sterile O-ring over the egg membrane, scratching gently with the pipette tip to enhance cell adhesion. Eggs were then placed on the incubator without rotation for another 3 days for tumor growth, then treated with NIR radiation (800 nm, 2.5 W cm−2, 10 min). After treatment, eggs were returned to the incubator and maintained without rotation for another 4 days. On day 17, chicken embryos were sacrificed, and tumors were resected, weighted, and measured. A total of 15 eggs were used for each condition. In control eggs, culture medium was added over tumors.
3. Results
3.1. Quantitative proteomics results
To enhance understanding of the molecular mechanisms underlying the antitumoral effects of the RhNPs-mediated photodynamic therapy, a SILAC-based quantitative proteomics experiment was conducted to assess alterations in protein expression induced by this treatment in HeLa cells. Exposure conditions were chosen based on previous findings.7 A total of 2033 proteins were identified, from which 1944 proteins fulfilled the criteria for quantitation (ESI,† Table S1). Most of the quantified proteins presented a log SILAC ratio close to 0, as expected for a 1:1 mixture (ESI,† Fig. S2). A total of 108 proteins were found significantly altered upon RhNPs exposure and NIR irradiation, 59 of which were over-expressed and 49 down-regulated (Table 1). The functional annotation of the altered proteins was obtained from the UniProt resource website with taxonomical restriction to H. sapiens (UP-5640). Altered proteins were implicated in various processes, including energy related pathways, calcium homeostasis, oxidative stress response, migration and invasion, and drug resistance. The involvement of these processes in the RhNPs-mediated photodynamic treatment was subsequently validated by additional assays. Also, the specific role of the different altered proteins in the molecular mechanisms related to such processes is further discussed.
Rs〉 0.17) in cells treated with RhNPs and NIR vs. control
| Common name | Accession | Protein name | SILAC ratio (log) | RSD | MASCOT score |
|---|---|---|---|---|---|
| ADRM1 | A0A087WX59 | Proteasomal ubiquitin receptor ADRM1 | 0.51 | 22.10 | 20 |
| KYNU | Q16719 | Kynureninase | 0.47 | 22.50 | 43 |
| SQSTM1 | Q13501 | Sequestosome-1 | 0.45 | 4.57 | 202 |
| HMOX1 | P09601 | Heme oxygenase 1 | 0.40 | 15.15 | 95 |
| UGDH | O60701 | UDP-glucose 6-dehydrogenase | 0.40 | 23.15 | 641 |
| NPLOC4 | Q8TAT6 | Nuclear protein localization protein 4 homolog | 0.36 | 23.92 | 95 |
| SLC9A3R2 | Q15599-3 | Isoform 3 of Na(+)/H(+) exchange regulatory cofactor NHE-RF2 | 0.35 | 20.42 | 23 |
| VAMP-3 | Q15836 | Vesicle-associated membrane protein 3 | 0.31 | 18.22 | 110 |
| UBE2G1 | P62253 | Ubiquitin-conjugating enzyme E2 G1 | 0.29 | 18.14 | 95 |
| PRPF3 | O43395 | U4/U6 small nuclear ribonucleoprotein Prp3 | 0.29 | 7.29 | 46 |
| ALDH3A2 | P51648 | Fatty aldehyde dehydrogenase | 0.29 | 7.61 | 138 |
| — | F8W031 | Uncharacterized protein (fragment) | 0.29 | 5.73 | 319 |
| CD44 | H0YD13 | CD44 antigen | 0.28 | 21.91 | 721 |
| RBMS1 | F6Y5H0 | RNA-binding motif, single-stranded-interacting protein 1 | 0.27 | 6.26 | 120 |
| EIF1AX | P47813 | Eukaryotic translation initiation factor 1A, X-chromosomal | 0.26 | 29.60 | 33 |
| PAF1 | Q8N7H5 | RNA polymerase II-associated factor 1 homolog | 0.26 | 4.73 | 47 |
| VIM | P08670 | Vimentin | 0.24 | 16.00 | 10244 |
| CDKN2A | P42771 | Cyclin-dependent kinase inhibitor 2A | 0.24 | 19.83 | 395 |
| RRP12 | Q5JTH9 | RRP12-like protein | 0.24 | 23.34 | 36 |
| CALU | O43852 | Calumenin | 0.24 | 8.56 | 287 |
| ITGA5 | P08648 | Integrin alpha-5 | 0.24 | 23.87 | 40 |
| GNPDA1 | P46926 | Glucosamine-6-phosphate isomerase 1 | 0.23 | 6.53 | 45 |
| METAP2 | P50579 | Methionine aminopeptidase 2 | 0.23 | 6.46 | 112 |
| SRP68 | Q9UHB9 | Signal recognition particle subunit SRP68 | 0.23 | 18.87 | 178 |
| TRIM16 | O95361 | Tripartite motif-containing protein 16 | 0.22 | 13.37 | 52 |
| HLA-B | P30479 | HLA class I histocompatibility antigen, B-41 alpha chain | 0.22 | 26.76 | 170 |
| HK1 | P19367 | Hexokinase-1 OS = Homo sapiens | 0.22 | 21.26 | 50 |
| FUS | P35637 | RNA-binding protein FUS | 0.22 | 2.14 | 240 |
| AIMP2 | Q13155 | Aminoacyl tRNA synthase complex-interacting multifunctional protein 2 | 0.22 | 3.69 | 40 |
| DDX39A | O00148 | ATP-dependent RNA helicase DDX39A | 0.22 | 18.63 | 381 |
| TMCO1 | J9JIE6 | Calcium load-activated calcium channel | 0.22 | 25.25 | 126 |
| PELP1 | Q8IZL8 | Proline-, glutamic acid- and leucine-rich protein 1 | 0.22 | 28.96 | 15 |
| AKR1C2 | P52895 | Aldo-keto reductase family 1 member C2 | 0.22 | 4.71 | 907 |
| EIF3M | Q7L2H7 | Eukaryotic translation initiation factor 3 subunit M | 0.22 | 18.51 | 493 |
| RTN4 | Q9NQC3 | Reticulon-4 | 0.21 | 14.41 | 305 |
| TOMM40 | O96008 | Mitochondrial import receptor subunit TOM40 homolog | 0.21 | 24.51 | 52 |
| ARPC5L | Q9BPX5 | Actin-related protein 2/3 complex subunit 5-like protein | 0.20 | 5.10 | 90 |
| TRMT1 | Q9NXH9 | tRNA (guanine(26)-N(2))-dimethyltransferase | 0.21 | 10.04 | 63 |
| SYPL1 | C9JYN0 | Synaptophysin-like protein 1 | 0.20 | 21.07 | 55 |
| H2AFV | Q71UI9 | Histone H2A.V | 0.19 | 25.74 | 718 |
| GNL3 | Q9BVP2 | Guanine nucleotide-binding protein-like 3 | 0.19 | 11.83 | 76 |
| KPNA3 | O00505 | Importin subunit alpha-4 | 0.19 | 18.53 | 104 |
| ASNS | P08243 | Asparagine synthetase [glutamine-hydrolyzing] | 0.19 | 21.51 | 266 |
| CD63 | F8VWK8 | Tetraspanin (fragment) | 0.19 | 7.64 | 31 |
| SLC1A5 | Q15758 | Neutral amino acid transporter B(0) | 0.19 | 6.83 | 413 |
| SCP2 | P22307 | Non-specific lipid-transfer protein | 0.19 | 4.99 | 40 |
| TCOF1 | E7ETY2 | Treacle protein | 0.18 | 25.02 | 116 |
| ERLIN1 | O75477 | Erlin-1 | 0.18 | 0.28 | 93 |
| YBX1 | P67809 | Nuclease-sensitive element-binding protein 1 | 0.18 | 6.65 | 1095 |
| ADAR | P55265 | Double-stranded RNA-specific adenosine deaminase | 0.18 | 1.13 | 63 |
| CYCS | C9JFR7 | Cytochrome c (fragment) | 0.18 | 0.40 | 325 |
| TXNL1 | O43396 | Thioredoxin-like protein 1 | 0.18 | 8.17 | 539 |
| AKR1C3 | A0A0A0MSS8 | Aldo-keto reductase family 1 member C3 | 0.18 | 4.00 | 722 |
| MAT2A | P31153 | S-Adenosylmethionine synthase isoform type-2 | 0.18 | 21.44 | 426 |
| SNRPD1 | P62314 | Small nuclear ribonucleoprotein Sm D1 | 0.18 | 5.15 | 209 |
| GCLM | P48507 | Glutamate–cysteine ligase regulatory subunit | 0.17 | 21.27 | 198 |
| TMX1 | Q9H3N1 | Thioredoxin-related transmembrane protein 1 | 0.17 | 15.91 | 111 |
| HIST1H1D | P16402 | Histone H1.3 | 0.17 | 17.14 | 492 |
| S100A10 | P60903 | Protein S100-A10 | 0.17 | 2.36 | 56 |
| CNN2 | B4DDF4 | Calponin | −0.17 | 12.37 | 440 |
| KRT17 | Q04695 | Keratin, type I cytoskeletal 17 | −0.17 | 16.53 | 4926 |
| SEC23A | F5H365 | Protein transport protein Sec23A | −0.17 | 12.83 | 86 |
| NPEPPS | E9PLK3 | Aminopeptidase | −0.17 | 6.28 | 272 |
| ACAT2 | Q9BWD1 | Acetyl–CoA acetyltransferase, cytosolic | −0.17 | 5.14 | 225 |
| IPO9 | Q96P70 | Importin-9 | −0.17 | 23.16 | 449 |
| EHD2 | Q9NZN4 | EH domain-containing protein 2 | −0.18 | 9.30 | 85 |
| STMN1 | P16949 | Stathmin | −0.18 | 8.28 | 76 |
| PGM1 | P36871 | Phosphoglucomutase-1 | −0.18 | 0.43 | 260 |
| GOT1 | P17174 | Aspartate aminotransferase, cytoplasmic | −0.18 | 1.76 | 253 |
| EZR | P15311 | Ezrin | −0.19 | 14.59 | 2432 |
| PPP2R5D | H0Y8C4 | Serine/threonine–protein phosphatase 2A 56 kDa regulatory subunit delta isoform (Fragment) | −0.19 | 25.99 | 35 |
| CAPZA2 | P47755 | F-actin-capping protein subunit alpha-2 | −0.19 | 0.07 | 96 |
| PDE4D | Q08499-6 | Isoform 5 of cAMP-specific 3′,5′-cyclic phosphodiesterase 4D | −0.19 | 3.79 | 43 |
| ATP5D | P30049 | ATP synthase subunit delta, mitochondrial | −0.19 | 3.88 | 179 |
| MTRR | Q9UBK8 | Methionine synthase reductase | −0.19 | 3.44 | 41 |
| CDKN2A | Q8N726 | Tumor suppressor ARF | −0.20 | 13.63 | 354 |
| EIF2A | Q9BY44 | Eukaryotic translation initiation factor 2A | −0.20 | 16.74 | 64 |
| STOM | P27105 | Erythrocyte band 7 integral membrane protein | −0.21 | 14.42 | 271 |
| CPS1 | P31327 | Carbamoyl-phosphate synthase [ammonia], mitochondrial | −0.21 | 2.27 | 829 |
| ANXA6 | P08133 | Annexin A6 | −0.21 | 4.19 | 1019 |
| KCTD12 | Q96CX2 | BTB/POZ domain-containing protein KCTD12 | −0.21 | 25.18 | 301 |
| FDFT1 | P37268 | Squalene synthase | −0.21 | 5.84 | 47 |
| ARHGAP1 | Q07960 | Rho GTPase-activating protein 1 | −0.22 | 26.23 | 158 |
| PLOD2 | E7ETU9 | Procollagen-lysine,2-oxoglutarate 5-dioxygenase 2 | −0.22 | 8.69 | 330 |
| LIMA1 | F8VQE1 | LIM domain and actin-binding protein 1 | −0.23 | 7.69 | 443 |
| IDI1 | Q13907 | Isopentenyl-diphosphate Delta-isomerase 1 | −0.23 | 12.31 | 49 |
| EPPK1 | P58107 | Epiplakin | −0.23 | 19.09 | 992 |
| RBBP4 | Q09028 | Histone-binding protein RBBP4 | −0.23 | 29.17 | 936 |
| ATXN10 | Q9UBB4 | Ataxin-10 | −0.25 | 7.35 | 504 |
| TPM1 | H7BYY1 | Tropomyosin 1 (Alpha), isoform CRA_m | −0.25 | 28.07 | 687 |
| SEC13 | P55735 | Protein SEC13 homolog | −0.26 | 17.99 | 50 |
| ROCK2 | O75116 | Rho-associated protein kinase 2 | −0.26 | 0.02 | 92 |
| CKB | P12277 | Creatine kinase B-type | −0.26 | 1.59 | 2463 |
| KRT18 | P05783 | Keratin, type I cytoskeletal 18 | −0.26 | 13.26 | 2382 |
| HSPB1 | P04792 | Heat shock protein beta-1 | −0.28 | 1.40 | 2607 |
| DDB1 | Q16531 | DNA damage-binding protein 1 | −0.30 | 25.16 | 37 |
| TAGLN | Q01995 | Transgelin | −0.32 | 12.48 | 1851 |
| SNX2 | O60749 | Sorting nexin-2 | −0.32 | 3.36 | 18 |
| TPM2 | P07951-2 | Isoform 2 of Tropomyosin beta chain | −0.32 | 25.99 | 1209 |
| RPA3 | P35244 | Replication protein A 14 kDa subunit | −0.33 | 11.76 | 21 |
| KRT80 | Q6KB66 | Keratin, type II cytoskeletal 80 | −0.34 | 13.53 | 36 |
| KRT8 | P05787 | Keratin, type II cytoskeletal 8 | −0.36 | 9.20 | 6959 |
| P4HA2 | O15460 | Prolyl 4-hydroxylase subunit alpha-2 | −0.38 | 6.12 | 59 |
| S100A13 | Q99584 | Protein S100-A13 | −0.40 | 22.88 | 40 |
| MSH2 | P43246 | DNA mismatch repair protein Msh2 | −0.43 | 27.27 | 106 |
| ARPC1B | O15143 | Actin-related protein 2/3 complex subunit 1B | −0.50 | 23.95 | 18 |
| ACTC1 | P68032 | Actin, alpha cardiac muscle 1 | −0.55 | 0.18 | 9779 |
| KRT19 | P08727 | Keratin, type I cytoskeletal 19 | −0.70 | 9.58 | 690 |
3.2. RhNPs-mediated PDT treatment induces ROS generation
Following the identification of altered oxidative stress-related proteins in cells treated with RhNPs + NIR, the production of both cytosolic and mitochondrial superoxide radicals was assessed using EPR analysis. The probe CMH was employed to determine cytosolic superoxide production, while the probe mitoTEMPO-H was chosen for mitochondrial superoxide radical determination. Upon PDT treatment, higher formation of ROS was observed in both the cytosol (Fig. 1(A)) and the mitochondria (Fig. 1(B)) of treated cells as compared to control cells. These findings confirm the capability of the treatment with RhNPs + NIR to induce oxidative stress.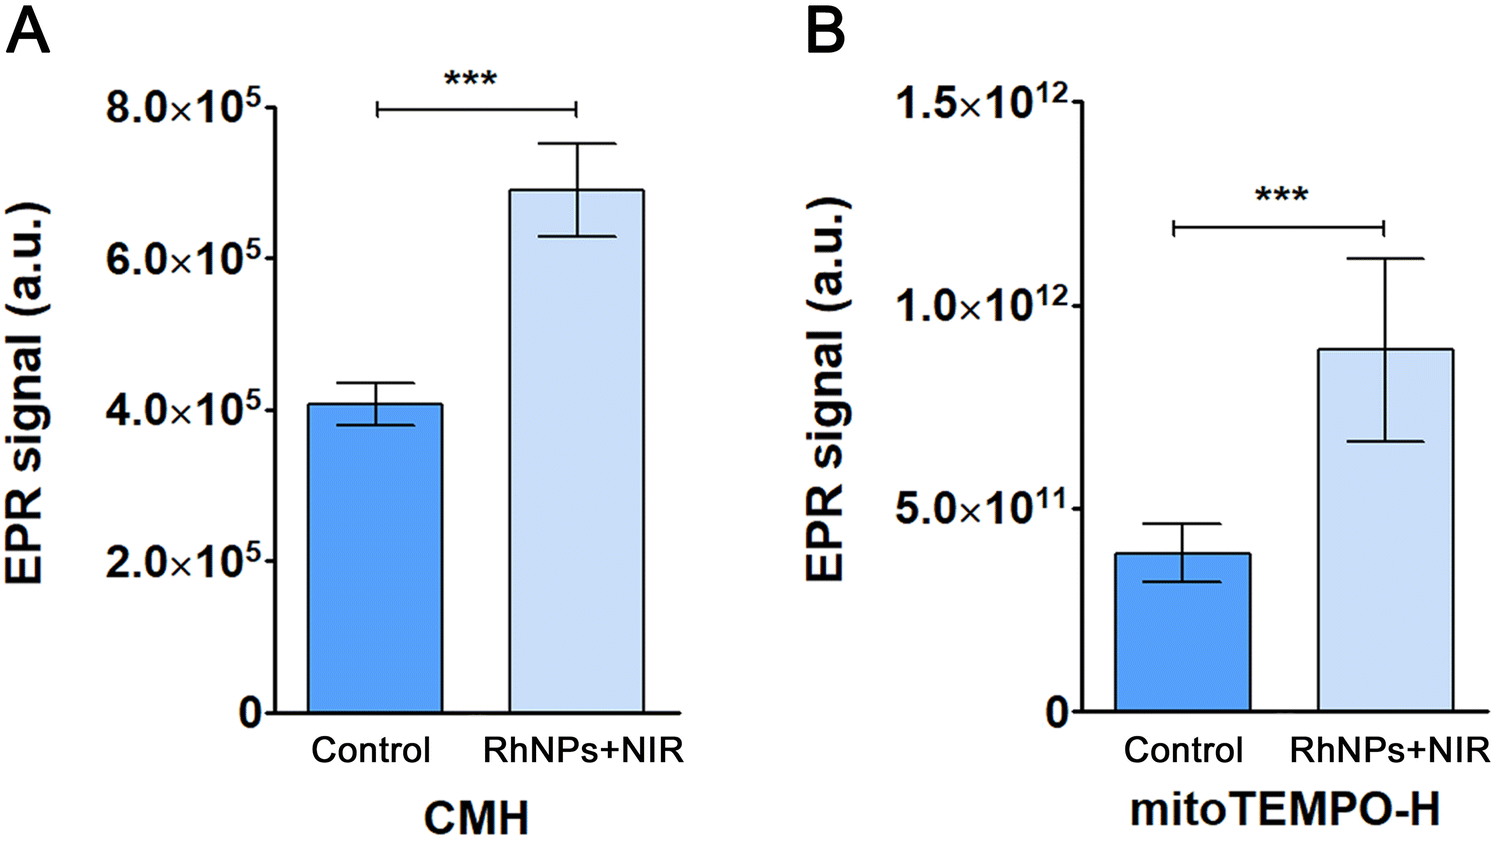 | ||
| Fig. 1 EPR signal from control and treated cells using (A) CMH and (B) mitoTEMPO-H as cytosolic and mitochondrial spin probes, respectively. Data are represented as mean ± standard deviation (n = 9). Statistical significance: ***p < 0.001. | ||
3.3. Alteration of the calcium homeostasis
In order to evaluate the effect of the treatment with RhNPs + NIR on the calcium homeostasis, two calcium-selective molecular probes were used: Rhod-2-AM and Fluo-3-AM. While Rhod-2-AM measures the levels of Ca2+ in the mitochondria, Fluo-3-AM is used to determine the levels of Ca2+ in the cytosol. As shown in Fig. 2, cells exposed to RhNPs and NIR increased the levels of Ca2+ in the mitochondria significantly (Fig. 2(A)); however, in the case of the cytosol, the observed increased was not statistically significant (Fig. 2(B)). These results demonstrate the effect of the RhNPs-mediated PDT treatment on disrupting the calcium homeostasis in the mitochondria, which is in well agreement with the findings derived from the SILAC experiment as it will be further discussed. | ||
| Fig. 2 Determination of intracellular Ca2+ levels in mitochondria (A) and cytosol (B) using fluorescent probes Rhod-2 AM and Fluo-3 AM, respectively, in HeLa cells after RhNPs-based PDT treatment. Data are represented as mean ± standard deviation (n = 3). Statistical significance: ns, no significance, *p < 0.05. | ||
3.4. Photodynamic treatment effects on cell invasiveness
Due to the high number of altered proteins related to tumor migration and invasion that were found in the SILAC approach, a modified Boyden chamber assay was performed to investigate the invasive character of the cells treated with RhNPs + NIR. Control and treated cells were seeded on the top part of transwell inserts in which a thin layer of Matrigel® was previously deposited over the porous membrane to simulate the extracellular matrix of the tumor environment. As shown in Fig. 3, the number of cells that were able to degrade the Matrigel® and migrate across the porous membrane was significantly lower in treated cells as compared to the controls, which correlates with the results obtained in the SILAC assay. | ||
| Fig. 3 Number of invasive HeLa cells in control and treated samples in modified Boyden chamber assay. Data are represented as mean ± standard deviation (n = 3). Statistical significance: **p < 0.005. | ||
3.5. Evaluation of the excreted metalloproteinase activity
Further investigation of the invasive character of the cells was carried out by evaluating the activity of the metalloproteinases excreted to the extracellular environment. A gelatin zymography assay was performed since the proteinase activity is directly related to the degradation of the gelatin contained in a polyacrylamide gel after incubation. As expected, and in agreement with the results obtained in both the SILAC and invasion assays, the metalloproteinase activity found in the culture media of cells treated with RhNPs + NIR was significantly lower than that found in the media of control cells (Fig. 4). | ||
| Fig. 4 Metalloproteinase activity band areas from control and treated sample medium protein concentrates. Data are represented as mean ± standard deviation (n = 3). Statistical significance: *p < 0.05. | ||
3.6. RhNPs assisted PDT overcomes drug resistance
Some of the proteins that were found down-regulated after treatment with RhNPs + NIR were related to cell survival processes like drug resistance. Thus, in order to confirm the ability of this treatment to overcome drug resistance in tumor cells, a multidrug resistant ovarian carcinoma ES-2 cell line was used along with HeLa cells to compare the effects of different clinically used antitumoral drugs such as cisplatin, doxorubicin and etoposide. Concentrations of each drug was selected as it produces similar effects on cell viability as RhNPs + NIR on HeLa cells. Interestingly, the decreased in the viability of ES-2 cells was found to be statistically similar to HeLa cells after RhNPs + NIR treatment (Fig. 5), whereas the other tested drugs induced a significantly lower decreased in the viability of resistant ES-2 cells, as compared to the non-resistant HeLa cell line. This fact demonstrates the ability of the proposed treatment to affect multidrug resistant tumoral cells. | ||
| Fig. 5 Cell viability assay showing cytotoxic effects of the RhNPs-based photodynamic therapy, cisplatin (CP), doxorubicin (DOX) and etoposide (ET) on both HeLa and multi-drug resistant ES-2 cells. Data are represented as mean ± standard deviation (n = 7). Statistical significance: ns, no significance, ***p < 0.001. | ||
3.7. PDT mediated by RhNPs involves efficient cellular internalization of the nanoparticles
Cellular uptake of RhNPs was confirmed by quantification of the intracellular Rh content using ICP-MS. After normalization using the cell number on each sample, a total of 8 ± 1 fg of Rh/cell was quantified in HeLa cells after 24 h exposure to RhNPs. Since Rh is not a naturally occurring element in biological organisms, the observed Rh in HeLa cell pellets can be assumed to be a direct consequence of efficient RhNPs internalization.3.8. RhNPs-based photodynamic therapy inhibits tumor growth in vivo
Based on the promising results obtained on the previous assays and aiming to investigate and validate the therapeutic effects of the RhNPs-based photodynamic treatment on a more complex system, an in vivo approach was designed and performed using a chicken embryo model (Fig. 6(A)). In this approach, a breast cancer tumor model was employed, thus a cell viability assay using luminal A type T47D cells was performed in advance to confirm the photodynamic effect on this cell line. As shown in Fig. 6(B), the cell viability decreased in a concentration dependent manner, demonstrating the effect of the proposed treatment in this cell line. The results derived from the in vivo experiment, demonstrated the ability of the photodynamic treatment to impair tumoral growth, since the tumor weight was significantly lower after treatment as compared to the controls (Fig. 6(C) and (D)). In addition, treatment with either NIR or RhNPs alone, did not reduce tumor size (Fig. 6(C) and (D)), thus demonstrating the non-cytotoxic effects of these components of the photodynamic treatment when they are not combined. | ||
| Fig. 6 In vivo chicken embryo chorioallantoic membrane assay timeline (A). Cell viability assay on T47D cells exposed to photodynamic treatment using 5, 10 and 20 mg L−1 RhNPs (B). Data are represented as mean ± standard deviation (n = 5); statistical significance: *p < 0.05, ****p < 0.0001. Weight of control, NIR, RhNPs and RhNPs + NIR treated tumors (C). Satistical significance: ns, no significance, *p < 0.05. Images of collected tumors (D). | ||
4. Discussion
In the present study, a deeper understanding of the therapeutic effects of RhNPs-based photodynamic treatment using NIR has been investigated. Aiming to identify novel molecular pathways involved in the therapeutic response to RhNPs + NIR photodynamic treatment (Fig. 7), a state-of-the-art quantitative proteomic approach (SILAC) was performed to quantify differentially expressed proteins in treated as compared to control HeLa cells. | ||
| Fig. 7 Schematic representation of the main cellular pathways involved in the therapeutic response to RhNPs-based photodynamic therapy. | ||
Many of the differentially expressed proteins found in the SILAC experiment are involved in energy-related pathways. This finding was expected since energy-related metabolites including ATP, ADP, and NAD+ were found to be altered in previous investigations.8 ATP is required for mammalian cells to remain viable and perform genetically programmed functions. It is of utmost importance in tumor cells as their metabolism is highly upregulated.13 ATP synthesis is achieved by the mitochondrial membrane ATP synthase, a protein complex that includes the ATP5D (Rs = −0.19) subunit, which was highly downregulated after treatment, and whose depletion critically compromises the energy supply of the cell. Furthermore, additional proteins related to mitochondrial metabolism were also found inhibited in our experiment. Such is the case of AAT (Rs = −0.18) and CKB (Rs = −0.26). While AAT plays a key role in electron transfer across the inner mitochondrial membrane, with its depletion being a cause for the inhibition of mitochondrial metabolism,14 CKB plays a key role in the energy homeostasis as an ATP transport protein. Interestingly, its knockdown has been shown to inhibit cancer cell proliferation and to induce apoptosis in ovarian cancer cells.15,16 In addition, ACAT2 (Rs = −0.17), which contributes to the Warburg effect in human cancer by promoting mitochondrial metabolism and cell proliferation, has also been proved to attenuate tumor growth when inhibited.17
An important ATP source for cancerous cells is the metabolism of glucose by means of glycolysis. The substrate glucose 1-phosphate (G-1-P) is firstly converted to glucose 6-phosphate (G-6-P) by the enzyme PGM1 (Rs = −0.18), found inhibited in our study, as the first step for this pathway. Therefore, PGM1 acts as a fundamental metabolic intermediate for glycolysis as well as for the pentose phosphate pathway, providing precursors for anabolic pathways and cofactors required for cell proliferation.18 Something similar occurs for protein P4HA2 (Rs = −0.38), known to promote cervical cancer cell glycolysis. Its depletion has also been shown to inhibit cell proliferation, colony formation and migration.19,20 On the other hand, some proteins related to mitochondrial metabolism were found overexpressed after treatment with NIR + RhNPs. This is the case of ALDH (Rs = 0.29), that has been proven to contribute to ATP production through the supply of cytosolic NADH in non-small cell lung carcinoma.21 This protein, together with HK1 (Rs = 0.22),22 could be being activated in our study, as a cellular response to generate an alternative energy source to ATP. Taking all these indications together, it can be concluded that the treatment of HeLa cells with the proposed photodynamic therapy combining NIR and RhNPs induces an alteration of energy metabolism, which reaffirms our previous results.8
Drug resistance is one of the major drawbacks of the current clinical chemotherapeutics used to treat cancer. Thus, the development of novel therapies able to overcome drug resistance are highly desirable. In this context, it was interesting to find inhibition of CPS1, DBB1, ANXA6 and MTRR proteins in HeLa cells treated with the proposed RhNPs-based photodynamic therapy. The mitochondrial protein CPS1 (Rs = −0.21) plays a key role in tumor growth as it has been confirmed its involvement in pyrimidine supply to the cell.23,24 In the same manner, the protein DBB1 (Rs = −0.28) has been related to drug resistance and cell survival in ovarian cell line A2780CP.25 Whether the role of ANXA6 (Rs = −0.21) is controversial depending on the type of cancer, it has been directly related with cervical cancer progression and malignancy.26 Moreover, MTRR (Rs = −0.19) inhibition promotes cell apoptosis and restores cisplatin sensitivity in ovarian SKOV3/DDP cells.27 To evaluate whether these findings could really translate to a case of multidrug-resistance, the proposed treatment was applied to ES-2 cells (resistant to doxorubicin, etoposide and cisplatin) as compared to non-resistant cells. These three chemotherapeutic drugs (doxorubicin, etoposide and cisplatin) were selected for this experiment as they are widely used for clinical applications for many decades,28,29 and there are several evidences of resistance development to these drugs in various cancer types, therefore offering a good model for the evaluation of the potential of PDT in the treatment of drug-resistant tumor lines with clinical relevance.30–34 As shown in Fig. 5, the conventional chemotherapeutic drugs were effective against HeLa cells but not so much with ES-2 cells. On the other hand, the treatment with RhNPs + NIR was able to reduce the viability of multidrug-resistant ES-2 cells in a similar manner as for the non-resistant HeLa cells. These results, supported by the data obtained from the proteomics experiment, open a new and very interesting approach for the use of the proposed RhNPs-based photodynamic therapy for the treatment of resistant tumors where conventional therapies might be less effective.
Photodynamic therapy directly involves the generation of either singlet oxygen or other reactive oxygen species (ROS), which ultimately cause an oxidative damage within the cell. The ability of the proposed treatment combining RhNPs and NIR has been already demonstrated to induce singlet oxygen;8 thus, proteins related to oxidative damage and antioxidant mechanisms were expected to be de-regulated in treated cells. At intracellular protein levels, heat shock proteins (HSPs) are known to modulate the effects of inflammation cascades leading to the endogenous generation of ROS and intrinsic apoptosis through inhibition of pro-inflammatory factors.35 HSPB1 (Rs = −0.28), also known as HSP27, is a heat shock protein directly related with cell survival by inhibiting apoptosis through interaction with cytochrome c (CYC), blocking the formation of the apoptosome complex.35–37 During apoptosis, mitochondrial CYC (Rs = 0.18) is released to the cytosol due to changes in the permeability of the inner mitochondrial membrane, which can be triggered, not only by suppressing the anti-apoptotic members of the Bcl-2 family, but also due to an increase of the calcium levels within the mitochondria provoked in ER-stress situations.38 The generation of intracellular ROS might be the cause for the increased levels of HMOX1 (Rs = 0.40) observed. HMOX1 is a key molecule in the protective cellular response against oxidative stress.39 Similarly, TMX (Rs = 0.18) and GCL (Rs = 0.17), are also stimuli-expressed proteins that act in cellular defense mechanisms against certain stress situations such as oxidative stress.40,41 On the other hand, downregulation of GOT1 (Rs = −0.18) and overexpression of TOMM40 (Rs = 0.21), also indicate a situation of oxidative stress in the treated cells because, while GOT1 has been demonstrated to maintain the cellular redox state in human pancreatic cancer and its depletion significantly resulted in the loss of cancer cells viability;42 overexpression of TOMM40 (Rs = 0.21) has been related to mitochondrial dysfunction and cell death.43 Since the alteration of these proteins indicates a situation of oxidative stress, as discussed above, it was decided to measure the levels of ROS in both the cytosol and mitochondria of treated cells. As shown by the EPR assay, intracellular ROS levels were significantly higher at both the mitochondria and cytosol in HeLa cells after exposure to RhNPs and NIR treatment (Fig. 1), despite the cell attempt to protect from oxidative damage, which evidences the effectiveness of the treatment. In addition, ER-stress and subsequent mitochondrial damage was also confirmed due to the increased levels of mitochondrial Ca2+ found in the flow cytometry assay (Fig. 2). It is well stablished that Ca2+ has a major contribution in triggering mitotic division in multiple cell types and, conversely, in the regulation of cell death.44 The intracellular levels of calcium are tightly regulated by the ER, however, it has been described that excessive ROS generation increase calcium uptake into the mitochondria by damaging plasma membrane proteins responsible for maintaining Ca2+ concentration gradients, which is an important trigger of the apoptotic signaling causing cell death.45–47 All together, these findings strongly confirm the photodynamic activation of RhNPs within the intracellular environment leading to an oxidative damage cascade of events that ultimately provokes cell death through apoptosis.
Besides the accelerated metabolism and cell growing rate that characterize cancer, it is the ability of tumoral cells to spread and invade distant organs which makes this disease one of the principal cause of deaths worldwide. This process is known as metastasis. The migratory and invasive abilities of cancer cells are the critical parameters of the metastatic cascade, which is the responsible for more than 90% of cancer-associated deaths. Epithelial to mesenchymal transition (EMT) has been recognized as a crucial event in cancer progression and metastasis during the last decade.48 It has also been related to the maintenance of stem cell properties, preventing of apoptosis and senescence.49 Based on this, therapies that prevent or minimize the invasiveness of tumor cells are highly desirable; thus, we searched for proteins related to this process that might be altered after treatment with RhNPs + NIR. In this context, keratins (KRTs), which are intermediate filament cytoskeletal proteins that maintain the structural integrity of epithelial cells, play an important role regulating cancer cell migration and invasion.50 The inhibitory effect of KRT80 (Rs = −0.34) deficiency on cell proliferation has been demonstrated and notably reduced cell migration and invasion.51 KRT8 (Rs = −0.36) and KRT19 (Rs = −0.70) expressions are positively linked.52 These two keratins are considered oncogenes in the development of human cancers, facilitating and promoting gastric cancer and hepatocellular carcinoma invasion and angiogenesis.52–56 The inhibition of KRT80, KRT8 and KRT19 proteins after treatment with RhNPs + NIR is undoubtedly a sign of the effectiveness of the treatment in weakening the invasiveness of tumor cells. In addition, KRT19 (Rs = −0.70) regulates the cell cycle pathway and the sensitivity of breast cancer cells to CDK inhibitors like CDKN2A (Rs = 0.24). Likewise, KRT18 (Rs = −0.26) and KRT17 (Rs = −0.17) are significantly overexpressed in human cancers and have been reported to act as oncogenes, correlating with clinical progression and prognosis.57,58 EPPK1 (Rs = −0.23) directly interacts with KRT18 and KRT8 and protects from certain stress conditions acting as a chaperone.59 Other proteins related to cell motility that were found downregulated are ACTC1 (Rs = −0.55), ARPC1B (Rs = −0.50), TAGLN (Rs = −0.32), TPM1 (Rs = −0.25) and ARHGAP1 (Rs = −0.22), which play important roles in cell migration.60–63 Among them, inhibition of ARHGAP1 is particularly interesting since Rho GTPases have been reported to play a key role in most steps of cancer including proliferation potential, survival, apoptosis evasion and tissue invasion and metastases.64 Overexpression of ARHGAP1 has been associated with the migration and invasion potential of cervical carcinoma and its depletion cause anti-tumor effects.65,66 In addition to those mentioned above, other proteins related to migration and invasion were also found to be altered, such as ROCK2 (Rs = −0.26), CAPZA2 (Rs = −0.19), S100A13 (Rs = −0.40) and FDFT1 (Rs = −0.21). ROCK2 promotes F-actin CAPZA2 accumulation contributing to cancer cell motility;67 Thus, inhibition of both proteins could be related to a less invasive cancer cell phenotype. The protein S100A13, has been found overexpressed in angiogenic switched melanocytic lesions, favoring tumor growth.68 It has been reported to play a key role in tumor progression and metastasis; in fact, high levels of this protein are closely related with poor prognosis in some cancer patients.69 Squalene synthase FDFT1 (Rs = −0.21) modulates the formation of lipid rafts and promotes lung cancer metastasis and prostate cancer development.70 Moreover, loss of function or knockdown of this protein have been proved to significantly inhibit cell migration, invasion and metastasis in cell animal models.71,72 Additional results that support the efficacy of the proposed treatment (RhNPs + NIR) on the invasive ability of HeLa cells include the alteration of EZR (Rs = −0.19), STMN1 (Rs = −0.18), EHD2 (Rs = −0.18) and RBMS1 (Rs = 0.27), which are also important proteins playing key roles in cell proliferation, migration and invasion.73–77 Among them, and following a different trend, it is worth mentioning the overexpression of RBMS1 (Rs = 0.27). Interestingly, this protein has been identified as a suppressor of metastasis and tumor progression by regulating the c-myc proto-oncogene; its overexpression has been related to patient survival.75,76 The ability of the proposed treatment to impair cancer cell invasion was further evaluated by a Boyden chamber invasion assay using a Matrigel® coated membrane. The results showed less matrix degradation and thus, lower invasion capacity for treated cells as compared to the controls (Fig. 3). Further confirmation of this aspect was evidenced by the lower metalloproteinase activity found in HeLa cells after RhNPs + NIR treatment, as shown by the gelatin zymography assay (Fig. 4). Metalloproteinases are a subfamily of proteins that are excreted from cells to the extracellular environment and actively participates in the degradation and remodeling of the extracellular matrix, thus playing a key role in cancer metastasis and cellular invasion to other tissues.78,79 Although its expression was not found to be deregulated in the proteomics experiment, its activity was significantly diminished after RhNPs + NIR treatment, therefore supporting the previous results.
Based on the promising in vitro results, we further explored the therapeutic potential of RhNPs-based NIR photodynamic treatment in a more complex in vivo system using the chicken embryo model. The chicken embryo chorioallantoic membrane assay was conducted to examine the effects of RhNPs, NIR, and their combination on tumor development compared to controls. Remarkably, the results showed no significant differences in chicken embryo survival across all treatment conditions, highlighting the low toxicity of both NIR radiation and RhNPs. This demonstrates the safety and potential clinical applicability of photodynamic treatment using RhNPs and NIR, as embryo viability remained unaffected. Furthermore, analysis of tumor weights revealed that exposure to either NIR or RhNPs alone did not significantly impact cell growth and tumor development. In contrast, the combination of both significantly reduced tumor growth. This demonstrates that RhNPs can be regarded as a promising novel photosensitizing agent for cancer photodynamic therapy, with increasing potential for clinical applications.
5. Conclusion
This study highlights the significant therapeutic potential of rhodium nanoparticles (RhNPs) as novel photosensitizing agent, combined with near-infrared radiation (NIR), for photodynamic cancer therapy. The quantitative proteomic analysis revealed substantial disruptions in energy metabolism, characterized by the downregulation of key proteins, leading to compromised ATP synthesis. Additionally, the treatment inhibited proteins related to glycolysis and alternative energy pathways, further impairing cellular energy production.The results also demonstrated the ability of the treatment to induce oxidative stress and cell death in cancer cells, since elevated ROS levels, mitochondrial damage, and activation of apoptotic pathways were confirmed by the proteomic approach as well as by additional assays. Furthermore, the treatment significantly reduced cancer cell migration and invasion, as evidenced by the downregulation of keratins, actin-related proteins, and the activity of metalloproteinases, among other facts.
In vivo validation using the chicken embryo model demonstrated the low toxicity and high efficacy of RhNPs + NIR therapy, significantly inhibiting tumor growth without compromising embryo viability. These findings underscore the potential of RhNPs + NIR photodynamic therapy as a novel and effective approach for cancer treatment, strongly supporting the proposed nanomaterial for potential uses in clinical applications.
Data availability
The data supporting this article have been included as part of the ESI.†Conflicts of interest
There are no conflicts to declare.Acknowledgements
This work was supported by Ministerio de Ciencia e Innovacion through grants PID2020-114529RB-I00 and PID2023-150182OB-I00. A. M. thanks Complutense University of Madrid and Banco Santander for the predoctoral grant CT82/20-CT83/20.References
- J. Wang, Y. Fu, Z. Gu, H. Pan, P. Zhou, Q. Gan, Y. Yuan and C. Liu, Small, 2023, 20, 2303773 CrossRef PubMed.
- R. Khursheed, K. Dua, S. Vishwas, M. Gulati, N. K. Jha, G. M. Alshafeeri, F. G. Alanazi, B. H. Goh, G. Gupta, K. R. Paudel, P. M. Hansbro, D. K. Chellappan and S. K. Singh, Biomed. Pharmacother, 2022, 150, 112951 CrossRef CAS PubMed.
- H. Estevez, E. Garcia-Calvo, M. L. Mena, R. Alvarez-Fernandez Garcia and J. L. Luque-Garcia, Nanomaterials, 2023, 13(15), 2204 CrossRef CAS PubMed.
- G. Aragoneses-Cazorla, M. Vallet-Regí, M. M. Gómez-Gómez, B. González and J. L. Luque-Garcia, Microchim. Acta, 2023, 190, 130 CrossRef PubMed.
- Y. Yang, Y. Hu, H. Du, L. Ren and H. Wang, Int. J. Nanomedicine, 2018, 13, 2065–2078 CrossRef CAS PubMed.
- B. Deng, K. Wang, L. Zhang, Z. Qiu, W. Dong and W. Wang, Int. J. Biol. Sci., 2023, 19(15), 4793–4810 CrossRef CAS PubMed.
- A. Machuca, E. Garcia-Calvo, D. S. Anunciação and J. L. Luque-Garcia, Chem. – Eur. J., 2020, 26, 7685–7691 CrossRef CAS PubMed.
- A. Machuca, E. Garcia-calvo, D. S. Anunciação and J. L. Luque-Garcia, Pharmaceutics, 2021, 13(10), 1629 CrossRef CAS PubMed.
- G. Aragoneses-Cazorla, E. Alvarez-Fernandez Garcia, A. Martinez-Lopez, M. Gomez-Gomez, M. Vallet-Regi, S. Castillo-Lluva, B. Gonzalez and J. L. Luque-Garcia, Int. J. Pharmaceutics, 2024, 655, 124023 CrossRef CAS PubMed.
- S. Montalvo-Quiros, G. Aragoneses-Cazorla, L. Garcia-Alcalde, M. Vallet-Regi, B. Gonzalez and J. L. Luque-Garcia, Nanoscale, 2019, 11, 4531–4545 RSC.
- L. Miebach, J. Berner and S. Bekeschus, Front. Immunol., 2022, 13, 1006064 CrossRef CAS PubMed.
- S. Scheinok, T. Capeloa, P. E. Porporato, P. Sonveaux and B. Gallez, Cell Biochem. Biophys., 2020, 78, 249–254 CrossRef CAS PubMed.
- T. N. Seyfried, G. Arismendi-Morillo, P. Mukherjee and C. Chinopoulos, iScience, 2020, 23, 101761 CrossRef CAS PubMed.
- J. M. Thornburg, K. K. Nelson, B. F. Clem, A. N. Lane, S. Arumugam, A. Simmons, J. W. Eaton, S. Telang and J. Chesney, Breast Cancer Res., 2008, 10, R84 CrossRef PubMed.
- T. Wallimann and W. Hemmer, Mol. Cell Biochem., 1994, 133, 193–220 CrossRef PubMed.
- X. H. Li, X. J. Chen, W. B. Ou, Q. Zhang, Z. R. Lv, Y. Zhan, L. Ma, T. Huang, Y. B. Yan and H. M. Zhou, Int. J. Biochem. Cell Biol., 2013, 45, 979–986 CrossRef CAS PubMed.
- J. Fan, R. Lin, S. Xia, D. Chen, S. E. Elf, S. Liu, Y. Pan, H. Xu, Z. Qian, M. Wang, C. Shen, L. Zhou, Q. Y. Lei, Y. Li, H. Mao, B. H. Lee, J. Sudderth, R. J. DeBerardinis, G. Zhang, T. Owonikoko, M. Gaddh, M. L. Arellano, H. J. Khoury, F. R. Khuri, S. Kang, P. W. Doetsch, S. Lonial, T. J. Boggon, W. J. Curran and J. Chen, Mol. Cell, 2016, 64, 859–874 CrossRef CAS PubMed.
- E. Bae, H. E. Kim, E. Koh and K. S. Kim, FEBS Lett., 2014, 588, 3074–3080 CrossRef CAS PubMed.
- Q. Li, Q. Wang, Q. Zhang, J. Zhang and J. Zhang, Am. J. Transl. Res., 2019, 11, 6739–6753 Search PubMed.
- Y. Cao, Q. Han, J. Li, Y. Jia, R. Zhang and H. Shi, J. Cancer, 2020, 11, 2788–2799 CrossRef CAS PubMed.
- J. H. Kang, S. H. Lee, D. Hong, J. S. Lee, H. S. Ahn, J. H. Ahn, T. W. Seong, C. H. Lee, H. Jang, K. M. Hong, C. Lee, J. H. Lee and S. Y. Kim, Exp. Mol. Med., 2016, 48(11), e272 CrossRef CAS PubMed.
- P. L. Tseng, C. W. Chen, K. H. Hu, H. C. Cheng, Y. H. Lin, W. H. Tsai, T. J. Cheng, W. H. Wu, C. W. Yeh, C. C. Lin, H. J. Tsai, H. C. Chang, J. H. Chuang, Y. S. Shan and W. T. Chang, Oncotarget, 2018, 9, 18949–18969 CrossRef PubMed.
- M. Nitzahn and G. S. Lipshutz, Mol. Genet. Metab., 2020, 131(3), 289–298 CrossRef CAS PubMed.
- M. Celiktas, I. Tanaka, S. C. Tripathi, J. F. Fahrmann, C. Aguilar-Bonavides, P. Villalobos, O. Delgado, D. Dhillon, J. B. Dennison, E. J. Ostrin, H. Wang, C. Behrens, K. A. Do, A. F. Gazdar, S. M. Hanash and A. Taguchi, J. Natl. Cancer Inst., 2017, 109(3), 231 CrossRef PubMed.
- X. Hu, Y. Meng, L. Xu, L. Qiu, M. Wei, D. Su, X. Qi, Z. Wang, S. Yang, C. Liu and J. Han, Cell Death Dis., 2019, 10, 104 CrossRef PubMed.
- H. Qi, S. Liu, C. Guo, J. Wang, F. T. Greenaway and M. Z. Sun, Oncol. Lett., 2015, 10, 1947–1952 CrossRef CAS PubMed.
- J. Chen, Q. Wang, F. Q. Yin, W. Zhang, L. H. Yan and L. Li, Am. J. Transl. Res., 2015, 7, 4141–4154 Search PubMed.
- P. Alberto, B. Mermillod, R. Joss, J. P. Obrecht, G. Martz, S. Kaplan and F. Cavalli, Eur. J. Cancer Clin. Oncol., 1986, 22(6), 701–708 CrossRef CAS PubMed.
- K. Johnson-Arbor and R. Dubey, Doxorubicin. StatPearls Publishing. NCBI Bookshelf, accessed on 25/09/2024, https://www.ncbi.nlm.nih.gov/books/NBK459232/#:~:text=Doxorubicin.
- G. Momekov, Y. Lugones, P. Loren and L. A. Salazar, Biomolecules, 2022, 12, 1365 CrossRef PubMed.
- M. H. Lawson, N. M. Cummings, D. M. Rassl, R. Russel, J. D. Brenton, R. C. Rintoul and G. Murphy, Cancer Res, 2011, 71(14), 4877–4887 CrossRef CAS PubMed.
- C. Christowitz, T. Davis, A. Isaacs, G. van Niekerk, S. Hattingh and A. M. Engelbrecht, BMC Cancer, 2019, 19(1), 757 CrossRef PubMed.
- J. Cox and S. Weinman, Hepat Oncol, 2016, 3(1), 57–59 CrossRef PubMed.
- A. Alpsoy, S. Yasa and U. Gündüz, Biomed. Pharmacother, 2014, 68(3), 351–355 CrossRef CAS PubMed.
- P. C. Ikwegbue, P. Masamba, B. E. Oyinloye and A. P. Kappo, Pharmaceuticals, 2018, 11(1), 2 CrossRef PubMed.
- H. Ajalyakeen, M. Almohareb and M. Al-Assaf, Dent. Med. Probl., 2020, 57(3), 227–231 CrossRef PubMed.
- L. F. Terra, R. A. M. Wailemann, A. F. D. Santos, V. M. Gomes, R. P. Silva, A. Laporte, F. C. Meotti, W. R. Terra, G. Palmisano, S. Lortz and L. Labriola, Free Radic. Biol. Med., 2019, 134, 394–405 CrossRef CAS PubMed.
- P. Sukumaran, V. N. Da Conceicao, Y. Sun, N. Ahamad, L. R. Saraiva, S. Selvaraj and B. B. Singh, Cells, 2021, 10(8), 2125 CrossRef CAS PubMed.
- A. M. K. Choi and J. Alam, Am. J. Respir. Cell Mol. Biol., 1996, 15(1), 9–19 CrossRef CAS PubMed.
- Y. Matsuo, K. Irie, H. Kiyonari, H. Okuyama, H. Nakamura, A. Son, D. A. Lopez-Ramos, H. Tian, S. I. Oka, K. Okawa, S. Kizaka-Kondoh, H. Masutani and J. Yodoi, et al. , Antioxid. Redox Signal., 2013, 18(11), 1263–1272 CrossRef CAS PubMed.
- C. M. Krejsa, C. C. Franklin, C. C. White, J. A. Ledbetter, G. L. Schieven and T. J. Kavanagh, J. Biol. Chem., 2010, 285(21), 16116–16124 CrossRef CAS PubMed.
- J. Wang, B. Wang, H. Q. Ren and W. Chen, Biochem. Biophys. Res. Commun., 2019, 509(1), 241–248 CrossRef CAS PubMed.
- T. Heinemeyer, M. Stemmet, S. Bardien and A. Neethling, DNA Cell Biol., 2019, 38(1), 23–40 CrossRef CAS PubMed.
- P. Pinton, C. Giorgi, R. Siviero, E. Zecchini and R. Rizzuto, Oncogene, 2008, 27, 6407–6418 CrossRef CAS PubMed.
- C. Giorgi, F. Baldassari, A. Bononi, M. Bonora, E. De Marchi, S. Marchi, S. Missiroli, S. Patergnani, A. Rimessi, J. M. Suski, M. R. Wieckowski and P. Pinton, Cell Calcium, 2012, 52(1), 36–43 CrossRef CAS PubMed.
- P. Sukumaran, V. N. Da Conceicao, Y. Sun, N. Ahamad, L. R. Saraiva, S. Selvaraj and B. B. Singh, Cells, 2021, 10, 2125 CrossRef CAS PubMed.
- E. M. McElnea, B. Quill, N. G. Docherty, M. Irnaten, W. F. Siah, A. F. Clark, C. J. O’Brien and D. M. Wallace, Molecular Vision, 2011, 17, 1182–1191 CAS.
- D. Spano, C. Heck, P. De Antonellis, G. Christofori and M. Zollo, Semin. Cancer Biol., 2012, 22(3), 234–249 CrossRef CAS PubMed.
- F. Van Zijl, G. Krupitza and W. Mikulits, Mutat. Res. Rev. Mutat. Res., 2011, 728, 23–34 CrossRef CAS PubMed.
- N. Golob-Schwarzl, K. Bettermann, A. K. Mehta, S. M. Kessler, J. Unterluggauer, S. Krassnig, K. Kojima, X. Chen, Y. Hoshida, N. M. Bardeesy, H. Müller, V. Svendova, M. G. Schimek, C. Diwoky, A. Lipfert, V. Mahajan, C. Stumptner, A. Thüringer, L. F. Fröhlich, T. Stojakovic, K. P. R. Nilsson, T. Kolbe, T. Rülicke, T. M. Magin, P. Strnad, A. K. Kiemer, R. Moriggl and J. Haybaeck, Transl. Oncol., 2019, 12(2), 256–268 CrossRef PubMed.
- H. Song, Y. Xu, T. Xu, R. Fan, T. Jiang, M. Cao, L. Shi and J. Song, Biomed. Pharmacother., 2020, 126, 109941 CrossRef CAS PubMed.
- W. Wang, J. He, H. Lu, Q. Kong and S. Lin, Biosci. Rep, 2020, 40(7), 1–13 Search PubMed.
- P. Sharma, S. Alsharif, K. Bursch, S. Parvathaneni, D. G. Anastasakis, J. Chahine, A. Fallatah, K. Nicolas, S. Sharma, M. Hafner, B. Kallakury and B. M. Chung, Sci. Rep., 2019, 9(1), 14650 CrossRef PubMed.
- S. Alsharif, P. Sharma, K. Bursch, R. Milliken, V. Lam, A. Fallatah, T. Phan, M. Collins, P. Dohlman, S. Tiufekchiev, G. Nehmetallah, C. B. Raub and B. M. Chung, Cell Adh. Migr., 2021, 15(1), 1–17 CrossRef CAS PubMed.
- L. Xie, Y. Dang, J. Guo, X. Sun, T. Xie, L. Zhang, Z. Yan, H. Amin and X. Guo, Genes, 2019, 10(1), 36 CrossRef PubMed.
- H. S. Tan, W. H. Jiang, Y. He, D. S. Wang, Z. J. Wu, D. S. Wu, L. Gao, Y. Bao, J. Z. Shi, B. Liu, L. J. Ma and L. H. Wang, Oncotarget, 2017, 8(44), 76189–76203 CrossRef PubMed.
- T. Liu, H. Liu, P. Wang, Y. Hu, R. Yang, F. Liu, H. G. Kim, Z. Dong and K. Liu, Front. Cell Dev. Biol., 2020, 8, 603472 CrossRef PubMed.
- Z. Wang, M. Q. Yang, L. Lei, L. R. Fei, Y. W. Zheng, W. J. Huang, Z. H. Li, C. C. Liu and H. T. Xu, Cancer Manag. Res., 2019, 11, 7485–7497 CrossRef CAS PubMed.
- S. Szabo, K. L. Wögenstein, C. H. Österreicher, N. Guldiken, Y. Chen, C. Doler, G. Wiche, P. Boor, J. Haybaeck, P. Strnad and P. Fuchs, J. Hepatol., 2015, 62(6), 1357–1366 CrossRef CAS PubMed.
- M. Wanibuchi, S. Ohtaki, S. Ookawa, Y. Kataoka-Sasaki, M. Sasaki, S. Oka, Y. Kimura, Y. Akiyama, T. Mikami, N. Mikuni, J. D. Kocsis and O. Honmou, J. Neurol. Sci., 2018, 392, 117–121 CrossRef CAS PubMed.
- S. Ohtaki, M. Wanibuchi, Y. Kataoka-Sasaki, M. Sasaki, S. Oka, S. Noshiro, Y. Akiyama, T. Mikami, N. Mikuni, J. D. Kocsis and O. Honmou, J. Neurosurg., 2017, 126(2), 467–475 CAS.
- J. Fu, X. Wang and Q. Yue, Biochem. Biophys. Res. Commun., 2020, 529(4), 1086–1093 CrossRef CAS PubMed.
- D. Q. Li, L. Wang, F. Fei, Y. F. Hou, J. M. Luo, W. Chen, R. Zeng, J. Wu, J. S. Lu, G. H. Di, Z. L. Ou, Q. C. Xia, Z. Z. Shen and Z. M. Shao, Proteomics, 2006, 6(11), 3352–3368 CrossRef CAS PubMed.
- F. M. Vega and A. J. Ridley, FEBS Lett., 2008, 582(14), 2093–2101 CrossRef CAS PubMed.
- M. R. Clay and M. C. Halloran, Development, 2013, 140(15), 3198–3209 CrossRef CAS PubMed.
- L. Dong, F. Chen, Y. Fan and J. Long, Am. J. Transl. Res., 2020, 12(1), 269–280 CAS.
- R. B. Haga and A. J. Ridley, Small GTPases, 2016, 7(4), 207–221 CrossRef CAS PubMed.
- J. Zhong, C. Liu, Y. J. Chen, Q. H. Zhang, J. Yang, X. Kang, S. R. Chen, G. B. Wen, X. Y. Zu and R. X. Cao, J. Transl. Med., 2016, 14, 80 CrossRef PubMed.
- S. Miao, T. Qiu, Y. Zhao, H. Wang, X. Sun, Y. Y. Wang, Y. Xuan, Y. Qin and W. Jiao, Thorac. Cancer, 2018, 9(9), 1136–1144 CrossRef CAS PubMed.
- Y. Fukuma, H. Matsui, H. Koike, Y. Sekine, I. Shechter, N. Ohtake, S. Nakata, K. Ito and K. Suzuki, Prostate Cancer Prostatic Dis., 2012, 15(4), 339–345 CrossRef CAS PubMed.
- N. T. Ha and C. H. Lee, Cells, 2020, 9(11), 2352 CrossRef PubMed.
- Y. F. Yang, Y. C. Chang, Y. H. Jan, C. J. Yang, M. S. Huang and M. Hsiao, Oncogenesis, 2020, 9(8), 78 CrossRef PubMed.
- Y. Song, X. Ma, M. Zhang, M. Wang, G. Wang, Y. Ye and W. Xia, Front. Cell Dev. Biol., 2020, 8, 1–12 CrossRef PubMed.
- C. Liu, S. Liu, L. Wang, Y. Wang, Y. Li and Y. Cui, Hum. Exp. Toxicol., 2019, 38(8), 927–937 CrossRef CAS PubMed.
- P. Aggarwal and N. S. Bhavesh, Nucleic Acids Res., 2021, 49(10), 5943–5955 CrossRef CAS PubMed.
- J. Yu, A. Navickas, H. Asgharian, B. Culbertson, L. Fish, K. Garcia, J. P. Olegario, M. Dermit, M. Dodel, B. Hänisch, Y. Luo, E. M. Weinberg, R. Dienstmann, R. S. Warren, F. K. Mardakheh and H. Goodarzi, Cancer Discov., 2020, 10(9), 1410–1423 CrossRef CAS PubMed.
- C. Askeland, E. Wik, K. Finne, E. Birkeland, J. B. Arnes, K. Collett, G. Knutsvik, K. Krüger, B. Davidsen, T. Aas, G. E. Eide, I. M. Stefansson, W. D. Foulkes and L. A. Akslen, Sci. Rep., 2020, 10(1), 2914 CrossRef CAS PubMed.
- P. Friedl and K. Wolf, Nat. Rev. Cancer, 2003, 3(5), 362–374 CrossRef CAS PubMed.
- E. Sahai, Curr. Opin. Genet. Dev., 2005, 15(1), 87–96 CrossRef CAS PubMed.
Footnote |
| † Electronic supplementary information (ESI) available. See DOI: https://doi.org/10.1039/d4tb01631a |
| This journal is © The Royal Society of Chemistry 2024 |