
 Open Access Article
 This Open Access Article is licensed under a
 Creative Commons Attribution 3.0 Unported Licence
Silica nanoparticle conjugation with gallic acid towards enhanced free radical scavenging capacity and activity on osteosarcoma cells in vitro†
Mariam
Hohagen
a,
Nuno
Saraiva
b,
Hanspeter
Kählig
c,
Christopher
Gerner
d,
Giorgia
Del Favero
 *e and
Freddy
Kleitz
*a
*e and
Freddy
Kleitz
*a
aDepartment of Functional Materials and Catalysis, Faculty of Chemistry, University of Vienna, Währinger Straße 42, 1090 Vienna, Austria. E-mail: freddy.kleitz@univie.ac.at
bCBIOS—Universidade Lusófona's Research Center for Biosciences & Health Technologies, Campo Grande 376, 1749-024 Lisbon, Portugal
cDepartment of Organic Chemistry, Faculty of Chemistry, University of Vienna, Währinger Straße 38, 1090 Vienna, Austria
dDepartment of Analytical Chemistry, Faculty of Chemistry, University of Vienna, Währinger Straße 38–40, 1090 Vienna, Austria
eDepartment of Food Chemistry and Toxicology, Faculty of Chemistry, University of Vienna, Währinger Straße 38–40, 1090 Vienna, Austria. E-mail: giorgia.del.favero@univie.ac.at
First published on 16th May 2024
Abstract
Gallic acid (GA), derived from land plants, possesses diverse physiological benefits, including anti-inflammatory and anticancer effects, making it valuable for biomedical applications. In this study, GA was used to modify the surface of dendritic mesoporous silica nanoparticles (DMSNs) via carbamate (DMSN-NCO-GA) or amide (DMSN-NH-GA) bonds, using a post-grafting technique. To explore GA-conjugated materials' potential in modulating cancer cell redox status, three variants of osteosarcoma cells (U2-OS) were used. These variants comprised the wild-type cells (NEO), the cells overexpressing the wild-type human Golgi anti-apoptotic protein (hGAAP), and the null mutant of hGAAP (Ct-mut), as this protein was previously demonstrated to play a role in intracellular reactive oxygen species (ROS) accumulation and cell migration. In the absence of external ROS triggers, non-modified DMSNs increased intracellular ROS in Ct-mut and NEO cells, while GA-conjugated materials, particularly DMSN-NH-GA, significantly reduced ROS levels, especially pronounced with higher GA concentrations and notably in hGAAP cells with inherently higher ROS levels. Additionaly, NH-GA conjugates were less cytotoxic, more effective in reducing cell migration, and had higher ROS buffering capacity compared to DMSN-NCO-GA materials. However, in the presence of the external stressor tert-butyl-hydroperoxide (TBHP), NCO-GA conjugates showed more efficient reduction of intracellular ROS. These findings suggest that varying chemical decoration strategies of nanomaterials, along with the accessibility of functional groups to the cellular environment, significantly influence the biological response in osteosarcoma cells. Highlighting this, GA-conjugation is a promising method for implementing antioxidant properties and inhibiting cancer cell migration, warranting further research in anticancer treatment and drug development.
Introduction
Gallic acid (3,4,5-trihydroxybenzoic acid) (GA) is a trihydroxybenzoic acid and belongs to the family of phenolic acids. GA occurs naturally in tea leaves, oak bark, gallnuts, sumac, and other plants.1 Phenolic compounds are made up of a repeated basic chemical structure of C6-C1 (hydroxybenzoic acids) or C6-C3 (hydroxycinnamic acids), consisting of a phenol ring and a carboxyl substituent. For various phytochemicals, such as tannins, coumarins, benzoquinones, and naphthoquinones, phenolic acids are used as precursors.2,3 Besides the use of GA and its ester derivates in the food industry as preservatives and flavouring agents, GA is used as a phytochemical due to its biological and pharmacological activities, with emphasis on its antioxidant, antimicrobial, anti-inflammatory, anticancer, cardioprotective, gastroprotective, and neuroprotective effects.4,5 GA exhibits a dual nature with both prooxidant and antioxidant properties. This means that it can act as both an oxidizing agent, generating reactive oxygen species (ROS), and as an antioxidant, scavenging free radicals and reducing oxidative stress.6 In line with this Janus-faced behaviour, GA was previously described to enhance or inhibit tumour development.The prooxidant properties of GA involve its ability to trigger ROS production, such as superoxide radicals and hydroxyl radicals, within cancer cells. These radical species can induce oxidative damage to cellular components, including DNA, proteins, and lipids, ultimately leading to cell death. These mechanisms can contribute to the cytotoxic effects of GA on cancer cells.5 On the other hand, GA also possesses antioxidant properties, which are sustained by its ability to neutralize free radicals and protect cells from oxidative damage.7 Along these lines, GA was described to enhances the activity of antioxidant enzymes like superoxide dismutase (SOD), catalase (CAT), glutathione reductase (GR), and glutathione peroxidase (GPx). These enzymes play crucial roles in detoxifying ROS and maintaining cellular redox balance, thereby protecting cells from oxidative stress.8–10 As the molecular effects related to ROS disbalance are deeply intertwined, it was also described that oxidative stress can lead to DNA damage, inflammation, and genetic instability, that ultimately promote the growth and spread of cancer cells.11 In this case, GA's ability to counteract oxidative stress by scavenging free radicals underpins its activity as inhibitor in cancer progression.6,8,12 Particularly for osteosarcoma cells, Ching-Lung and coworkers found that GA treatment of U2-OS cells suppressed cell migration due to the down-regulation of PKC, mitogen-activated protein kinase (MAPK), and PI3K/AKT, resulting in inhibition of MMP-2 and MMP-9 expressions.12
In view of the multifaced activity, development of GA-conjugated materials is a vastly studied field. The combination of the redox, prooxidative as well as the radical scavenging potential of GA, coupled with various nano-formulations, opens up to numerous potential applications.13–16 For instance, GA has been utilized to enhance the performance of Pt nanoparticle-functionalized graphene electrodes.15 Additionally, the creation of GA layers on γ-AlOOH nanoparticle-based surfaces has shown potential in providing antioxidant properties and protecting cellular membranes.13 Furthermore, Shen and colleagues investigated how oxidized dextran affects the stability of GA-modified chitosan–sodium caseinate nanoparticles, offering insights into their potential applications in controlled drug delivery or biomedical devices.14 Mesoporous silica nanoparticles (MSNs) show unique physicochemical properties such as high specific surface area and pore volume, hydrolytic stability, slow degradability, and biocompatibility.17–26 The combination of silica-based systems and GA has been promising for biomedical applications.27–32 Dong and coworkers studied the use of GA for active packaging composite films by incorporating different GA-SiO2 nanoparticles into chitosan. They showed that the incorporation of the modified silica nanoparticles with the mean sizes of 112.7 ± 0.55 and 408.7 ± 3.20 nm significantly increased the antioxidant activity of the composite films.33 Vico et al. studied the antimicrobial activity of 7-nm diameter fumed silica particles grafted with GA when incubated with Paenibacillus larvae.28 In this context, it was described that the material acted as an improved antimicrobial agent compared to the free GA. However, studies regarding the various biomedical applications of GA are mainly carried out using GA as a guest within a nanocarrier,27,30,32,34,35 and rarely an actual GA-silica nanoparticle conjugate is investigated.
In relation to oxidative stress management, cancer cells are often characterized by ROS imbalance.36 For example, the human Golgi anti-apoptotic protein (hGAAP) is overexpressed in several cancers and high levels of this protein support tumour resistance against pro-apoptotic stress while inducing mitochondrial metabolism and O2 consumption, as well as reactive oxygen species (ROS) accumulation.37–39 Additionally, hGAAP overexpression stimulates cancer cell migration and invasion by increasing the turnover of focal adhesions due to the activation of store-operated Ca2+ entry and by promoting the accumulation of H2O2 and activated MMP-2.40,41 In agreement, in vivo analysis showed that blood circulating U2-OS cells overexpressing hGAAP in mice have a higher ability to adhere and migrate into the lung tissue.41 Here, the previously characterized osteosarcoma U2-OS cells overexpressing wild-type hGAAP, a null mutant of hGAAP (C-terminal mutant – Ct-mut) and the U2-OS control cell line (NEO),41 were used as models to test the effects of the GA-conjugated materials on ROS-dependent cellular events relevant for cancer progression. Cells overexpressing wild-type hGAAP are more resistant to apoptosis, more invasive and show higher intracellular levels of ROS in comparison to hGAAP Ct-mut or control cells (NEO). In virtue of the difference in the ROS management capacity, these cell models were selected for the bioactivity profiling of the two different series of GA-modified mesoporous silica nanoparticles (MSNs) created in this study. The data collected in this work describe the contribution of GA-decoration in the activity profiling of the nanocarriers and highlight how the linking chemistry can contribute to generate tailored functional nanomaterials for biological applications.
Materials
Cetyltrimethylammonium chloride (CTAC, 25 wt% in H2O), tetraethylorthosilicate (TEOS, 99%), fluorescein isothiocyanate (FITC, >90%), (3-aminopropyl)triethoxysilane (APTES) (98%), (3-isocyanatopropyl)triethoxysilane (95%), potassium tert-butoxide, 2-(1H-benzotriazol-1-yl)-1,1,3,3-tetramethyluronium-hexafluorophosphate (HBTU) (99%), 2,2-diphenyl-1-picrylhydrazyl (DPPH), tert-butyl-hydroperoxide (70 wt% in H2O) (TBHP), MeOH (ultra-pure, H2O < 0.01%, > 99.5% GC) as well as, phosphate buffered saline, 10× conc. (PBS), were purchased from Sigma Aldrich. L-Lysine, (98%), gallic acid (GA) (98%), extra dry dimethylformamide (99.8%) (DMF), diisopropylethylamine (DIEA) (99%), and toluene (99%) were obtained from Alfa Aesar. p-Xylene (99%), ethanol (EtOH) (≥99.8%), and toluene (99.85%), extra dry over molecular sieve, were acquired from Fisher Scientific. 2′,7′-dichlorfluorescein-diacetat (DCF-DA) was obtained from Biomol GmbH. Hydrochloric acid (37%) was purchased from VWR Chemicals. The cell culture and cytotoxicity experiment equipment, were purchased from GIBCO Invitrogen (Karlsruhe, Germany), Lonza Group Ltd (Basel, Switzerland), Sigma-Aldrich Chemie GmbH (Munich, Germany), and Sarstedt AG&Co (Nuembrecht, Germany). ROTI®Cell DMEM low glucose was obtained from Carl Roth GmbH + Co. KG (Karlsruhe, Germany).Synthesis of mesoporous silica nanoparticles (MSNs)
The MSNs were synthesized as reported by Hohagen et al.42 Briefly, CTAC (8 mL), and L-lysine (0.17 g) were dissolved under continuous stirring at 150 rpm (using a Heidolph stirring plate) in H2O (70 mL) at 60 °C. After complete dissolution of L-lysine, a mixture of p-xylene (32 mL) and TEOS (8 mL) was added at a dropping rate of 76 mL h−1. The reaction mixture was stirred for 19 h at 60 °C. To isolate the particles, the organic phase was removed, the material separated from the aqueous phase, and collected by centrifugation at 10![[thin space (1/6-em)]](https://www.rsc.org/images/entities/char_2009.gif) 000 rpm for 20 min and washed twice with EtOH. The resulting dendritic mesoporous silica nanoparticles (DMSNs) were dried at room temperature (RT) overnight.
000 rpm for 20 min and washed twice with EtOH. The resulting dendritic mesoporous silica nanoparticles (DMSNs) were dried at room temperature (RT) overnight.
DMSN-NCO-GA
Firstly, the GA-silane linker was synthesized: GA (13 mmol, 2.16 eq.) was dissolved in DMF (80 mL), and then potassium tert-butoxide (6 mmol, 1 eq.) was added, and the mixture was stirred until complete dissolution. Subsequently, (3-isocyanatopropyl)triethoxysilane (6 mmol, 1 eq.) was added and the reaction mixture was stirred for 2 h at 80 °C. After suspending the material (1 g) in dry toluene (80 mL) for 2 h, the GA-silane linker reaction mixture was added to the particle suspension and stirred at 80 °C overnight. The light brown particles were recovered by centrifugation at 10000 rpm for 20 min. The particles were washed twice with toluene and once with EtOH (technical) and the template was removed by solvent extraction through sonification in an EtOH (technical)/HCl mixture. After extraction, the material was dried at 40 °C overnight. The resulting particles were named DMSN-NCO-GA.
DMSN-NH-GA
To synthesize the GA-silane linker, GA (7 mmol, 1 eq.) was first dissolved in DMSO (50 mL). HBTU (3.5 mmol, 0.5 eq.) was added and the reaction mixture was stirred at RT for 20 min. Subsequently, DIEA (14 mmol, 2 eq.) and shortly after APTES (3.7 mmol, 0.5 eq.) were added and stirred at RT overnight. The material (1 g) was stirred for 3 h in toluene dry (80 mL) before the GA-silane linker reaction mixture was added to the particle suspension and stirred at 60 °C overnight. The brown particles were recovered by centrifugation at 10000 rpm for 20 min. The particles were washed twice with toluene and once with EtOH (technical) and the template was removed by solvent extraction through sonification in an EtOH (technical)/HCl mixture. After extraction, the material was dried at 40 °C overnight. The resulting particles were named DMSN-NH-GA.
Labelling of DMSNs
Initially, the APTES-FITC ligand was prepared as follows: FITC (0.03 mmol, 4 eq.) was dissolved in 5 mL of ethanol (EtOH), followed by the addition of APTES (0.007 mmol, 1 eq.). This mixture was stirred for 24 h at RT in the dark. Subsequently, the APTES-FITC ligand stock solution (80 μL) was added to a particle suspension (0.4 g in 120 mL of dry toluene) and stirred overnight at 60 °C under light-protective conditions. Afterward, the material was isolated by centrifugation (20 min at 10000 rpm), and the supernatant was discarded. The product underwent three washings with EtOH (technical) and was then dried at 35 °C in air for 24 h. The resulting labeled materials were named DMSN-FITC, DMSN-NCO-GA-FITC, and DMSN-NH-GA-FITC.
Colloidal stability tests
Colloidal stability of the GA-conjugated materials was tested at 37 °C for 7 days. 7 mg of the materials were suspended in 10 mL of PBS buffer solution. The samples were analysed by dynamic light scattering (DLS) using a Malvern DTS Nano Zetasizer instrument. The samples were kept in the cuvettes in static conditions, with no further mixing or vortex between each measurement throughout the entire test.Materials characterization
N2 physisorption isotherms were performed at −196 °C (77 K) using an Autosorb-iQ3 sorption analyser (Anton Paar, Boynton Beach, USA). Extracted DMSNs and GA-modified DMSNs were outgassed before the analysis overnight at 80 °C. The Brunauer–Emmett–Teller (BET) method was used in the relative pressure range 0.05–0.2 P/P0 to calculate the specific surface area (SBET). The total pore volume was determined at P/P0 = 0.95. The pore size distributions (PSD) were calculated using the non-local density functional theory (NLDFT, metastable adsorption branch) method considering a model of silica with cylindrical pores.Simultaneous thermogravimetric analysis and differential thermal analysis (TGA-DTA) measurements were carried out using a Netzsch STA-449 F3 Jupiter instrument. The measurements were performed under airflow (20 mL min−1) as carrier gas with a heating rate of 10 °C min−1. To exclude any contribution of physiosorbed water, the mass loss in percentage was given in the temperature range 150–700 °C.
Transmission electron microscopy (TEM) images were performed with a Philips CM200 microscope at an accelerating voltage of 200 keV using suspensions of DMSNs in EtOH deposited on a carbon-coated copper grid.
Dynamic light scattering (DLS) measurements were performed with a Malvern DTS Nano Zetasizer (equilibrium time 3 min, 3 measurements for each sample). The GA-conjugated materials were dispersed in nanopure H2O with a concentration of 0.7 mg mL−1, sonicated, and vortexed before the analysis. The zeta-potential measurements of the DMSNs and GA-modified particles were performed with the same instrument. Calibration using a standard solution with a zeta-potential of −42 ± 6 mV was performed before zeta-potential measurements.
Solid-state magic angle spinning nuclear magnetic resonance (MAS NMR) spectroscopy was carried out using a Bruker Avance NEO 500 wide bore system (Bruker BioSpin, Ettlingen, Germany). A 4 mm triple resonance magic angle spinning (MAS) probe was used. Cross-polarization (CP) was employed using a ramped contact pulse thereby sweeping the proton radio frequency field from 50 to 100%. For 29Si, the resonance frequency was 99.38 MHz, the MAS spinning speed was 8 kHz, and the CP contact time was 5 ms. The resonance frequency for 13C NMR was 125.78 MHz, the MAS rotor spinning was set to 14 kHz, and the CP contact time to 3 ms. During acquisition, 1H was high-power decoupled using SPINAL with 64-phase permutations. The chemical shifts are reported in ppm and are referenced externally for 13C to adamantane by setting the low field signal to 38.48 ppm, and for 29Si to sodium trimethylsilylpropane sulfonate (known as DSS) by setting the signal to 0 ppm.
Attenuated total reflectance Fourier-transformed infrared (ATR-FTIR) spectra were measured using a Bruker Vertex 70 FTIR spectrometer equipped with Specac Golden Gate ATR accessory. The spectra were obtained from the acquisition of 72 scans at 4 cm−1 resolution in the range from 4000 to 500 cm−1. Before each measurement, a background spectrum gathered from the acquisition of 72 scans at 4 cm−1 resolution was collected.
Determination of antioxidant activity – DPPH assay
Firstly, stock solutions of the GA-conjugated materials, DMSN-NCO-GA (20 mM), DMSN-NH-GA (20 mM), and non-modified DMSNs, and free GA (20 mM) were prepared in methanol (MeOH) (ultra-pure, H2O < 0.01% >, 99.5% GC), and was further diluted to obtain concentrations of 15 mM, 10 mM, 5 mM, 1 mM and 0.5 mM. The stock suspensions (30 μL) in MeOH and 3 mL of methanolic solution of DPPH (11.6 × 10⁻⁵ M) were mixed inside 1 cm quartz cuvettes. Absorbance measurements were started immediately and the decrease in absorbance at 515 nm was determined over a period of 60 min. All determinations were performed in triplicates.Cell cultures
Human osteosarcoma U2-OS cell lines (hGAAP, hGAAP Ct-mut and NEO) were grown in ROTI®Cell DMEM low glucose (CELLPURE® ready-to-use, sterile, without glutamine, with pyruvate).41 The medium was supplemented with 10% fetal bovine serum (FBS) +1% penicillin–streptomycin (Pen/Strep) and 2% L-glutamine. Geneticin (0.5 mg mL−1) was added to cultures every 7 to 9 passages to assure maintenance of the constructs. The cells were incubated in a humidified incubator with 5% CO2 at 37 °C.Standard operating procedure (SOP)
Stock solutions of the GA-conjugated materials, DMSN-NCO-GA (20 mM) and DMSN-NH-GA (20 mM), as well as non-modified DMSNs and free GA (20 mM), were prepared in sterile H2O. These stock solutions were uniformly resuspended in an ultrasonic bath for 15 min followed by vortex mixing for 30 seconds. The suspensions were further diluted with cell culture medium and vortexed for 30 seconds. In the final step, 100 μL of each solution was added to the cells, followed by a 1:1 dilution with the cell culture medium supplemented with 20% (v/v) fetal calf serum, 2% (v/v) penicillin/streptomycin, and 4% (v/v) L-glutamine to achieve the desired incubation concentrations and a consistent composition of cell culture supplements. Treatments were performed in technical quadruplicates obtained from at least three independent cell preparations (biological replicates). The cells were then incubated for 24 h in an incubator at 37 °C with 5% CO2.
Cell viability
Flat-bottom 96-well plates were seeded with hGAAP (9800 cells per well), Ct-mut (9800 cells per well), and NEO (10600 cells per well), followed by a 24-hour exposure to the materials. Cell viability was determined using the CellTiter-Blue® assay (CTB). Before each experiment, the CellTiter-Blue® reagent was diluted at a 1:10 ratio in DMEM (phenol red-free). After the incubation period, 120 μL of CTB solution was added to each well, followed by incubation at 37 °C with 5% CO2 for 2 h. Subsequently, 50 μL of supernatant from each well was transferred to corresponding wells of a black 96-well plate. Fluorescence intensity was measured at excitation/emission wavelengths of 560/590 nm using a Cytation Imaging Multi-Mode Reader (BioTek, Bad Friedrichshall, Germany). The ratio of signal from treated cells to that of control cells (T/C) was calculated. Data are presented as mean values ± standard error from at least three independent CTB assays conducted in technical quadruplicates. Statistical analysis was performed using OriginPro 9.55 (OriginLab) applying one-way ANOVA and Fisher LSD (significant difference among the treatment groups *p < 0.05, **p < 0.01, ***p < 0.001).
MSN uptake experiments
U2-OS cell lines were seeded in 8-well ibiTreat slides at a density of 34000 cells per well (hGAAP, Ct-mut) and 37000 cells per well (NEO). Following seeding, the cells were treated with fluorescently labelled GA-conjugated materials and non-modified DMSNs at concentrations corresponding to 5 and 10 μM GA, which translates into particle concentrations of 53.15 μg mL−1 and 106.3 μg mL−1, respectively. After 24 h incubation, the cells were washed and treated with Cell Mask Deep Red plasma membrane stain (diluted 1:2000) for 15 min. Subsequently, the cells were rinsed, and 200 μL of live cell imaging solution was added before sealing the culture vessels. Imaging was conducted using a Zeiss LSM710 laser scanning confocal microscope (ELYRA PS.1 system) equipped with a 63X/1.2 plan-apochromatic water immersion objective (Zeiss Microscopy GmbH, Germany) as previously described.43
Intracellular ROS measurement
Intracellular ROS production and scavenging activity was evaluated using a, 2′,7′-dichlorofluorescin diacetate (DCF-DA) as probe, as previously described.44–46 The U2-OS cell lines (hGAAP, NEO, and Ct-mut) were seeded in black 96-well microplates (clear bottom; 19000 cells per well) and incubated at 37 °C for 24 h. The cells were treated with the free GA, GA-conjugated materials with the concentrations of 5 and 10 μM and non-functionalized DMSNs with concentrations equivalent to 5 μM and 10 μM, namely 53.15 μg mL−1 and 106.3 μg mL−1 for 24 h. Subsequently, the cells were washed and incubated with DCF-DA solution (50 μM; 100 μL per well) for 15 min. After incubation, the cells were gently washed with live cell imaging solution, and a blank measurement was conducted. A screening of the ROS trigger tert-butyl-hydroperoxide (TBHP)47 was conducted using concentrations of 0.002, 0.1, 0.2, and 0.5 mM. Among these, a concentration of 0.2 was selected for further analysis. Accordingly, TBHP (0.2 mM) was added into the respective wells, and the cells were analysed using an imaging Multi-Mode Reader (BioTek, Bad Friedrichshall, Germany) at excitation and emission wavelengths of 485 nm and 530 nm (with the gain adjusted to the positive control and set to 80–95% for positive control). The measurements were carried out at time 0 and after 15 min. The data was represented as mean values ± the standard error of at least three independent assays made in technical triplicates. The significance was determined via one-way ANOVA with Fisher LSD (significant difference among the treatment groups *p < 0.05, **p < 0.01, ***p < 0.001).
Migration assay
Flat bottom 24 well plates (Sarstedt REF 83.3922) were seeded with hGAAP, Ct-mut, and NEO to guarantee 95% cell confluence after 24 h. Gaps were generated using a 200 μL pipette tip. After incubation with the nanomaterials or free GA controls, images were taken with Lionheart FX automated microscope using GEN5 Microplate Reader and Imager Software Version 3.05 for image acquisition both from BioTek Instruments Inc. (Vermont, USA) at time t = 0. After 24 h incubation at 37 °C and 5% CO2, a second set of images were taken at the same coordinates. To supplement the analysis, the migration speed was evaluated by calculating the velocity (μm h−1) of migration. This involved subtracting the initial gap distance at time-point (t = 0) from the final gap distance at time-point (t = 24 h), followed by division by the total duration of treatment48 in both untreated (control) and material-treated U2-OS cells. Quantification of the wound healing and speed was conducted with ImageJ-win64 software. The assay was performed as previously described in biological quadruplicates, using 4 optical fields evaluated, resulting in the quantification of at least 16 optical fields per condition.49–51 The significance was determined via one-way ANOVA with Fisher LSD (significant difference among the treatment groups *p < 0.05, **p < 0.01, ***p < 0.001).Results and discussion
Surface modification of dendritic mesoporous silica nanoparticles with gallic acid (DMSNs)
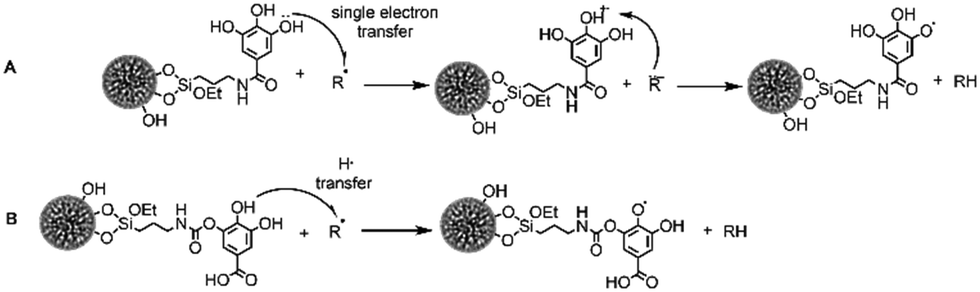
GA modification of DMSNs was achieved following two different grafting strategies as depicted in Fig. 1(A) and (B). In both modification methods, the GA-silane linker was synthesized first, and in a second step, the respective GA-ligands were added to the particle suspension to achieve GA-conjugation via silane coupling/condensation. For both approaches, no isolation or purification of the pure ligand was required. DMSN-NCO-GA was obtained via a nucleophilic addition reaction, followed by a proton shift, resulting in the formation of a carbamate bond (Fig. 1A). DMSN-NH-GA was synthesized by nucleophilic substitution reaction via carbonyl activation with the help of a coupling reagent (HBTU) creating an active ester, resulting in the formation of an amide bond after amine substitution (Fig. 1B). The percentage of organics grafted was identified by thermogravimetric analysis (TGA) (Table 1 and Fig. S1, ESI†). DMSNs were used as the carrier system, because of their high mass/yield per synthesis as well as their large pores and their well-controlled and uniform particle size distribution (Fig. 1C).42,43,52,53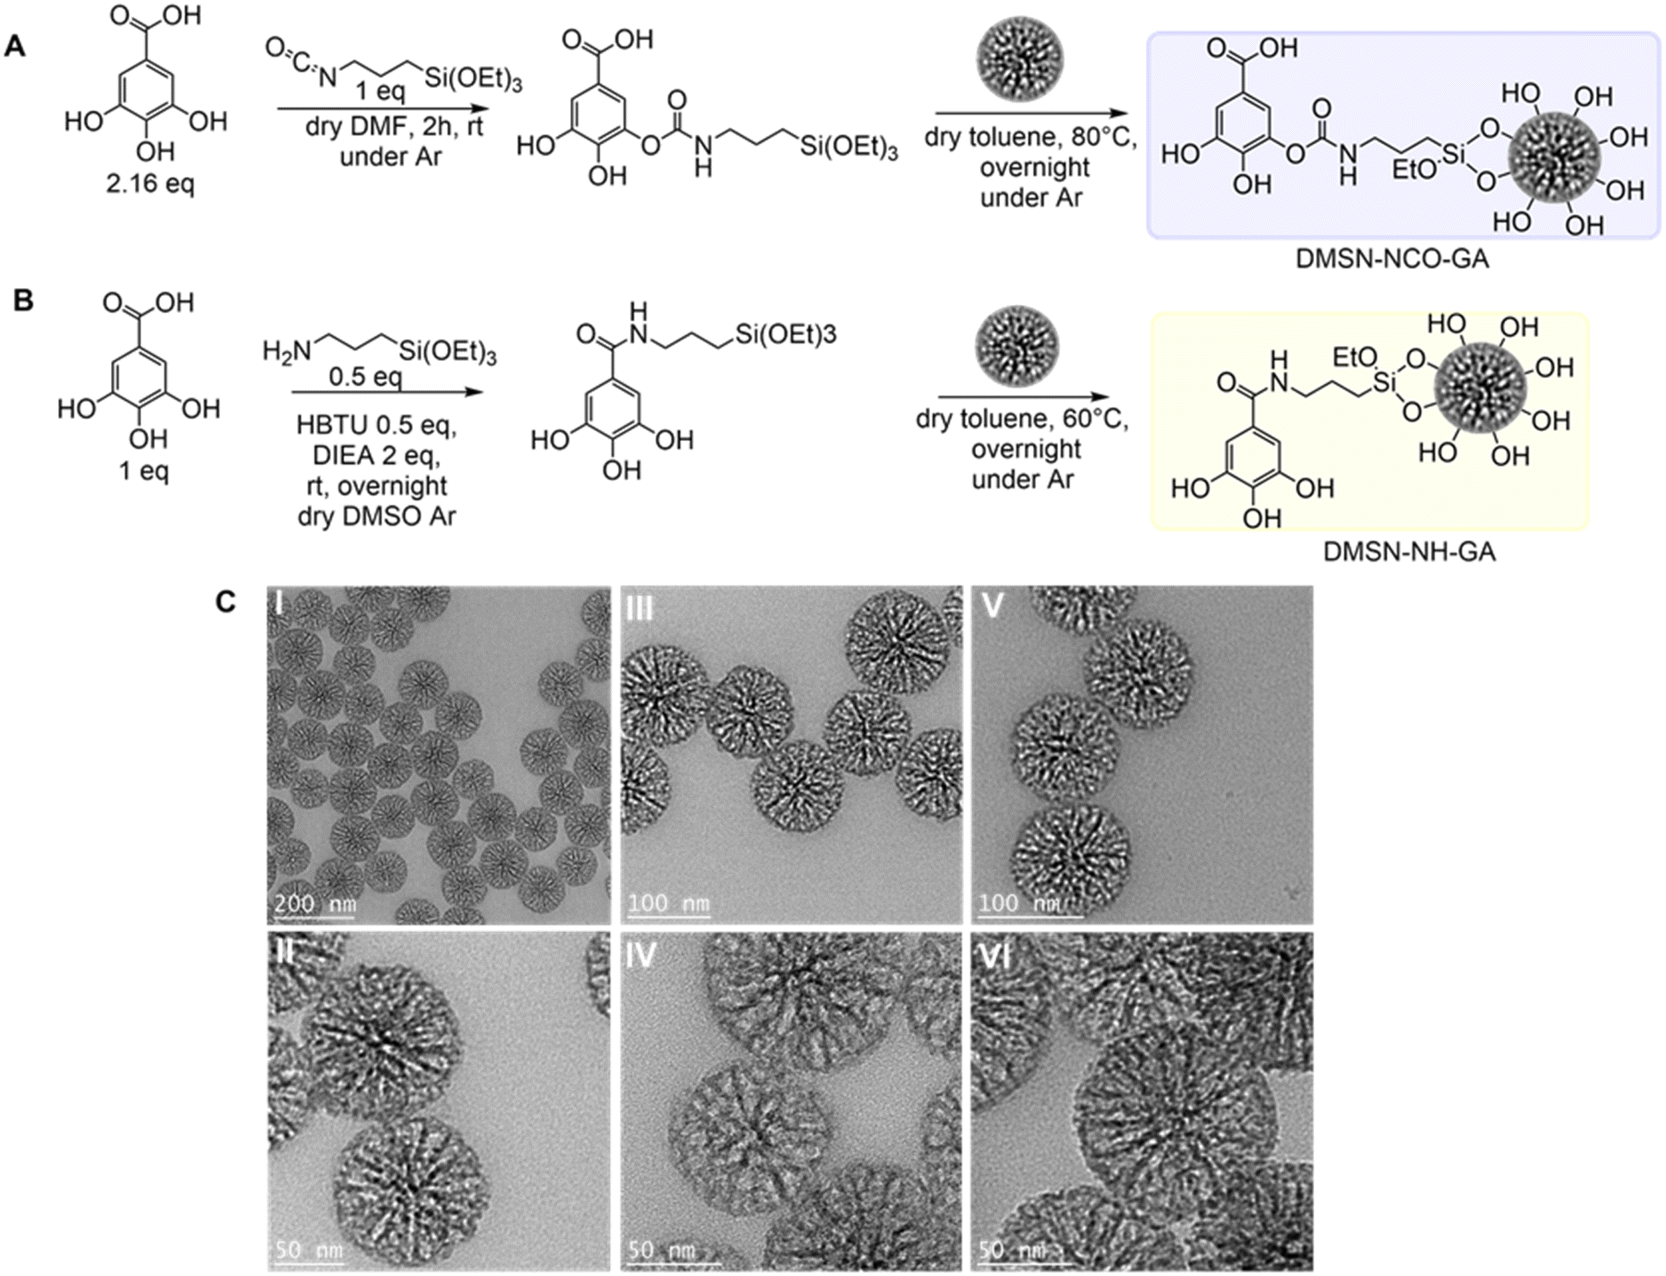 | ||
| Fig. 1 (A) and (B) Reaction schemes for the two different GA-conjugation methods. (C) TEM images of the non-functionalized native DMSNs (I) and (II) and DMSN-NCO-GA (III) and (IV), and DMSN-NH-GA (V) and (VI). | ||
| Material | DLSa | N2 physisorption datab | TGAc | ||||
|---|---|---|---|---|---|---|---|
| d [nm] | PDI | Zeta potential [mV] | NLDFT mode pore size [nm] | Surface area/SBET [m2 g−1] | Total pore volume/V [cm3 g−1] | Mass loss [%] | |
| a The particle size and zeta-potential were measured using DLS in nanopure water. b The specific surface area, SBET, pore volume (V), and pore size were obtained from N2 physisorption analysis (at −196 °C). c Mass loss values were calculated in the temperature range of 150–700 °C by TGA. | |||||||
| DMSN | 100 | 0.2 | −12.8 | 7.3–10 | 628 | 1.3 | |
| DMSN-NCO-GA | 125 | 0.2 | −15 | 7–9.0 | 345 | 0.7 | 21 |
| DMSN-NH-GA | 130 | 0.1 | −16 | 6.8–8.6 | 309 | 0.5 | 29 |
To assess the impact of the porosity, pore size, and specific surface area (SBET) through GA-conjugation, nitrogen physisorption measurements (at −196 °C) were carried out. SBET, total pore volume, and mean pore size values are summarized in Table 1 (see also Fig. S2, ESI†). Both materials show similar grafting yield, DMSN-NCO-GA (21 wt%) and DMSN-NH-GA (28 wt%), as well as similar reduction of SBET of about 50% (345 m2 g−1 and (309 m2 g−1) relative to the non-functionalized material (628 m2 g−1). The GA-conjugation strategy via carbamate bond formation led to a pore volume reduction of about 45% (0.7 cm3 g−1), whereas GA modification by amide bond formation resulted in a pore volume reduction of 60% (0.5 cm3 g−1) relative to the native material (1.3 cm3 g−1). Furthermore, in the hysteresis loop of the sorption isotherm, a partial delay in the desorption branch is observed, most likely caused by some pore-blocking effects. For the DMSN-NH-GA material, a more pronounced effect, e.g., cavitation54,55 was identified, compared to the DMSN-NCO-GA material.56 This behaviour could indicate a difference in the positioning of GA on the surface of the particles. Overall, although differences in the location of GA could affect porosity of the particles, there is still sufficient pore space to encapsulate a potential guest molecule, which is an essential factor for an applicable nanocarrier.
To confirm successful GA-conjugation, solid-state NMR spectroscopy was performed, as illustrated in Fig. 2. The 29Si CP/MAS NMR spectra reveal T2 and T3 signals for both GA-modified materials, indicating successful surface modification of the DMSNs with the GA-silane ligand. However, the occurrence of T0-species at −47 ppm showed the presence of non-covalently attached -GA-silane (Fig. 2), which was found to be strongly adsorbed, and not released even after extensive washing. The presence of a chemical moiety other than hydroxy groups or carboxylic group of DMSN-NCO-GA enabled the identification of the successful addition reaction via carbamate formation (155.7.2 ppm) using 13C CP/MAS NMR. The 13C CP/MAS spectrum of DMSN-NH-GA reveals the amide formation indicated by the signal at 172 ppm, being evidence for effective surface modification.
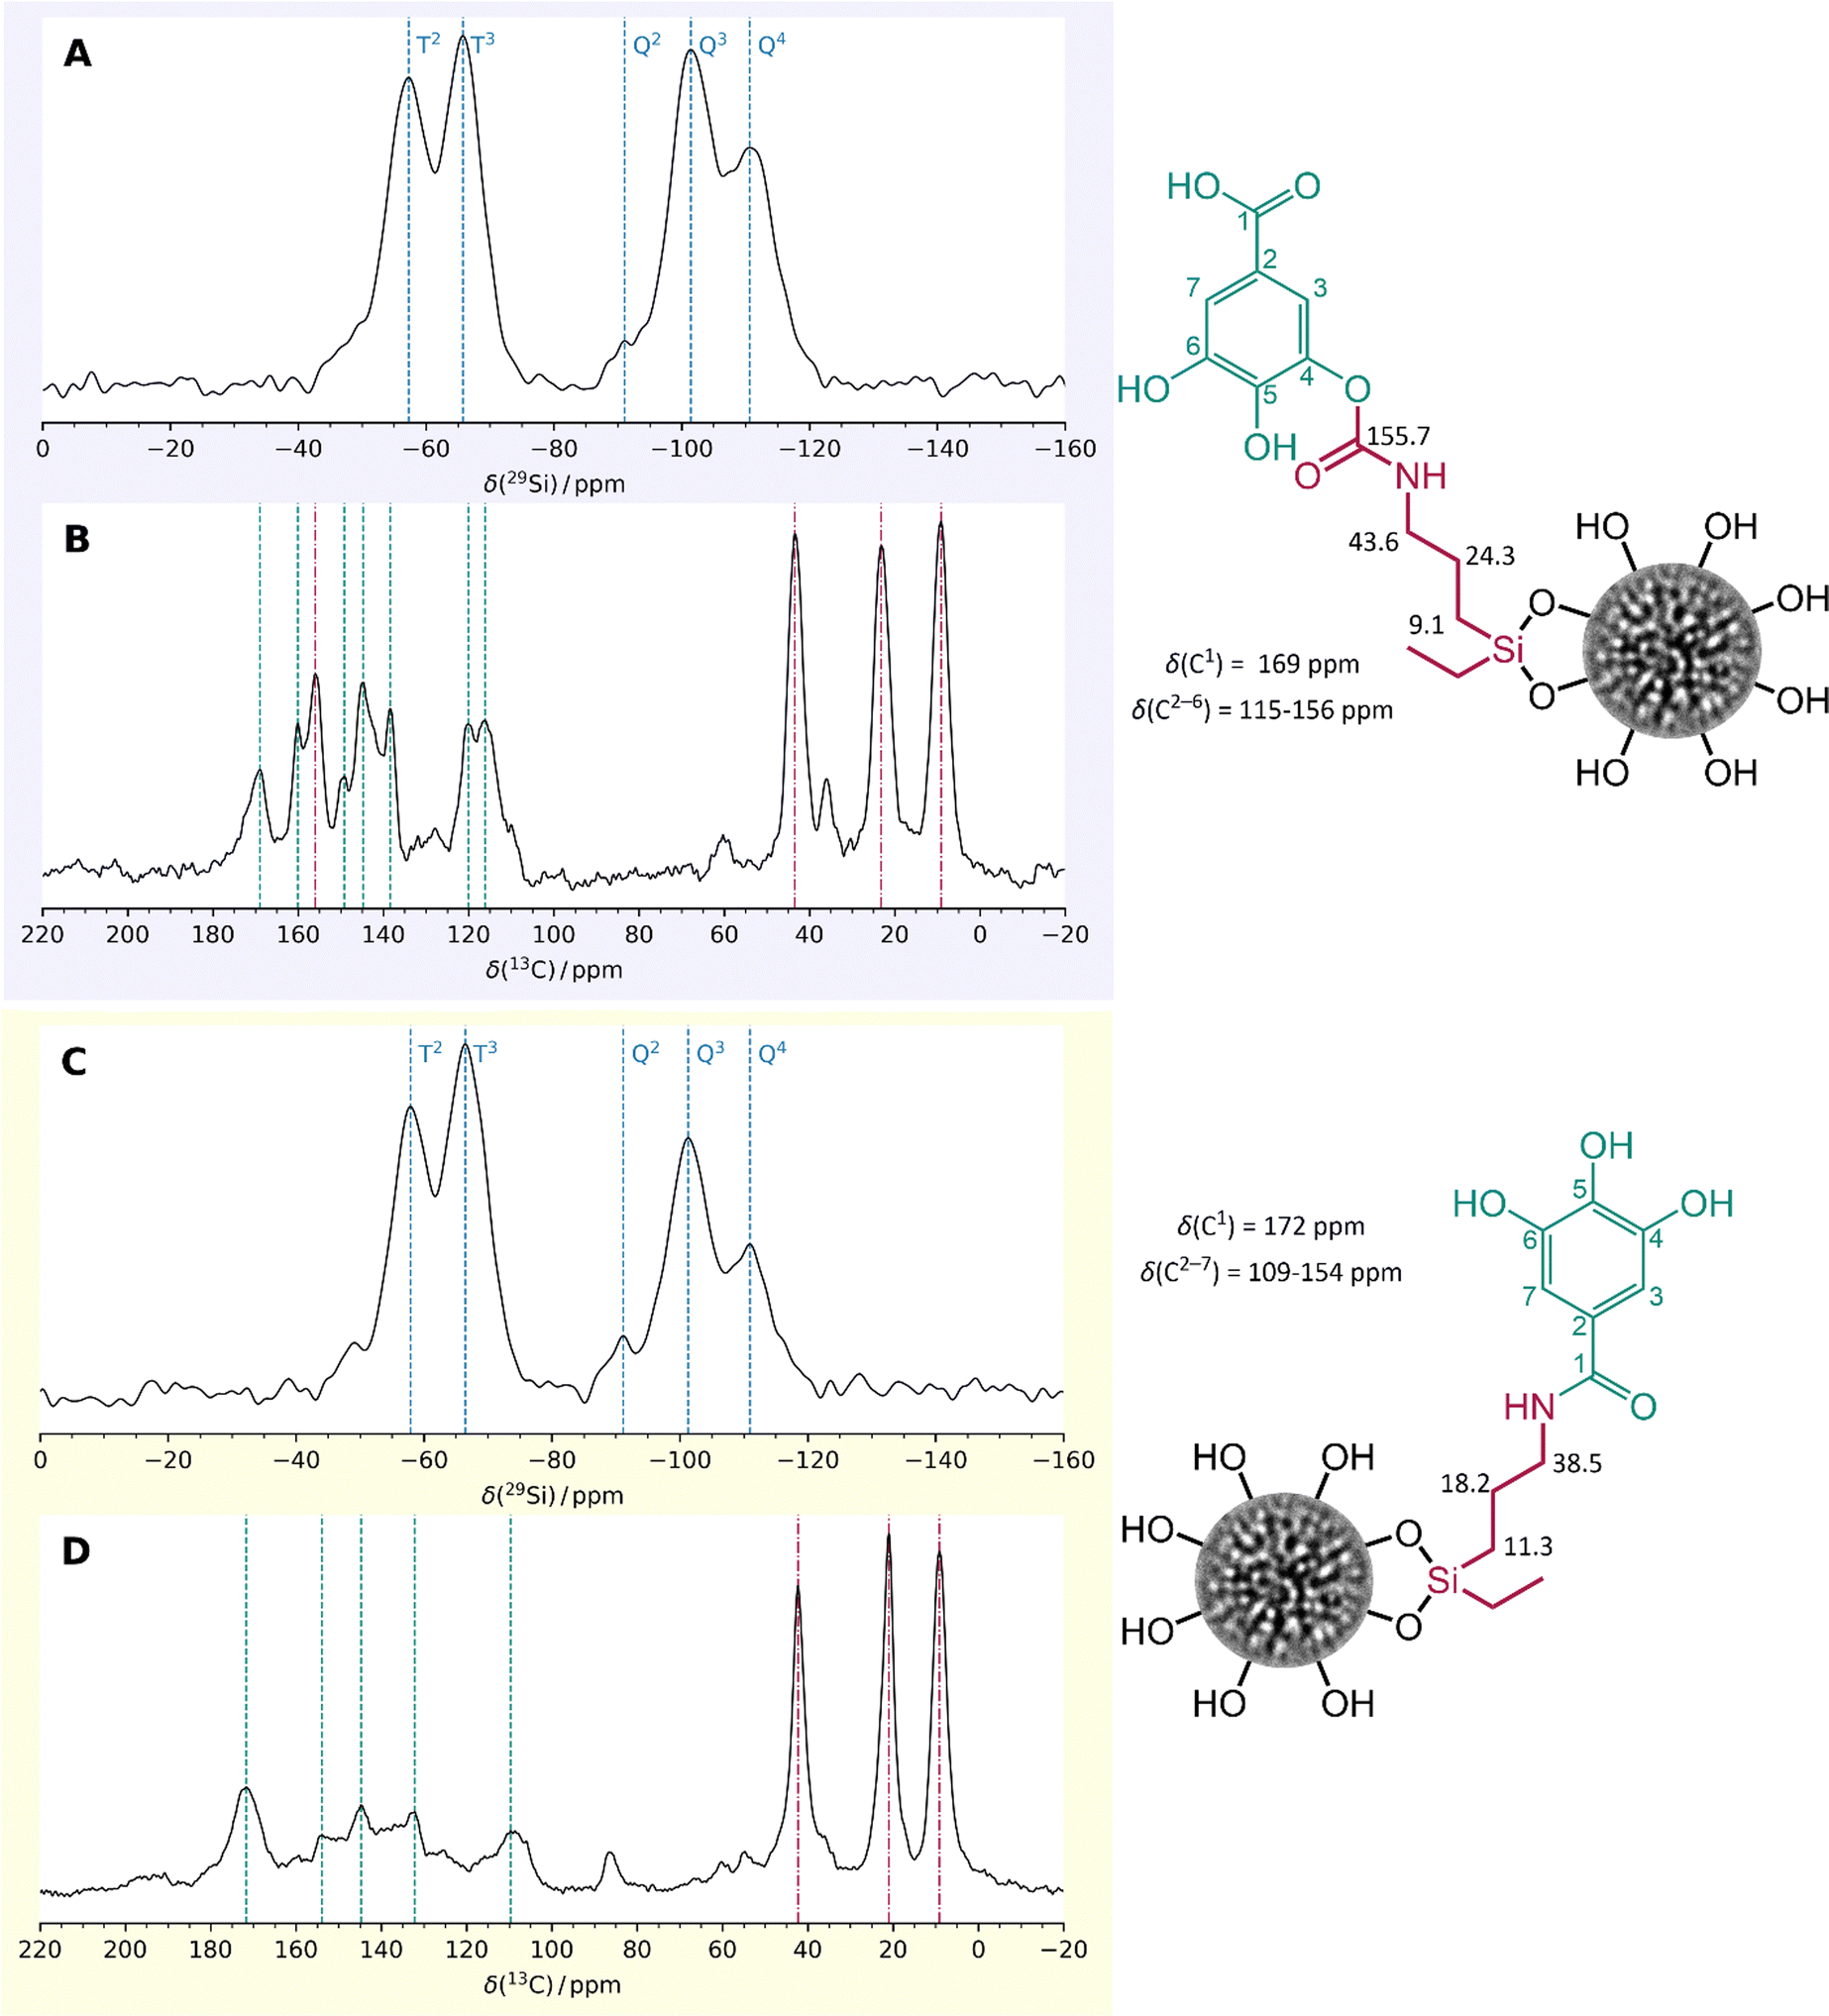 | ||
| Fig. 2 (A) and (C) Solid-state 29Si CP/MAS NMR spectra of the GA-conjugated samples, DMSN-NCO-GA and DMSN-NH-GA, respectively. (B) and (D) Solid-state 13C CP/MAS NMR spectra of DMSN-NCO-GA and DMSN-NH-GA, respectively. The signals marked in green correspond to the units of the GA molecule and those in red correspond to the silane linker. | ||
Attenuated total reflectance Fourier-transformed infrared spectroscopy (ATR-FTIR) was conducted to further characterize GA-conjugation of DMSNs. The characteristic absorbance band of ν(–NCOO–) (1533 cm−1) of the formed carbamate moiety was identified for DMSN-NCO-GA (Fig. S3A, ESI†). Amide formation was validated by its characteristic absorbance band of ν(–(C![[double bond, length as m-dash]](https://www.rsc.org/images/entities/char_e001.gif) O)-amide) (1629 cm−1) (Fig. S3B, ESI†), furthermore, proving the successful GA modification of the particles.
O)-amide) (1629 cm−1) (Fig. S3B, ESI†), furthermore, proving the successful GA modification of the particles.
The colloidal stability was tested in phosphate buffered saline (PBS) (pH 7) at 37 °C with DLS as a function of time. Both GA-modified materials show a constant hydrodynamic diameter of about 120 nm and a consistently low polydispersity index (PDI) of under 0.1 in PBS. These low PDI values indicate that the materials exhibit a narrow particle size distribution (Fig. S4A and B, ESI†) and that, even within a period of 160 h. The enhanced colloidal stability of the GA-conjugated materials is an advantage as it broadens their scope in biological applications, making them potential candidates as nanocarriers.
Evaluation of the radical scavenging capacity (RSC) of the GA-conjugated materials
RSC of the GA-modified materials was observed via the standardized DPPH radical method,57 which is commonly used to evaluate RSC for most natural antioxidants,58,59 as well as GA-functionalized materials such as polymers, silica, and peptides.60–63 DPPH is a relatively stable radical in MeOH solution and appears with purple colour absorbing at 515 nm in MeOH. The interaction of the GA-conjugated material and pure GA with DPPH radicals resulted in the discoloration of the DPPH solution from purple to light yellow, based on the principle that DPPH radical accepts a hydrogen (H) atom from the scavenger molecule. This results in the reduction of DPPH radical to DPPH-H, and the purple colour changes to yellow with accompanied decrease in absorbance at 515 nm. The kinetics of the DPPH scavenging provide quantitative information on the RSC, as well as mechanistic insights into the underlying physicochemical reactions.57–59,64 The decay of the absorbance at 515 nm was used to perform a DPPH-radical scavenging kinetics analysis quantitatively with GA concentrations from 0.5–15 μM (Fig. 3A–E). | ||
| Fig. 3 Kinetics of decay of absorbance at 515 nm for DPPH radicals ([DPPH]0 = 45 μM) reacting with GA-conjugated materials (DMSN-NCO-GA and DMSN-NH-GA), non-modified material (DMSNs) and free GA, at GA concentration of 0.5 μM (A), 1 μM (B), 5 μM (C), 10 μM (D), and 15 μM (E). | ||
Two kinetic reaction phases could be observed for all the samples tested, i.e., GA-modified materials (DMSN-NCO-GA and DMSN-NH-GA), GA, and non-functionalized DMSNs. The kinetic phases before 1 min were described as fast kinetic phases (initiation and propagation) whereas the slow reactions continue at longer reaction times (termination), as shown in Fig. 3A–E and Scheme 1(1–3).58,59,64,65 In the initiation reactions (fast decay reactions) DPPH˙ radicals interact with the phenolic moiety of the GA compound followed by H-atom transfer reactions [HAT] from the phenolic OH groups to the DPPH-radical, as depicted in Scheme 1(1, 2).58,59,64,65 The slow-decay phases, however, involve radical–radical termination reactions such as dimerization/polymerization reaction as shown in Scheme 1(3). As shown in Fig. 3A–E, about 27% of the free radical seemed to be adsorbed by the material within 1 min, indicating that at the lowest GA concentration tested (0.5 μM), only free GA shows a scavenging effect of 37% (Fig. 3A). However, at higher GA concentrations (5–15 μM), the GA-modified materials exhibited a scavenger efficiency increase of 8% induced by DMSN-NCO-GA and 26% for DMSN-NH-GA (Fig. 3B–E). Both materials exhibited a similar radical scavenging potential at higher GA concentrations (10–15 μM). However, DMSN-NCO-GA seems to be a more efficient free radical scavenger at lower GA concentration (1–5 μM). These findings underscore the significance of the linking chemistry in determining the efficacy of the material in scavenging reactive oxygen species (ROS). This has implications for various health conditions such as cancer, neurodegeneration, atherosclerosis, aging, and diabetes, where ROS play a critical role.66–70
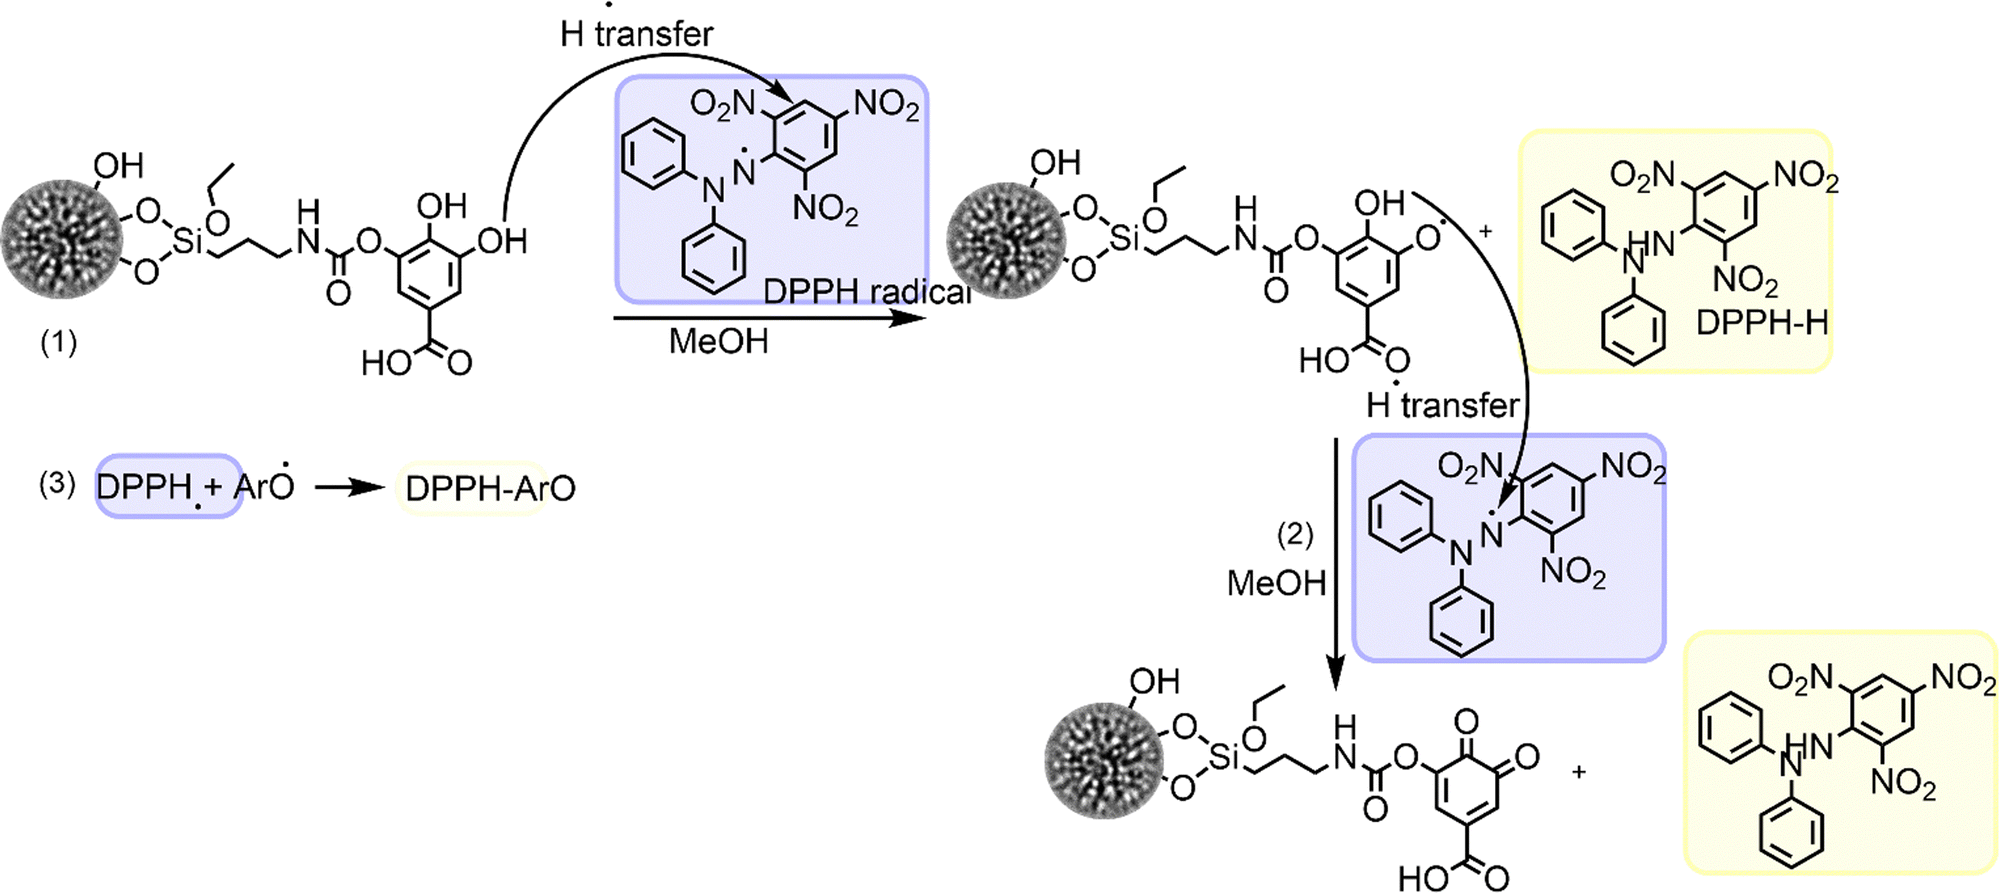 | ||
| Scheme 1 DPPH radical decay. (1) Scavenging of one DPPH radical by, for example, DMSN-NCO-GA, via hydrogen-atom transfer [HAT] resulting in the formation of a transient DMSN-NCO-GA-radical. (2) Scavenging of a second DPPH radical by DMSN-NCO-GA-radical via hydrogen-atom transfer [HAT], forming a non-radical DMSN-NCO-GA-quinone. (3) Termination reaction of DPPH radical and DMSN-NCO-GA-radical. | ||
Variations in antioxidant activity may arise from the orientation of hydrogen atoms in the hydroxyl groups, which is a key factor influencing the potent antioxidant capacity of phenolic compounds (Fig. 4). Crystal structure studies71–73 and conformational analyses74,75 of GA have identified four stable conformers. Among these, the GA(1) conformer stands out as the most stable, characterized by all three hydrogen atoms of the hydroxyl groups aligned in the same direction (Fig. 4).74–76
 | ||
| Fig. 4 Gallic acid conformers, the most stable GA conformer is highlighted in red. | ||
GA is a planar molecule, the hydroxyl groups are in a bent configuration, whereas the carboxylic moiety faces out of the plane of the benzene ring.76 Fiuza and coworkers studied the structure–activity relationship (SAR) of ester derivatives of GA revealing that the most stable conformers exhibit a planar geometry which is achieved by the stabilizing effect of p-electron delocalization between the benzene ring and the carbonyl group, resulting in steric freedom for the hydroxyl groups, which is essential for the antioxidant activity of phenolic acids.77 Furthermore, Rice-Evans et al. reported that the GA antioxidant effectiveness is reduced through esterification.78 Moreover, a substituent on the hydroxyl group can influence antioxidant activity by potentially favouring a less stable GA conformer. This could lead to a higher hydrogen-bond dissociation enthalpy and consequently a reduction in antioxidant capacity.79 To summarize, GA's high antioxidant activity is due to multiple of factors interfering with each other, as illustrated schematically in Scheme 2.
 | ||
| Scheme 2 Multiple factors controlling the antioxidant activity of the gallic acid molecule. | ||
Cytotoxicity studies
As the GA-conjugated materials proved to have effective ROS scavenging capacity, in vitro tests were performed to verify the activity in biological systems. The biocompatibility of the GA-modified materials was studied using U2-OS cell lines (hGAAP, NEO, and Ct-mut), as these cells were previously described to possess different intracellular ROS levels.41 For cell viability measurement (cell titer blue –CTB– assay; Fig. 5), cells were incubated in parallel with free GA, GA-conjugated materials, and non-modified DMSNs, in the concentrations equivalent to 0.5, 5, 10, and 20 μM GA which translates into a particle concentration range between 5.32 μg mL−1 and 212.65 μg mL−1 for the non-functionalized DMSNs. Non-modified DMSNs slightly decreased cells viability in the 3 osteosarcoma variants. With the exception of Ct-mut cells incubated with 5.32 μg mL−1 particles (equivalent to 0.5 μM GA treatments), this response contributed to an average decrease of cell viability around 20% (Fig. 5A–D and Table 2). Treatment with DMSN-NCO-GA returned a concentration dependent decrease of cell viability (Fig. 5A–D and Table 2). Incubation of DMSN-NH-GA with the cell lines NEO and Ct-mut, in the concentration range of 0.5, 5 and 10 μM GA, returned no significant loss of cell viability (Fig. 5A–C). For Ct-mut cells, rather a moderate enhancement of cell proliferation was observed (Fig. 5C). Moderate cytotoxicity was measurable when cells were incubated with DMSN-NH-GA 10 μM GA in hGAAP cells and with DMSN-NH-GA 20 μM GA for all tested cell types (Fig. 5C and D). Incubation with free GA induced slight to moderate cytotoxicity in all three cell lines that followed a concentration dependent trend. In this case, higher cytotoxicity was measured in hGAAP upon application of 20 μM GA (loss of cell viability around 49%, Fig. 5D). Intriguingly, the cytotoxicity profiles between free GA and DMSN-NCO-GA showed a reverse trend among the different cell lines: based on the ROS scavenging capacity described in Fig. 3, it is possible to hypothesize a potential contribution for the nano-formulation, as well as cell-specific responses related to the described ROS management capacity of the 3 cell types.80 Being the less cytotoxic, this effect was not evident for the DMSN-NH-GA material (Fig. 5). Furthermore, particularly for the lower concentration tested, the functionalized materials seem to have less toxicity in comparison to free GA, (Fig. 5A–D and Table 2). These findings suggest that the decorated particles can have a tailored impact on the cytotoxicity profile in the osteosarcoma cells, but also a complex cross talk between pro-proliferative stimuli and toxicity, as both responses have been previously attributed to nanomaterials.81–83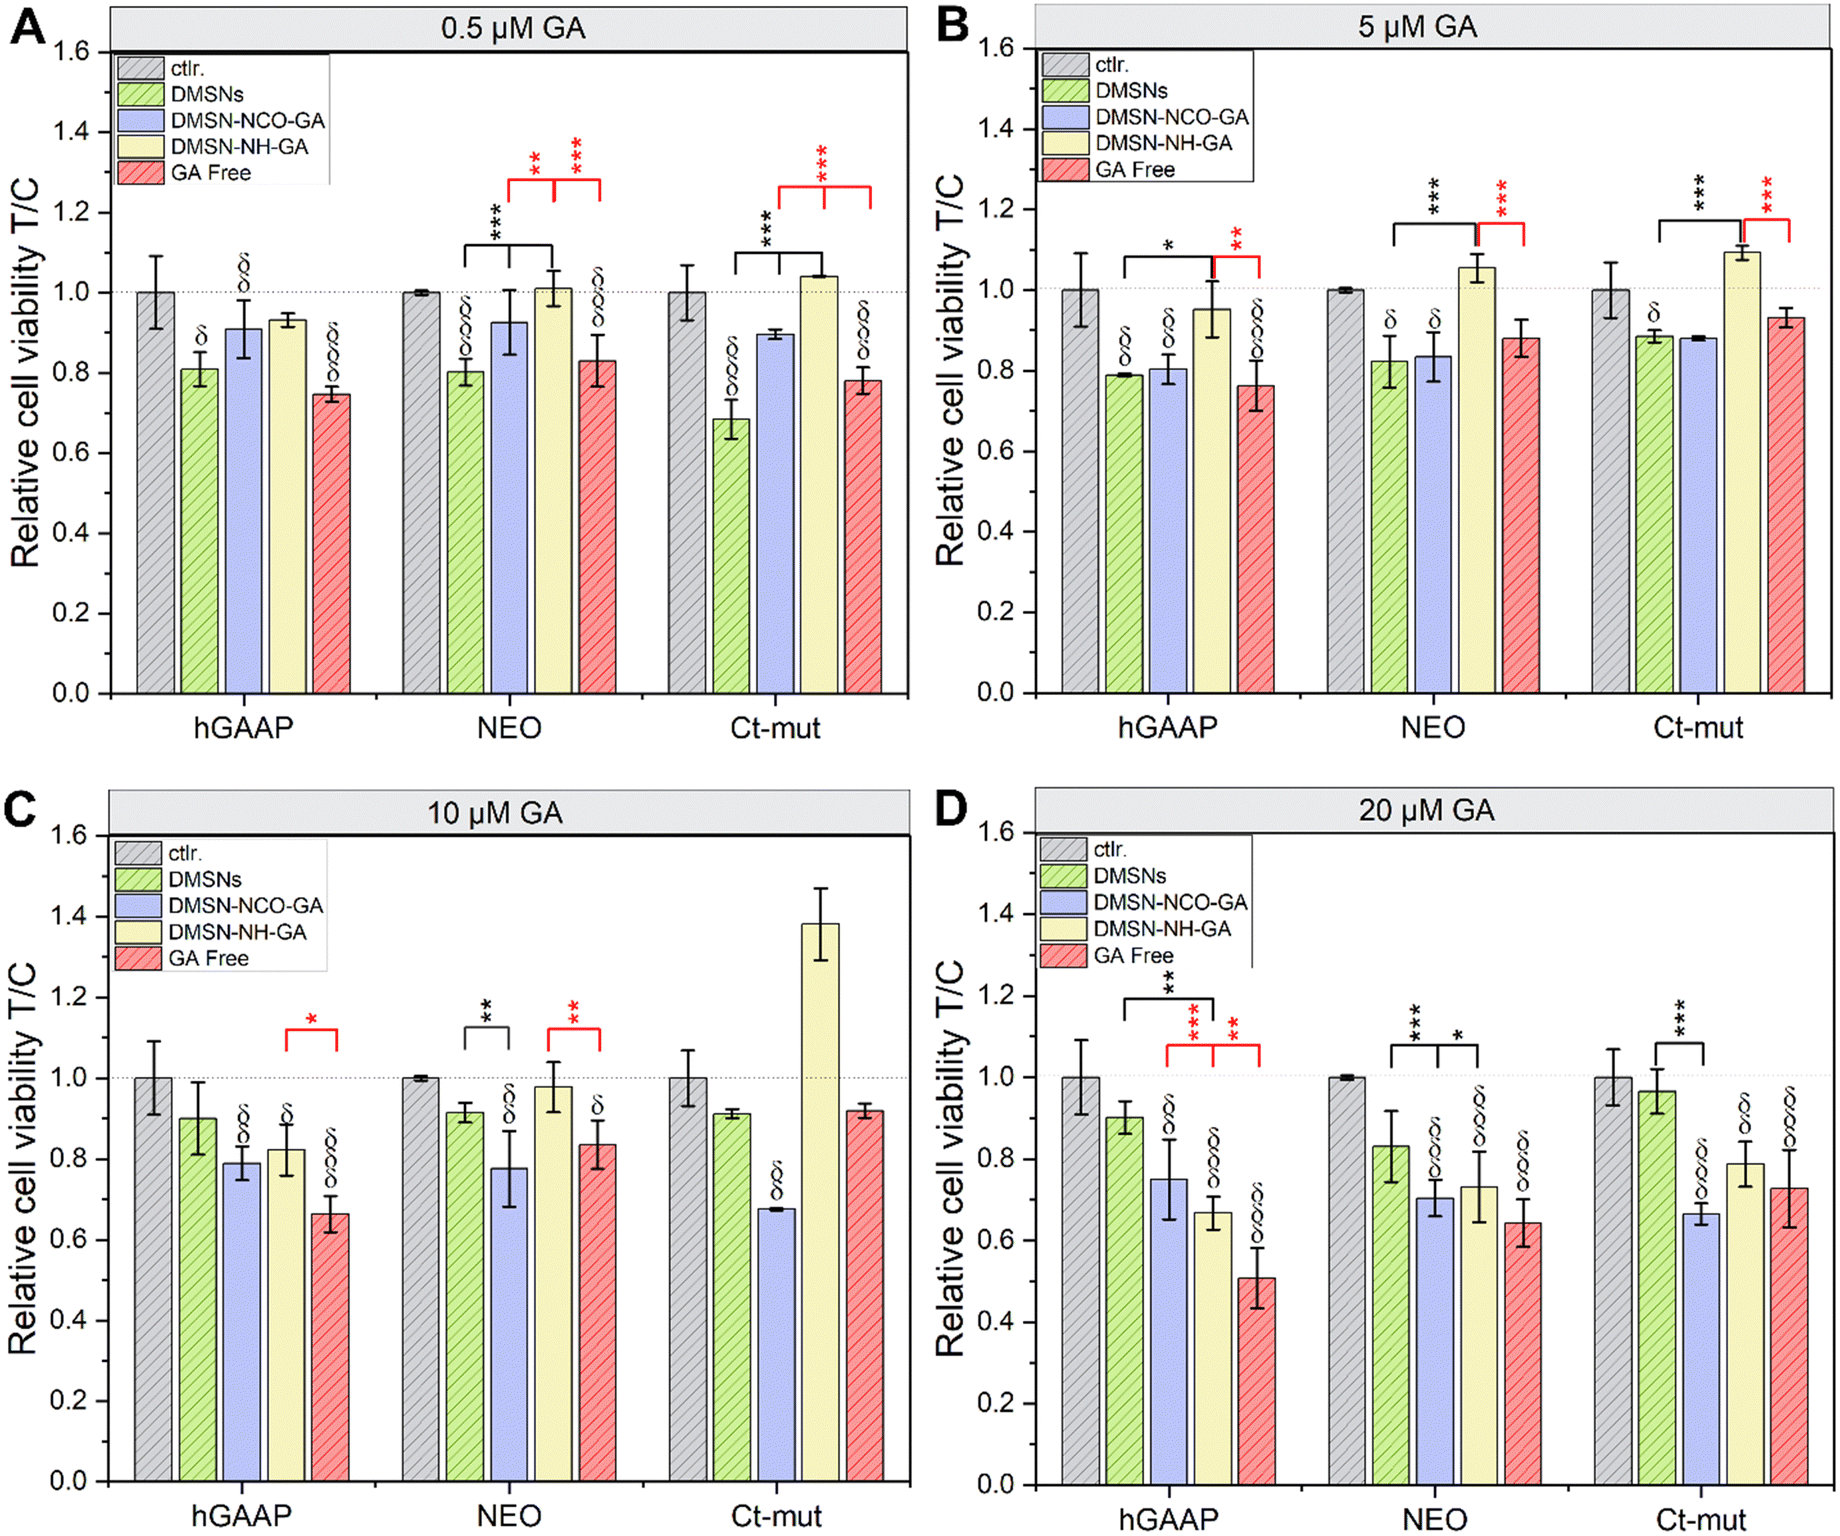 | ||
| Fig. 5 Cell viability assay in the presence of GA-conjugated particles as measured by metabolic activity (cell titer blue assay) in U2-OS cell lines (hGAAP, NEO, and Ct-mut) after incubation for 24 h (A–D). Experiments were performed in technical quadruplicates in at least three independent cell preparations. (δp < 0.05, δδp < 0.01, δδδp < 0.001) indicates significant difference in comparison to controls (Ctrl., grey bars), (*p < 0.05, **p < 0.01, ***p < 0.001) indicates significant difference in comparison to free GA (in red) and non-modified DMSNs (in black). The complete statistical evaluation can be found in Fig. S5 (ESI†). Significant differences among treatments were determined via one-way ANOVA with Fisher LSD. | ||
| Treatments | GA-Conc. [μM] | Cell viability loss [mean ± SE T/C %] | ||
|---|---|---|---|---|
| hGAAP | NEO | Ct-mut | ||
| DMSN-NCO-GA | 0.5 | 9 (±1.5) | 7 (±3.4) | 19 (±1.2) |
| DMSN-NH-GA | 7 (±1.7) | — | — | |
| DMSN | 19 (±4.2) | 20 (±3.4) | 32 (±4.8) | |
| Free GA | 25 (±1.9) | 17 (±6.5) | 22 ± 3.2 | |
| DMSN-NCO-GA | 5 | 20 (±3.6) | 17 (±6.1) | 13 (±0.5) |
| DMSN-NH-GA | 5 (±2.2) | — | — | |
| DMSN | 22 (±0.4) | 18 (±6.4) | 12 (±1.5) | |
| Free GA | 24 (±6.2) | 12 (±4.6) | 7 (±2.4) | |
| DMSN-NCO-GA | 10 | 21 (±4.2) | 23 (±9.3) | 33 (±0.2) |
| DMSN-NH-GA | 18 (±6.2) | 2 (±1.9) | — | |
| DMSN | 10 (±2.9) | 9 (±2.4) | 9 (±1.1) | |
| Free GA | 34 (±4.5) | 17 (±5.9) | 8 (±1.8) | |
| DMSN-NCO-GA | 20 | 25 (±9.7) | 30 (±4.9) | 34 (±2.6) |
| DMSN-NH-GA | 33 (±4.0) | 27 (±8.6) | 21 (±5.5) | |
| DMSN | 10 (±0.9) | 17 (±5.2) | 4 (±0.9) | |
| Free GA | 49 (±7.3) | 36 (±5.8) | 27 (±0.9) | |
Cellular uptake
As for many biological responses, including ROS modulation, access to the cytoplasmic compartment might be crucial, the intracellular uptake of the nanomaterials was verified in U2-OS cells (hGAAP, NEO, and Ct-mut). For this, fluorescently-labelled DMSNs (carrying GA 5 μM or 10 μM) were generated and compared to non-functionalized DMSNs. With fluorescence microscopy, it could be observed that the GA-modified materials tended to accumulate intracellularly after 24 h of incubation in all tested cell lines (Fig. 6). Intriguingly, uptake of the non-functionalized materials seemed to be more limited, or to follow different kinetics, and could be clearly observed only in Ct-mut after 24 h incubation (Fig. 6O). Images also indicated that the GA-conjugated particles seem to aggregate within the cytoplasmic compartment (Fig. 6E, F, H, J, K, M, N, P and Q). This response appeared to be material- and cell-line dependent as a more even distribution of the fluorescence signal was generally observed for the DMSN-NH-GA particles, especially in the cell lines hGAAP and NEO (Fig. 6B and I). | ||
| Fig. 6 Live-cell fluorescence imaging of U2-OS cell lines (hGAAP, NEO and Ct-mut) depicting 2D images and cross sections obtained from Z-stack reconstructions (63× magnification). The plasma membrane is depicted in red, the signal of the FITC-labelled particles in green (scale bar 20 μm). Representative optical fields of the control cells (hGAAP, (A), Ct-mut, (D), NEO, (G)), incubation with DMSN-NH-GA-FITC (hGAAP, (B (5 μM), C (10 μM)), Ct-mut, (E (5 μM), F (10 μM)), NEO, (H (5 μM), I (10 μM))), with DMSN-NCO-GA-FITC (hGAAP, (J (5 μM), K (10 μM)), Ct-mut, (M (5 μM), N (10 μM)), NEO, (P (5 μM), Q (10 μM))), and with DMSN-FITC (hGAAP, (L), Ct-mut, (O), NEO, (R)). The GA-conjugated materials corresponded to a GA concentration of 5 and 10 μM, and non-functionalized DMSNs with a concentration equivalent to 10 μM GA, namely 106.30 μg mL−1, were used. | ||
Evaluation of intracellular ROS
Once cellular uptake and biocompatibility were confirmed, experiments were performed to determine the capacity of GA-conjugated materials to interact with cellular ROS management of the U2-OS cell lines. For this hGAAP, NEO, and Ct-mut were incubated with non-functionalized DMSNs, free GA, and GA-modified materials (carrying 5–10 μM of GA) for 24 h. To explore the capacity of the treatments to alter ROS signals, two experimental setups were designed. At first, measurements were performed in absence of external ROS trigger to assess the effects of the particles with or without functionalization in comparison to solvent controls and free GA (Fig. 7A and B). Additionally, tert-butyl-hydroperoxide (TBHP) was included as a pro-oxidant stressor (Fig. 7C and D). Following the first experimental setup, exposure to non-decorated DMSNs moderately increased intracellular ROS of Ct-mut and NEO (T0; Fig. 7A and T0-T15; Fig. 7B for Ct-mut). For hGAAP cells, a response could be observed only in the highest concentration tested (T15; Fig. 7B). The GA-conjugated materials did not further enhance the generation of ROS in the U2-OS cells when compared to the naked particles. Indeed, incubation with GA-conjugated materials returned lower intracellular ROS compared to the DMSN-treated cells, supporting a ROS scavenging potential. Particularly for DMSN-NH-GA (5 μM GA; Fig. 7A), this was significant in comparison to DMSNs in Ct-mut (T0; Fig. 7A) and NEO cells (Fig. 7A). Increasing particles concentration (10 μM DMSN-NH-GA; Fig. 7B), this response was even more evident, and cells exposed to the materials functionalized with the amide-linker returned intracellular ROS levels significantly lower in comparison to those observed in presence of non-functionalized particles. In this regard, it is worth highlighting that hGAAP overexpressing U2-OS cells naturally contains higher ROS levels in comparison to the other two cell lines (Fig. S8A and B, ESI†). These data are coherent with previous literature41,80 and possibly account for the limited response measurable in hGAAP in some of the experimental conditions (i.e. 5 μM GA; Fig. 7A). The response supported by the incubation with DMSN-NCO-GA followed a concentration dependent trend; here 10 μM GA-conjugated materials returned the best performance, generally more evident after 15 min incubation (Fig. 7A and B). Similarly to the response profile of non-functionalized DMSNs, also free GA (5 μM) increased intracellular ROS in comparison to solvent controls in Ct-mut and NEO cells (Fig. 7A). Only in hGAAP cells, incubation with 10 μM GA (Fig. 7B) contributed to a reduction of ROS. When the TBHP was included in the experimental layout, ROS consistently increased in osteosarcoma cells in comparison to solvent controls. In this case, the response profile obtained in the presence of the nanomaterials changed substantially in comparison to experiments performed without chemical ROS trigger. In presence of DMSN-NH-GA, the chemical stressor TBHP supported a rapid (T0, Fig. 7C and D) increase of ROS. However, this effect was no longer visible during the measurements performed after 15 min, supporting a possible ROS scavenging potential (T15; Fig. 7C, D and Fig. S7, ESI†). Pre-treatment with DMSN-NCO-GA (10 μM, T0, Fig. 7D and T15 for hGAAP) was able to reduce the ROS signal triggered by TBHP (Fig. S7D–F, ESI†). This infers for a possible ROS scavenging performance of DMSN-NCO-GA, which followed a similar trend in comparison to free GA; for the latter, the antioxidant capacity seemed to follow a concentration dependent effect, with higher inhibition of the ROS signal obtained at the highest concentration tested (Fig. 7C and D). | ||
| Fig. 7 Intracellular ROS measurements using DCF-DA fluorescence dye. The U2-OS cell lines (hGAAP, NEO, and Ct-mut) were incubated with the GA-conjugated materials or free GA for 24 h with a GA concentration of 5 and 10 μM and non-functionalized DMSNs with concentrations equivalent to 5 μM and 10 μM GA, namely 53.15 μg mL−1 and 106.3 μg mL−1. In the experimental setup (A) and (B), no external oxidative stressor was used to explore the impact of the particles themselves. In (C) and (D), TBHP (0.2 mM) was added as external oxidative stressor. DCF fluorescence intensity was measured at starting point 0 (T0) and after 15 min (T15) and the data was normalized to each cell line independently. Data are expressed as mean of the results obtained from three independent experiments, performed in technical triplicates. In black and red, (*p < 0.05, **p < 0.01, ***p < 0.001) indicates the significant difference in comparison of samples incubated with non-modified DMSNs (black) and free GA (red), respectively. (δp < 0.05, δδp < 0.01, δδδp < 0.001) in red indicates the significant difference of samples incubated with free GA to the solvent control in (A) and (B), and in (C) and (D) to the TBHP control. (δp < 0.05, δδp < 0.01, δδδp < 0.001) in black indicates significant difference of samples incubated with GA-modified materials and non-modified DMSNs with the solvent control in (A) and (B), or to the TBHP control in (C) and (D). (#p < 0.05, ##p < 0.01, ###p < 0.001) indicates significant difference in comparison of the solvent control to TBHP control (C) and (D). The detailed statistical evaluation can be found in Fig. S6 and S7 (ESI†). The difference among treatment groups was determined via one-way ANOVA with Fisher LSD. | ||
The presence of the non-functionalized DMSNs supported a significant elevation of reactive species levels compared to the TBHP control, especially in the U2-OS cell lines Ct-mut and NEO, mostly at higher particle concentration of 106.3 μg mL−1 (equivalent to 10 μM GA treatment; Fig. 7D). The activity profile of the non-functionalized material returned a moderate increase in the ROS detection for the NEO cells incubated with 53.15 μg mL−1 DMSNs (equivalent to 5 μM treatments; Fig. 7C). For the highest tested concentration, a significant effect could be observed for Ct-mut (T0; Fig. 7D) and NEO (T0-T15; Fig. 7D) further supporting the view that hGAAP cells could differ significantly from NEO and Ct-mut in the ROS management capacity.
Cell migration
To start evaluating the ability of the GA-conjugated materials to inhibit crucial steps for cancer progression, cell migration studies were performed. Gap-closure assays allow to measure cell motility returning information about distance covered during cell migration in a given time frame (Fig. 8 and Fig. S9, S10, ESI†). Particularly for the osteosarcoma cells analysed in this study, it was possible to observe a parallel between the intracellular ROS and the migration speed, as hGAAP outperformed NEO and Ct-mut in both assays (Fig. S8 and Fig. 8, ESI†). To evaluate the potential effects of the nanomaterials on cell movement, the measurements included the area which was covered during collective cell migration. This was complemented by the calculation of the migration speed (μm h−1) (between initial t = 0 and end time-point t = 24 h). To assess migration, untreated (control) U2-OS cells and cells treated with GA-conjugated materials, as well as free GA at a concentration of 10 μM, were incubated for 24 h. Additionally, non-functionalized DMSNs were used at the concentration equivalent to 10 μM, corresponding to 106.3 μg mL−1. The gap distances were measured at 0 h and 24 h time-points. It was observed that cells treated with GA-conjugated materials showed a reduced migration speed, even in the U2-OS cell lines overexpressing hGAAP (Fig. 8B, D and F). | ||
| Fig. 8 Changes in motility (gap closure assay) of U2-OS cells (hGAAP (A) and (B), Ct-mut (C) and (D) and NEO (E) and (F)) after incubation with GA-conjugated materials, along with free GA at a concentration of 10 μM. Additionally, non-functionalized DMSNs were used at a concentration equivalent to 10 μM, corresponding to 106.3 μg mL−1. The results are given as area closure [μm2], calculated as the difference between the initial area of the scratch minus the area at the same coordinates after 24 h incubation (n =16). Quantification of closure speed (μm h−1) during 24 h in untreated control and non-functionalized DMSNs, and cells treated with GA-conjugated materials (n = 16).♦ indicates outliners and (δp < 0.05, δδp < 0.01, δδδp < 0.001) indicates significant difference in comparison to controls (Ctrl., grey bars), (*p < 0.05, **p < 0.01, ***p < 0.001) in red and black indicates significant difference in comparison to free GA and non-modified DMSNs, respectively. Representative phase-contrast images are included in Fig. S9 (ESI†). A complete statistical evaluation can be found in Fig. S10 (ESI†). The difference among treatment groups was determined via one-way ANOVA with Fisher LSD. | ||
For the (native) DMSNs treatment, a tendency toward a reduction of cell motility could be observed for all U2-OS cell variants (Fig. 8A–F). This effect was significant in the reduction of gap closure speed of NEO cells (Fig. 8F). Treatment with DMSN-NCO-GA resulted in a decrease in wound closure capacity compared to controls (Fig. 8A–F, for area and speed, respectively), and also a reduction of the gap closure efficiency in comparison to cells incubated with DMSNs for Ct-mut and NEO (Fig. 8C–E). In cells treated with DMSN-NCO-GA, viability was also slightly compromised (Fig. 5 and Table 2), suggesting that reduced proliferation or increased cytotoxicity may contribute to the observed effects. However, it is also possible to observe that the effect of DMSN-NCO-GA was less pronounced in the hGAAP cells in comparison to Ct-mut and NEO (Fig. 8A–D). As the cytotoxic potential was similar for the 3 cell variants, it is possible to speculate that this response might be related to the higher motility/intracellular ROS of the hGAAP clone (Fig. S8 and Fig. 8, ESI†). Looking at the cells incubated with DMSN-NH-GA, here the lowest performance in terms of wound-area closure as well as movement speed was measured (Fig. 8A–F). In contrast to DMSN-NCO-GA, cell viability was scarcely affected by the incubation with DMSN-NH-GA (Fig. 5C), making it likely that the readout of the wound closure assay could be attributable to effective loss of motility. Of note, DMSN-NH-GA particles were most efficient in buffering intracellular ROS (Fig. 7B) supporting the view that mechanisms other than cytotoxicity could account for the results obtained in the migration assays. Along these lines, incubation of hGAAP overexpressing cells with 10 μM GA reduced viability without impairing gap-closure efficiency. For Ct-mut and NEO, no or limited effect was observed in cell viability, however a significant loss of cell motility could be detected in comparison to respective controls (Fig. 8 and Fig. S9A–C(V, VI, and VII, VIII), Fig. 5 and Table 2, ESI†). The results of intracellular ROS measurements obtained after TBHP application indicate that the DMSN-NCO-GA material exhibited a similar ROS scavenging potential in comparison to free GA (i.e.Fig. 7D). Zahrani and coworkers reported that, the efficient hydrogen donation tendency of phenolic acids is due to the easily ionizable carboxyl group.84 The electron withdrawing effect of the carboxyl group (Schemes 2 and 3(B)) results in the efficient hydrogen donation tendency of phenolic acids, which is known to be one of the main reasons behind its potential as an antioxidant if compared with pyrogallol.85 The electron withdrawing effect of the carboxyl moiety is stronger than that of the amide group, which could be the reason for the NCO-GA material showing a faster scavenging ability, since the fast-radical movement via the HAT mechanism is more favoured, and the material is therefore able to scavenge ROS at a higher rate.
 | ||
| Scheme 3 The two pathways through which phenolic acid antioxidants can act upon. The single electron transfer SET (A) and H-atom transfer HAT (B). | ||
Conclusion
In this work, the potential of different GA-conjugation methods to tune the porosity, surface properties, and colloidal stability of dendritic MSNs was investigated. Additionally, free radical scavenging potential was explored in chemico and in vitro. Concerning surface area, GA-conjugation via carbamate (NCO-GA) and amide (NH-GA) formation showed a similar reduction in specific surface area of about 50%, whereas a stronger reduction of pore volume was observed in the NH-GA material (−60% compared to the native material) even though the grafting efficiency of both GA-conjugation was somewhat comparable. However, both GA-conjugation methods give rise to sufficient pore space to enable possible encapsulation of potential guest molecules, a property which is essential for a nanocarrier.The role of increased reactive oxygen species (ROS) levels in cancer progression is multifaceted and involves complex interactions with various cellular processes.86 ROS production by cancer cells can induce changes in the tumour microenvironment, creating a pro-tumorigenic niche that supports cancer cell survival, proliferation, and invasion. Additionally, ROS-mediated oxidative stress can promote inflammation, recruit immune cells, and remodel the extracellular matrix, facilitating tumour growth, angiogenesis, and metastasis.67,87,88 In this context, the possibility to synthesize materials capable of tuning oxidative stress in cancer cells promises to be particularly valuable.
Overall, both GA-conjugation methods have a good potential, in terms of free radical scavenging performance and effects on cell growth inhibition. In the osteosarcoma model where hGAAP is overexpressed, a significantly higher DCF-DA fluorescence intensity (Fig. S8, ESI†) was measured in comparison to Ct-mut and NEO. This is in accordance with the findings of Almeida and colleagues describing higher intracellular ROS, namely H2O2, for these cells which is directly involved in the increased cell invasion capability of hGAAP overexpressing cells.41 Furthermore, GA-modified materials and free GA showed significant scavenger activity with or without an external oxidative stressor, but also a cell type-specific response profile, supporting the view that intracellular oxidative stress levels could be decisive for the material to exhibit their best scavenging potency (Fig. 7 and Fig. S8, ESI†). Along this line, the increased cytotoxic effect might be the result of the promotion of H2O2 accumulation, due to variation in ROS management. This effect may produce an H2O2 intracellular concentration that no longer protects from cell death or supports an invasive phenotype, but rather represents a cytotoxic insult.89 This may be of particular interest since tumour cells tend to have higher ROS concentrations when compared with normal cells.36 The GA-conjugation presented here may be the starting point to generate materials ideally capable to reduce the viability and the invasiveness of cancer cells while promoting the survival of normal cells.
The structure–activity relationship generated by the differences in the chemical linkers in combination with accessibility of the GA functional groups for the cellular environment, plays an essential role in driving the biological response of the osteosarcoma cell lines. GA-conjugation is a promising method to implement antioxidant properties within a nanocarrier system paired with the potency to inhibit cell growth, making those materials interesting candidates for further anticancer research.
Author contributions
Mariam Hohagen: conceptualization, methodology, investigations, data curation, formal analysis, writing – original draft; Nuno Saraiva: visualization, methodology, formal analysis, writing – review & editing; Hanspeter Kählig: formal analysis, writing – review & editing; Christopher Gerner: resources, review & editing. Giorgia Del Favero: supervision, resources, writing – review & editing; funding acquisition; Freddy Kleitz: supervision, resources, writing – review & editing, funding acquisition.Conflicts of interest
There are no conflicts to declare.Acknowledgements
The authors would like to thank the University of Vienna (Austria) for the financial support. The authors thank Dr Endre Kiss for skilful technical assistance, Cornelia Schmutz and Maximilian Jobst for precious support in the implementation of the DCF and migration assays, the NMR Center and the core facility Multimodal Imaging of the Faculty of Chemistry (members of the VLSI) and Univ.-Prof. Dr Doris Marko for the provision of technical equipment of the Department of Food chemistry and Toxicology (University of Vienna).References
- E. Haslam and Y. Cai, Nat. Prod. Rep., 1994, 11, 41 RSC.
- A. Pengelly and K. Bone, The Const. of Med. Plants, Routledge, 2nd edn, 2020, vol. 20 Search PubMed.
- M. Siah, M. H. Farzaei, M. R. Ashrafi-Kooshk, H. Adibi, S. S. Arab, M. R. Rashidi and R. Khodarahmi, Bioorg. Chem., 2016, 64, 74–84 CrossRef CAS PubMed.
- N. Kahkeshani, F. Farzaei, M. Fotouhi, S. S. Alavi, R. Bahramsoltani, R. Naseri, S. Momtaz, Z. Abbasabadi, R. Rahimi, M. H. Farzaei and A. Bishayee, Iran. J. Basic Med. Sci., 2019, 22, 5 Search PubMed.
- G.-C. Yen, P.-D. Duh and H.-L. Tsai, Food Chem., 2002, 79, 307–313 CrossRef CAS.
- R. Sotler, B. Poljšak, R. Dahmane, T. Jukić, D. Pavan Jukić, C. Rotim, P. Trebše and A. Star, Acta Clin. Croat., 2019, 58(4), 726–736 Search PubMed.
- Y.-S. Cho, S.-K. Kim, C.-B. Ahn and J.-Y. Je, Carbohydr. Polym., 2011, 83, 1617–1622 CrossRef CAS.
- J. S. Giftson, S. Jayanthi and N. Nalini, Invest. New Drugs, 2009, 28, 251–259 CrossRef PubMed.
- V. Subramanian, B. Venkatesan, A. Tumala and E. Vellaichamy, Food Chem. Toxicol., 2014, 66, 44–55 CAS.
- E. Cecerska-Heryć, O. Surowska, R. Heryć, N. Serwin, S. Napiontek-Balińska and B. Dołęgowska, Clin. Biochem., 2021, 93, 1–8 CrossRef PubMed.
- G. Pizzino, N. Irrera, M. Cucinotta, G. Pallio, F. Mannino, V. Arcoraci, F. Squadrito, D. Altavilla and A. Bitto, Oxid. Med. Cell. Longev., 2017, 2017, 1–13 Search PubMed.
- C.-L. Liao, K.-C. Lai, A.-C. Huang, J.-S. Yang, J.-J. Lin, S.-H. Wu, W. G. Wood, J.-G. Lin and J.-G. Chung, Food Chem. Toxicol., 2012, 50, 1734–1740 CrossRef CAS PubMed.
- I. S. Martakov, O. G. Shevchenko, M. A. Torlopov, E. Y. Gerasimov and P. A. Sitnikov, J. Inorg. Biochem., 2019, 199, 110782 CrossRef CAS PubMed.
- D. Shen, Q. Hu, J. Sun, X. Pang, X. Li and Y. Lu, Int. J. Biol. Macromol., 2021, 192, 360–368 CrossRef CAS PubMed.
- Y. Gao, L. Wang, Y. Zhang, L. Zou, G. Li and B. Ye, Anal. Methods, 2016, 8, 8474–8482 RSC.
- M. Miola and E. Vernè, Nanomedicine, 2022, 17, 499–511 CrossRef CAS PubMed.
- J. G. Croissant, Y. Fatieiev, A. Almalik and N. M. Khashab, Adv. Healthcare Mater., 2017, 7, 1700831 CrossRef PubMed.
- J. Florek, R. Caillard and F. Kleitz, Nanoscale, 2017, 9, 15252–15277 RSC.
- Y.-J. Yu, J.-L. Xing, J.-L. Pang, S.-H. Jiang, K.-F. Lam, T.-Q. Yang, Q.-S. Xue, K. Zhang and P. Wu, ACS Appl. Mater. Interfaces, 2014, 6, 22655–22665 CrossRef CAS PubMed.
- S. Malekmohammadi, R. U. R. Mohammed, H. Samadian, A. Zarebkohan, A. Garca-Fernández, G. R. Kokil, F. Sharifi, J. Esmaeili, M. Bhia, M. Razavi, M. Bodaghi, T. Kumeria and R. Martinez-Máñez, Mater. Today Chem., 2022, 26, 101144 CrossRef CAS.
- J. Tang, A. K. Meka, S. Theivendran, Y. Wang, Y. Yang, H. Song, J. Fu, W. Ban, Z. Gu, C. Lei, S. Li and C. Yu, Angew. Chem., 2020, 132, 22238–22246 CrossRef.
- Y. Wang, Y. A. Nor, H. Song, Y. Yang, C. Xu, M. Yu and C. Yu, J. Mater. Chem. B, 2016, 4, 2646–2653 RSC.
- C. Xu, C. Lei, Y. Wang and C. Yu, Angew. Chem., Int. Ed., 2022, 61, 103 Search PubMed.
- C. Deng, Y. Liu, F. Zhou, M. Wu, Q. Zhang, D. Yi, W. Yuan and Y. Wang, J. Colloid Interface Sci., 2021, 593, 424–433 CrossRef CAS PubMed.
- V. Mamaeva, C. Sahlgren and M. Lindén, Adv. Drug Delivery Rev., 2013, 65, 689–702 CrossRef CAS PubMed.
- T. I. Janjua, Y. Cao, F. Kleitz, M. Linden, C. Yu and A. Popat, Adv. Drug Delivery Rev., 2023, 203, 115115 CrossRef CAS PubMed.
- L. Rashidi, E. Vasheghani-Farahani, K. Rostami, F. Ganji and M. Fallahpour, Asia-Pac. J. Chem. Eng., 2014, 9, 845–853 CAS.
- T. A. Vico, V. B. Arce, M. F. Fangio, L. B. Gende, C. A. Bertran, D. O. Mártire and M. S. Churio, J. Nanopart. Res., 2016, 18, 5 CrossRef.
- S. N. Rahaman, N. Ayyadurai and S. K. Anandasadagopan, J. Drug Delivery Sci. Technol., 2023, 82, 104353 CrossRef CAS.
- H. M. Fahmy, E. R. Mohamed, A. A. Hussein, Y. A. Khadrawy and N. A. Ahmed, BMC Pharmacol. Toxicol, 2022, 23, 15 CrossRef PubMed.
- M. Guo, J. Han, Q. Ran, M. Zhao, Y. Liu, G. Zhu, Z. Wang and H. Zhao, Ceram. Int., 2023, 6, 510 Search PubMed.
- L. Rashidi, E. Vasheghani-Farahani, M. Soleimani, A. Atashi, K. Rostami, F. Gangi, M. Fallahpour and M. T. Tahouri, J. Nanopart. Res., 2014, 16, 106 CrossRef.
- W. Dong, J. Su, Y. Chen, D. Xu, L. Cheng, L. Mao, Y. Gao and F. Yuan, Food Chem., 2022, 373, 131414 CrossRef CAS PubMed.
- S. Iraji, F. Ganji and L. Rashidi, J. Drug Delivery Sci. Technol., 2018, 47, 468–476 CrossRef CAS.
- G. Petrisor, D. Ficai, L. Motelica, R. D. Trusca, A. C. Bircă, B. S. Vasile, G. Voicu, O. C. Oprea, A. Semenescu, A. Ficai, M. I. Popitiu, I. Fierascu, R. C. Fierascu, E. L. Radu, L. Matei, L. D. Dragu, I. M. Pitica, M. Economescu and C. Bleotu, Nanomaterials, 2022, 12, 1648 CrossRef CAS PubMed.
- H. Nakamura and K. Takada, Cancer Sci., 2021, 112, 3945–3952 CrossRef CAS PubMed.
- G. Carrara, N. Saraiva, C. Gubser, B. F. Johnson and G. L. Smith, J. Biol. Chem., 2012, 287, 15896–15905 CrossRef CAS PubMed.
- G. Carrara, N. Saraiva, M. Parsons, B. Byrne, D. L. Prole, C. W. Taylor and G. L. Smith, J. Biol. Chem., 2015, 290, 11785–11801 CrossRef CAS PubMed.
- G. Carrara, M. Parsons, N. Saraiva and G. L. Smith, Open Biol., 2017, 7, 170045 CrossRef PubMed.
- N. Saraiva, D. L. Prole, G. Carrara, B. F. Johnson, C. W. Taylor, M. Parsons and G. L. Smith, J. Cell Biol., 2013, 202, 699–713 CrossRef CAS PubMed.
- N. Almeida, G. Carrara, C. M. Palmeira, A. S. Fernandes, M. Parsons, G. L. Smith and N. Saraiva, Redox Biol., 2020, 28, 101361 CrossRef CAS PubMed.
- M. Hohagen, P. Guggenberger, E. Kiss, H. Kählig, D. Marko, G. Del Favero and F. Kleitz, J. Colloid Interface Sci., 2022, 623, 962–973 CrossRef CAS.
- C. Iriarte-Mesa, M. Jobst, J. Bergen, E. Kiss, R. Ryoo, J.-C. Kim, F. Crudo, D. Marko, F. Kleitz and G. Del Favero, Nano Lett., 2023, 23, 7758–7766 CrossRef CAS PubMed.
- G. Del Favero, L. Janker, B. Neuditschko, J. Hohenbichler, E. Kiss, L. Woelflingseder, C. Gerner and D. Marko, Arch. Toxicol., 2021, 95, 2201–2221 CrossRef CAS PubMed.
- G. Del Favero, R. Zaharescu and D. Marko, Arch. Toxicol., 2018, 92, 3535–3547 CrossRef CAS PubMed.
- R. B. Soares, R. Manguinhas, J. G. Costa, N. Saraiva, N. Gil, R. Rosell, S. P. Camões, I. Batinic-Haberle, I. Spasojevic, M. Castro, J. P. Miranda, P. Guedes de Pinho, A. S. Fernandes and N. G. Oliveira, Cancers, 2023, 15, 3814 CrossRef CAS PubMed.
- A. Shukla, M. G. M. Khan, A. A. Cayarga, M. Namvarpour, M. M. H. Chowdhury, D. Levesque, J.-F. Lucier, F.-M. Boisvert, S. Ramanathan and S. Ilangumaran, Cancers, 2024, 16, 292 CrossRef CAS PubMed.
- J. Pijuan, C. Barceló, D. F. Moreno, O. Maiques, P. Sisó, R. M. Marti, A. Macià and A. Panosa, Front. Cell Dev. Biol., 2019, 7, 5 CrossRef PubMed.
- M. Jobst, E. Kiss, C. Gerner, D. Marko and G. Del Favero, Arch. Toxicol., 2022, 97, 217–233 CrossRef PubMed.
- G. Del Favero, M. Jobst, E. Kiss and D. Marko, Toxicol. Lett., 2022, 368, S184 CrossRef.
- L. Gruber, M. Jobst, E. Kiss, M. Karasová, B. Englinger, W. Berger and G. Del Favero, Cell Commun. Signal., 2023, 21, 5 CrossRef PubMed.
- E. Juère, J. Florek, M. Bouchoucha, S. Jambhrunkar, K. Y. Wong, A. Popat and F. Kleitz, Mol. Pharmaceutics, 2017, 14, 4431–4441 CrossRef PubMed.
- E. Juère, R. Caillard, D. Marko, G. Del Favero and F. Kleitz, Chem. – Eur. J., 2020, 26, 5195–5199 CrossRef PubMed.
- M. Thommes, K. Kaneko, A. V. Neimark, J. P. Olivier, F. Rodriguez-Reinoso, J. Rouquerol and K. S. W. Sing, Pure Appl. Chem., 2015, 87, 15 CrossRef.
- M. Thommes, Chem. Ing. Tech., 2010, 82, 1059–1073 CrossRef CAS.
- J. Hochstrasser, E. Juère, F. Kleitz, W. Wang, C. Kübel and U. Tallarek, J. Colloid Interface Sci., 2021, 592, 296–309 CrossRef CAS PubMed.
- V. Bondet, W. Brand-Williams and C. Berset, LWT - Food Sci. Technol., 1997, 30, 609–615 CrossRef CAS.
- K. Mishra, H. Ojha and N. K. Chaudhury, Food Chem., 2012, 130, 1036–1043 CrossRef CAS.
- C. Sanchez-Moreno, Food Sci. Technol. Int., 2002, 8, 121–137 CrossRef CAS.
- W. Pasanphan, G. R. Buettner and S. Chirachanchai, J. Appl. Polym. Sci., 2008, 109, 38–46 CrossRef CAS.
- G. Cirillo, K. Kraemer, S. Fuessel, F. Puoci, M. Curcio, U. G. Spizzirri, I. Altimari and F. Iemma, Biomacromolecules, 2010, 11, 3309–3315 CrossRef CAS PubMed.
- H. Lee, K. Kim, C. Oh, C.-H. Park, S. Aliya, H.-S. Kim, V. K. Bajpai and Y. S. Huh, RSC Adv., 2021, 11, 29407–29415 RSC.
- Y. Deligiannakis, G. A. Sotiriou and S. E. Pratsinis, ACS Appl. Mater. Interfaces, 2012, 4, 6609–6617 CrossRef CAS.
- P. Goupy, C. Dufour, M. Loonis and O. Dangles, J. Agric. Food Chem., 2002, 51, 615–622 CrossRef PubMed.
- W. Brand-Williams, M. E. Cuvelier and C. Berset, LWT - Food Sci. Technol., 1995, 28, 25–30 CrossRef CAS.
- C. E. Cross, Ann. Intern. Med., 1987, 107, 526 CrossRef CAS PubMed.
- G.-Y. Liou and P. Storz, Free Radical Res., 2010, 44, 479–496 CrossRef CAS PubMed.
- J. K. Andersen, Nat. Med., 2004, 10, S18–S25 CrossRef PubMed.
- M. C. Haigis and B. A. Yankner, Mol. Cell, 2010, 40, 333–344 CrossRef CAS PubMed.
- T. Paravicini and R. Touyz, Cardiovasc. Res., 2006, 71, 247–258 CrossRef CAS PubMed.
- J. Zhao, I. A. Khan and F. R. Fronczek, Acta Crystallogr., Sect. E: Struct. Rep. Online, 2011, 67, o316–o317 CrossRef CAS PubMed.
- N. Hirun, S. Saithong, C. Pakawatchai and V. Tantishaiyakul, Acta Crystallogr., Sect. E: Struct. Rep. Online, 2011, 67, o787 CrossRef CAS PubMed.
- G. Demirtaş, N. Dege and O. Büyükgüngör, Acta Crystallogr., Sect. E: Struct. Rep. Online, 2011, 67, o1509–o1510 CrossRef PubMed.
- C. Cappelli, B. Mennucci and S. Monti, J. Phys. Chem. A, 2005, 109, 1933–1943 CrossRef CAS PubMed.
- S. Pardeshi, R. Dhodapkar and A. Kumar, Spectrochim. Acta, Part A, 2013, 116, 562–573 CrossRef CAS PubMed.
- B. Badhani, N. Sharma and R. Kakkar, RSC Adv., 2015, 5, 27540–27557 RSC.
- S. M. Fiuza, C. Gomes, L. J. Teixeira, M. T. G. da Cruz, M. N. D. S. Cordeiro, N. Milhazes, F. Borges and M. P. M. Marques, Bioorg. Med. Chem., 2004, 12, 3581–3589 CrossRef CAS PubMed.
- C. A. Rice-Evans, N. J. Miller and G. Paganga, Free Radical Biol. Med., 1996, 20, 933–956 CrossRef CAS PubMed.
- J. S. Wright, E. R. Johnson and G. A. DiLabio, J. Am. Chem. Soc., 2001, 123, 1173–1183 CrossRef CAS PubMed.
- N. Almeida, G. Carrara, A. Fernandes, M. Parsons, G. Smith and N. Saraiva, Free Radical Bio. Med., 2018, 120, S31 CrossRef.
- A. Wittig, H. Gehrke, G. Del Favero, E.-M. Fritz, M. Al-Rawi, S. Diabaté, C. Weiss, H. Sami, M. Ogris and D. Marko, Nanomaterials, 2017, 7, 18 CrossRef PubMed.
- Y. Cai, Y. Liu, W. Yan, Q. Hu, J. Tao, M. Zhang, Z. Shi and R. Tang, J. Mater. Chem., 2007, 17, 3780 RSC.
- S. Ha, J. A. Sikorski, M. N. Weitzmann and G. R. Beck Jr., Toxicol. In. Vitro, 2014, 28, 354–364 CrossRef CAS PubMed.
- N. A. A. L. Zahrani, R. M. El-Shishtawy and A. M. Asiri, Eur. J. Med. Chem., 2020, 204, 112609 CrossRef PubMed.
- K. Furuno, T. Akasako and N. Sugihara, Biol. Pharm. Bull., 2002, 25, 19–23 CrossRef CAS PubMed.
- V. Aggarwal, H. Tuli, A. Varol, F. Thakral, M. Yerer, K. Sak, M. Varol, A. Jain, M. Khan and G. Sethi, Biomolecules, 2019, 9, 735 CrossRef CAS PubMed.
- P. T. Schumacker, Cancer Cell, 2015, 27, 156–157 CrossRef CAS.
- T. Ismail, Y. Kim, H. Lee, D.-S. Lee and H.-S. Lee, Int. J. Mol. Sci., 2019, 20, 4407 CrossRef CAS PubMed.
- A. S. Fernandes, N. Saraiva and N. G. Oliveira, Redox-Active Therapeutics, Springer International Publishing, 2016, pp. 451–467 Search PubMed.
Footnote |
| † Electronic supplementary information (ESI) available. See DOI: https://doi.org/10.1039/d4tb00151f |
| This journal is © The Royal Society of Chemistry 2024 |