
 Open Access Article
 This Open Access Article is licensed under a
 Creative Commons Attribution 3.0 Unported Licence
Edge sites on platinum electrocatalysts are responsible for discharge in the hydrogen evolution reaction†
Vipin
Adavan Kiliyankil
*a,
Wei
Mao
*ab,
Yurie
Takahashi
a,
Wei
Gong
ac,
Shigeru
Kabayama
d,
Yuki
Hamasaki
e,
Katsuyuki
Fukutani
bf,
Hiroyuki
Matsuzaki
ag,
Ichiro
Sakata
 ah,
Kenji
Takeuchi
c,
Morinobu
Endo
c and
Bunshi
Fugetsu
*ch
ah,
Kenji
Takeuchi
c,
Morinobu
Endo
c and
Bunshi
Fugetsu
*ch
aSchool, of Engineering, The University of Tokyo, Bunkyo-Ku, Yayoi 2-11-16, Tokyo 113-0032, Japan. E-mail: vipin@ipr-ctr.t.u-tokyo.ac.jp; maowei@iis.u-tokyo.ac.jp
bInstitute of Industrial Science, The University of Tokyo, 4-6-1 Komaba, Meguro-ku, Tokyo 153-8505, Japan. E-mail: fukutani@iis.u-tokyo.ac.jp
cFaculty of Engineering, Shinshu University, 4-17-1 Wakasato, Nagano-shi 380-8553, Japan. E-mail: fugetsu@shinshu-u.ac.jp; bunshifugetsu@ifi.u-tokyo.ac.jp
dNihon Trim Co. Ltd, Oyodonaka, Kita-ku, Osaka, Japan
eKyushu Electric Power Co. Inc., Technical Solution Headquarters Research Institute Low Carbon Technology Group, Minami-ku, Shiobara 2-1-47, Fukuoka City 815-8520, Japan
fAdvanced Science Research Center, Japan Atomic Energy Agency (JAEA), Naka, Ibaraki 319-1195, Japan
gThe Micro Analysis Laboratory, Tandem Accelerator, The University Museum, The University of Tokyo, 2-11-16 Yayoi, Bunkyo-ku, Tokyo 113-0032, Japan
hInstitute for Future Initiatives, The University of Tokyo, Bunkyo-Ku, Yayoi 2-11-16, Tokyo 113-8656, Japan
First published on 14th October 2024
Abstract
The hydrogen evolution reaction (HER) on platinum (Pt) electrocatalysts involves the generation of hydrogen atoms and the formation of hydrogen molecules. It is commonly believed that the sites on the surfaces of the terrace (111, 110, and 100) domains are responsible for the formation of hydrogen molecules. However, the electrochemistry of the hydrogen atom generation is not well understood. We created edge-rich platinum electrocatalysts using nano-fabrics comprising entire single-walled carbon nanotubes (SWCNTs) as templates and supports. We then conducted the HER on the edge-rich Pt/SWCNT hybridized electrocatalysts and gained new insights into the electrochemical properties and functions of the edge sites. We propose that the edge sites are oxidized and serve two important functions: they act as atomic barriers, allowing electrons to accumulate within the terrace (111, 110, and 100) domains, and they transfer the electrons to the hydronium ions in the electrical double layer through discharge. Enhancing the discharge capability of the electrocatalysts is an efficient way to reduce the amount of platinum required, and this can be applied to various precious metal-based electrocatalysts to enhance their electrocatalytic activities and durability.
Introduction
The hydrogen evolution reaction (HER) is the foundation for producing green hydrogen. It is a complex process involving multiple electrochemical reactions and a transformation between liquid, solid, and gas phases.1 The overpotential is an important criterion for evaluating the effectiveness of an electrocatalyst for the HER. Tafel conducted the first fundamental studies on the overpotential in the electrolytic HER in the early 20th century,2 and introduced the Tafel equation.3 Metals like Hg, Sn, Bi, Au, Cu, Ni, and Pt have been extensively researched as electrocatalysts for HER by Tafel, who found that Pt provided the lowest overpotential.3Pt is scarce on Earth. To reduce the amount of Pt used, it is broken down into very fine particles (Pt nanoparticles) and then loaded onto the surface of a nonmetal-based support.4 When hydrogen molecules reach or form on Pt nanoparticles, they partly dissociate into hydrogen atoms, which then move from the Pt nanoparticles to their support, a phenomenon known as hydrogen spillover. This was first observed by Khoobiar.5 Hydrogen spillover can occur quickly or slowly, depending on the physiochemical properties of the catalyst support.6 Li and colleagues investigated hydrogen spillover in an actual electrolytic HER and found that the difference in work functions between the metal-based catalyst and the nonmetal-based support caused interfacial charge accumulation, which was the main barrier to hydrogen spillover.7
Traditionally, Pt nanoparticles are loaded in isolation onto carbon granules,8,9 leaving a large uncovered area on the support's surface. Apart from delaying hydrogen spillover, the exposed surface of the support also leads to electrochemical Ostwald ripening and corrosion of the carbon-based anodic catalyst support, particularly under high current densities.10 It's worth mentioning that previous studies demonstrated the advantageous properties of carbon nanotubes in either the nitrogen-dopped11,12 or the sheet form13 as catalyst supports to strengthen the interactions between Pt and the carbon-based supports for HER, still, the Pt nanoparticles were deposited in isolation.
To address the functional barriers between catalysts and supports, van der Vliet and co-workers14 have developed support-free electrocatalysts. They used vertically aligned perylene red whiskers as templates, each coated with a nano-thin Pt or Pt alloy layer via planar magnetron sputter deposition. Afterward, the perylene red whiskers were evaporated at 400 °C in a hydrogen-rich atmosphere to create a support-free, mesostructured thin-film Pt catalyst for HER. Similarly, Higashi and colleagues established a textile IrO2-based electrocatalyst for oxygen evolution reactions (OERs) using electrospun polyvinylpyrrolidone (PVP)-based nonwoven fabrics as templates.15 The PVP-based templates were dissolved in water to produce a nonwoven fabric-shaped IrO2. However, transferring these very brittle nonwoven fabric-shaped catalysts to an ion-exchange membrane for building water electrolysis cells remains challenging.
We introduce a new type of platinum/carbon (Pt/C) hybridized electrocatalysts using nano-fabrics consisting of entire single-walled carbon nanotubes (SWCNTs) as the templates and supports. The SWCNT-based nano-fabrics have a uniform surface with specific properties, allowing for a uniformly deposited Pt layer with a thickness ranging from 1 to 20 nm on the surface of each SWCNTs. Moreover, the proximity of the SWCNTs in the nano-fabrics restricts the width of the Pt terrace domains to a few nanometres, thereby creating numerous sites on edges and steps. The HER experimental evidence shows that narrowing the Pt terrace domains eases the formation of hydrogen molecules, while increasing the ultimate number of Pt-sites on edges and steps intensifies the discharge, promoting the generation of hydrogen atoms.
Results and discussion
Preparation of free-standing SWCNT-based nano-fabrics with physiochemical properties suitable for use as catalyst supports for the HER
“Bucky paper” is the earliest form of free-standing, purely carbon nanotube (CNT)-based nonwoven nano-fabrics prepared by filtering certain volumes of slurries containing CNTs dispersed in water or organic solvents.16,17 This method is the basis for preparing free-standing CNT-based nano-fabrics with desirable densities and mechanical strengths but is time-consuming. Notably, free-standing CNT sheets, in which CNTs are highly oriented in the same direction, can be prepared by drawing conjugated CNTs from a CNT forest, but these sheets have very low densities.18 Although free-standing CNT sheets with higher densities (density > 0.3 g cm−3) can be prepared by drawing conjugated CNT aerogels directly from a CNT generator, this has to be done in situ in CNT reactors.19 Here, we introduce a simple yet scalable casting method for preparing free-standing CNT-based nonwoven nano-fabrics with physiochemical properties suitable for use as catalyst supports. Commercial SWCNTs were received as granules and dispersed in deionized water using sodium cholate as a dispersant, and polyvinylpyrrolidone (PVP) and hydroxypropyl cellulose (HPC) as stabilizers to prepare a water-based dispersion containing 0.5 wt% SWCNTs. To this SWCNT-based dispersion, certain amounts of cellulose nanofibers (CNFs) were then added. The CNFs used for this study were produced via regioselective oxidation of C6 primary hydroxyl groups to carboxylates, using 2,2,6,6-tetramethylpiperidine-1-oxyl (TEMPO) as a catalyst.20 The TEMPO-CNFs are cellulose backboned nanofibers with a diameter of 3–5 nm and a length of up to a few micro-meters; they contain significant amounts of C6 carboxylate moieties with sodium ions as the counterions on the microfibril surface.21 The TEMPO-CNFs play important roles in preparing the free-standing SWCNT nano-fabrics. The free-standing SWCNT nano-fabrics were prepared via four essential steps, details are described in the Experimental section. The final step is eliminating amorphous carbon at 900 °C using carbon dioxide as an oxidant.22,23Fig. 1A displays a typical scanning electron microscope (SEM) image of a highly purified SWCNT-based nonwoven nano-fabric sample. The nano-fabric sample consists of individual SWCNTs and thin bundles composed of two or a few tubes, forming a highly porous nanostructured nonwoven fabric. The density, thickness, electrical resistivity, surface area, pore diameter, micropore volume, microporous surface area, and external surface area are summarized in Table S1 of the ESI†. Additionally, Fig. 1B shows an SEM image of a highly purified SWCNT-based nano-fabric sample prepared without TEMPO-CNFs, resulting in thicker bundles of SWCNTs. The mechanical properties are summarized in Fig. S1A and Table S2 of the ESI,† while nitrogen adsorption/desorption isotherms and pore size distributions are shown in Fig. S1B and C,† respectively. The free-standing SWCNT nano-fabrics are also demonstrated to exhibit excellent flexibility and foldability, as depicted in Fig. S2 of the ESI.† Typical Raman spectra are illustrated in Fig. 1C, with the G band peak splitting into G+ at 1593 cm−1 and G− at 1572 cm−1. The corresponding band near 1339 cm−1 is the D band. The intensity ratio of the G band to the D band of the SWCNT nano-fabrics is 49, similar to the G/D ratio found for the as-received powdered SWCNTs. However, a significant change in the frequency region of 100–300 cm−1, corresponding to the radial breathing mode (RBM),24,25 is observed in Fig. 1D. The peaks associated with tubes of specific diameters were altered after carbonization in N2 and oxidation via CO2.
 | ||
| Fig. 1 (A and B) SEM images of the refined SWCNT nano-fabrics with (A) and without (B) the use of TEMPO-CNFs for the preparation of the SWCNT nano-fabrics during the initial stage; (C and D) Raman spectra of the SWCNT nano-fabrics at each progressive stage. | ||
The X-ray photoelectron spectroscopy (XPS) was used to evaluate the elemental compositions and chemical states of the free-standing SWCNT nano-fabrics. The detailed elemental compositions are provided in Fig. S3 and Table S3 of the ESI.† The C 1s spectra were deconvoluted to determine the nature of the carbon bonding.26,27 The peaks at 284.4 and 285.6 eV correspond to sp2 (C–C bond) and sp3 (C–O bond), respectively. The percentage of sp2-hybridized carbon atoms in the refined free-standing SWCNT nano-fabrics was found to be 71.5%, which was 1.5% lower than that in the as-prepared SWCNT powders. Additionally, approximately 0.6 wt% of Fe remained in the free-standing SWCNT nano-fabrics, likely due to the residual catalyst inside the SWCNTs.
Preparation of Pt/SWCNT hybridized nano-fabrics as electrocatalysts via physical vapor deposition (PVD) with free-standing SWCNT nano-fabrics as supports/templates
The free-standing Pt/SWCNT hybridized nano-fabrics as electrocatalysts for the HER were created by applying a nano-thin Pt layer on the refined SWCNT nano-fabrics using physical vapor deposition (PVD). As shown in Fig. 2A and B, through optimizing the sputtering parameters, such as the applied power, sputtering time, and degree of vacuum, a continuous and interconnected Pt thin layer was deposited on the surface of each SWCNTs of the nano-fabrics. The high-angle annular dark-field scanning transmission electron microscopy (HAADF-STEM) image in Fig. 2C displays Pt atoms on the Pt terrace (111, 110, and 100) domains, as well as on the edges and steps of the Pt thin layer. Additionally, selective area electron diffraction (SAED) and X-ray diffraction (XRD) patterns in Fig. 2D and E indicate the presence of Pt (111), Pt (100), Pt (200), Pt (110), and Pt (220) peaks in reflection mode. On the other hand, the peaks corresponding to the SWCNTs are not observed. It is noted that in Fig. 2E, the maximum measurable angle in the penetration mode is 60°, whereas it is 90° in the reflection mode. The atomic resolution elemental mapping in Fig. 2F–H also clearly shows the presence of carbon and Pt in the Pt/SWCNT nano-fabrics, demonstrating the nano-thin thickness of the Pt layer on the SWCNTs. It is noted that in Fig. 2(B, C and F), SWCNTs were not observed, indicating the surface of each SWCNTs in the nano-fabric was almost entirely covered by the Pt thin layer. | ||
| Fig. 2 (A) SEM images at high magnification, (B) TEM images at low magnification, and (C) HAADF-STEM images of Pt atoms on the Pt terrace (111, 110 and 100) domains, edges, and steps; (D) selective area electron diffraction patterns and (E) XRD patterns, and (F–H) atomic resolution elemental mapping of Pt on the free-standing SWCNT nano-fabric support. The thickness of the Pt thin layer is approximately 4 nm. | ||
A significant decrease in the intensity of the Raman peaks of SWCNTs in the radial breathing mode (RBM) range was observed. The radial breathing of all tubes with diameters of 1.8 nm, 1.6 nm, 1.47 nm, and 1.32 nm was almost completely suppressed after the Pt layers, with thicknesses greater than 10 nm, were applied. Again, this suggests that the surface of the SWCNT-based nano-fabrics was almost entirely covered by the Pt thin layer. Fig. 3A illustrates the typical Raman intensity data in the RBM range of a free-standing SWCNT nano-fabric sample, as well as the Raman intensity data of the same SWCNT nano-fabric sample after Pt layers with the thicknesses of 4 nm, 10 nm, and 20 nm were applied.
 | ||
| Fig. 3 (A) Raman spectra of the free-standing SWCNT nano-fabrics and Raman spectra of the same SWCNT nano-fabrics after loading Pt layers with thicknesses of approximately 4 nm, 10 nm, and 20 nm; (B) high-resolution XPS Pt4f spectrum of Pt of the Pt/SWCNT nano-fabric catalyst. | ||
Fig. 3B displays a high-resolution XPS Pt4f spectrum of Pt of the Pt/SWCNT hybridized nano-fabric catalysts. Two prominent peaks are observed at 71.4 eV and 74.8 eV, corresponding to Pt 4f7/2 and 4f5/2, respectively. Deconvolution of the major peaks shows two dominant metallic Pt(0) peaks at 71.4 eV and 74.8 eV, two oxidized Pt(II) peaks at 72.8 eV and 76.1 eV, and two oxidized Pt(IV) peaks at 74.2 eV and 77.4 eV.28
ESI Fig. S4† exhibits the cross-sectional SEM images and EDS mappings of Pt and carbon (SWCNTs); once again, the Pt layers are observed to be loaded in a continuous and borderless manner on the SWCNT nano-fabrics with high uniformity. The depth of Pt which can reach in the SWCNT nano-fabrics is in the range of 50–80 nm. Additionally, after loading the thin Pt layers, the surface areas of the resultant Pt/WCNT hybridized nano-fabrics were found to be as high as the surface areas of the free-standing SWCNT nano-fabric template/support. The surface areas were 1100 m2 g−1, 1050 m2 g−1, and 987 m2 g−1 for the Pt/SWCNT hybridized nano-fabrics with Pt layer thicknesses of 4 nm, 10 nm, and 20 nm, respectively. For comparison, commercially available, carbon fiber-based (carbon fiber average diameter: 8 ± 2 μm) fabrics were used as a catalyst support/template, and Pt was loaded via PVD under identical conditions. ESI Fig. S5† displays the typical SEM images. The Pt layers were found to be suspended over the carbon fiber-based fabrics and cracked into many pieces. The nearly 10 μm-sized diameters and the nonuniform (sp2/sp3) surface of the carbon fibers disrupted the formation of a continuously interconnected Pt layer on their surface.
Evaluation of the HER activity and stability of the Pt/SWCNT hybridized nano-fabrics as electrocatalysts via a half-cell (three-electrode) system
We evaluated the hydrogen evolution reaction (HER) activity and stability of the Pt/SWCNT hybridized nano-fabrics as electrocatalysts for processing the HER in a 0.5 M H2SO4 acidic solution at room temperature using linear sweep voltammetry (LSV) in a half-cell (three-electrode) setup. To assess the impact of Pt layer thickness on the catalyst's electrocatalytic performance, we prepared four different Pt/SWCNT hybridized nano-fabrics with Pt layer thicknesses of approximately 1 nm (Pt loading of 1.16 μg cm−2), 4 nm (Pt loading of 6.03 μg cm−2), 10 nm (Pt loading of 16.43 μg cm−2), and 20 nm (Pt loading of 61.03 μg cm−2). We calculated the Pt loadings based on the analytical data obtained using ICP-MS. For comparison, we used a commercially available Pt/C catalyst in powder form with Pt particles loaded on activated carbon support at a loading ratio of 5 wt%. SEM images of the Pt particles on the powders of the activated carbon support are available in ESI Fig. S6,† showing Pt particles up to a few micrometers in size randomly positioned on the support.
Fig. 4 presents typical LSV curves at full scale, Tafel plots, turnover frequencies (TOFs), mass activities, and stabilities after 10![[thin space (1/6-em)]](https://www.rsc.org/images/entities/char_2009.gif) 000 cycles for the four Pt/SWCNT nano-fabric electrocatalysts. The data on Pt layer thickness, Pt loading ratios (μg cm−2), overpotentials at applied current densities of 10 mA cm−2, 20 mA cm−2, 50 mA cm−2, and 70 mA cm−2, TOF at an overpotential of 50 mV, Tafel slopes, and mass activities at an overpotential of 50 mV are summarized in Table S4 in the ESI.† The finest Pt/SWCNT electrocatalyst, with a 1 nm thin Pt layer (Pt loading: 1.16 μg cm−2), exhibited superior HER performance compared to the powdered Pt/C catalyst (Pt loading: 57 μg cm−2). Specifically, as the applied current density increased from 10 mA cm−2 to 70 mA cm−2, the overpotential for the Pt/SWCNT nano-fabric electrocatalyst increased by only 33 mV (from 16 mV to 49 mV), while it increased by 146 mV (from 26 to 172 mV) for the powdered Pt/C electrocatalyst. Additionally, both the TOF and mass activity at an overpotential of 50 mV were approximately two orders of magnitude greater than those of the powdered Pt/C electrocatalyst. Furthermore, the electrocatalytic activity remained almost unchanged even after 10000 cycles. Notably, the TOF and mass activity were very sensitive to the Pt loading. As the Pt loading increased from 1.16 μg cm−2 to 61.03 μg cm−2, the TOF decreased from 64.49 to 1.59, and the mass activity decreased from 64.17 to 1.58. The Tafel slopes for the powdered Pt/C and the Pt/SWCNT nano-fabric electrocatalysts were almost identical, indicating that the resistivities of the electrons transferring from the current-collector to the cathodic catalyst at lower applied current densities were less important for the HER. Furthermore, a comparison of our Pt/SWCNT nano-fabric electrocatalyst performance with that of previously reported Pt-based electrocatalysts is provided in Table S5 in the ESI,† based on the benchmarking protocol established by McCrory and coworkers.29
000 cycles for the four Pt/SWCNT nano-fabric electrocatalysts. The data on Pt layer thickness, Pt loading ratios (μg cm−2), overpotentials at applied current densities of 10 mA cm−2, 20 mA cm−2, 50 mA cm−2, and 70 mA cm−2, TOF at an overpotential of 50 mV, Tafel slopes, and mass activities at an overpotential of 50 mV are summarized in Table S4 in the ESI.† The finest Pt/SWCNT electrocatalyst, with a 1 nm thin Pt layer (Pt loading: 1.16 μg cm−2), exhibited superior HER performance compared to the powdered Pt/C catalyst (Pt loading: 57 μg cm−2). Specifically, as the applied current density increased from 10 mA cm−2 to 70 mA cm−2, the overpotential for the Pt/SWCNT nano-fabric electrocatalyst increased by only 33 mV (from 16 mV to 49 mV), while it increased by 146 mV (from 26 to 172 mV) for the powdered Pt/C electrocatalyst. Additionally, both the TOF and mass activity at an overpotential of 50 mV were approximately two orders of magnitude greater than those of the powdered Pt/C electrocatalyst. Furthermore, the electrocatalytic activity remained almost unchanged even after 10000 cycles. Notably, the TOF and mass activity were very sensitive to the Pt loading. As the Pt loading increased from 1.16 μg cm−2 to 61.03 μg cm−2, the TOF decreased from 64.49 to 1.59, and the mass activity decreased from 64.17 to 1.58. The Tafel slopes for the powdered Pt/C and the Pt/SWCNT nano-fabric electrocatalysts were almost identical, indicating that the resistivities of the electrons transferring from the current-collector to the cathodic catalyst at lower applied current densities were less important for the HER. Furthermore, a comparison of our Pt/SWCNT nano-fabric electrocatalyst performance with that of previously reported Pt-based electrocatalysts is provided in Table S5 in the ESI,† based on the benchmarking protocol established by McCrory and coworkers.29
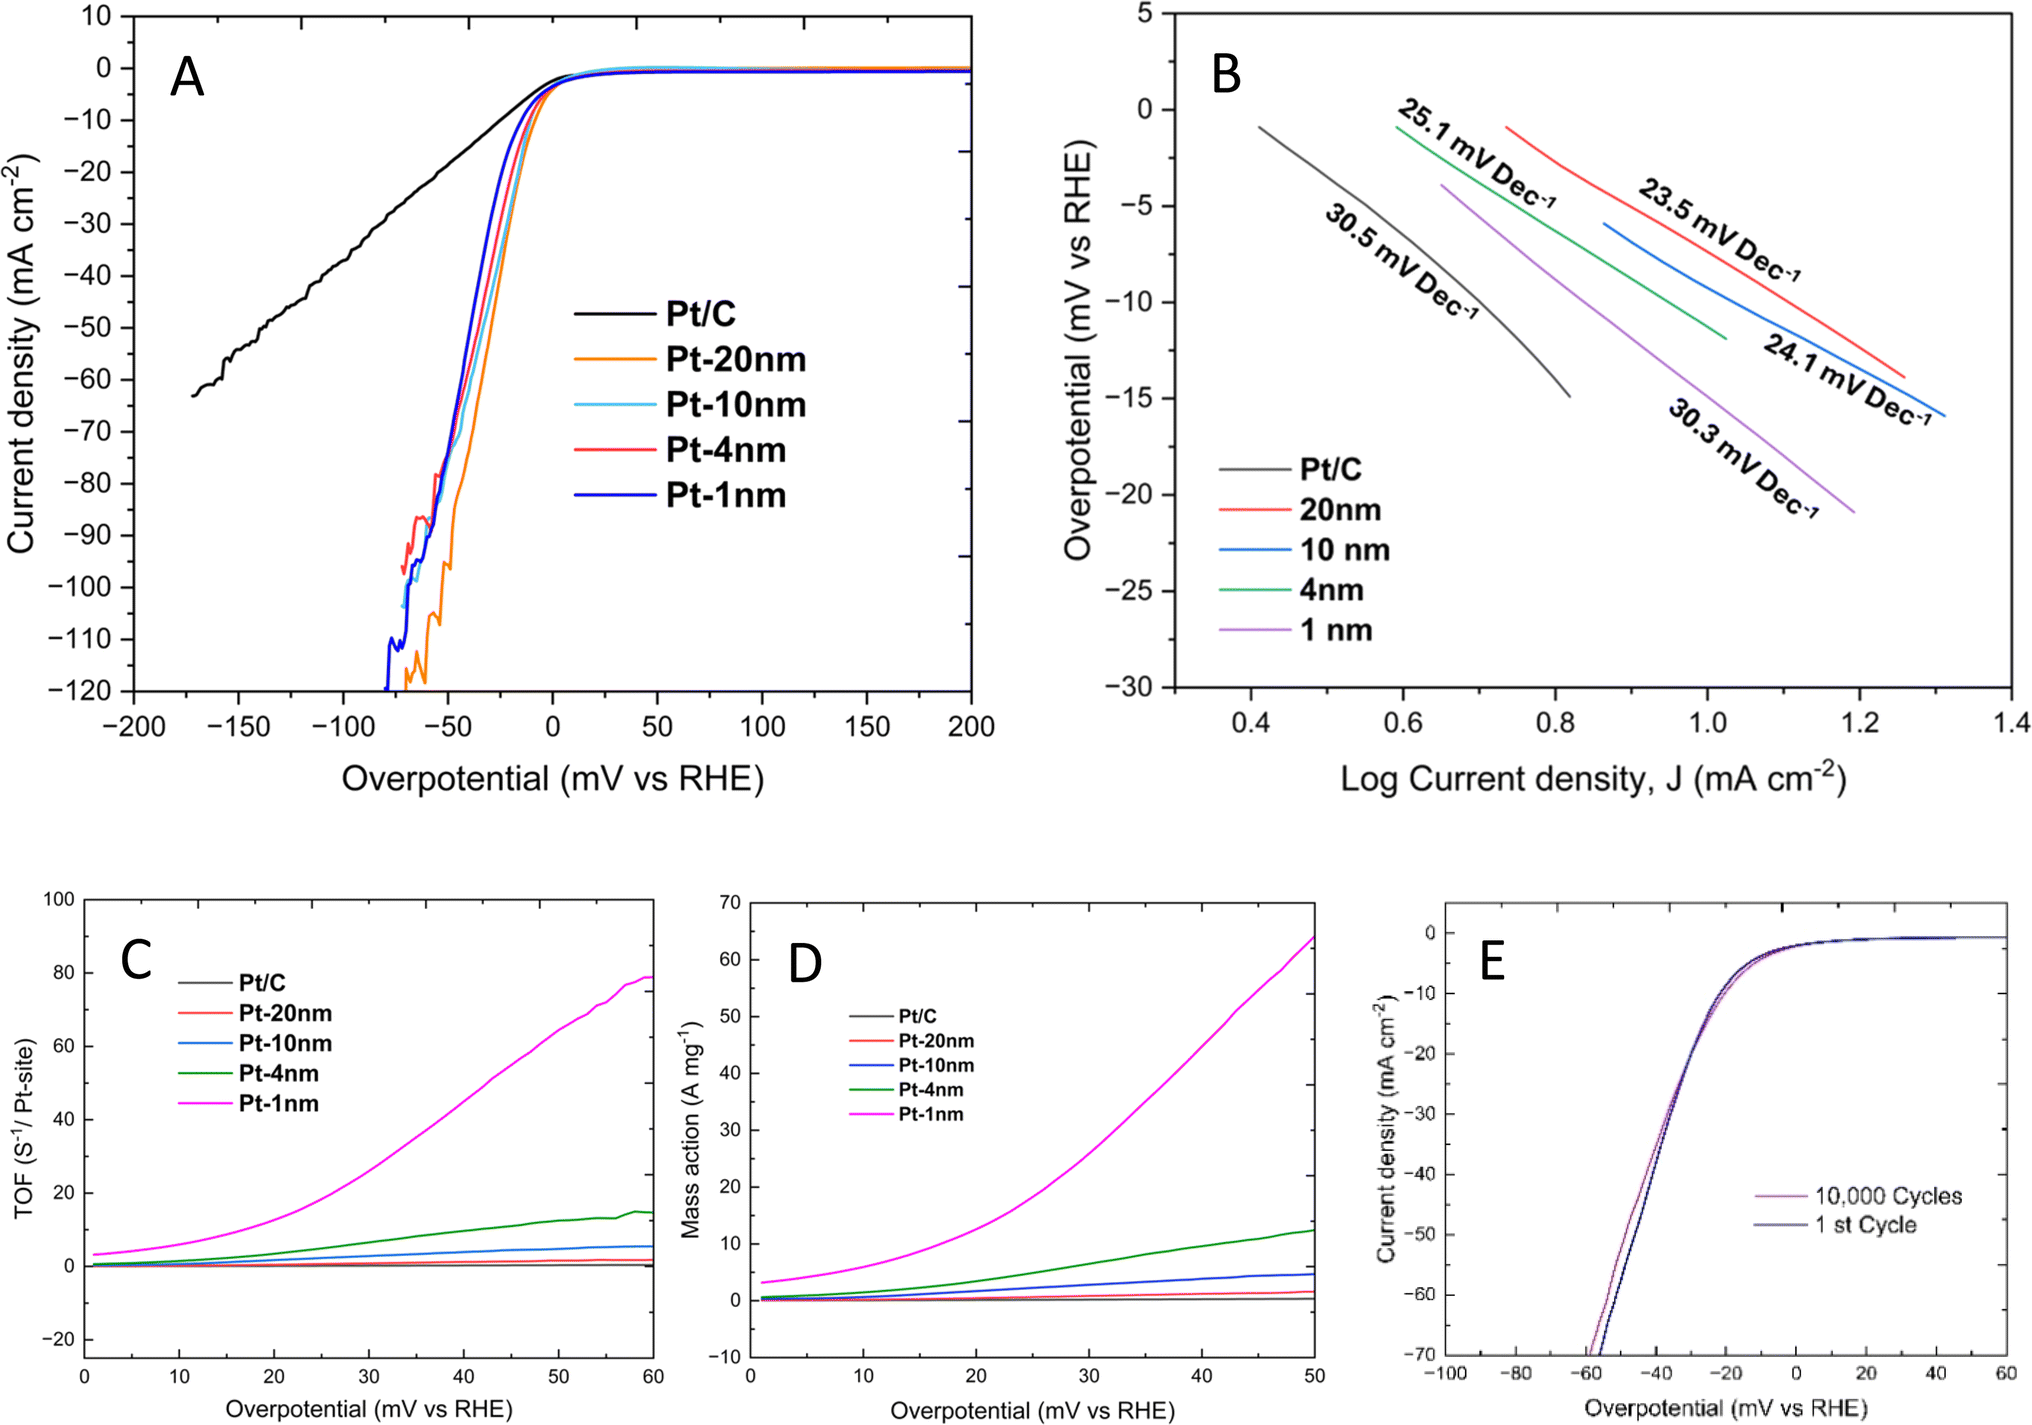 | ||
| Fig. 4 (A) HER polarization curves acquired by linear sweep voltammetry with a scan rate of 10 mV s−1, (B) linear Tafel slopes, (C) turnover frequency and (D) mass activity vs. overpotential plots, and (E) stabilities after 10000 cycles measured in an aqueous 0.5 M H2SO4 electrolyte at room temperature. | ||
Insights into the electrocatalytic properties and functions of Pt/SWCNT nano-fabric electrocatalysts obtained by using cyclic voltammetry, resonant nuclear reaction analysis, and DFT calculations
The cyclic voltammetric profiles show that the Pt/SWCNT hybridized nano-fabric electrocatalysts can capture more proton ions by forming a denser electrical double layer (EDL). We performed 93% iR correction to obtain all relevant curves.Fig. 5 shows typical cyclic voltammetric profiles obtained using Pt/SWCNT hybridized nano-fabrics as the working electrode in an aqueous 0.5 M H2SO4 solution at room temperature. The upper potential limit in the scans is set at 1.40 V (vs. RHE), slightly higher than the potential for the electrochemical splitting of water. A carbon-based porous cylinder was used as the counter electrode (ESI Fig. S7†). It's important to note that a Pt-based electrode can also be used as the counter electrode, but to prevent corrosion and thereby the transfer of Pt from the counter electrode to the working electrode, the upper potential limit should always be set below 0.9 V when a Pt electrode is used as the counter electrode. The range between the terminal of the H–Pt oxidation/reduction peak (∼0.12 V) and the beginning of the oxygen-oxidation/reduction peak (∼1.40 V) corresponds to the so-called constant electrical double-layer (EDL) charging current range.30,31 The Pt/SWCNT hybridized nano-fabrics can maintain an EDL more than 3.5 times greater than that of the powdered Pt/C electrode at an identical Pt loading, as depicted in Fig. 5A, based on the electrochemical surface area (ECSA) calculation. The entire SWCNT-based nano-fabrics also showed excellent capability for maintaining the EDL and behaving entirely as an EDL capacitor. Fig. 5B shows the typical CV profiles for the first cycle and the 50th cycle. The profiles shown in Fig. 5A and B were obtained using Pt/SWCNT hybridized nano-fabrics as the working electrodes and a carbon-based porous cylinder as the counter electrode. The scan rate was optimized at 10 mV s−1. After 30–50 CV cycles, the area of the peaks due to the oxidation of Pt–H, which reflects the total number of Pt sites on the terrace (111, 110, and 100) domains capable of forming Pt–H, increased by 2.5 times and then stabilized at that level. This indicates that the Pt atoms on the surface of the Pt/SWCNT hybridized nano-fabrics self-rearranged to the most stable form during CV cycling.
 | ||
| Fig. 5 (A) Cyclic voltammetric (CV) profiles of the Pt/SWCNT hybridized nano-fabric electrode (blue line), the powdered Pt/C electrode (black line), and the entire SWCNT nano-fabrics (red line), (B) the 1st and 50th CV profiles of the Pt/SWCNT hybridized nano-fabric electrode, (C) the typical CV profile of a typical Pt/SWCNT hybridized nano-fabric electrode with a Pt loading of 122.06 μg-Pt cm−2 (red curve) and the CV profile of the entire SWCNT nano-fabric (blue curve), in 0.5 M H2SO4. Scan rate: 10 mV S−1. (D) EIS curves of the Pt/SWCNT hybridized nano-fabric catalysts with the thickness of the Pt layers of approximately 4 nm, 10 nm, and 20 nm. | ||
To investigate the redox interactions of H–Pt, we stacked two pieces of the 20 nm-thick Pt/SWCNT nano-fabrics and used them as the working electrode to obtain the CV profiles. The CV profiles (Fig. 5C) revealed three Pt–H oxidation peaks at 0.16 V, 0.24 V, and 0.32 V, as well as three Pt–H reduction peaks at 0.31 V, 0.23 V, and 0.15 V. However, these peaks were weaker and broader compared to conventional Pt electrodes. The entire SWCNT nano-fabric also exhibited areas of the EDL in the CV profiles.
The appearance of three pairs of H–Pt redox peaks between 0.16 V and 0.32 V suggested chemical or semi-chemical bonding between hydrogen and platinum.32–34 The concentration of protons originating from Pt–H in the Pt/SWCNT hybridized nano-fabrics was estimated to be 2.5–2.8 × 10²¹ H-atom/Pt-cm3, indicating the presence of a certain amount of Pt–H even after the HER. This was determined using resonance nuclear reaction analysis (RNRA), a unique method for detecting protons on surfaces and within substrates.35,36 Additional details can be found in Fig. S8 of the ESI.†
Charge transfers in the HER are predominantly achieved by the catalyst support. The charge-transfer behaviours of the Pt/SWCNT hybridized nano-fabrics were evaluated by using electrochemical impedance spectroscopy (EIS). Fig. 5D shows the typical Nyquist plots obtained within the range of high frequency (105 Hz) and low frequency (0.01 Hz). Regardless of the thickness of the Pt layers on the free-standing SWCNT nano-fabrics, nearly identical shapes were observed in the Nyquist plots. The intercepts at the real axis in the high-frequency region, which reflect the sum of the ohmic resistances of the intrinsic resistance of the electrolyte, catalyst, catalyst support, contact resistance at the catalyst/support/current collector, and charge transfer resistance caused by the redox reactions, were 8.1 ohms, 8.6 ohms, and 9.2 ohms, respectively, for the Pt/SWCNT hybridized nano-fabrics with Pt thicknesses of 4 nm, 10 nm, and 20 nm, indicating the transfer of electrons from the anode to the cathodic catalyst was predominantly accomplished via the SWCNT nano-fabrics, i.e., the catalyst support. The average roughness of the surface of the SWCNT nano-fabrics was calculated to be approximately 30 nm based on the AFM image data (ESI, Fig. S9†). This finding demonstrated the advantageous properties of the SWCNT nano-fabrics as supports/templates, which minimized the contact resistance of the catalyst/support/current collector. The lines in the low-frequency region were almost vertical, indicating that the diffusion resistance of proton ions from the bulk electrolyte to the EDL was very small and could be ignored.37
The binding energies of Pt-SWCNT (14,0) and H–Pt/SWCNT (14,0) were calculated using density functional theory (DFT). Strong interactions (−2.22 eV) between Pt and SWCNT (14, 0) were observed, as well as between H and Pt/SWCNT (14,0) (−0.25 eV). Additionally, the Pt(111)/SWCNT (14,0) nano-fabrics exhibited a near-zero (−0.01 eV) Gibbs free energy, demonstrating a similar behavior to bulk Pt for hydrogen adsorption/desorption (ESI,† DFT calculations).
Discussion
In the first part, we look at why overpotential occurs in the process of the HER. According to Heyrovsky's observation, the overpotential in HER happens because it's challenging to produce and merge hydrogen atoms into hydrogen molecules.38 Heyrovsky's theory suggests that the generation and combination of hydrogen atoms into hydrogen molecules mostly occur through what's known as Heyrovsky's reaction:| M–H−e + H+ ⇔ H2 + M, |
where Δπ is the overpotential, and [H+] is the concentration of H+ ions in the bulk electrolyte. Our study found that using SWCNT nano-fabrics as Pt supports resulted in a higher {H+} concentration and a lower overpotential due to the larger effective surface areas.

In addition to Heyrovsky's reaction, Tafel noted the following Tafel reaction; here, the combination of the hydrogen atoms to form hydrogen molecules is achieved as follows:2
| M–H + M′–H ⇔ H2 + M + M′ |
It explains that two active sites, labeled M and M′, positioned nearby, on the cathodic catalyst, each has bound a hydrogen atom that is generated through the electrochemical reactions. These two hydrogen atoms then combine to form a hydrogen molecule. The Tafel reaction also means that the formation of hydrogen molecules becomes easier by narrowing the widths of the terrace domains of the electrocatalysts.
In addition, it emphasizes that regardless of Heyrovsky's reaction and/or Tafel's reaction, the crucial step in forming hydrogen molecules is the generation of hydrogen atoms on cathodic catalysts, known as the Volmer step:
| {H+} + e− + M ⇔ M–H |
The H+ ions in both the electrical double layer (EDL) and in the bulk electrolyte are always combined with water, forming hydronium ions, H3O+. Therefore, the Volmer step can be represented by the following reaction, as suggested by Conway and Salomon:39
| {H3O+} + 2 M + e−⇔ M·H + H2O·M |
The presence of additional hydrogen bonds (HBs) causes H3O+ to bond with more water molecules and stabilize as (H2O)4H+.40 The strength of the HBs is anisotropic, with the strongest bond calculated to be 13.8 kJ mol−1,40 approximately 5 times stronger than the HBs in bulk liquid water. The remarkably strong HBs in the hydronium ion significantly contribute to the overpotential in the HER. This challenge is addressed in our study by enhancing the discharge capability using SWCNT nano-fabrics as Pt supports.
Upon receiving an electron, the hydrated proton ion is transformed into a hydrogen atom, leaving four water molecules on the Pt surface. The Pt terrace (111, 110, and 100) domains exhibit high affinities for adsorbing both hydrogen atoms and water molecules.41–43 A study on the competition for adsorption on Pt (111) between hydrogen atoms and water molecules revealed that the adsorbed water molecules can destabilize both the binding behavior and the bond strength of Pt–H.44 The competition for adsorption between hydrogen atoms and water molecules on Pt is another major cause of the overpotential in the HER. This obstacle in our research is counteracted by narrowing the widths of the Pt terrace domains using SWCNT nano-fabrics as templates and supports.
Let's now focus on the role of Pt atoms on the catalyst surface. During the discharge process, electrons flow from the current collector to hydronium ions through a cathodic catalyst, primarily achieved through the Volmer step. Structural observations (Fig. 2C and ESI Fig. S10†) show that the terrace (111, 110, and 100) domains of the Pt/SWCNT hybridized nano-fabrics have a narrow width, only a few nanometers. These nanocrystalline orientations create numerous active sites on the catalyst surfaces' edges and steps. Analysis of the XPS data of the Pt/SWCNT hybridized nano-fabrics (Fig. 3B) leads to the conclusion that the active sites on the edges and steps are oxidized. These oxidized sites have semiconductive properties and can trap electrons within the metallic terrace domains. The discharge process takes place automatically through the oxidized sites once the electrons accumulate beyond the capacity of the metallic terrace domains.
We now focus on the challenges encountered when transferring electrons from current collectors to catalysts via catalyst supports. The difficulty level is mainly determined by the overall electrical resistivity encountered within the current collector, catalyst support, and catalyst. The Tafel slope is commonly used to estimate electrical resistivities involved in the Volmer step. However, the linearity of the Tafel plot is typically limited to a range of 10 to 150 mA cm−2 of the applied current densities.45 In actual hydrogen generation via electrolysis cells, the applied current densities are commonly greater than 1000 mA cm−2.46–49 Based on the EIS data (see Fig. 5D), the overall electrical resistivity involved in the HER is predominantly determined by the electrical properties of the catalyst support. SWCNT nano-fabrics exhibit excellent electrical properties, making them highly desirable as catalyst supports.
It's important to note that hydrogen spillover can hinder the formation of hydrogen molecules on the catalyst; this phenomenon must be considered, especially when high current densities are applied. Hydrogen spillover has inevitably occurred in traditional powder-form Pt/C catalysts. However, in the case of the Pt/SWCNT hybridized nano-fabric catalysts, the hydrogen spillover is highly suppressed because the surface of the catalyst support is almost completely covered by the nano-thin Pt layers.
Based on our experimental data and the DFT calculations, we propose a new model, as shown in Fig. 6, to describe the electrocatalytic functions of the active sites on edges, steps, and the terrace domains. The key concepts of this new model are summarized as follows:
 | ||
| Fig. 6 A schematic representation of the electrocatalytic functions of the active sites on the Pt/SWCNT hybridized electrocatalysts for processing the HER. (A) A nano-thin Pt layer formed on two tubes positioned closely in the SWCNT nano-fabrics, creating narrow terrace (111, 110, and 100) domains and multiple sites on steps and edges. (B) Pt atoms on the terrace (111, 110, and 100) domains; these are the metallic sites, while those on the steps and edges are the oxidized sites. (C) Electrons accumulate within the metallic terrace domains with the oxidized sites as barriers, then discharge through the oxidized sites. The hydronium ions involved in the electrical double layer (EDL) receive electrons and split into hydrogen atoms and water molecules. The hydrogen atoms are captured by forming H–Pt with metallic sites on the terrace domains, and most of the water molecules are excluded. (D) Hydrogen molecules formed once the concentration of H–Pt exceeds the critical concentration for H2 formation. | ||
(1) The initial step of the HER involves maintaining the hydronium ions within a specific range of electron discharge by creating an electric double layer (EDL). The number of hydronium ions involved in the EDL is proportionate to the surface area of the catalyst and its support.
(2) On the catalyst surface, all active sites are important but they function differently. The sites on the edges and steps are oxidized and act as atomic dams where electrons accumulate in the terrace (111, 110, and 100) domains, enabling electron discharge. The sites on the terrace (111, 110, and 100) domains are metallic and capture hydrogen atoms and water molecules, and form H–Pt and Pt/H2O, respectively.
(3) Continual H–Pt formation in the metallic terrace (111, 110, and 100) domains excludes water and leads to the hydrogen molecule formation through either Tafel's reaction: H–Pt + H–Pt′ ⇔ H2↑ + Pt + Pt′ or Heyrovsky's reaction: Pt–H−e + H+ ⇔ H2↑ + Pt.
(4) Increasing the number of active sites on edges and steps speeds up the discharge. Reducing the width of metallic terrace domains (111, 110, and 100) promotes the formation of hydrogen molecules. Both goals can be achieved using SWCNT-based nano-fabrics as the templates and supports.
(5) The durability of the Pt/SWCNT hybridized electrocatalysts is maintained through specific interactions between the nano-thin Pt layer and the highly uniform sp2-hybridized surface of the SWCNT-based nano-fabrics.
Water electrolysis via the PEM cells with Pt/SWCNT hybridized nano-fabric catalysts operated at high current densities
The water electrolysis experiment used Nafion-117 as a solid electrolyte. A piece of Nafion-117 with 1000 μg cm−2 of IrO2 on one side was purchased from Mic Lab, and our Pt/SWCNT hybridized nano-fabric catalyst was attached to the other side using 5% Nafion as a binder. Two Pt/SWCNT-based CCMs with different Pt loading ratios on the cathode (6.03 μg cm−2 with a Pt layer thickness of 4 nm and 16.43 μg cm−2 with a Pt layer thickness of 10 nm) were prepared. The setup of the PEM water electrolysis cell and photos of the CCM cathode and CCM anode are shown in ESI Fig. S11.†Fig. 7A displays typical current–voltage (I–V) curves at 80 °C. An I–V curve obtained using powdered Pt/C with a Pt loading of 500 μg cm−2 as the cathodic catalyst and IrO2 at 1000 μg cm−2 as the anodic catalyst is also provided in Fig. 7A for comparison. The electrocatalytic performance of the 4 nm thin Pt (Pt loading: 6.03 μg cm−2) Pt/SWCNT nano-fabric catalyst was found to be comparable to or even better than that of the powdered Pt/C (Pt loading: 500 μg cm−2) catalyst. The performance of the 10 nm thin Pt (Pt loading: 16.43 μg cm−2) Pt/SWCNT nano-fabric catalyst was significantly superior to that of the powdered Pt/C (Pt loading: 500 μg cm−2) catalyst. | ||
| Fig. 7 (A) Current–voltage curves obtained using a 2 cm × 2 cm single electrolysis cell at 80 °C and atmospheric pressure of gases. The cathodic catalysts used were: Pt/SWCNT nano-fabrics with Pt loadings of 6.03 μg cm−2 (4 nm thick) and 16.43 μg cm−2 (10 nm thick), as well as powdered Pt/C with a Pt loading of 500 μg cm−2. The anodic catalyst used was IrO2 at 1000 μg cm−2, and the electrolyte was Nafion-117 membrane. In (B), cell current density stability tests were carried out during PEM water electrolysis at high-voltage/high-current density (1.99 V, 2.5 A cm−2). These tests were conducted for over 300 hours. | ||
Fig. 7B presents experimental data evaluating the stability of a PEM cell with Pt/SWCNT nano-fabrics (Pt loading: 16.43 μg cm−2) as the cathodic catalyst operated at a high voltage (1.99 V) and a high current density (2.5 A). The current stability test ran for more than 300 hours, and the current densities remained almost constant at 2.5 A cm−2, indicating the superior electrocatalytic performance of the Pt/SWCNT nano-fabric catalysts even at high operating current densities. Additionally, the electrocatalytic performance of our Pt/SWCNT nano-fabric catalysts was found to be superior to that reported for the state-of-the-art nanostructured thin-film Pt catalysts.50,51
The efficiency of the PEM electrolysis cell was assessed by measuring the volume of hydrogen produced during water hydrolysis. Table 1 summarizes the cell voltage, applied current density, volume of hydrogen generation, and hydrolysis efficiency data.
| Current density (A cm−2) | Voltage (V) | Hydrogen volume (mL min−1) | Theoretical hydrogen volume (mL min−1) | Electrolysis efficiency (%) |
|---|---|---|---|---|
| 1 | 1.69 | 7.84 | 7.956 | 98.5 |
| 1.5 | 1.79 | 11.84 | 11.835 | 100 |
| 2 | 1.89 | 15.85 | 17.796 | 89.1 |
| 2.5 | 1.99 | 20.28 | 23.422 | 86.6 |
| 3 | 2.09 | 24.07 | 29.519 | 81.5 |
Conclusion
We have developed a scalable method for preparing multifunctional SWCNT-based nano-fabrics using dispersed single-walled carbon nanotubes (SWCNTs) and functionalized cellulose nanofibers (CNFs). These SWCNT-based nano-fabrics serve as templates and supports for creating Pt/SWCNT hybridized nano-fabric electrocatalysts with high performance for performing the hydrogen evolution reaction (HER). Our experimental data, along with Density Functional Theory (DFT) calculations, have provided insights into the electrochemistry of the HER on the Pt/C electrocatalysts. We have proposed a new model for the discharge through active sites on edges and steps, as well as for the formation of hydrogen molecules through active sites on the terrace (111, 110, and 100) domains. Additionally, we have discussed the origins of the overpotential based on the nature of hydronium ions and the electrochemical reactions involved in hydrogen atom generation and hydrogen molecule formation on the Pt/C electrocatalysts. These multifunctional SWCNT-based nano-fabrics, serving as templates and supports, provide a nanotechnological solution for reducing the platinum dosage and can be applied to other precious-metal-based electrocatalysts. Finally, direct and in situ observation of the electrochemical functionality of the active sites on edges and steps of the electrocatalyst in the HER remain challenges, relative research and the use of the Pt/SWCNT hybridized nano-fabric catalysts as free-standing electrodes in conventional HER measurements and PEM cells are under investigation.Materials and methods
Materials and chemicals
Preparation of SWCNT dispersions
The following materials were pre-dispersed in 1000 mL of deionized water using a Masuda Universal Ball Mill model UBM-2 for approximately 36 hours: 7.5 g of TUBALL SWCNT powders, 15 g of sodium cholate (dispersant), 10 g of polyvinylpyrrolidone (stabilizer), and 10 g of hydroxypropyl cellulose (stabilizer). The pre-dispersed SWCNTs were then further dispersed using a Multi Lab DYNO-Mill and 0.6 mm zirconium beads until a good dispersion was achieved.Preparation of the SWCNT-based nano-fabrics as templates/supports for the formation of Pt/SWCNT hybridized nano-fabric electrocatalysts
Step 1: preparation of the preliminary free-standing sheets. A specific amount of the SWCNT/TEMPO-CNF mixed slurries was poured into a polytetrafluoroethylene (PTFE) based tray. This mixture was then dried under open air at temperatures of 35–40 °C until a paper-like sheet formed.
Step 2: purification of the preliminary free-standing sheets. The preliminary SWCNT/TEMPO-CNF sheet was initially washed with 80% ethanol to remove dispersant (sodium cholate) and stabilizers (PVP and HPC). TEMPO-CNFs are insoluble in 80% ethanol but function as reinforcers by forming dual nanonetworks with SWCNTs. The ethanol-washed sheet was dried again and then immersed in concentrated nitric acid to eliminate any metal or metal oxide residuals present in the as-purchased SWCNTs. The sodium ions of the TEMPO-CNFs were replaced by proton ions from the nitric acid. The acidified TEMPO-CNFs are insoluble in water. The nitric acid-washed sheet was then rinsed several times with deionized water and then dried under open air at temperatures of 35–40 °C.
Step 3: conversion of the TEMPO-CNFs into amorphous carbon through carbonization. The purified sheet was heated at 900 °C under nitrogen. This process converted TEMPO-CNFs into amorphous carbon nanoparticles, which served as stoppers preventing the reaggregation of SWCNTs.
Step 4: refinement of the SWCNT-based nonwoven nano-fabrics through oxidation. The amorphous carbon nanoparticles involved in the carbonized SWCNT nano-fabrics were finally eliminated at 900 °C by using carbon dioxide as an oxidant.
Preparation of Pt/SWCNT hybridized nano-fabric electrocatalysts via SWCNT-based nano-fabrics as templates/supports
The SWCNT-based nano-fabrics were cut into the desired sizes and placed in a magnetron sputtering chamber. Platinum was deposited using an Ar+ ion beam at 15 W and 0.4 Pa, with a sputtering yield of 0.05 nm s−1. Four different Pt/SWCNT hybridized nano-fabrics were prepared, with Pt thicknesses of approximately 1 nm, 4 nm, 10 nm, and 20 nm on the SWCNT nano-fabrics.Material characterization
The morphology and elemental distribution of the SWCNT-based nano-fabrics and the Pt/SWCNT hybridized nano-fabrics were observed using JEOL scanning electron microscopy (SEM) models JSM-7500FA and JSM-7000F. Transmission electron microscopy (TEM) analysis was conducted with a high-contrast electron microscope with the plate number JEM-1400 (JEOL). X-ray photoelectron spectroscopy (XPS) was performed using a multifunctional scanning XPS instrument, VersaProbe by ULVAC-PHI, with the plate number PHI5000. The Brunauer, Emmett, and Teller (BET) surface area was analyzed through nitrogen adsorption/desorption isotherms using a Beckman Coulter SA™ 3100 analyzer. Raman spectra were measured using a Renishaw inVia Raman microscope equipped with a 532 nm laser and calibrated against a silicon wafer reference. X-ray diffraction (XRD) analysis was conducted with a Rigaku Smart Lab X-ray diffractometer using Cu-Kα radiation (λ = 1.5418 Å) at 40 kV and 30 mA, with a scanning speed of 0.5 min−1, and a range (2θ) of 20–90° for the reflection model and 20–60° for the penetration model. The atomic force microscope (AFM) utilized was a Shimadzu scanning probe microscope/atomic force microscope SPM-9700HT (Kyoto, Japan) operating in tapping mode. The resonance 1H(15N,αγ)12C nuclear reaction measurement was carried out using the 5 MV tandem-type van de Graaff accelerator at the Micro Analysis Laboratory, Tandem Accelerator (MALT) at the University of Tokyo.Electrochemical measurements
Glassy carbon electrodes (GCEs) with a 3 mm diameter, obtained from CHI Instruments, were used to support the Pt catalysts for electrochemical measurements in half-cells. The GCEs were polished using a polishing diamond suspended in distilled water on a diamond polishing pad, followed by polishing with alumina fine powders suspended in distilled water on an alumina polishing pad. After each polishing step, the electrodes were thoroughly rinsed with deionized water. Before loading with catalysts and/or catalyst supports, the GCE electrodes were cleaned by immersing them in an isopropanol solution and sonicating them for approximately 10 s. Then, 2 μL of 0.5 wt% Nafion were added drop by drop in ethanol onto the cleaned GCE. The Pt/SWCNT hybridized nano-fabric catalyst was carefully cut into a 3 mm diameter circle and placed on the GCE before drying the Nafion binders. The electrodes were dried overnight under ambient conditions before being used for electrochemical measurements. For the electrodes with the traditional powdered Pt/C catalyst, 50 mg of commercially available Pt/C (5% Pt loading) powders were dispersed in 1 mL of Nafion solution (0.5 wt% in ethanol) and sonicated in an ultrasonic bath for 30 minutes to prepare a homogeneous ink. A 4 μL of the Pt/C ink was then deposited onto the GCE to prepare the electrode.The electrocatalytic activity tests were carried out in a standard three-electrode system using an electrochemical analyzer (model CHI 760E, CH Instruments). A porous carbon cylinder and an Ag/AgCl electrode were used as the counter electrode and the reference electrode, respectively. The experiments were conducted in 0.5 M H2SO4 at room temperature.
Water electrolysis PEM cells
We fabricated proton exchange membrane (PEM) cells for water electrolysis. We prepared a catalyst-coated membrane (CCM) with a 4 cm2 area by using Pt as the cathodic catalyst and commercially available iridium oxide as the anodic catalyst. For the anode, we applied commercially available iridium oxide in 5% Nafion on one side of the Nafion 117 membrane, followed by a hot press. The mass loading of iridium oxide was 1000 μg cm−2, controlled by selecting the appropriate amount of iridium oxide in 5% Nafion ink. On the other side of the Nafion 117, we fixed the Pt/SWCNT hybridized nano-fabrics using 5% Nafion solution as a binder, followed by hot pressing. The amount of platinum loaded on the SWCNT nano-fabrics was accurately measured. The Pt/SWCNT hybridized nano-fabric catalyst was dissolved in aqua regia using a microwave digestion system, followed by quantitative analysis via ICP-MS. We used Pt-coated titanium mesh and carbon cloths as gas diffusion layers for the anode and cathode, respectively. To activate the PEM cell initially, we performed 12 cycles (2 hours) between the potential range of 1 V and 2.2 V at 5 mV s−1. Ultrapure water was used throughout the PEM electrolysis study. After the activation, an I–V curve was obtained at a step speed of 10 mV s−1 in the potential range of 1 V to 2.2 V.Data availability
Data supporting the findings of this study are available within the article (and its ESI files†). All other data are available from the corresponding authors upon request.Author contributions
V. A. K., B. F., and I. S. conceived the project. V. A. K. carried out the experiments. B. F. and M. E. proposed the catalytic model. W. M. carried out the RNRA measurements and conducted the density functional theory (DFT) simulations under the guidance of K. F. and H. M. Y. T. carried out the BET and AFM measurements. W. G. carried out the electrochemical impedance spectroscopy (EIS) measurements. V. A. K., S. K., and Y. H. designed the PEM cell. K. T. analyzed the data. B. F. wrote the manuscript with contributions from all authors.Conflicts of interest
All authors have no conflicts of interest to disclose.Acknowledgements
The material characterizations were conducted at the Advanced Characterization Nanotechnology Platform of the University of Tokyo (project ID: 22UT0241) and Advanced Materials Research Infrastructure (project ID: 23UT-0048) supported by the Ministry of Education, Culture, Sports, Science and Technology (MEXT), Japan. We also acknowledge the partial support provided by Grants-in-Aid for Scientific Research from the Japan Society for the Promotion of Sciences (JSPS KAKENHI) through Grants No. JP18H05518 and JP21H04650.References
- J. F. Chittum, Nature, 1959, 28, 589–590 CrossRef.
- J. Tafel, Zeit. Physik. Chem., 1905, 50, 641–712 CrossRef.
- J. Tafel, Zeit. Physik. Chem., 1900, 34, 187–228 CrossRef.
- A. Eftekhari, Int. J. Hydrogen Energy, 2017, 42, 11055–11077 Search PubMed.
- S. Khoobiar, J. Phys. Chem., 1964, 68, 411–412 CrossRef CAS.
- W. Karim, C. Spreafico, A. Kleibert, J. Gobrecht, J. VandeVondele, Y. Ekinci and J. A. van Bokhoven, Nature, 2017, 541, 68–71 CrossRef PubMed.
- J. Li, J. Hu, M. Zhang, W. Gou, S. Zhang, Z. Chen, Y. Qu and Y. Ma, Nat. Commun., 2021, 12, 3502, DOI:10.1038/s41467-021-23750-4.
- S. A. Grigoriev, P. Millet and V. N. Fareev, J. Power Sources, 2008, 177, 281–285 CrossRef.
- D. Liu, X. Li, S. Chen, H. Yan, C. Wang, C. Wu, Y. Haleem, S. Duan, J. Lu, B. Ge, P. Ajayan, Y. Luo, J. Jiang and L. Song, Nat. Energy, 2019, 4, 512–518 CrossRef.
- K. Khedekar, A. Zaffora, M. Santamaria, M. Coats, S. Pylypenko, J. Braaten, P. Atanassov, N. Tamura, L. Cheng, C. Johnston and I. V. Zenyuk, Nat. Cat., 2023, 6, 676–686 CrossRef.
- W. Yu, H. Huang, Y. Qin, D. Zhang, Y. ZZhang, K. Liu, Y. Zhang, J. Lai and L. Wang, Adv. Energy Mater., 2022, 12, 2200110 CrossRef.
- Q. Pan, Y. Wang, B. Chen, X. Zhang, D. Lin, S. Yan, F. Han, H. Zhao and G. Meng, Small, 2024, 20, 2309067 CrossRef PubMed.
- C. Li, Z. Wang, M. Liu, E. Wang, B. Wang, L. Xu, K. Jiang, S. Fan, Y. Sun, J. Li and K. Liu, Nat. Commun., 2022, 13, 3338, DOI:10.1038/s41467-022-31077-x.
- D. F. van der Vilet, C. Wang, D. Tripkovic, D. Strmcnik, X. Zhang, M. K. Debe, R. T. Atanasoski, N. M. Markovic and V. R. Stamenkovic, Nat. Mater., 2012, 11, 1051–1057 CrossRef PubMed.
- S. Higashi, T. Tachikawa, K. oh-ishi, K. Shigetoh, K. Takeuchi and A. Beniya, J. Mater. Chem. A, 2020, 8, 25061–25072 RSC.
- M. Endo, H. Muramatsu, T. Hayashi, Y. A. Kim, M. Terrones and M. S. Dresselhaus, Nature, 2005, 433, 476 CrossRef CAS PubMed.
- S. Lu and B. Panchapakesan, Nanotechnology, 2006, 17, 1843–1850 CrossRef CAS.
- M. Zhang, S. Fang, A. A. Zakhidov, S. B. Lee, A. E. Aliev, C. D. Williams, K. R. Atkinson and R. H. Baughman, Science, 2005, 309, 1215–1219 CrossRef CAS.
- J. W. Singleton, H. E. Misak and S. Mall, Mater. Des., 2017, 116, 199–206 CrossRef CAS.
- T. Saito, Y. Nishiyama, J. Putaux, M. Vignon and A. Isogai, BioMacromolecules, 2006, 7, 1687–1691 CrossRef CAS PubMed.
- A. Isogai, T. Saito and H. Fukuzumi, Nanoscale, 2011, 3, 71–85 RSC.
- A. E. Reif, J. Phys. Chem., 1952, 785–788 CrossRef.
- S. C. Tsang, P. J. F. Harris and M. L. H. Green, Nature, 1993, 362, 520–522 CrossRef.
- A. M. Rao, E. Richter, s. Bandow, B. Chase, P. C. Eklund, K. A. Williams, S. Fang, K. R. Subbaswamy, M. Menon, A. Thess, R. E. Smalley, G. Dresselhuas and M. S. Dresselhaus, Science, 1997, 275, 187–191 CrossRef PubMed.
- A. Jorio and R. Saito, J. Appl. Phys., 2021, 129, 021102 CrossRef.
- Y. Liu, X. Shi, T. Wu, H. Wu, Y. Man, T. Cao, D. Wang, W. Liu, M. Li, Q. Liu and Z. Chen, Nat. Commun., 2024, 15, 3426, DOI:10.1038/s41467-024-47417-y.
- B. Lesiak, L. Kover, J. Toth, J. Zemek, P. Jiricek, A. Kromka and N. Rangam, Appl. Surf. Sci., 2018, 452, 223–231 CrossRef.
- B. Yue, Y. Ma, H. Tao, L. Yu, G. Jian, X. Wang, X. Wang, Y. Lu and Z. Hu, J. Mater. Chem., 2008, 18, 1747–1750 RSC.
- C. C. McCrory, S. Jung, I. M. Ferrer, S. M. Chatman, J. C. Peters and T. F. Jaramillo, J. Am. Chem. Soc., 2015, 137, 4347–4357 CrossRef CAS PubMed.
- J. Solla-Gullon, P. Rodriguez, E. Herrero, A. Aldaz and J. M. Feliu, Phys. Chem. Chem. Phys., 2008, 10, 1359–1373 RSC.
- N. M. Markovic, N. S. Marinkovic and R. R. Adzic, J. Electroanal. Chem., 1988, 241, 309–328 CrossRef CAS.
- J. C. Huang, W. E. O'Grady and E. Yeager, J. Electrochem. Soc., 1977, 124, 1732–1737 CrossRef CAS.
- B. E. Conway, H. Angerstein-Kozlowska and W. B. A. Sharp, Anal. Chem., 1973, 45, 1331–1336 CrossRef CAS.
- R. Parsons, Croat. Chem. Acta, 1980, 53(2), 133–146 CAS.
- M. Wilde and K. Fukutani, Surf. Sci. Rep., 2014, 69, 196–295 CrossRef CAS.
- J. Chen, W. Mao, L. Gao, F. Yan, T. Tajima, N. Chen, Z. Chen, H. Dong, B. Ge, P. Zhang, X. Cao, M. Wilde, Y. Jiang, T. Terai and J. Shi, Adv. Mater., 2020, 32, 1905060 CrossRef CAS PubMed.
- S. Wang, J. Zhang, O. Gharbi, V. Vivier, M. Gao and M. Orazem, Nat. Rev., 2021, 1, 41, DOI:10.1038/s43586-021-00039-w.
- J. Heyrovsky, Recl. Trav. Chim. Pays-Bas, 1925, 44(6), 499–502 CrossRef CAS.
- B. E. Conway and M. Salomon, Electrochim. Acta, 1964, 9, 1599–1615 CrossRef CAS.
- O. Markovitch and N. Agmon, J. Phys. Chem. A, 2007, 111, 2253–2256 CrossRef CAS PubMed.
- W. Zheng and A. Tadjeddine, J. Chem. Phys., 2003, 119, 13096–13099 CrossRef CAS.
- M. Naderian and A. Groβ, J. Chem. Phys., 2016, 145(1–7), 094703 CrossRef PubMed.
- H. Ogasawara and M. Ito, Chem. Phys. Lett., 1994, 221, 213–218 CrossRef CAS.
- G. Yang, S. A. Akhade, X. Chen, Y. Liu, M. S. Lee, V. A. Glezakou, R. Rousseau and J. A. Lercher, Angew. Chem., 2019, 131, 3565–3570 CrossRef.
- G. T. Burstien, Corros. Sci., 2005, 47, 2858–2870 CrossRef.
- L. J. Nuttall, A. P. Fickett and W. A. Titterington, Hydrogen generation by solid polymer electrolyte water electrolysis, in Hydrogen Energy: Part A, ed. T. N. Viziroglu, Plenum Press, New York, 1975, pp. 441–455 Search PubMed.
- M. Carmo, D. L. Fritz, J. Mergel and D. Stolten, Int. J. Hydrogen Energy, 2013, 38, 4901–4934 CrossRef CAS.
- P. Millet, D. Dragoe, S. Grigoriev, V. Fateev and C. Edievant, Int. J. Hydrogen Energy, 2009, 34, 4974–4982 CrossRef CAS.
- S. Siracusano, V. Baglio, N. Briguglio, G. Brunaccini, A. Di Blasi, A. Stassi, R. Ornelas, E. Trifoni, V. Antonucci and A. S. Arico, Int. J. Hydrogen Energy, 2012, 37, 1939–1946 CrossRef CAS.
- M. K. Debe, et al. , J. Electrochem. Soc., 2012, 159, K165–K176 CrossRef CAS.
- M. K. Debe, A. J. Steinbach and K. Noda, ECS Trans., 2006, 3(1), 835–853 CrossRef.
Footnote |
| † Electronic supplementary information (ESI) available. See DOI: https://doi.org/10.1039/d4ta04887c |
| This journal is © The Royal Society of Chemistry 2024 |