
 Open Access Article
 This Open Access Article is licensed under a
 Creative Commons Attribution 3.0 Unported Licence
Stabilizing a Ru single atom catalyst through electronic metal–support interaction with a NiCo2O4 support for overall water splitting and urea electrolysis†
Astha
Gupta
a,
Swarup
Ghosh
 b,
Dinesh
Bhalothia
c,
Sadhasivam
Thangarasu
d,
Biplab
Ghosh
e,
Rajashri
Urkude
e,
Joydeep
Chowdhury
b and
Surojit
Pande
*a
b,
Dinesh
Bhalothia
c,
Sadhasivam
Thangarasu
d,
Biplab
Ghosh
e,
Rajashri
Urkude
e,
Joydeep
Chowdhury
b and
Surojit
Pande
*a
aDepartment of Chemistry, Birla Institute of Technology and Science, Pilani, Rajasthan 333031, India. E-mail: spande@pilani.bits-pilani.ac.in
bDepartment of Physics, Jadavpur University, 188, Raja S.C. Mallick Road, Kolkata, 700032, India. E-mail: joydeep.chowdhury@jadavpuruniversity.in
cDepartment of Engineering and System Science, NTHU, Taiwan
dSchool of Chemical Engineering, Yeungnam University, Gyeongsan 38541, Republic of Korea
eBeamline Development and Application Section, Bhabha Atomic Research Centre, Mumbai 400085, India
First published on 2nd August 2024
Abstract
Single atom catalysts have manifested themselves as a new frontier in heterogeneous catalysis owing to their maximum atom utilization efficiency. However, their tendency to aggregate leads to poor stability, which limits their application. Herein, we overcome this challenge by stabilising a noble metal single atom catalyst through anchoring it on a metal oxide support, where a strong electronic metal–support interaction prevents their aggregation. Specifically, we have synthesized Ru single atoms anchored on the NiCo2O4 support by using an ultra-low amount of Ru. XAS and HAADF-STEM analysis confirm the presence of isolated Ru single atoms on the support. These isolated Ru atoms have a high density of unoccupied orbitals, which is favourable for electrocatalytic activity. The synthesized Ru single atom catalyst (Ru-SAC) on NiCo2O4 shows superior activity for overall water splitting with a cell potential of 1.57 V, showing excellent stability of 60 h. The synthesized Ru-SAC NiCo2O4 is also active in urea electrolysis and exhibits a cell potential of 1.41 V to generate a current density of 10 mA cm−2. Density functional calculations reveal that supported single Ru atoms optimized the binding energies of the intermediate of both the HER and OER.
1. Introduction
Currently, fossil fuels are the most widely used source of energy in the world, and this heavy reliance has caused their rapid depletion and environmental issues.1 To address this concern, we must seek more abundant, cleaner, and affordable energy sources. Electrocatalytic water splitting is considered as the most reliable method for hydrogen and oxygen generation, providing a pathway towards sustainable energy.2 During electrocatalytic water splitting, two half-cell reactions called the hydrogen and oxygen evolution reactions (HER and OER) take place on the cathode and the anode, respectively. The HER is a two-electron transfer process while the OER is a multi-step four-electron transfer process with an intricate reaction mechanism, which makes it sluggish in nature.3,4 To drive the electrocatalytic water splitting reaction, it is required to overcome the energy barrier of 237.2 kJ mol−1, which corresponds to a theoretical potential of 1.23 V.5 However, due to the high overpotential of the HER and OER the actual applied voltage is much larger compared to the theoretical value. Therefore, it is essential to develop electrocatalysts that can reduce the large overpotential and improve the slow kinetics caused by both half-cell reactions i.e. HER and OER.6 Standard catalysts, such as Pt, IrO2, and RuO2, are excellent for the HER and OER, respectively, but their excess cost and rareness limited their widespread application.7 As a result, numerous efforts have been made to come up with affordable substitutes for those traditional electrocatalysts, which include earth-abundant transition metal oxides8 or hydroxides,2 sulphides,9,10 selenides,11 and phosphides.12 However, their activity is far from the benchmark, necessitating modification to achieve high efficiency. Recently, scientists have focused on single atom based electrocatalysts to achieve the benchmark target.Single-atom catalysts (SACs) have recently demonstrated astounding electrocatalytic performance in heterogeneous catalysis for a variety of reactions due to their distinctive characteristics, which include the presence of plentiful homogeneous active sites, elevated activity, and selectivity.13 Additionally, the high atomic efficiency resulting in enhanced utilization of metals compared to conventional nanocatalysts makes them desirable for electrocatalytic application.14 However, the synthesis of SACs remains a significant obstacle due to the tendency of metal ions to aggregate.13 This aggregation is caused by the high surface energy exhibited by isolated single metal atoms.15 These metal active centres can be anchored on diverse supports such as metal oxides,16 metal phosphites,17 layered double hydroxides,18 carbon-based materials,19 and metal supports,20 to enhance their stability.
The oxide-supported SACs have received significant attention compared to other types of supports. This is primarily attributed to the abundance of vacant sites, such as metal or oxygen vacancies, present on the oxide supports.21 These vacant sites facilitate robust metal–support interactions, preventing aggregation of isolated metal atoms that leads to enhanced stability and exceptional electrocatalytic performance.22 This can be attributed to the synergistic effect resulting from the interaction between the metal atoms and the support material.23 In this context, Wang and co-workers24 reported Ir single atoms on a NiO matrix, which exhibited an overpotential of 215 mV at a current density of 10 mA cm−2 for the OER. The Ir atoms that have been substituted in the NiO matrix form covalent bonds with oxygen, resulting in Ir–O bonds. These isolated Ir atoms exhibit a favourable oxidation state of +4 and serve as active sites for the OER. Yin and co-workers25 developed Ir single atoms anchored on porous NiCo2O4 nanosheets as an effective electrocatalyst for the OER. The porous morphology helps to anchor the single atoms effectively on the substrate. Using density functional theory (DFT) calculations, the same group has confirmed that the superior OER performance attributed to the synergistic mutual activation between anchored Ir and Co sites close to oxygen vacancies leads to increased electron exchange and transfer capabilities. Furthermore, Yang and co-workers26 used an electrodeposition method to anchor Ir single-atoms on oxygen-vacancy-modified CoNiO2 substrates. The reported onset potential is 183 mV at 10 mA cm−2 current density with a very low Tafel slope value (64.8 mV dec−1) for the OER. Based on various electrochemical studies and DFT calculations, the same group revealed a synergistic interaction between the Ir 5d and O 2p electronic bands. This interaction leads to the formation of more robust Ir–O covalent bonds, which facilitates the conversion of O–O to OO*, consequently enhancing the efficiency for O2 evolution. Preparation of Pt single atom doped NiO nanocubes via impregnation & calcination followed by an etching process was reported by Lin and co-workers.27 These single Pt atoms doped into the crystalline lattice of NiO weaken the nearby Ni–O bonds and promote a noticeable in-depth phase transition from the NiO to the OER active NiOOH phase. This enhanced active phase transformation of NiO led to a rise in electrochemical mass activity (508 A g−1). As an effective electrocatalyst for the OER, Yuan and co-workers21 developed atomically dispersed Ru on oxygen-defective Co3O4. They also confirmed the significant synergistic relationship between the transition metal oxide-based support and single-atom doping via oxygen defects. The electron decentralisation and d-band centre of Co atoms synergistically tailored by Ru single atoms lead to enhanced adsorption of the intermediate and reduced reaction barriers for the OER, resulting in a low overpotential, a small Tafel slope value, and good long-term stability in an alkaline medium. Zhai and co-workers28 reported Ru single atoms anchored on a defective Ni–Fe layered double hydroxide for the overall water-splitting reaction. A cell potential of 1.44 V is required to generate 10 mA cm−2 current density for the overall water splitting reaction. This higher activity is credited to the favourable modulation of adsorption energy for the HER and O–O coupling for the OER, after single Ru atom decoration on the defective support. To effectively enhance the activity of the system, the aforementioned literature suggested single atom doping on a metal oxide substrate. To synthesize an effective electrocatalyst for overall water splitting in an alkaline medium, we used NiCo2O4 as a substrate in this study and doped it with Ru single atoms.
Motivated by the preceding research, herein, we have synthesized single atom Ru anchoring NiCo2O4 on a conducting carbon cloth (CC) surface through a hydrothermal method followed by calcination. The catalyst exhibited superior performance in 1.0 M KOH for both the HER and OER. All the nanomaterials were thoroughly characterized by various techniques such as X-ray diffraction (XRD), field emission scanning electron microscopy (FESEM), high angle annular dark field-scanning transmission electron microscopy (HAADF-STEM), X-ray photoelectron spectroscopy (XPS), and X-ray absorption spectroscopy (XAS). The optimised Ru-SAC NiCo2O4 requires −0.075 V vs. RHE to generate 10 mA cm−2 current density with a Tafel slope value of 74.44 mV dec−1 for the HER. In the case of the OER the Tafel slope value is 79.08 mV dec−1 and it requires 1.51 V vs. RHE to generate 10 mA cm−2 current density. The activity of the synthesized SACs was also examined for overall water splitting. It was found that a cell voltage of 1.57 V is needed to generate a current density of 10 mA cm−2 in an alkaline medium with no apparent degradation up to 60 h. The advantages of this work can be outlined as follows. First, the synthesis procedure is straightforward and simple, producing 2.03 wt% Ru single atoms on the NiCo2O4 support, showing the strong metal–support interaction. Second, the rougher morphology of nanoflowers after single atom doping increases the surface area thus providing more active sites. Third, the synergistic effect between the support atoms and single atom favours faster charge transfer thus leading to higher activity. Fourth, the as-synthesized Ru-SAC NiCo2O4 shows remarkable activity in urea electrolysis. Fifth, the DFT result reveals the metallic behaviour of Ru-SAC NiCo2O4 and the zero-band gap after Ru single atom introduction that eases the electron transport and eventually enhances the electrocatalytic performance.
2. Experimental section
2.1. Chemicals
Cobalt(II) chloride hexahydrate and urea were purchased from Merck, India. Nickel(II) chloride hexahydrate and KOH were purchased from SRL, India. Hydrated ruthenium(III) chloride was purchased from Sigma Aldrich. The conducting substrate, CC, was purchased from Shiree Balaji Scientific Company, India. The CC was cleaned by dipping it in concentrated nitric acid for 12 h and then rinsing it in deionized water. Drying the washed CC in a conventional oven at 50 °C for a few hours after cleaning it with Milli-Q water, ethanol, and acetone was the final step. The chemicals were not further purified except for CC.2.2. Synthesis of NiCo2O4
NiCo2O4 was synthesized on carbon cloth via a hydrothermal method followed by pyrolysis. First, the carbon cloth (CC) was cleaned properly and used for the synthesis of NiCo2O4. The cleaned CC (4 × 3 cm) was placed into an autoclave with 30 mL aqueous solution containing 0.59 g of CoCl2·6H2O, 0.298 g of NiCl2·6H2O and 0.225 g of urea. The autoclave was secured and maintained at 110 °C for 10 h. After this first step, a light pink coloured metal–carbonate hydroxide complex was deposited on CC. The as-deposited CC was then cleaned with water and ethanol and dried at 60 °C for 4 h in the oven. The obtained complex deposited on CC was subsequently placed in a muffle furnace and heated at 350 °C for 3 h. Finally, a black coloured NiCo2O4 on CC was received and used as a bare sample.2.3. Electrochemical measurements
For the electrochemical analysis, three electrode systems were used. The electrolyte was 1.0 M KOH, and the electrodes were made with the sample deposited (doped and undoped) on CC as the WE, Ag/AgCl as the RE, and graphite rod as the CE. There was no additional polymer binder added during electrocatalysis. To fix the working electrode area (0.4 × 0.4 cm2), insulated epoxy paste was applied to the sample-deposited CC. In a fixed area of 0.4 × 0.4 cm2, the catalyst loading of NiCo2O4 and Ru-SAC NiCo2O4 was 0.25 mg. All electrochemical analyses were performed using the CHI604E instrument. During the linear sweep voltammetry (LSV) analysis, a potential window of −0.9 to −1.8 V for the HER and 0 to 0.8 V for the OER vs. Ag/AgCl was used at a scan rate of 2.0 mV s−1, respectively. All results are given relative to the RHE using the formula ERHE = EAg/AgCl + 0.0591 pH + E0Ag/AgCl. For electrochemical impedance spectroscopy (EIS) analysis, bare NiCo2O4 and Ru-SAC NiCo2O4 were used, and the onset potential was chosen as the execution bias for data recording.2.4. Computational details
First-principle calculations were carried out under the DFT framework as implemented in the Quantum ESPRESSO software.29–31 The crystal structure for the cubic phase (Fd3m) of NiCo2O4, as obtained from our X-ray powder diffraction data under ambient conditions, has been optimized under the “variable-cell relaxation” method within the Broyden–Fletcher–Goldfarb–Shanno scheme.32–35 The projector augmented wave (PAW) pseudopotential36 was considered for electron–ion interactions and the exchange–correlation term of the pseudopotential was framed with the generalized gradient approximation (GGA) followed by the Perdew–Burke–Ernzerhof (PBE) functional.37 The crystal structure of the system is allowed to relax until the convergence criterion for the Hellmann–Feynman force and total electronic energy attains ∼10−3 a.u. and 10−6 Ry respectively under ambient conditions. A gamma-centered k-point mesh of 8 × 8 × 8 grid was further considered for geometry optimization and self-consistent-field (SCF) calculations.To understand the tenability in the electronic and optical properties of the Ru-SAC NiCo2O4 system, a 2 × 2 × 2 supercell of the bare NiCo2O4 crystal was constructed. A single Ru atom was then doped by substituting either a Ni or Co atom of the supercell to obtain the single atom Ru-SAC NiCo2O4 compound. The valence electrons of Ni, Co, O, and Ru atoms were categorized as plane waves with a kinetic energy cut-off of 60 Ry. A denser k-point mesh of 20 × 20 × 20 grid was again taken into account to estimate the electronic band structures (E–k diagrams), total/orbital resolved projected atomic density of states (TDOS/PDOS), optoelectronic parameters like dielectric functions, and electron energy loss spectra (EELS) of the studied systems. An optical broadening of 0.15 eV was included for calculating the optoelectronic parameters referred to above.38–40 To precisely comprehend the electronic band gap (Eg) values of bare and doped compounds, the on-site Coulomb interaction + Udd = 4.30, 6.70, and 2.05 eV for the 3d orbitals of Ni and Co, and 4d orbitals of Ru atoms respectively were incorporated into the DFT calculations.41,42 The electrochemical reaction pathways for water splitting of the bare and doped systems were calculated using the climbing image nudged elastic band (CINEB) method, as accomplished in QE software.
3. Results and discussion
3.1. Mechanism of formation
The detailed synthesis of Ru SAC anchored on the NiCo2O4 surface is given in the Experimental section. Pristine NiCo2O4 and Ru-SAC NiCo2O4 samples were developed on the surface of CC via a hydrothermal method followed by calcination. Urea was used as a hydrolysing agent. The overall synthetic procedure for the development of Ru single atoms on the NiCo2O4 surface is given in Scheme 1. A metal–carbonate hydroxide complex was formed as an intermediate in the hydrothermal step. Initially, CO32− and OH− were formed after the hydrolysis of urea, which further reacted with the Ni2+ and Co2+ salts and formed a pink-coloured metal–carbonate hydroxide (Ni1/3Co2/3)6(CO3)x(OH)y·H2O complex.43 XRD analysis (Fig. S1†) was done to confirm the formation of this intermediate complex. In the next step, this intermediate was calcined at a high temperature (350 °C for 3 h) to convert it into NiCo2O4. The single atom of Ru on the NiCo2O4 surface was synthesized without any change in the reaction conditions except the metal–carbonate hydroxide complex was immersed in ruthenium chloride solution prior to calcination. A possible mechanism for the reactions involved in the formation of NiCo2O4 is as follows:| H2NCONH2 + H2O → 2NH3 + CO2 |
| NH3 + H2O → NH4+ + OH− |
| CO2 + H2O → CO32− + 2H+ |
| 2Ni2+ + 4Co2+ + xCO32− + yOH− + H2O → (Ni1/3Co2/3)6(CO3)x(OH)y·H2O |

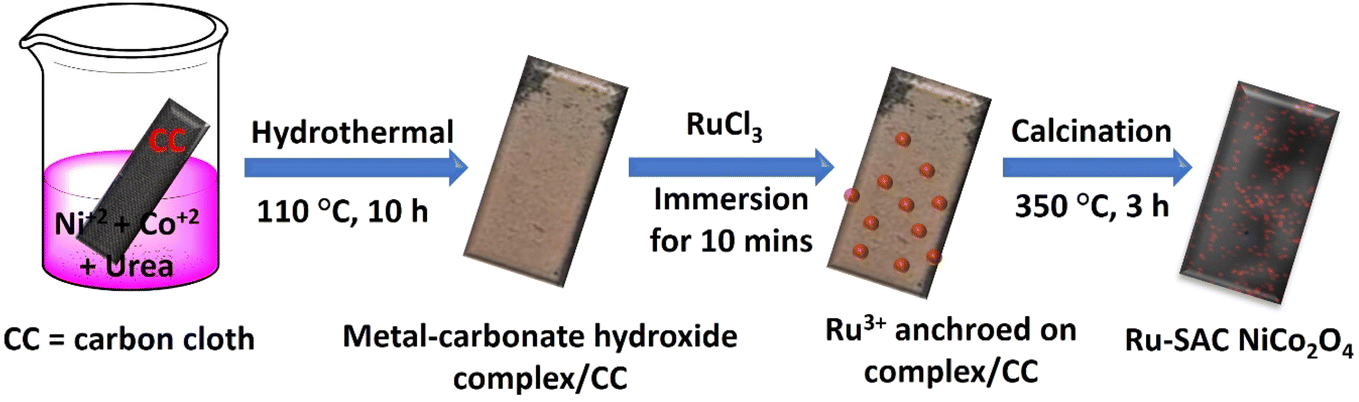 | ||
| Scheme 1 Schematic representation for the synthesis of Ru-SAC NiCo2O4 on CC. | ||
3.2. Structural characterization and compositional analysis
The crystallinity and phase purity of both single atom doped and pristine samples are confirmed by XRD analysis. Fig. S2† shows clear and prominent peaks for both samples, which matched well with those of NiCo2O4 (JCPDS 00-020-0781). The 2θ values for (111), (220), (311), (222), (400), (422), (511), and (440) crystal planes appear at 18.90, 31.14, 36.69, 38.40, 44.62, 55.43, 59.09, and 64.98, respectively, with cell parameters a = b = c = 8.11 Å and space group Fd3m. All the peaks correspond to the cubic phase of NiCo2O4. The broad peak observed at around 25.13 is due to the CC. The values of 2θ in the single-atom doped Ru-SAC NiCo2O4 sample represent no significant shift, suggesting that substituting a single atom does not significantly alter the crystal structure of the material. The diffraction pattern indicates that the synthesized material is pure and free from any impurities due to the absence of any other peak.The morphology of both pristine and Ru-SAC NiCo2O4 samples is characterised by FESEM. Fig. S3a and b† show the FESEM image of the bare sample at various resolutions. The images reveal the presence of vertically grown nanoflowers, uniformly distributed across the carbon cloth. At low resolution, highly dense nanoflowers are visible. The synthesized nanoflowers are extremely sharp and have a well-defined length, with thickness ranging from 100 to 300 nm, according to medium and high magnification FESEM images. The FESEM images of the Ru-SAC NiCo2O4 sample at low and high resolutions are shown in Fig. 1a and b which confirms the retention in morphology with a rougher surface. The nanoflower morphology, which is evenly distributed and exhibits a rougher surface, not only enhances the surface area of the electrode but also promotes a more efficient interaction between the electrolyte and the electrode. TEM analysis was performed to confirm the morphology and crystallinity of both pristine NiCo2O4 and Ru-SAC NiCo2O4 samples. The TEM images (Fig. S4a and b†) of the pristine sample show a nanoflower morphology. The TEM (Fig. 1c and d) images of Ru-NiCo2O4 also show a uniform nanoflower morphology.
 | ||
| Fig. 1 Low and high resolution FESEM (a and b), TEM (c and d), and HAADF-STEM mapping (e and f) images of Ru-SAC NiCo2O4. (g) EELS spectrum of the Ru single atom on the NiCo2O4 surface. | ||
To confirm the atomic dispersion of Ru species over the NiCo2O4 support, HAADF-STEM mapping analysis was performed. Fig. 1e and f show uniformly distributed bright spots corresponding to the Ru species on the surface of NiCo2O4, confirming the presence of individual Ru atoms. The elemental identity of the Ru-SAC NiCo2O4 sample was further identified by the mapping analysis. Electron energy loss spectroscopy (EELS) was also performed for the Ru K-edge (Fig. 1g). Owing to the very small amount of Ru single atoms, it was not detected in the EELS analysis. The single atom Ru loading on Ru-SAC NiCo2O4 was determined by ICP-AES analysis, which confirms the loading of Ru is 2.03 wt%, which is included in Table S1 (ESI†).
XAS was employed to delve deeply into the local atomic structure and electronic environment of Ru doped atoms in the Ru-SAC NiCo2O4 catalyst. Fig. 2a shows the normalized X-ray absorption near-edge spectrum (XANES) of the Ru-SAC NiCo2O4 catalyst at the Ru K-edge, while the XANES spectra of Ru-foil and RuO2 are also shown for reference. In a typical Ru K-edge spectrum, peaks A and B refer to the dipole transition from the 1s to 4p and 4f states, respectively, and represent the oxidized and metallic states of Ru.44 Moreover, the peak intensities (HA and HB) correspond to the unoccupied density of Ru 4p/4f orbitals (due to electron transition from adjacent atoms) and the amount of surface oxygen chemisorbed, while the peak widths are indicative of orbital hybridization. Given that the high density of unoccupied orbitals is generally reported as favourable for the electrocatalytic activity of catalysts,45–47 therefore, compared to the Ru-foil, the higher white line intensity of Ru-SAC NiCo2O4 suggests the highest density of unoccupied orbitals and thus high performance in electrocatalytic water splitting. Most importantly, the significantly higher threshold energy (E0) of Ru-SAC NiCo2O4 as compared to Ru-foil (inflection point (IP) is shifted to higher energy) confirms the depletion of the Ru-d band.48 The observed depletion in the d-band, coupled with the significant surface oxygen chemisorption (reflected in the high HA), are characteristic attributes associated with single atoms. These traits strongly suggest the Ru atoms are present in the form of single atoms in Ru-SAC NiCo2O4. On top of that, the XANES Ru K-edge profile of the Ru-SAC NiCo2O4 displays broader curve features compared to Ru-foil. Unlike the distinct oscillation characteristic of Ru metal, the Ru K-edge of the Ru-SAC NiCo2O4 lacks such patterns, indicating a lack of long-range order in the presence of Ru single atoms alongside low atomic number substrate atoms. Meanwhile, the position of inflection point (IP) corresponds to the oxidation state of target atoms. Unsurprisingly, the Ip of Ru-SAC NiCo2O4 lies in between those of Ru-foil and RuO2, while the absorption edge (A′′) lies in between of peaks A (oxidized Ru) and B (metallic Ru). These observations integrally confirm that Ru single atoms are partially oxidized. Furthermore, a noticeably higher energy shift of the edge for Ru-SAC NiCo2O4, relative to Ru-foil, is evident in the Ru K-edge XANES spectra, suggesting a charge redistribution favouring a depletion of charge at the Ru site compared to Ru metal. This positive E0 shift of Ru is attributed to bonding between Ru atoms and Ni and/or Co atoms on the substrate.
 | ||
| Fig. 2 X-ray absorption spectroscopy of Ru-SAC NiCo2O4 compared with reference samples. (a) XANES, (b) FT-EXAFS spectra and (c) WT patterns of Ru-SAC NiCo2O4 and the reference at the Ru K-edge. (d) XANES, (e) FT-EXAFS spectra and (f) WT patterns of Ru-SAC NiCo2O4 and reference samples at the Ni K-edge. (g) XANES, (h) FT-EXAFS spectra and (i) WT patterns of Ru-SAC NiCo2O4 and reference samples at the Co K-edge. | ||
Fig. 2b shows the Fourier-transformed extended X-ray absorption fine structure (FT-EXAFS) spectra of the Ru-SAC NiCo2O4 and the reference samples at the Ru K-edge, while the corresponding model simulated quantitative structure parameters are listed in Table S2† and all the overlay fitting curves of EXAFS spectra are given in Fig. S5 (ESI†). Accordingly, the Ru-foil shows a prominent peak D at 2.42 Å ascribed to the Ru–Ru scattering path, while peak C corresponds to the Ru–O bond pair in RuO2. The absence of Ru–Ru scattering and the coordination number (CN) for the Ru–Ru bond pair (CNRu–Ru = 0) in the Ru-SAC NiCo2O4 spectrum (Table S2†) provide concrete evidence for the formation of Ru single atoms in Ru-NiCo2O4. The peak across 1.0–3.0 Å is the convolution results of Ru–Ni, Ru–Co and Ru–O bond pairs with a CNRu–Ni = 6.83, CNRu–Co = 5.26 and CNRu–O = 2.10, respectively. The K-space curves of EXAFS oscillation functions are given in Fig. S6.† On top of that, the Ru-SAC NiCo2O4 exhibits a distinct peak profile as compared to RuO2 in this region, confirming the partial oxidation of Ru single atoms instead of oxide formation.
Since the wavelet transform (WT) patterns possess the capability to distinguish backscattering atoms based on k-space resolution and radial distance resolution, an analysis of FT-EXAFS spectra at the Ru K-edge using WT was conducted to corroborate the atomic dispersion of Ru.49 As depicted in Fig. 2c, the absence of intensity maxima at 2.55 Å (corresponding to the Ru–Ru bond pair in Ru foil) consistently confirms the formation of single Ru-atoms in Ru-NiCo2O4. More interestingly, the presence of intensity maxima at 1.3 Å (corresponding to the Ru–O bond pair in RuO2) with lower intensity as compared to RuO2 suggests the partial oxidation of Ru single atoms. In addition, Ru-SAC NiCo2O4 exhibits two interference patterns in the higher k-range which can be attributed to the heteroatomic bonding of Ru with Ni and Co.
Further evidence regarding the elemental state of Ni is confirmed by the Ni K-edge XAS analysis. As shown in Fig. 2d, the three key features including the pre-edge R, position of inflection point (IP), and the white line intensity (HM), respectively reveal the local symmetry around Ni-atoms, the oxidation (valence) state relative to that of the reference sample and the extent of the unoccupied state of the target atom. Accordingly, all the samples exhibit suppressed (compared to Ni foil) but not flattened pre-edge intensity (R), suggesting the distorted tetrahedral geometry of Ni-atoms in experimental samples. Meanwhile, compared to standard NiO, the suppressed HM (fewer surface chemisorbed oxygen species) and higher energy shift of IP for NiCo2O4 and Ru-SAC NiCo2O4 indicate the increased valence (oxidation) state of Ni, which is obvious due to severe electron relocation from Ni to Ru. Furthermore, as shown in Fig. 2e, compared to the radiation structure function (RSF) profile of NiO, the distinct peak profiles of NiCo2O4 and Ru-SAC NiCo2O4 confirm their different local coordination environment of Ni. Such a scenario is obvious due to different heteroatomic bonding in NiO and NiCo2O4. More interesting results are obtained from WT patterns. As shown in Fig. 2f, the NiCo2O4 and Ru-SAC NiCo2O4 exhibit nearly similar patterns in the lower k-range, while an additional intensity maximum is observed in the higher k-range of Ru-SAC NiCo2O4, that can be ascribed to the bonding with Ru single atoms.
The local atomic structure of Co-atoms in the Ru-SAC NiCo2O4 and reference samples was revealed by XAS analysis at the Co K-edge. Fig. 2g shows the normalized Co K-edge XANES spectra of experimental and standard samples. It is given that the pre-edge (peak X) and the white line intensity (HG) in the Co K-edge spectrum correspond to the local symmetry around Co atoms and the density of unoccupied 4p orbitals, respectively. Moreover, the position of the IP corresponds to the oxidation state of Co-atoms. Similar to Ni-atoms, compared to Co-foil, the Co2O3, NiCo2O4, and Ru-SAC NiCo2O4 samples show suppressed but not flattened pre-edge peaks, mainly possessing distorted tetrahedral Co configuration. Meanwhile, compared to the pre-edge of Ni K-edge XANES spectra, the pre-edge of Co K-edge XANES spectra exhibits higher intensity, suggesting the higher tetrahedral ratio of Co atoms. Such a scenario suggests the distortion in the octahedral geometry of Co-atoms due to the heteroatomic (Ni/Ru) bonding. Moreover, the local coordination environment of Co-atoms is elucidated by the model analysis of FT-EXAFS spectra (Fig. 2h). Accordingly, both NiCo2O4 and Ru-SAC NiCo2O4 share similar FT-EXAFS profiles and CNs for various bond pairs. Considering the nearly similar WT patterns of NiCo2O4 and Ru-SAC NiCo2O4 (Fig. 2i), such a scenario suggests that Ru single atoms are mainly positioned on the surface of NiCo2O4 without disturbing the inner atomic structure. In addition, the absence of intensity maxima at 2.01 Å (corresponding to the Co–Co bond pair in Co foil) in the WT patterns confirms the complete oxidation of Co in NiCo2O4 and Ru-SAC NiCo2O4.
XPS was further used to ascertain the chemical state and level of oxidation of each element present in both pristine and single-atom doped samples. The XPS survey scan (Fig. S7a†) of the pristine sample confirms the existence of Ni, Co, and O. The deconvoluted XPS spectra of Ni 2p and Co 2p of pristine NiCo2O4 are given in Fig. S7b and c,† respectively. Ni 2p spectra were deconvoluted into two doubles and two shake-up satellites. The binding energy (BE) values for the first two peaks of the Ni 2p3/2 spin–orbit state are present at 855.95 eV and 854.21 eV, confirming the existence of Ni2+ and Ni3+, respectively. The first satellite peak of Ni 2p3/2 is at 861.66 eV. Another doublet peak of the Ni 2p1/2 state appeared at 873.59 eV and 872.07 eV, representing the presence of Ni2+ and Ni3+ states, respectively. The remaining peak at 879.85 eV is due to other shake-up satellites of the Ni 2p1/2 state. The deconvoluted XPS data of Co 2p were fitted with two spin–orbit doublets and two shakeup satellite peaks. The binding energy value for the first two doublets of 2p3/2 appeared at 779.82 and 781.44 eV assigned to Co3+ and Co2+, respectively. Two satellite peaks of Co 2p3/2 were observed at 785.11 and 789.57 eV. The doublet for the Co 2p1/2 state appeared at 795.09 and 796.87 eV, which are assigned to Co3+ and Co2+, respectively. The remaining peak at 804.73 eV is attributed to another shake-up satellite of Co 2p1/2. The BE values of Ni 2p and Co 2p matched well with those reported in the literature.50 The XPS spectra of O 1s (Fig. S7d†) show three peaks: O1 (centered at 530 eV), O2 (531.53 eV), and O3 (532.92 eV). The peak at O1 is assigned to the metal–oxygen bond. The peak at O2 is typically associated with oxygen vacancy or O–H bonding, while the peak at O3 is caused by oxygen in absorbed water. Yin and co-workers also reported the binding energy values related to the lattice oxygen, oxygen vacancy, and oxygen in absorbed water at similar positions.25
Furthermore, the presence of Ru and other ions in the Ru-SAC NiCo2O4 sample was confirmed from XPS. The survey scan (Fig. 3a) confirms the presence of Ru, Ni, Co, and O in the sample. The deconvoluted Ni 2p XPS spectra are fitted with two nickel doublets and a pair of satellites. For Ni2+ the binding energy appears at 855.81 (2p3/2) and 873.71 eV (2p1/2). The binding energies centered at 854.1 (2p3/2) and 872.1 eV (2p1/2) are due to Ni3+. The two satellite peaks appear at 879.86 and 861.6 eV (Fig. 3b). The Co 2p spectrum (Fig. 3c) is deconvoluted into two distinct sets of spin–orbit coupling peaks (781.57 and 796.65 eV) that correspond to the Co2+ ions in the Co 2p3/2 and 2p1/2 states. The additional two sets for Co3+ are observed at 779.75 and 794.86 eV, corresponding to the Co 2p3/2 and 2p1/2 orbitals. Additionally, the satellite peaks appear at 784.04, 788.56 eV, and 804.1 eV for Co 2p3/2 and 2p1/2, respectively. The shift in the binding energy values of Ni and Co 2p in the Ru-SAC NiCo2O4 sample compared to the pristine sample indicates a substantial electronic interaction between the Ru single atoms and the support.51 The binding energy of Ru is 463.74 eV for Ru 3p3/2 and 486.0 eV for Ru 3p1/2, as shown in Fig. 3d. These values are positioned between the binding energies of Ru(0) and Ru(IV), and the higher oxidation state of Ru is consistent with the Ru K-edge XANES analysis. Zhai and co-workers reported similar BE for Ru on a Ni–Fe layered double hydroxide substrate.28 The XPS spectrum of O 1s was deconvoluted into three peaks (Fig. 3e): lattice oxygen (M–O) at 530.1 eV, oxygen vacancy or oxygen in the hydroxyl group at 531.3 eV, and oxygen in adsorbed water (O–H2O) at 533.1 eV. The binding energy of the O 1s XPS spectrum for Ru-SAC NiCo2O4 displays a positive shift compared with that of pristine NiCo2O4, suggesting a significant surface oxygen chemisorption after Ru single atom introduction. The values of all the binding energies for NiCo2O4 and Ru-SAC NiCo2O4 are tabulated in Table S3 (ESI†). Yin and co-workers also reported a similar chemisorption phenomenon for Ir single atoms with the oxygen vacancy of the NiCo2O4 surface.25
 | ||
| Fig. 3 XPS analysis of the Ru-SAC NiCo2O4 sample: (a) survey spectrum, and deconvoluted XPS spectra of (b) Ni 2p, (c) Co 2p, (d) Ru 3p, and (e) O 1s. | ||
Ru atoms are present in a higher oxidation state in Ru-SAC NiCo2O4, which can behave as a Lewis acid and withdraw electrons from adjacent atoms. For both pristine and Ru-SAC NiCo2O4, the ratio of (area under the curve) Ni2+/Ni3+ is calculated to validate the electron-pulling behaviour of Ru atoms. For the NiCo2O4 sample, it is found to be 2.24. However, in the case of the Ru-SAC NiCo2O4 sample, the ratio of Ni2+/Ni3+ is 1.88. This decreased value of Ni2+/Ni3+ ratio suggests the increased valence state of Ni present in the NiCo2O4 matrix, which further indicates the electron relocation between the single atom Ru and the Ni atoms via strong electronic interaction. The ratio of Co2+/Co3+ for NiCo2O4 and Ru-SAC NiCo2O4 samples was also calculated and the values are 9.33 and 1.12, respectively. Therefore, a lower value of the Co2+/Co3+ ratio after single atom incorporation suggests the increase in the Co valence state of the Ru-SAC NiCo2O4 sample, which further confirms the strong interaction between the support atoms and Ru single atoms. Our group also reported a similar phenomenon with an increased Ni2+/Ni3+ ratio after heteroatom doping.52 Therefore, the results obtained from XPS are in good agreement with the XAS analysis.
4. Electrocatalytic performance
4.1. HER and OER study
The study of both HER and OER activity involves the use of a three-electrode system using 1.0 M KOH solution as an electrolyte. LSV analysis was conducted using a scan rate of 2 mV s−1 for all the materials. The evaluation of the electrocatalytic activity of a catalyst depends primarily on the assessment of two crucial parameters: onset potential and overpotential.The HER performance of NiCo2O4 and 5% Pt/C supported on carbon cloth was evaluated for comparison. As shown in Fig. 4a and b Ru-SAC NiCo2O4 shows comparable HER performance with that of 5% Pt/C and requires a low onset potential of −0.075 V vs. RHE to generate 10 mA cm−2 current density. Bare NiCo2O4 and 5% Pt/C have onset potentials of −0.332 and −0.02 V vs. RHE, respectively to generate 10 mA cm−2 current density. This improvement in the catalytic activity after Ru single atom introduction in the NiCo2O4 matrix should be attributed to the presence of Ru single atoms. The generated current density using bare CC is negligible in this potential window. The LSV graph for the HER activity of other samples synthesized with various concentrations of RuCl3·xH2O is given in Fig. S8.† It can be observed from Fig. S8a† that the values of onset potential of samples using 5, 10, and 15 mg mL−1 RuCl3 are – 0.088, −0.075, and −0.082 mV, respectively for the generation of 10 mA cm−2 current density. So, efficient electrocatalytic activity is observed using 10 mg mL−1 RuCl3 solution during the development of Ru single atoms on the NiCo2O4 substrate. Once we optimized the concentration of RuCl3 solution for Ru single atoms the dipping time of the metal–carbonate hydroxide complex was varied to confirm any further improvement in the electrocatalytic activity. However, the change in the activity of samples was insignificant (Fig. S8b†). Furthermore, the calcination temperature was also tuned and optimized at 350 °C (Fig. S8c†). Therefore, the optimized Ru-SAC NiCo2O4 shows maximum electrocatalytic activity in an alkaline medium. Table S4 (ESI†) provides comparative information with the relevant values for the HER reported in the literature. The rougher surface of nanoflowers and sharp tips (FESEM and TEM analysis), coupling of Ru single atoms with the metal oxide support to generate highly oxidized Ru atoms, and increased valence state of Ni and Co atoms all together leads to the higher electrocatalytic activity of the sample.
 | ||
| Fig. 4 (a and b) LSV analysis of blank CC, NiCo2O4, Ru-SAC NiCo2O4, and 5% Pt/C for the HER, (c) Nyquist plots, and (d) Tafel plots of pristine and single atom decorated samples. The inset of (c) represents an equivalent circuit for impedance. (e and f) LSV before and after 1000 cycles and long-term stability plot at −0.1 V vs. RHE. | ||
Furthermore, the mass activity is also calculated at a fixed potential of −0.2 V vs. RHE to further prove the enhanced HER performance of the Ru-SAC NiCo2O4 sample over the pristine one. The values of mass activity for pristine NiCo2O4, Ru-SAC NiCo2O4 and 5% Pt/C are 1.61 A g−1, 53.54 A g−1 and 79.16 A g−1, respectively. Ru-SAC NiCo2O4 has 34 times higher mass activity than the pristine sample, indicating that it has high electron exchange and transfer activity, which leads to higher electrocatalytic activity.
To investigate the kinetics of the electrode material, EIS was used. As shown in Fig. 4c, the Ru-SAC NiCo2O4 shows a smaller charge transfer resistance of about 11.91 Ω, which is smaller than that of pristine NiCo2O4 (26.93 Ω), implying the faster charge transfer in the Ru single atom doped electrode. This faster charge transfer reveals the close contact between the electrolyte and electrode which leads to the faster electron transfer. This can be attributed to the rougher surface after single atom doping, which facilitates more efficient interaction between the electrode and electrolyte as well as faster diffusion of the reactant. An equivalent circuit is drawn (inset of Fig. 4c) that consists of solution resistance (RS), charge transfer resistance (RCT), and a constant phase element (CPE). All the recorded values for both samples are listed in Table S5 (ESI†). The favourable electron transfer and reaction kinetics are confirmed further by the Tafel slope values (Fig. 4d). The Tafel slope values are calculated by using the standard Tafel slope equation (given in the ESI†). The Tafel slope value of the Ru-SAC NiCo2O4 electrode is calculated to be 74.44 mV dec−1, much lower than those of the bare NiCo2O4 (110 mV dec−1), indicating faster kinetics in the HER. In an alkaline medium, the HER mechanism involves two steps, Volmer–Heyrovsky or Volmer–Tafel, according to the literature.53 The Tafel slope value and corresponding HER pathways are given in the ESI.† The first step of water splitting in an alkaline medium is the dissociation of water followed by the adsorption of H+ ions. Ru-SAC NiCo2O4 has a calculated Tafel slope value of 74.44 mV dec−1, indicating a typical Volmer–Heyrovsky mechanism for alkaline HER and implying that the H2O dissociation (Volmer step) rather than the H2 desorption (Tafel step) is the rate-determining step. During electrocatalysis, the presence of metal ions with different oxidation states (Run+, Ni3+, Ni2+, Co2+, and Co3+) is advantageous for the adsorption of the intermediate and the desorption of H2 gas. Presence of a higher density of unoccupied orbitals of Run+ ions due to the coupling of the Ru single atom with the support atom is advantageous for electrocatalytic activity. Moreover, a higher oxidation state and increased concentration of Ni3+ (d7 system, more unfilled d orbitals) in the Ru-SAC NiCo2O4 sample, collectively enhances the activity.
To further investigate the superior performance arising from the incorporation of Ru single atoms, electrochemically active surface area (ECSA) was determined. Double layer capacitance (Cdl) was subsequently calculated from the CV profiles that were collected in the non-faradaic potential region (Fig. S9a and b†) at different scan rates. The double-layer charging current was measured at a potential of 1.125 V and plotted against the scan rate for both pristine and Ru-SAC NiCo2O4 samples (Fig. S9c and d†). The value of Cdl was then calculated from the slope of the resulting straight line; comparatively, the Ru-SAC NiCo2O4 exhibited a significantly higher Cdl (2.01 mF) in comparison to the bare NiCo2O4 (0.24 mF). The calculated ECSA values are 33.63 cm2 and 4 cm2 and the roughness factors are 210.18 and 25 for Ru-SAC NiCo2O4 and NiCo2O4, respectively. ECSA and roughness factor indicate the intrinsic enhancement of catalytic active sites after the introduction of Ru single atoms. All these parameters used to evaluate electrocatalytic activity, including Cdl, Rf, ECSA, and mass activity, are listed in Table S5.† Stability is a critical parameter to evaluate the performance of an electrocatalyst. To check the stability of Ru-SAC NiCo2O4, 1000 consecutive LSV cycles were conducted (Fig. 4e). Remarkably, the developed electrocatalyst exhibited robustness, as evidenced by the absence of any significant change in both the onset potential and current density values after the completion of the 1000 cycles. Chronoamperometry is checked for long-term stability in addition to 1000 cycle stability, using a current density of 160 mA cm−2. The constant current density for Ru-SAC NiCo2O4 is shown in Fig. 4f and is stable for a maximum of 50 h. Therefore, the developed single atom based electrocatalyst is very robust and highly durable.
Inspired by the HER observation, we also carried out the OER analysis for all the samples. The OER performance of the Ru-SAC NiCo2O4 electrocatalyst was evaluated in 1 M KOH solution along with bare NiCo2O4, RuO2, and blank carbon cloth (CC). The LSV curve (Fig. 5a and b) displays that, for Ru-SAC NiCo2O4, the anodic response increased sharply at an onset potential of 1.51 V vs. RHE, whereas the onset potential values for commercial RuO2 supported on CC and bare NiCo2O4 are 1.58 and 1.61 V, respectively to generate 10 mA cm−2 current density. A histogram (Fig. 5c) is plotted at 1.65 V vs. RHE for NiCo2O4, Ru-SAC NiCo2O4, and RuO2 that shows the superior activity of Ru-SAC NiCo2O4. The mass activity was also calculated at a potential of 1.65 V vs. RHE to measure the improved performance of the catalyst. The values of mass activity for pristine NiCo2O4, Ru-SAC NiCo2O4, and commercial RuO2 are 29.22 A g−1, 73.54 A g−1, and 9.03 A g−1, respectively.
 | ||
| Fig. 5 (a and b) LSV analysis of blank CC, NiCo2O4, Ru-SAC NiCo2O4, and RuO2 for the OER, (c) histogram plot at 1.65 V vs. RHE, and (d) Tafel slope of bare and Ru doped samples. | ||
To understand the elevated activity of the Ru-SAC NiCo2O4 sample a CV analysis was performed and analyzed (Fig. S10†). The CV curve is divided into three regions. Region (a) represents the generation of *OH species. Region (b) consists of two processes, which occur simultaneously, oxidation of Ni2+ to Ni3+ which is the active site for water oxidation, and the formation of the O*, which is an essential intermediate that couples with one OH− group to generate *OOH for oxygen evolution. Finally, region (c) exhibits the coupling of O–O, which leads to the generation of O2 at a higher potential. Notably, the oxidation peak for the Ni2+/Ni3+ system for bare NiCo2O4 is at 1.35 V, whereas the same value is reduced to a lower potential (1.31 V) after the introduction of Ru single atoms into the NiCo2O4 support (Fig. S10†).
This negative shift in the oxidation potential for the Ru-SAC NiCo2O4 sample suggests that single Ru atoms make Ni2+ to Ni3+ formation more feasible by promoting charge transfer across the catalyst electrolyte interface. To gain insight into the reaction kinetics for charge transfer, Tafel slope values are calculated. The Tafel slope confirms the faster kinetics of Ru-SAC NiCo2O4 for the OER, as shown in Fig. 5d. The Tafel slope value for the Ru-SAC NiCo2O4 sample is 79.08 mV dec−1, while for NiCo2O4 and RuO2 it is 88.92 and 176.66 mV dec−1, respectively. This result suggests that adding a single Ru atom to NiCo2O4 can greatly enhance electrocatalytic performance. A comparative table of parameters including Tafel slope and mass activity values is given in Table S6 (ESI†). The durability of the Ru-SAC NiCo2O4 electrocatalyst for the OER is checked for 1000 LSV cycles along with the chronoamperometry technique. The LSV curves show no significant change (Fig. S11a†) after 1000 cycles. Further long-term stability checked for 36 h (Fig. S11b†) reveals that the catalyst is highly durable. Therefore, both the analyses demonstrate the high robustness of the synthesized single atom catalyst.
4.2. Two-electrode setup for water and urea electrolysis
The superior activity of Ru-SAC NiCo2O4 for both hydrogen and oxygen evolution reactions in an alkaline medium inspired us to design a cell for overall water splitting using Ru-SAC NiCo2O4 as both the cathode and anode. The polarisation curve of the as-prepared cell Ru-SAC NiCo2O4‖Ru-SAC NiCo2O4 in 1 M KOH is shown in Fig. 6a. It requires 1.57 V to generate 10 mA cm−2 current density. To generate 50 mA cm−2 and 100 mA cm−2 current density, the same cell requires 1.74 and 1.86 V, respectively. The electrocatalytic activity of the commercial catalyst RuO2‖Pt–C cell is checked in the same potential window. The onset potential required for the RuO2‖Pt–C cell to reach 10 mA cm−2 current density is 1.79 V. To reach 50 mA cm−2 current density the same cell requires 2.15 V. The durability of the as-designed cell was then assessed using chronoamperometry (Fig. 6b) at 1.57 V; there was no apparent degradation after 60 h, indicating excellent durability. Such long-term stability again confirms the strong interaction of Ru single atoms on the NiCo2O4 support, which prevents them from aggregating during the electrolysis process. Furthermore, FESEM, XRD, and XPS analyses were performed under post-electrocatalysis conditions for the cathode of Ru-SAC NiCo2O4. The nanoflower morphology and rough surface nature of Ru-SAC NiCo2O4 were retained after electrocatalysis (Fig. S12a†). XRD analysis shows (Fig. S12b†) clear and prominent peaks for the samples, which matched well with those of NiCo2O4 (JCPDS 00-020-0781). All the peaks correspond to the cubic phase of NiCo2O4. The well matched 2θ values show there is no change in the crystal structure of the sample under post electrocatalysis conditions. The post-electrocatalytic XPS survey spectra (Fig. S13a†) confirm the presence of Ru, Ni, Co, and O elements. The deconvoluted Ni 2p spectra show two doublets along with two satellite peaks (Fig. S13b†). The value of binding energy at 855.6 and 853.95 eV corresponds to Ni 2p3/2, while peaks at 873.75 and 879.46 eV appear for Ni 2p1/2. Co 2p deconvoluted spectra show two doublets with three satellite peaks (Fig. S13c†). Binding energy for Co 2p3/2 appeared at 781.47 and 779.66 eV while for Co 2p1/2 peaks appeared at 796.48 and 794.72 eV. Three satellite peaks appeared at 788.98, 784.54 and 803.5 eV for Co 2p3/2 and Co 2p1/2, respectively. For Ru 3p3/2 and 3p1/2 the peak positions also remain the same. Binding energy corresponding to 3p3/2 and 3p1/2 appeared at 463.7 and 486.13 eV, respectively (Fig. S13d†). The peak position values for O 1s appeared at 529.48, 531.17, and 533.05 eV corresponding to lattice oxygen, oxygen vacancy, or oxygen in the hydroxyl group and oxygen in adsorbed water, respectively (Fig. S13e†). Therefore, all the binding energy values remain the same the pre-electrocatalysis condition, which again strengthens the superior durability and robustness of the Ru single atom decorated on the NiCo2O4 electrocatalyst. | ||
| Fig. 6 (a) LSV analysis of the two-electrode setup using Ru-SAC NiCo2O4 and standard sample and (b) chronoamperometric data of the Ru single atom on NiCo2O4 in 1.0 M KOH solution. (c) Comparative LSV for both water and urea electrolysis using the Ru-SAC NiCo2O4‖Ru-SAC NiCo2O4 cell. 1.0 M KOH was used during water electrolysis and 1.0 M KOH + 0.5 M urea were used during urea electrolysis. | ||
Urea electrolysis, similar to water electrolysis is also carried out by applying electrical current through an aqueous electrolyte containing urea, to produce CO2 at the anode side and H2 through the HER at the cathode side.54 The major difference between urea electrolysis and water electrolysis is the oxidation of urea at the anode takes place instead of the OER. It involves two half-cell reactions (ESI†).55
It is well known that at the anode, slow kinetics of the OER lower the total efficiency of water electrolysis. The theoretical potential required for water electrolysis becomes 1.23 V because of the slow OER kinetics. In this scenario, urea is one of the suitable species to replace the sluggish OER by the urea oxidation reaction (UOR) at the anode.56 Inspired by this idea we have checked the activity of synthesized Ru-SAC NiCo2O4 for urea electrolysis. Primarily, the UOR was performed using 0.5 M urea in 1 M KOH solution at a scan rate of 2 mV s−1 using a three-electrode setup. The synthesized Ru-SAC NiCo2O4 generates a current density of 10 mA cm−2 at a potential of 1.24 V vs. RHE, which required 270 mV less potential than the OER, while for the pristine sample the onset potential is 1.33 V vs. RHE (Fig. S14a†). To further confirm the improved efficiency, EIS was performed. As shown in Fig. S14b,† the Ru-SAC NiCo2O4 shows a smaller charge transfer resistance (RCT) of about 17.29 ohm while for the pristine sample the value of RCT is 59.94 ohm, and the lower value of RCT for the Ru-SAC NiCo2O4 sample indicates the lower charge transfer resistance. The activity of Ru-SAC NiCo2O4 was checked for overall urea electrolysis in a two-electrode system. Compared to the water electrolysis, the cell potential required to generate a current density of 10 mA cm−2 for urea electrolysis is 1.41 V, whereas, for water electrolysis, the value is 1.57 V (Fig. 6c). The significant decrease in the onset potential value is caused by the faster anodic reaction than the water electrolysis. This makes the urea oxidation reaction an effective strategy for energy-saving H2 production.
5. Theoretical analysis
5.1. Crystal structures of bare and Ru-SAC NiCo2O4 systems
Under ambient conditions, the NiCo2O4 system exists in Fd3m space group symmetry with space group no. 227. The optimized crystal structure of bare NiCo2O4, as attained from DFT calculations with the GGA-PBE level of theory, is shown in Fig. 7a. The lattice parameters of the said compound have been measured to be a = b = c = 8.15 Å which are in excellent agreement with the experimental observation as reported elsewhere.57 NiCo2O4 crystallizes to spinel geometry with Ni atoms located at the corner of the edges of the unit cell and forms several NiO4 tetrahedral arrangements. Co atoms on the other hand are distributed at the centre of each octahedron in the cuboctahedral cavities of the crystal and O atoms form corner sharing distorted CoO6 octahedra. | ||
| Fig. 7 Optimized crystal structures of (a) bare NiCo2O4, (b) type-I and (c) type-II Ru-SAC NiCo2O4 compounds as obtained from the GGA-PBE level of theory. | ||
Two possible models of Ru-SAC NiCo2O4 compound have been formed by substituting a single Ru atom in the position of either the Ni or Co atom inside the supercell geometry of the NiCo2O4 system. The crystal structures of these models, which are referred to here as type-I and type-II, are shown in Fig. 7b and c. From Fig. 7b and c, while the type-I model shows that a Ru atom is doped by replacing a Ni atom in the tetrahedron environment, the type-II structure on the other hand depicts the doping of a Ru atom by substituting a Co atom in the octahedron arrangement. The structural stabilities of type-I and type-II Ru-doped systems have been estimated from their respective formation energy (ΔEf) values which can be obtained using the following expression:
| ΔEf = Edoped − Ebare | (1) |
5.2. Electronic properties of bare and Ru-SAC NiCo2O4 compounds
In order to understand the electronic properties of bare and type-II Ru-SAC NiCo2O4 compounds, the E–k diagrams of the studied systems have been estimated along the Γ → X → L → Γ → W high-symmetry direction and the results are shown in Fig. 8A and B. From Fig. 8A, both the valence band maximum (VBM) and conduction band minimum (CBM) of bare NiCo2O4 are localized at the Γ high-symmetry point in the Brillouin zone and result in a gap opening around the Fermi energy level (EF). This observation primarily indicates that NiCo2O4 is a direct band gap semiconductor with Eg ∼1.00 eV. The calculated Eg value (∼1.00 eV) of the compound, so estimated from the PBE+Udd level of theory, is in close agreement with the experimentally determined optical band gap (∼1.34 eV) so attained from the absorption spectrum.58 Interestingly, from Fig. 8B, marked changes in the E–k diagram for the type-II Ru-doped NiCo2O4 system have been found. A dense nesting of electronic energy bands has been observed on EF in the E–k diagram of the Ru-SAC NiCo2O4 compound (Fig. 8b), which in turn suggests the metallic behaviour of the Ru-SAC NiCo2O4 system. The zero-band gap, as observed in the DFT calculation, augments the electron transport probability and may enhance the electrocatalytic performances of the single-atom system.53,59,60 | ||
| Fig. 8 (A and B) Electronic band structures (left panel) and total density of states (right panel) for bare and Ru-SAC NiCo2O4 compounds. The orbital resolved projected atomic density of states for (a) bare and (b) Ru-SAC NiCo2O4 systems. The associated (c) electron energy loss and (d) dielectric functions for the studied compounds. (EF represents the Fermi energy level. “Up” and “Down” denote the respective spin channels.) | ||
To understand precisely the contributions of atomic orbitals linked with the electrocatalytic performances of bare and Ru-SAC NiCo2O4 compounds, the TDOS and PDOS of the systems have been estimated. The results are shown in Fig. 8. From the right panel of Fig. 8A and B, clear asymmetries between the up and down spin channels of TDOS have been noticed. This result primarily reflects the ferrimagnetic behaviour of both bare and Ru-SAC NiCo2O4 systems with magnetic moments of ∼4.10 and 3.32 μB respectively. The magnetic moment of bare NiCo2O4, so estimated from the DFT calculations with the PBE+Udd level of theory, is in close harmony with the experimental findings as reported elsewhere.61,62 Moreover, while the absence of electronic energy levels near EF has been observed in the up-spin channel of the TDOS spectrum for bare NiCo2O4, the localization of electronic energy states at EF has been found in the TDOS of the Ru-SAC NiCo2O4 compound (Right panel of Fig. 8A and B). These findings again indicate the semiconducting/metallic behaviour of bare/doped systems, respectively. The associated orbital resolved PDOS spectra of bare NiCo2O4, as illustrated in Fig. 8a, reveal that both the top of the valence and bottom of the conduction bands, ranging from −1 to 0 eV and 0 to +1 eV respectively, originated mostly from the 3d orbitals of Co and Ni atoms. From Fig. 8a, it is further observed that while the up-spin channel of PDOS exhibits Co 3d orbital as the dominant contributor, the Ni 3d orbital on the other hand shows a larger relative weight in the down spin channel of the PDOS plot. Interestingly, significant alterations in the PDOS spectra of the Ru-SAC NiCo2O4 compound, as depicted in Fig. 8b, have been observed. From Fig. 8b, marked contributions of Ru 4d and Ni 3d orbitals have been noticed at EF on the up-spin channel of the PDOS plot. Moreover, smaller contributions of the Co 3d orbital have also been seen in the up-spin channel of PDOS for a doped NiCo2O4 system. The down spin channel is however attributed to Ru 4d and Co 3d orbitals, where the relative weight of Ru 4d is higher than that of other orbitals in the vicinity of EF. These observations as a whole indicate that Ru doping plays an essential role in enhancing the electrocatalytic performances of the Ru-SAC NiCo2O4 compound in agreement with our experimental findings (vide supra).
The electronic band structure is intrinsically correlated with the optoelectronic properties of the materials.38–40 The corresponding variations of electron energy loss function [L(ω)] as a function of incident electromagnetic wave energy of both bare and Ru-SAC NiCo2O4 systems are shown in Fig. 8c. The L(ω) represents the energy loss of an electron due to inelastic scattering of electrons when it moves inside the materials. The loss function is also a measure of collective excitations of a system and is mathematically expressed as:
 | (2) |
5.3. Electrochemical reaction pathways for water splitting
To comprehend the electrocatalytic mechanism and active site(s) for water splitting, the free energy as a function of reaction pathway has been estimated for the Ni and Co atomic sites of the bare NiCo2O4 system. Similar calculations have also been implemented for the Ru site of the Ru-SAC NiCo2O4 compound. The associated overpotential (η) values for Ni, Co, and Ru atomic sites have been estimated in the electrochemical rate-determining step (RDS) in the reaction pathway. While the RDS of the pristine NiCo2O4 compound is linked with the formation of H2 (O2) in the HER (OER) process, the RDS of Ru-SAC NiCo2O4 is associated with the adsorption of hydrogen (oxidation of OH*) in the HER (OER) mechanism.53,65–67 The results are illustrated in Fig. 9. From Fig. 9a and b, the minimum η for the HER and OER are observed to be 0.028 and 0.163 eV respectively for the Ru atomic site of the doped NiCo2O4 compound. Thus, the Ru site of the Ru-SAC NiCo2O4 system may be considered as the most pronounced active site for water splitting. These results also suggest that the Ru single atom on NiCo2O4 enhances the electrocatalytic performances in comparison to its pristine counterpart.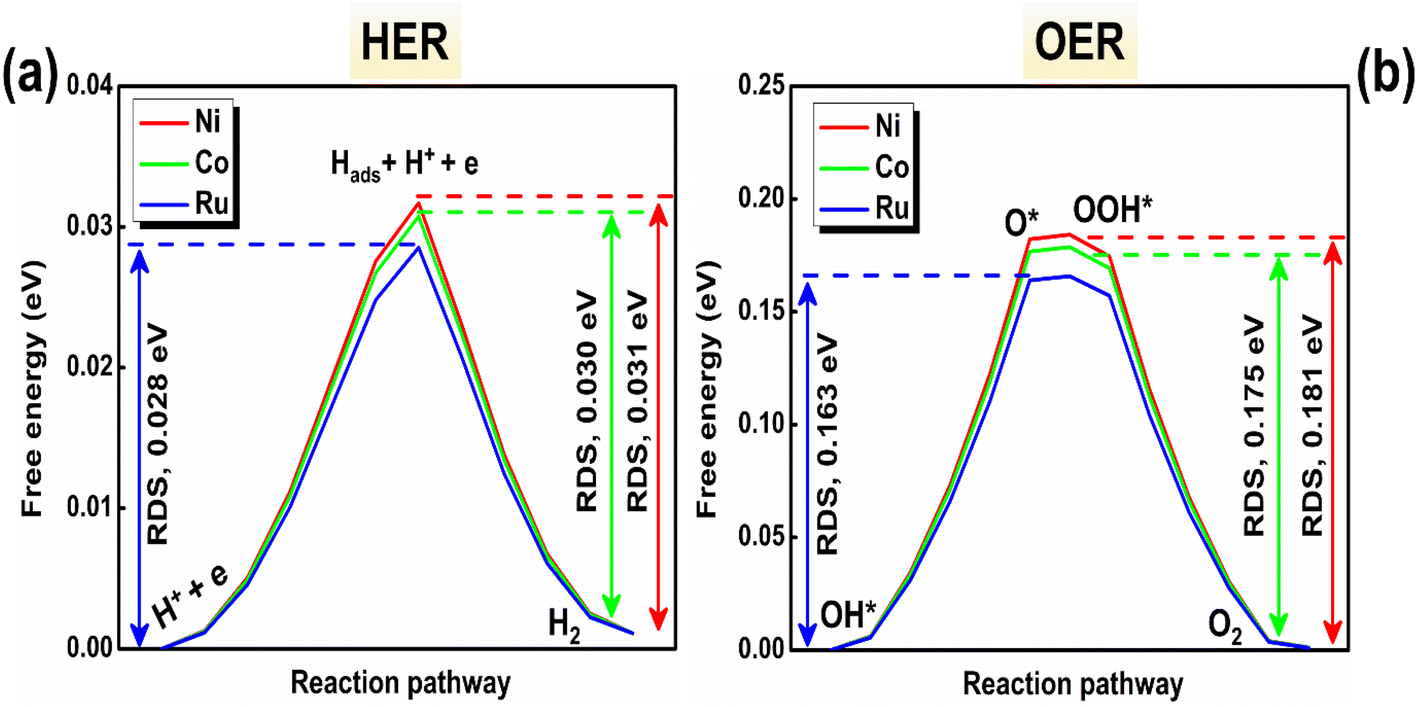 | ||
| Fig. 9 Free energy as a function of the electrochemical reaction pathways for the Ni, Co, and Ru sites of (a) HER and (b) OER activities, as attained from the CINEB method. | ||
Binding energy differences for hydrogen and oxygen intermediates are linked with the η values of the HER and OER pathways respectively.68 From Fig. 9a and b, the minimum binding energy difference is found to be 0.028 eV (0.163 eV) between the H+ + e and Hads + H+ + e (O* and OH*) intermediates of the Ru atomic site for the HER (OER) activity. The minimum binding energies for hydrogen and oxygen intermediates again indicate that the Ru active site of the Ru-SAC NiCo2O4 system is the most effective binding site for electrochemical water splitting. These observations collectively infer that the single atom of Ru plays a major role in enhancing the electrocatalytic activities of the doped compound in agreement with our experimental findings (vide supra).
6. Conclusion
To sum up, we have synthesised Ru single atoms stabilised on a NiCo2O4 support through an easy-to-scale process that involves a hydrothermal method followed by pyrolysis. XAS analysis confirms the single-atom formation. The single atom Ru was stabilised on the support matrix via coordinating with the support atoms and formed Ru–O, Ru–Ni, and Ru–Co bonds. Coordination of single atoms with the support matrix not only stabilises the isolated Ru atoms but also increases the density of unoccupied orbital, which favours the electrocatalytic activity. The electron relocation from the Ru single atoms to the support atoms also increases the valence state of Ni and Co, which further strengthen the electrocatalytic activity. This overall synergistic effect between the atoms of the support matrix and Ru (2.03 wt%) eventually leads to improved performance. HAADF-STEM analysis further verified the atomic dispersion of Ru on the NiCo2O4 support without any aggregation of atoms. The synthesised Ru-SAC NiCo2O4 shows excellent activity and stability for both the HER and OER in alkaline medium with an onset potential of −0.075 and 1.51 V at 10 mA cm−2 current density, respectively. The activity of the synthesized sample was further checked in overall water splitting, requires a cell potential of 1.57 V to generate a current density of 10 mA cm−2 with a durability of 60 h. Such long-term stability proves that single atoms are successfully anchored on a metal oxide support and do not aggregate during the electrocatalysis. Further, by coupling the HER with the UOR the potential required for H2 generation can be lowered by 160 mV compared to water electrolysis. The DFT results show the zero-band gap of NiCo2O4 after single Ru atom anchoring, which shows the metallic behaviour of the Ru-SAC NiCo2O4 sample. The associated overpotential values for each atom (Ni, Co, Ru) were calculated and the lowest overpotential value of Ru represents the most pronounced active sites compared to the others during water electrolysis. Therefore, this work represents the effective strategy of stabilization of a single atom on a suitable support, which has a huge impact on energy conversion.Data availability
All data supporting the findings of this study are available within the paper and ESI file.†Author contributions
Astha Gupta: conceptualization, overall research work, data acquisition, formal analysis, and manuscript writing and editing. Swarup Ghosh: computational work and writing. Dinesh Bhalothia: data curation, formal analysis, and writing. Sadhasivam Thangarasu: formal analysis. Biplab Ghosh: data acquisition. Rajashri Urkude: data acquisition and formal analysis. Joydeep Chowdhury: computational work, writing, and editing. Surojit Pande: overall design of the research idea, data acquisition, formal analysis, supervision, funding acquisition, manuscript writing, and editing.Conflicts of interest
The authors declare no conflict of interest.Acknowledgements
Surojit Pande acknowledges the financial support from the Science and Engineering Research Board (SERB) under sanction number CRG/2023/001368. Astha Gupta is grateful to BITS Pilani, Pilani campus, for financial assistance. We'd also like to thank BITS Pilani's Central Instrument Facility (CIF) for providing access to the FESEM and XPS analysis. The researchers also thank the Biology Department at BITS Pilani for conducting the ICP analysis. We would also like to thank at the Raja Ramanna Centre for Advanced Technology (RRCAT) in Indore, India for the XAS analysis at the BL-09 Scanning EXAFS beamline. Swarup Ghosh and Joydeep Chowdhury would like to thank the National Supercomputing Mission (NSM) for providing computing resources of ‘PARAM Kamrupa’ at IIT Guwahati, which is implemented by C-DAC and supported by the Ministry of Electronics and Information Technology (MeitY) and Department of Science and Technology (DST), Government of India. Swarup Ghosh sincerely acknowledges the University Grants Commission (UGC), Government of India for providing the UGC-NET (JRF) award in the form of a senior research fellowship.References
- X. Li, X. Hao, A. Abudula and G. Guan, J. Mater. Chem. A, 2016, 4, 11973–12000 RSC.
- D. Rathore, M. D. Sharma, A. Sharma, M. Basu and S. Pande, Langmuir, 2020, 36, 14019–14030 CrossRef CAS PubMed.
- S. Anantharaj, S. R. Ede, K. Sakthikumar, K. Karthick, S. Mishra and S. Kundu, ACS Catal., 2016, 6, 8069–8097 CrossRef CAS.
- X. Xiao, L. Yang, W. Sun, Y. Chen, H. Yu, K. Li, B. Jia, L. Zhang and T. Ma, Small, 2022, 18, 2105830 CrossRef CAS PubMed.
- N.-T. Suen, S.-F. Hung, Q. Quan, N. Zhang, Y.-J. Xu and H. M. Chen, Chem. Soc. Rev., 2017, 46, 337–365 RSC.
- D. Rathore, S. Ghosh, J. Chowdhury and S. Pande, ACS Appl. Nano Mater., 2022, 5, 11823–11838 CrossRef CAS.
- H. Wang, H.-W. Lee, Y. Deng, Z. Lu, P.-C. Hsu, Y. Liu, D. Lin and Y. Cui, Nat. Commun., 2015, 6, 7261 CrossRef CAS PubMed.
- C. Mahala, M. D. Sharma and M. Basu, Electrochim. Acta, 2018, 273, 462–473 CrossRef CAS.
- B. You, N. Jiang, M. Sheng and Y. Sun, Chem. Commun., 2015, 51, 4252–4255 RSC.
- N. Kornienko, J. Resasco, N. Becknell, C.-M. Jiang, Y.-S. Liu, K. Nie, X. Sun, J. Guo, S. R. Leone and P. Yang, J. Am. Chem. Soc., 2015, 137, 7448–7455 CrossRef CAS PubMed.
- Y. Liu, H. Cheng, M. Lyu, S. Fan, Q. Liu, W. Zhang, Y. Zhi, C. Wang, C. Xiao, S. Wei, B. Ye and Y. Xie, J. Am. Chem. Soc., 2014, 136, 15670–15675 CrossRef CAS PubMed.
- Z. Yin, C. Zhu, C. Li, S. Zhang, X. Zhang and Y. Chen, Nanoscale, 2016, 8, 19129–19138 RSC.
- X.-F. Yang, A. Wang, B. Qiao, J. Li, J. Liu and T. Zhang, Acc. Chem. Res., 2013, 46, 1740–1748 CrossRef CAS PubMed.
- H. Zhang, G. Liu, L. Shi and J. Ye, Adv. Energy Mater., 2018, 8, 1701343 CrossRef.
- W. Guo, Z. Wang, X. Wang and Y. Wu, Adv. Mater., 2021, 33, 2004287 CrossRef CAS PubMed.
- Y. Guo, S. Mei, K. Yuan, D.-J. Wang, H.-C. Liu, C.-H. Yan and Y.-W. Zhang, ACS Catal., 2018, 8, 6203–6215 CrossRef CAS.
- Y. Gu, X. Wang, A. Bao, L. Dong, X. Zhang, H. Pan, W. Cui and X. Qi, Nano Res., 2022, 15, 9511–9519 CrossRef CAS.
- J. Jin, X. Han, Y. Fang, Z. Zhang, Y. Li, T. Zhang, A. Han and J. Liu, Adv. Funct. Mater., 2022, 32, 2109218 CrossRef CAS.
- J. Li, M. N. Banis, Z. Ren, K. R. Adair, K. Doyle-Davis, D. M. Meira, Y. Z. Finfrock, L. Zhang, F. Kong, T.-K. Sham, R. Li, J. Luo and X. Sun, Small, 2021, 17, 2007245 CrossRef CAS PubMed.
- G. X. Pei, X. Y. Liu, A. Wang, A. F. Lee, M. A. Isaacs, L. Li, X. Pan, X. Yang, X. Wang, Z. Tai, K. Wilson and T. Zhang, ACS Catal., 2015, 5, 3717–3725 CrossRef CAS.
- C.-Z. Yuan, S. Wang, K. San Hui, K. Wang, J. Li, H. Gao, C. Zha, X. Zhang, D. A. Dinh, X.-L. Wu, Z. Tang, J. Wan, Z. Shao and K. N. Hui, ACS Catal., 2023, 13, 2462–2471 CrossRef CAS.
- Q. Zhang and J. Guan, Adv. Funct. Mater., 2020, 30, 2000768 CrossRef CAS.
- R. Lang, X. Du, Y. Huang, X. Jiang, Q. Zhang, Y. Guo, K. Liu, B. Qiao, A. Wang and T. Zhang, Chem. Rev., 2020, 120, 11986–12043 CrossRef CAS PubMed.
- Q. Wang, X. Huang, Z. L. Zhao, M. Wang, B. Xiang, J. Li, Z. Feng, H. Xu and M. Gu, J. Am. Chem. Soc., 2020, 142, 7425–7433 CrossRef CAS PubMed.
- J. Yin, J. Jin, M. Lu, B. Huang, H. Zhang, Y. Peng, P. Xi and C.-H. Yan, J. Am. Chem. Soc., 2020, 142, 18378–18386 CrossRef CAS PubMed.
- M.-Q. Yang, K.-L. Zhou, C. Wang, M.-C. Zhang, C.-H. Wang, X. Ke, G. Chen, H. Wang and R.-Z. Wang, J. Mater. Chem. A, 2022, 10, 25692–25700 RSC.
- C. Lin, Y. Zhao, H. Zhang, S. Xie, Y.-F. Li, X. Li, Z. Jiang and Z.-P. Liu, Chem. Sci., 2018, 9, 6803–6812 RSC.
- P. Zhai, M. Xia, Y. Wu, G. Zhang, J. Gao, B. Zhang, S. Cao, Y. Zhang, Z. Li, Z. Fan, C. Wang, X. Zhang, J. T. Miller, L. Sun and J. Hou, Nat. Commun., 2021, 12, 4587 CrossRef CAS PubMed.
- P. Giannozzi, O. Baseggio, P. Bonfà, D. Brunato, R. Car, I. Carnimeo, C. Cavazzoni, S. de Gironcoli, P. Delugas, F. Ferrari Ruffino, A. Ferretti, N. Marzari, I. Timrov, A. Urru and S. Baroni, J. Chem. Phys., 2020, 152, 154105 CrossRef CAS PubMed.
- P. Giannozzi, O. Andreussi, T. Brumme, O. Bunau, M. Buongiorno Nardelli, M. Calandra, R. Car, C. Cavazzoni, D. Ceresoli, M. Cococcioni, N. Colonna, I. Carnimeo, A. Dal Corso, S. de Gironcoli, P. Delugas, R. A. DiStasio, A. Ferretti, A. Floris, G. Fratesi, G. Fugallo, R. Gebauer, U. Gerstmann, F. Giustino, T. Gorni, J. Jia, M. Kawamura, H. Y. Ko, A. Kokalj, E. Küçükbenli, M. Lazzeri, M. Marsili, N. Marzari, F. Mauri, N. L. Nguyen, H. V. Nguyen, A. Otero-de-la-Roza, L. Paulatto, S. Poncé, D. Rocca, R. Sabatini, B. Santra, M. Schlipf, A. P. Seitsonen, A. Smogunov, I. Timrov, T. Thonhauser, P. Umari, N. Vast, X. Wu and S. Baroni, J. Phys.: Condens. Matter, 2017, 29, 465901 CrossRef CAS PubMed.
- P. Giannozzi, S. Baroni, N. Bonini, M. Calandra, R. Car, C. Cavazzoni, D. Ceresoli, G. L. Chiarotti, M. Cococcioni, I. Dabo, A. Dal Corso, S. de Gironcoli, S. Fabris, G. Fratesi, R. Gebauer, U. Gerstmann, C. Gougoussis, A. Kokalj, M. Lazzeri, L. Martin-Samos, N. Marzari, F. Mauri, R. Mazzarello, S. Paolini, A. Pasquarello, L. Paulatto, C. Sbraccia, S. Scandolo, G. Sclauzero, A. P. Seitsonen, A. Smogunov, P. Umari and R. M. Wentzcovitch, J. Phys.: Condens. Matter, 2009, 21, 395502 CrossRef PubMed.
- D. F. Shanno, Math. Comput., 1970, 24, 647–656 CrossRef.
- D. Goldfarb, Math. Comput., 1970, 24, 23–26 CrossRef.
- R. Fletcher, Comput. J., 1970, 13, 317–322 CrossRef.
- C. G. Broyden, IMA J. Appl. Math., 1970, 6, 76–90 CrossRef.
- A. Dal Corso, Comput. Mater. Sci., 2014, 95, 337–350 CrossRef CAS.
- J. P. Perdew, A. Ruzsinszky, G. I. Csonka, O. A. Vydrov, G. E. Scuseria, L. A. Constantin, X. Zhou and K. Burke, Phys. Rev. Lett., 2008, 100, 136406 CrossRef PubMed.
- S. Ghosh and J. Chowdhury, RSC Adv., 2024, 14, 6385–6397 RSC.
- R. R. Banik, S. Ghosh and J. Chowdhury, Phys. Scr., 2023, 98, 105914 CrossRef.
- S. Ghosh and J. Chowdhury, Mater. Sci. Eng., B, 2022, 284, 115903 CrossRef CAS.
- S. Krishnaveni and M. Sundareswari, Int. J. Energy Res., 2018, 42, 764–775 CrossRef CAS.
- T.-C. Chang, Y.-T. Lu, C.-H. Lee, J. K. Gupta, L. J. Hardwick, C.-C. Hu and H.-Y. T. Chen, ACS Omega, 2021, 6, 9692–9699 CrossRef CAS PubMed.
- C. Shu, Y. Liang, Z. Zhang and B. Fang, Eur. J. Inorg. Chem., 2021, 1659–1669 CrossRef CAS.
- W. Ziyu, N. L. Saini, S. Agrestini, D. D. Castro, A. Bianconi, A. Marcelli, M. Battisti, D. Gozzi and G. Balducci, J. Condens. Matter Phys., 2000, 12, 6971 CrossRef.
- N. Cheng, S. Stambula, D. Wang, M. N. Banis, J. Liu, A. Riese, B. Xiao, R. Li, T.-K. Sham, L.-M. Liu, G. A. Botton and X. Sun, Nat. Commun., 2016, 7, 13638 CrossRef CAS PubMed.
- P. Hu, Z. Huang, Z. Amghouz, M. Makkee, F. Xu, F. Kapteijn, A. Dikhtiarenko, Y. Chen, X. Gu and X. Tang, Angew. Chem., Int. Ed., 2014, 53, 3418–3421 CrossRef CAS PubMed.
- D. Bhalothia, Y.-M. Yu, Y.-R. Lin, T.-H. Huang, C. Yan, J.-F. Lee, K.-W. Wang and T.-Y. Chen, Sustainable Energy Fuels, 2021, 5, 5490–5504 RSC.
- L. Zhang, R. Si, H. Liu, N. Chen, Q. Wang, K. Adair, Z. Wang, J. Chen, Z. Song, J. Li, M. N. Banis, R. Li, T.-K. Sham, M. Gu, L.-M. Liu, G. A. Botton and X. Sun, Nat. Commun., 2019, 10, 4936 CrossRef PubMed.
- D. Bhalothia, C. Yan, N. Hiraoka, H. Ishii, Y.-F. Liao, P.-C. Chen, K.-W. Wang, J.-P. Chou, S. Dai and T.-Y. Chen, ACS Appl. Mater. Interfaces, 2023, 15, 16177–16188 CrossRef CAS PubMed.
- X. Xiao, X. Zhang, Z. Zhang, J. You, S. Liu and Y. Wang, Mikrochim. Acta, 2019, 187, 64 CrossRef PubMed.
- P. Li, M. Wang, X. Duan, L. Zheng, X. Cheng, Y. Zhang, Y. Kuang, Y. Li, Q. Ma, Z. Feng, W. Liu and X. Sun, Nat. Commun., 2019, 10, 1711 CrossRef PubMed.
- D. Rathore, A. Banerjee and S. Pande, ACS Appl. Nano Mater., 2022, 5, 2664–2677 CrossRef CAS.
- D. Rathore, S. Ghosh, A. Gupta, J. Chowdhury and S. Pande, ACS Appl. Nano Mater., 2024, 7, 9730–9744 CrossRef CAS.
- B. Zhu, Z. Liang and R. Zou, Small, 2020, 16, 1906133 CrossRef CAS PubMed.
- G. Gnana kumar, A. Farithkhan and A. Manthiram, Adv. Energy Sustainability Res., 2020, 1, 2000015 CrossRef.
- X. Sun and R. Ding, Catal. Sci. Technol., 2020, 10, 1567–1581 RSC.
- Q. Wang, B. Liu, X. Wang, S. Ran, L. Wang, D. Chen and G. Shen, J. Mater. Chem., 2012, 22, 21647–21653 RSC.
- Z. K. Heiba, M. B. Mohamed, N. M. Farag and A. Badawi, Appl. Phys. A, 2022, 128, 295 CrossRef CAS.
- D. Rathore, S. Ghosh, J. Chowdhury and S. Pande, ACS Appl. Nano Mater., 2023, 6, 3095–3110 CrossRef CAS.
- D. Rathore, S. Ghosh, J. Chowdhury and S. Pande, ACS Appl. Nano Mater., 2022, 5, 11823–11838 CrossRef CAS.
- P. Pandey, Y. Bitla, M. Zschornak, M. Wang, C. Xu, J. Grenzer, D.-C. Meyer, Y.-Y. Chin, H.-J. Lin, C.-T. Chen, S. Gemming, M. Helm, Y.-H. Chu and S. Zhou, APL Mater., 2018, 6, 066109 CrossRef.
- P. D. Battle, A. K. Cheetham and J. B. Goodenough, Mater. Res. Bull., 1979, 14, 1013–1024 CrossRef CAS.
- M. I. Naher and S. H. Naqib, Sci. Rep., 2021, 11, 5592 CrossRef CAS PubMed.
- P. Nath, S. Chowdhury, D. Sanyal and D. Jana, Carbon, 2014, 73, 275–282 CrossRef CAS.
- N. Dubouis and A. Grimaud, Chem. Sci., 2019, 10, 9165–9181 RSC.
- M. Irshad, M. H. U. R. Mahmood and M. Fatima, in Graphene, Nanotubes and Quantum Dots-Based Nanotechnology, ed. Y. Al-Douri, Woodhead Publishing, 2022, pp. 537–556, DOI:10.1016/B978-0-323-85457-3.00033-5.
- S. F. Zai, X. Y. Gao, C. C. Yang and Q. Jiang, Adv. Energy Mater., 2021, 11, 2101266 CrossRef CAS.
- B. You, M. T. Tang, C. Tsai, F. Abild-Pedersen, X. Zheng and H. Li, Adv. Mater., 2019, 31, 1807001 CrossRef PubMed.
Footnote |
| † Electronic supplementary information (ESI) available: Instrumental details, formula of all the analyses, XRD of the complex, bare and single atom anchored NiCo2O4, FESEM, TEM, and XPS of the bare sample, XAS fitting result, k-space result, control experiment during electrocatalysis, ECSA, CV of the pristine and doped samples, long time stability during the OER, post electrocatalysis result of the two-electrode system, LSV and EIS of the urea oxidation reaction, and optimized crystal structures for the different planes. See DOI: https://doi.org/10.1039/d4ta04284k. |
| This journal is © The Royal Society of Chemistry 2024 |