DOI:
10.1039/D4TA03692A
(Paper)
J. Mater. Chem. A, 2024,
12, 22905-22913
Surface mapping of photocatalytic activity in heterogeneous TiO2 films†
Received
28th May 2024
, Accepted 15th July 2024
First published on 18th July 2024
Abstract
Recent developments in advanced spectroscopy and imaging techniques are shedding light on key charge transfer processes and kinetics in photocatalysis. Complementary photocatalytic reactions with local markers and surface structural mapping are essential to establish property–function correlations in photocatalytic materials. The current work describes a simple approach to probe heterogeneous photocatalytic surfaces using digital colorimetry and the well-established smart ink test, based on the photo-induced reduction of resazurin dye. Surface crystallographic phase mapping is carried out using valence band photoemission spectra (depth resolution of ca. 5 nm). The method has prospects for implementation in pixel-by-pixel analysis using high resolution cameras at the micron scale.
Introduction
Mapping spectroscopy and imaging techniques such as transient absorption spectroscopy or scanning tunnelling microscopy, with spatial/temporal resolution at the nanometre scale and on the nanosecond timescale, have greatly advanced our understanding of key mechanistic processes in photocatalysis.1 Nevertheless, at the application end, the information gathered from these highly specialised techniques must be correlated with relevant photocatalytic reactions using polycrystalline, heterogeneous materials under practical experimental conditions. In order to relate rate information with surface analysis, especially for less well-defined, heterogeneous surfaces, it is essential to develop surface mapping characterisation methods that allow for quantitative analysis (i.e., quantum yield or formal quantum efficiency) of a given photocatalytic reaction. Useful approaches to that end have been reported by Parkin et al.2–4 using measurements of water contact angle or the well-established smart ink test,5 which is based on the photocatalyzed reduction of resazurin dye, Rz, into resofurin, Rf, with concomitant colour change from blue to purple/pink (Scheme 1). In the process, a sacrificial electron donor (SED) acts as a positive hole (h+) scavenger to promote the reduction of the dye. The reaction takes place only in the presence of an active photocatalytic film otherwise it remains stable under the illumination conditions of the experiment. Mills et al.6–8 established a linear correlation between the reduction of Rz and standard photocatalytic reactions involving the oxidation of a standard pollutant, octadecanoic (stearic) acid, the photobleaching of methylene blue (MB) dye, and the removal of nitrogen oxide (NO) gas.
 |
| | Scheme 1 Reaction scheme proposed for the photocatalysed transformation of the resazurin-based ink.7 The scavenging of photogenerated holes (h+) results in an electron-rich surface that reduces the resazurin dye (Rz) to resorufin (Rf), with an associated colour change from blue to pink. The process takes place with participation of a sacrificial electron donor (SED). Glycerol was used as an SED in this work. | |
The early studies conducted using these probes, however, involved relatively large sample areas (8 × 12 cm) of transparent thin films and the use of bulk characterisation techniques, such as X-ray diffraction and Raman spectroscopy, which ignore the likelihood of significant differences between the surface and bulk of the photocatalytic materials (av. depth resolution HeNe laser, λ = 633 nm, ca. 3 μm).9 Recently, our group reported on the surface phase quantification of heterogeneous titania (TiO2) films using density functional theory (DFT) simulated valence band photoemission spectra.10 This method allowed for the quantification of surface anatase and rutile phases with an average depth of analysis of ca. 5 nm across a probe area of 400 μm in diameter. The current work explores the photocatalytic properties of heterogeneous TiO2 surfaces containing random distributions of anatase and rutile polymorphs using the resazurin test combined with a pixel-by-pixel analysis of the output from a high-resolution camera. The samples studied here were deposited as thin films on relatively small (25 × 25 mm) quartz substrates. The procedure followed the extensive work by Mills et al.11–13 on photocatalyst activity indicator inks or paiis, including an original method based on digital camera colourimetry to monitor the change in concentration of the Rz dye on the photocatalytic film under illumination conditions.14
Experimental section
Synthetic procedures
All chemicals were purchased from Sigma-Aldrich. TiO2 thin films were deposited on quartz substrates (25 × 25 mm) using titanium isopropoxide as a single source precursor by atmospheric-pressure chemical vapour deposition (APCVD). The precursor was heated to 150 °C in a stainless-steel bubbler and carried into a cold-wall reactor by a pre-heated nitrogen carrier (1.5 L min−1). The reactor consisted of a quartz tube with a 320 mm-long graphite block with three inserted Whatman heaters. The total gas flow in the system was 10 L min−1. All components of the CVD apparatus were kept at 150 °C and temperature control of the individual components was monitored using Pt–Rh thermocouples. The deposition of the films was carried out at 500 °C for 2 min under these conditions. The as-deposited films showed the presence of pure anatase based on XRD and Raman spectroscopy analysis and no other phases were detected. Flame annealing of two samples was carried out using an oxy-propane torch, with maximum temperatures reaching around 1000–1200 °C, as measured using a Mikron 9104 IR-camera. The flame was directed onto the centre and corner regions of the samples (henceforth referred to as the r-centre and r-corner) to induce the formation of the surface rutile phase. Parent films (i.e., pure anatase and pure rutile) were deposited in the same experiment and used as prepared and after post-treatment at 1000 °C for 5 h in a furnace, respectively. XRD and Raman spectra confirming the presence of pure anatase and rutile phases in the ‘parent’ films are shown in the ESI (Fig. S1 and S2).† The ‘parent’ and mixed-phase films prepared as above were rinsed with isopropanol, UV-cleaned (Vilber Lourmat 28 W, λ = 254 nm, VL-208G-BDH) under wet air conditions overnight and stored in the dark for 72 h prior to use.
Methods
X-ray diffraction (XRD) was carried out on a Bruker D8 X-ray micro focus diffractometer in Bragg–Brentano geometry using a Cu Kα (1.5406 Å) radiation source at 20 kA and 5 mA. Patterns were recorded across a 2θ range of 20–80° with 1 second scans and 0.05° steps. Scanning electron microscopy (SEM) was carried out on a Zeiss Supra 55-VP FE SEM using an accelerating voltage of 5 kV. The samples were coated with gold to avoid charging. The software ImageJ was used to assess particle diameter from top-down SEM images. X-ray Photoelectron Spectroscopy (XPS) was carried out using a Thermo K-alpha spectrometer equipped with a monochromated Al K-Alpha X-ray source (1486.6 eV) in constant analyser energy mode. Sample charging was prevented by use of a dual beam flood gun. A pass energy of 50 eV was used to record high resolution valence band (VB) spectra, with an analysis area at each point of 400 μm in diameter. For the ‘parent’ anatase and rutile films, VB spectra were averaged from four points. For the mixed-phase r-centre and r-corner samples, spectra were recorded for a square grid of 12 × 12 points across the 25 × 25 mm2 surface (i.e., points spaced 2.1 mm apart). The data were smoothed using a 3-point moving average filter, and a Shirley background was subtracted using CasaXPS software (https://www.casaxps.com/).
Photocatalytic tests
The preparation of the resazurin dye ink followed a procedure described elsewhere.10,13 Briefly, a dispersion of 1 g glycerol (used as a sacrificial electron donor or SED), 10 mg of resazurin dye and 20 mg polysorbate surfactant were subsequently added into a cold 1.5% solution containing 10 g of hydroxyethyl cellulose (M = 250k) under strong stirring conditions for 3 h. The stock dye mixture was stored at 2 °C and stirred for 30 min prior to each use. The ink was coated onto the samples using spin coating. The evolution of the ink colour on the films under irradiation was monitored using a digital camera (iPhone 7 Plus, 12-megapixel). Colour mapping was traced using RGB analysis in MATLAB software. The light source consisted of four black light blue (BLB) UVA lamps (Vilber-Lourmat, 8 W, λ = 365 nm). The average irradiance at the sample-point was measured as ca. 1.93(±0.05) mW cm−2, using a UVX radiometer (UVP). An irradiance gradient of ±0.2 mW cm−2 was detected across the sample chamber and considered in the data analysis (Table S1†).
Results and discussion
Four TiO2 films were deposited on quartz substrates (25 × 25 mm2) using chemical vapour deposition. The as-deposited films contained the pure anatase phase only, as confirmed by X-ray diffraction. Two of them were subsequently flame-annealed at temperatures above 1000 °C to induce local formation of the surface rutile phase. These samples are henceforth referred to as r-centre and r-corner samples, and contained, respectively, a homogeneous distribution of surface rutile around the centre region of the sample or a well-defined pure rutile corner in an otherwise pure anatase film. These designs aimed at exploring any potential anomalies in photocatalytic activity due to photocarrier vectorial separation, as discussed below. In addition to these films, an as-deposited pure anatase film and a pure rutile film – obtained after annealing in a furnace to 1000 °C for 5 h – were used as reference samples.
All the samples were transparent, showing faint coloured fringes due to different thickness gradients across the films (Fig. 1). Areas of the same colour fringes are expected to have similar thicknesses.2,3 These thickness gradients were confirmed by side-on SEM analysis (Fig. S3†). Averaged film thicknesses are listed in Table 1. The morphologies of anatase-rich and rutile-rich areas were very different (Fig. 2a), with anatase regions mainly formed by small round particles (d < 100 nm) while rutile areas showed sintered, smooth surfaces after the thermal treatment. The presence of large, elongated particles was also detected within the thickest areas of the pure anatase sample. Averaged particle sizes across the anatase-rich regions were estimated from top-down SEM (Table 1). The presence of anatase and rutile phases was confirmed by XRD and Raman analysis (see the ESI†). In most cases, these patterns only differed in peak intensity, which correlated with changes in film thickness (Fig. S4†). Missing diffraction peaks in some analysis points was attributed to preferential crystallographic growth.
 |
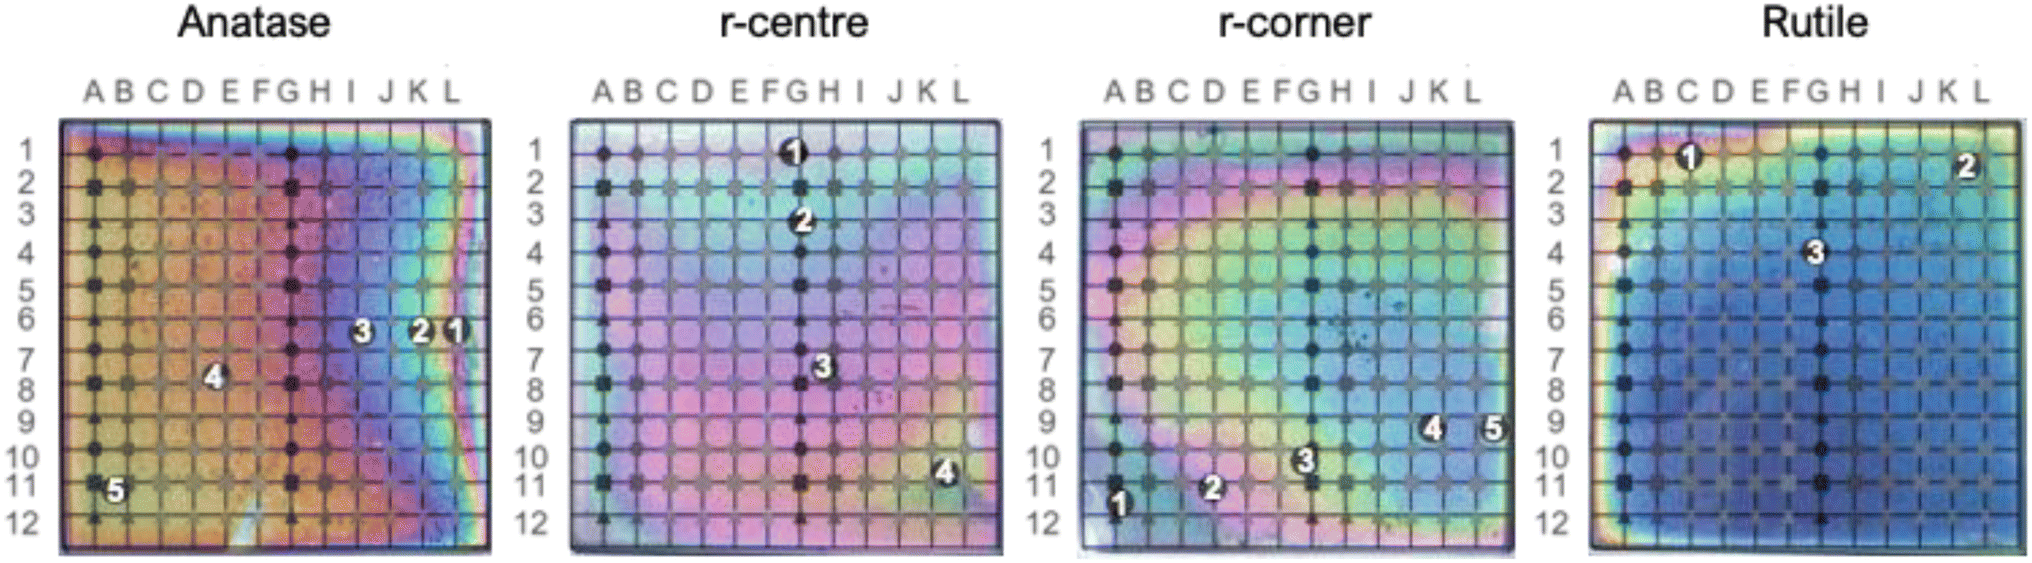
| | Fig. 1 Photographs of the TiO2 films, namely pure anatase, r-centre, r-corner and pure rutile, showing enhanced colour fringes, which are related to thickness gradients across the films. Reference 12 × 12-point grids used for XPS analysis are indicated as rows from 1 to 12 and columns from A to L. Selected positions (numbered black circles) indicate analysis points used for further discussion. | |
Table 1 Physical properties of the films and corresponding averaged times to bleach 90% of the red component of resazurin dye, ttb (90); averaged rate constants, k; and apparent photonic efficiencies, ξ′
|
|
Film thickness (nm) |
Particle size (nm) |
ttb (90) (s) |
k × 10−3 (s−1) |
ξ′ × 10−3 (molRz molϕ−1) |
| Anatase |
217(±73.9) |
99.6(±47.9) |
179.4(±72.1) |
7.84(±2.15) |
18.8(±5.2) |
| r-centre |
410(±99.6) |
112.6(±48.1) |
202.8(±139.0) |
12.15(±1.59) |
25.8(±2.3) |
| r-corner |
315(±70.1) |
90.7(±39.3) |
84.7(±24.5) |
14.62(±2.85) |
30.2(±4.3) |
| Rutile |
250(±113.6) |
— |
— |
— |
— |
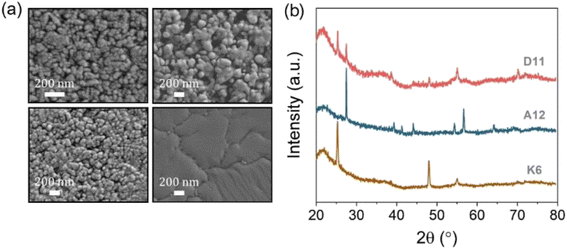 |
| | Fig. 2 (a) Selected scanning electron microscopy (SEM) images of (from top-left to bottom-right) pure anatase; r-centre; r-corner; and pure rutile samples. (b) Selected X-ray diffraction (XRD) patterns of pure anatase (K6), pure rutile (A12) and a mixed-phase region (D11). | |
Although XRD analysis can be used in quantitative phase identification of anatase–rutile mixtures, such information is representative of the bulk structure. Far more relevant to the photocatalytic activity is the surface phase distribution, which was determined here using VB XPS mapping (Fig. 3). This method involves fitting a linear combination of reference anatase and rutile VB spectral shapes to the mixed-phase spectra,15 as shown in Fig. 3a for selected analysis locations across the r-centre film. Mapping the surface phase composition (Table S2†) allowed for clear identification of the rutile-rich regions in both the r-centre and r-corner samples (Fig. 3b and c), with increasing rutile content towards the focal areas of the flame annealing.
 |
| | Fig. 3 (a) Mixed-phase valence XPS spectra, fitted with a linear combination of reference anatase and rutile spectra. This method allows estimation of the surface phase fraction present and was applied to 2D phase mapping across the (b) r-centre and (c) r-corner samples. The estimated compositions for the selected spectra in (a) (i), (ii) and (iii) were 28%, 54% and 70% anatase phase, respectively, and correspond to the locations indicated on (b) the r-centre map. | |
Fig. 4 shows selected photographs of the resazurin (Rz) coatings on the samples under UV irradiation. The photographs were obtained every minute during the initial 10 min of irradiation (total irradiation time was 100 min). A colour change from blue to pink was observed on anatase-rich regions of the samples while pure rutile regions remained blue. This observation demonstrated that rutile is inactive as a photocatalyst for mediating the photocatalytic reduction of Rz.16 3D mapping of the ink coating at a given irradiation time, t = 100 s, highlighted the active and inactive areas on the samples (Fig. 4). The mapping is given as a normalised red component, Rt (eqn (1)). The red component was chosen as the primary colour component since this is the colour that changed most markedly in the resazurin dye. The figure highlights the poor activity of rutile-rich areas in the r-centre and r-corner samples.
| |  | (1) |
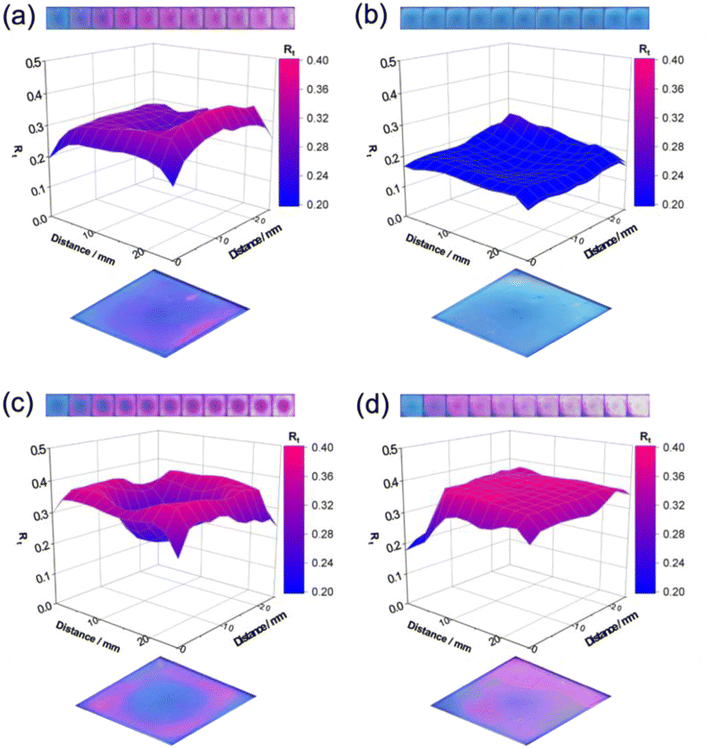 |
| | Fig. 4 (Top) Selected photographs monitoring the spin-coated Rz ink layer on (a) pure anatase; (b) pure rutile; (c) r-centre; and (d) r-corner samples under UV irradiation. The photographs shown here were obtained every 1 min during the initial 10 min of irradiation. Total irradiation time was 100 min (not shown). (Middle) Corresponding 3D mapping showing the evolution of the normalised red component, Rt after 100 s (t100) irradiation across the samples. Regions of high/low activity are shown in pink/blue, respectively. (Bottom) Corresponding photographs of the Rz-coated samples at t100 highlighting the negligible activity of the rutile-rich areas. | |
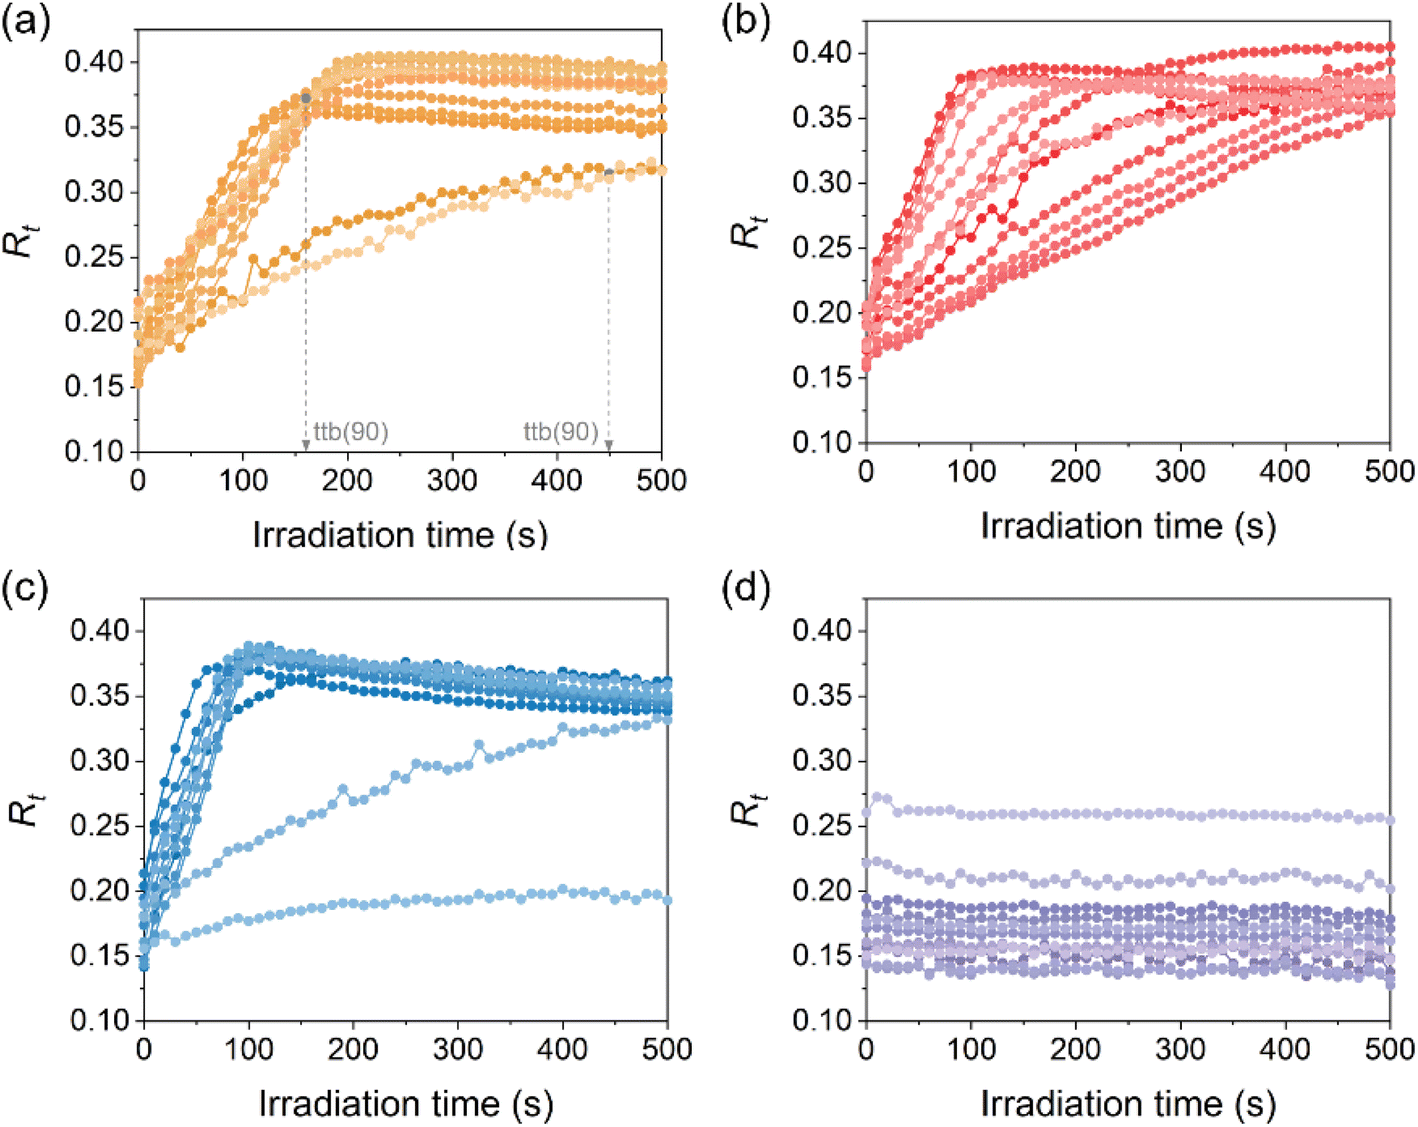
Further insight was obtained from the representation of Rt curves as a function of irradiation time, t. Fig. 5 shows selected Rt curves across a diagonal section of each sample (from A12 to L1). The complete sets of Rt curves are shown in Fig. S5.† The initial linear increase in the Rt curves corresponds to the colour change of the red component of the photographic image. The full bleaching of the red component is then seen as a plateau in the Rt curves. Close inspection of Fig. 5 shows broad-ranging behaviour across the pure anatase sample, as expected from the different physical properties discussed above, and it will be further discussed below. The different photocatalytic behaviours of anatase-rich and rutile-rich areas was also evident in the mixed-phase samples. Active anatase-rich regions were characterised by linear Rt curves (zero-order kinetics) reaching a plateau within 100–200 s, while low-activity rutile-rich regions showed significant decrease of reduction kinetics and converged only after prolonged irradiation (>600 s). The extreme case of the latter was observed for the pure rutile sample, where Rt values remained unchanged since no colour change was observed.
 |
| | Fig. 5 Selected normalised red component (Rt) curves as a function of irradiation time on (a) pure anatase, (b) r-centre, (c) r-corner and (d) pure rutile samples. The regions selected correspond to a diagonal across the samples (from A12 to L1). | |
A semiquantitative standard approach follows the time taken to bleach 90%, or ttb (90) (units, s), of the red component of the dye. In the standard procedure, the discrimination of outliers is carried out using the modified standard score, Zmod > 3.5 and only tests with less than three outliers are typically considered as valid. Due to the heterogeneity of our samples, it was not possible to obtain statistical results to follow this procedure, however, an assessment of Zmod among areas containing only surface anatase allowed for the discrimination of outliers, which were identified mostly along the edges of the samples. These values were excluded from further analysis. The ttb (90) values obtained from converging Rt curves (i.e., those reaching a plateau) are represented as ttb (90) mapping for the active samples in Fig. 6a. The mapping allowed comparison of regions of high and low photocatalytic activity, respectively coloured in pink and blue in the figure. The activity gradient in pure anatase is clearly observed in the figure, with ttb (90) values ranging from 77 to 448 s in this sample. The influence of rutile-rich regions has an impact on the ttb (90) values in the r-centre sample, ranging from 55 to 498 s, while significantly shorter times (within 52–182 s) were recorded for the r-corner sample. Averaged ttb (90) values, respectively, 179.4 ± 72.1 s, 202.8 ± 139.0 s and 84.7 ± 24.5 s for pure anatase, r-centre and r-corner samples are listed in Table 1. These values are expected to depend on physical properties such as particle size and film thickness, as discussed below. It is worth noting the shortest ttb (90) recorded for the mixed-phase samples (respectively, 55 s and 52 s for the r-centre and r-corner) compared to that of pure anatase (77 s). It is tempting to attribute such a difference to an effective photocarrier separation between the two polymorphs, following previous controversy on this matter.17–20 Although such synergetic interaction could not be rejected conclusively, a plot of ttb (90) values as a function of surface anatase content resulted in an approximately linear increase in activity as the anatase content increased in the r-centre sample (Fig. 6b). Thus, no evidence of an optimum anatase![[thin space (1/6-em)]](https://www.rsc.org/images/entities/char_2009.gif) :rutile ratio was unequivocally identified in our work, in contrast to some previous reports in the literature.18,21
:rutile ratio was unequivocally identified in our work, in contrast to some previous reports in the literature.18,21
 |
| | Fig. 6 (a) (From left to right) ttb (90) mapping (units, s) of pure anatase, r-centre and r-corner samples, showing regions of high/low activity in pink/blue, respectively. (b) Average ttb (90) values as a function of surface anatase in pure anatase (black symbols), r-centre (red symbols) and r-corner (blue symbols). (c) Rate constants, k (units, s−1) obtained from regions of zero-order kinetics (>90% surface anatase) as the reciprocal of ttb (90) values (k = 1/ttb (90)) for pure anatase (black symbol), r-centre (red symbols) and r-corner (blue symbols). Error bars indicate the range of values obtained in areas of similar anatase content. | |
Further analysis focused on highly active anatase-rich regions of the samples, showing linear behaviour (zero-order kinetics) in the reduction of resazurin. In such a scenario, the ttb (90) values are reciprocal to the reaction rate constant, k (= 1/ttb (90), units per s). Averaged k values are listed in Table 1 and plotted against surface anatase content (>90%) in Fig. 6c. As can be observed, within error margins, the k values for the mixed-phase are very similar, namely 12.15(±1.59) × 10−3 s−1 and 14.62(±2.85) × 10−3 s−1 for the r-centre and r-corner, respectively, and significantly larger than the average value of pure anatase, 7.84(±2.15) × 10−3 s−1. The correlation of rate constants, film thickness and average particle size is shown in Fig. 7. The positions considered in this analysis were those of high anatase content within the specific locations indicated in Fig. 1. Upon comparison of Fig. 7a–c, rate constant trends seem to either increase, decrease or remain similar upon decreasing the film thickness in pure anatase, r-centre and r-corner, respectively. It is worth noting, however, that the optimum k values in these plots are those close to a film thickness within 245–385 nm, as obtained from side-on SEM (Fig. S3†). A plot of k values as a function of film thickness (Fig. 7d) allows identification of an optimum thickness of ca. 320 nm (k = 14.28 × 10⁻³ s−1) for the films studied in this work. For comparison, commercial self-cleaning Activ® glass, which contains a very thin layer (ca. 15 nm) of anatase TiO2, has shown ttb (90) values of 200 s (k = 5.0 × 10⁻³ s−1) under similar irradiation conditions.23 Similar optimum efficiencies have also been reported in previous studies. Dundar et al.24 (and references therein) established an optimum thickness range of 130–500 nm for anatase films, with an average value of 315 nm, which is in good agreement with our observations. It is worth noting that the range of particle sizes remained similar across the samples, within error margins, and its influence on photocatalytic activity could not be established.
 |
| | Fig. 7 Comparison of Rz photoreduction rate constants, k (blue line), film thickness (black line) and particle size (orange line) at selected positions as indicated in Fig. 1 for (a) pure anatase; (b) r-centre; and (c) r-corner samples. (d) Corresponding k values as a function of film thickness, as obtained from side-on SEM (fitting curve included for reference). | |
Further analysis allowed for an estimation of photonic efficiencies within areas of zero-order kinetics (i.e., surface anatase content >90%). The initial step in this calculation followed the conversion of RGB values into apparent absorbance, A(sRGB), or specifically the red component of apparent absorbance, A(sR). This value – which can be determined from digital photographic data – can be directly correlated with real absorbance, A0, following previous work by Mills et al.14 The procedure is detailed in the ESI.† From the change in A(sR) (Table S6†), it is possible to estimate the rate of concentration of reduced resazurin, r (units, mol cm−2 s−1) using the Beer–Lambert equation (eqn (2)):w
| |  | (2) |
here

is the rate of concentration of reduced resazurin (units, mol cm
−3 s
−1);
b is the thickness of the ink layer (units, cm);
ε is the absorptivity of resazurin (= 4.7 × 10
7 cm
2 mol
−1)
8 and

is the change in the red component of apparent absorbance (units, s
−1). The corresponding
r values are plotted in Fig. S7 and listed in Table S4.
† Considering the incident photon flux,
ϕ, and assuming that all incident photons are absorbed, these
r values can be converted into apparent photonic efficiency,
ξ′, given in
eqn (3).w
| |  | (3) |
here
ξ′ is the apparent photonic efficiency, given as moles of reduced resazurin per incident photon (units, mol
Rz mol
ϕ−1);
r, the rate of concentration of reduced resazurin (units, mol cm
−2 s
−1); and
ϕ, the incident photon flux (units, mol cm
−2 s
−1). The assumption that all incident photons are absorbed results in an overestimation of the efficiency compared to the real quantum yield of the process but it allows comparison of the efficiency of different regions in the films considering the irradiance gradient across the photoreactor.
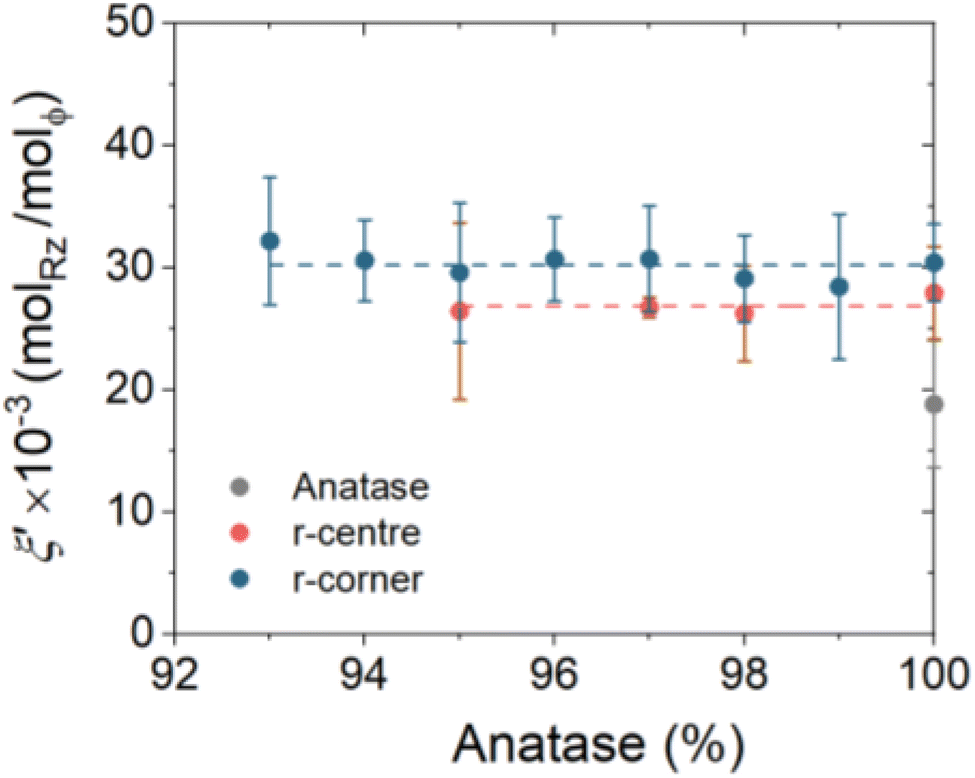
ξ′ values are plotted as a function of surface anatase content (>90%) in
Fig. 8. The discrepancies observed in the averaged values (
Table 1), particularly between pure anatase (18.8 × 10
−3 mol
Rz mol
ϕ−1) compared to the mixed-phase samples (25.8 × 10
−3 mol
Rz mol
ϕ−1 and 30.2 × 10
−3 mol
Rz mol
ϕ−1, respectively for the r-centre and r-corner) can be explained on the basis of physical properties only. In fact, the maximum
ξ′ values recorded across the most active regions in the films were 30.15 × 10
−3, 34.52 × 10
−3 and 38.3 × 10
−3 mol
Rz mol
ϕ−1, which are not significantly different. As a reference, the photonic efficiency of commercial self-cleaning Activ®, which only absorbs
ca. 7.2% of incident UV light, is
ca. 0.25 × 10
−3 mol
Rz mol
ϕ−1.
25 As mentioned above, the influence of a potential electronic synergy cannot be ruled out, within the margins observed, particularly in the case of the r-corner sample.
 |
| | Fig. 8 Apparent photonic efficiencies, ξ′, given as moles of reduced resazurin per incident photon (units, molRz molϕ−1) as a function of surface anatase content (>90%, zero-order kinetics) for pure anatase (grey symbols), r-centre (red symbols) and r-corner (blue symbols). | |
Conclusions
A simple method to probe heterogeneous photocatalytic surfaces was demonstrated combining valence band photoemission spectra and the smart ink test, based on the photoreduction of resazurin dye. The use of VB XPS instead of conventional XRD analysis allowed distinguishing between surface and bulk phase characterisation, which is essential to establish structure–function correlations in (photo)catalytic materials. As a case study, heterogeneous TiO2 films were engineered here to contain random surface distributions of anatase and rutile polymorphs. For practical reasons, the approach followed here used averaged data from 12 × 12 grids across the surface of the films, however, it can be implemented to pixel-by-pixel analysis under in situ irradiation.
The particular local distribution of surface rutile in the films – either at the centre or corner regions of the samples – aimed at promoting potential vectorial separation of charge carriers, which could not be detected unambiguously. Our results rather showed a linear correlation between surface anatase content and photocatalytic activity and there was no evidence for an optimum ratio between anatase and rutile polymorphs. Rutile itself was an inactive phase for the reduction of resazurin dye. Correlation was also established between film thickness and photocatalytic properties, with identification of an optimum film thickness of ca. 320 nm, in excellent agreement with reports in the literature. Averaged photocatalytic efficiencies of the mixed-phase films were significantly higher than that of the pure anatase sample, however, this difference was mostly attributed to differences in physical properties. If present, any electronic synergy would not mean a significant contribution to the overall efficiency of these films.
Author contributions
Roxy Lee: conceptualization, data curation, formal analysis, investigation, methodology, writing (original draft), writing (review & editing). Seonghyeok Park: methodology, writing (review & editing). Sanjayan Sathasivam: methodology, supervision, writing (review & editing). Andrew Mills: validation, writing (review & editing). Ivan P. Parkin: writing (review & editing). Robert G. Palgrave: methodology, supervision, writing (review & editing). Raul Quesada-Cabrera: conceptualization, formal analysis, investigation, methodology, project administration, writing (original draft), writing (review & editing).
Conflicts of interest
There are no conflicts to declare.
Acknowledgements
Dr C. O'Rourke is thanked for his contribution to data analysis. RQC would like to thank the Beatriz Galindo Fellowship Programme, Spanish Ministry of Education and Professional Training and the Spanish Ministry of Science and Innovation, for funding (Grant ref. PID2022-143294OB-I00). R. L. acknowledges funding from the M3S CDT (EP/L015862/1) and sponsorship by Thermo Fisher Scientific. The School of Engineering at London South Bank University is thanked for S.P's PhD studentship.
Notes and references
- Y. Gao, W. Nie, X. Wang, F. Fan and C. Li, Chem. Commun., 2020, 56, 1007–1021 RSC.
- G. Hyett, M. Green and I. P. Parkin, J. Am. Chem. Soc., 2006, 128, 12147–12155 CrossRef CAS PubMed.
- A. Kafizas, C. Crick and I. P. Parkin, J. Photochem. Photobiol., A, 2010, 216, 156–166 CrossRef CAS.
- A. Kafizas, C. J. Carmalt and I. P. Parkin, Chem.–Eur. J., 2012, 18, 13048–13058 CrossRef CAS PubMed.
-
ISO, Fine ceramics (advanced ceramics, advanced technical ceramics) — Qualitative and semiquantitative assessment of the photocatalytic activities of surfaces by the reduction of resazurin in a deposited ink film, ISO 21066:2018, 2018 Search PubMed.
- A. Mills, C. O'Rourke, K. Lawrie and S. Elouali, ACS Appl. Mater. Interfaces, 2014, 6, 545–552 CrossRef CAS PubMed.
- A. Mills, N. Wells and C. O'Rourke, J. Photochem. Photobiol., A, 2016, 330, 86–89 CrossRef CAS.
- A. Mills, N. Wells, J. MacKenzie and G. MacDonald, Catal. Today, 2017, 281, 14–20 CrossRef CAS.
- F. Adar, Spectrosc., 2010, 25, 16–23 CAS.
- R. Lee, R. Quesada-Cabrera, J. Willis, A. Iqbal, I. P. Parkin, D. O. Scanlon and R. G. Palgrave, ACS Appl. Mater. Interfaces, 2023, 15, 39956–39965 CrossRef CAS PubMed.
- A. Mills, J. Johnston and C. O'Rourke, Acc. Mater. Res., 2022, 3, 67–77 CrossRef CAS.
-
A. Mills, D. Hawthorne and N. Wells, in Handbook of Self-Cleaning Surfaces and Materials, 2023, pp. 173–205 Search PubMed.
- A. Mills, C. O'Rourke and N. Wells, Analyst, 2014, 139, 5409–5414 RSC.
- D. Yusufu and A. Mills, Sens. Actuators, B, 2018, 273, 1187–1194 CrossRef CAS.
- A. C. Breeson, G. Sankar, G. K. L. Goh and R. G. Palgrave, Appl. Surf. Sci., 2017, 423, 205–209 CrossRef CAS.
- J. Zhang, P. Zhou, J. Liu and J. Yu, Phys. Chem. Chem. Phys., 2014, 16, 20382–20386 RSC.
- B. Sun and P. G. Smirniotis, Catal. Today, 2003, 88, 49–59 CrossRef CAS.
- R. Su, R. Bechstein, L. Sø, R. T. Vang, M. Sillassen, B. Esbjörnsson, A. Palmqvist and F. Besenbacher, J. Phys. Chem. C, 2011, 115, 24287–24292 CrossRef CAS.
- R. Ma and T. Chen, J. Phys. Chem. C, 2019, 123, 19479–19485 CrossRef CAS.
- Y. K. Kho, A. Iwase, W. Y. Teoh, L. Mädler, A. Kudo and R. Amal, J. Phys. Chem. C, 2010, 114, 2821–2829 CrossRef CAS.
- B. Bharti, S. Kumar, H.-N. Lee and R. Kumar, Sci. Rep., 2016, 6, 32355 CrossRef CAS PubMed.
- A. Mills, J. Hepburn, D. Hazafy, C. O'Rourke, N. Wells, J. Krysa, M. Baudys, M. Zlamal, H. Bartkova, C. E. Hill, K. R. Winn, M. E. Simonsen, E. G. Søgaard, S. Banerjee, R. Fagan and S. C. Pillai, J. Photochem. Photobiol., A, 2014, 290, 63–71 CrossRef CAS.
- H. Tada and M. Tanaka, Langmuir, 1997, 13, 360–364 CrossRef CAS.
- I. Dundar, A. Mere, V. Mikli, M. Krunks and I. Oja Acik, Catalysts, 2020, 10, 1058 CrossRef CAS.
- A. Mills, J. Wang and M. McGrady, J. Phys. Chem. B, 2006, 110, 18324–18331 CrossRef CAS PubMed.
|
| This journal is © The Royal Society of Chemistry 2024 |
Click here to see how this site uses Cookies. View our privacy policy here. 
 Open Access Article
 This Open Access Article is licensed under a Creative Commons Attribution-Non Commercial 3.0 Unported Licence
 a,
Seonghyeok
Park
a,
Seonghyeok
Park


 is the rate of concentration of reduced resazurin (units, mol cm−3 s−1); b is the thickness of the ink layer (units, cm); ε is the absorptivity of resazurin (= 4.7 × 107 cm2 mol−1)8 and
  is the change in the red component of apparent absorbance (units, s−1). The corresponding r values are plotted in Fig. S7 and listed in Table S4.† Considering the incident photon flux, ϕ, and assuming that all incident photons are absorbed, these r values can be converted into apparent photonic efficiency, ξ′, given in eqn (3).w