
 Open Access Article
 This Open Access Article is licensed under a Creative Commons Attribution-Non Commercial 3.0 Unported Licence
Synergistic effect of Ag-doped Mn3O4 and AgCl composite as a regenerable and high-performance catalyst for the oxygen reduction reaction†
Anagha
Yatheendran
a,
Aswathy M.
Narayanan
b,
Jeetu S.
Babu
 c,
Rahul
Rajan
a and
N.
Sandhyarani
*a
c,
Rahul
Rajan
a and
N.
Sandhyarani
*a
aDepartment of Materials Science and Engineering, Nanoscience Research Laboratory, National Institute of Technology Calicut, Calicut, Kerala, India. E-mail: sandhya@nitc.ac.in; Tel: +91 495 2286537
bDepartment of Chemistry, Vel Tech Rangarajan Dr Sagunthala R&D Institute of Science and Technology, 400 Feet Outer Ring Road, Avadi, Chennai, Tamil Nadu 600062, India
cDepartment of Materials Science and Engineering, National Institute of Technology Calicut, Calicut, Kerala, India
First published on 8th August 2024
Abstract
The rational development of efficient electrocatalysts to augment the sluggish oxygen reduction reaction (ORR) is essential for energy conversion and storage. Silver-based electrocatalysts have shown good performance towards ORR among the potential alternatives to commercial Pt electrocatalysts. Mixed transition metal oxides (MTMO) have also proven to be efficient towards ORR. This work demonstrates the excellent ORR activity of an Ag-doped Mn3O4 and AgCl composite synthesized in a single-step coprecipitation method. Compared to Pt/C, the composite exhibited outstanding methanol tolerance and stability. The superior activity of the composite is attributed to the synergistic contribution of the upshift of the d band center of Ag in AgCl and the presence of Mn2+, and Mn3+/Mn4+ redox centers in Mn3O4. A slight reduction in ORR activity was observed after stability cycles due to the electrochemical conversion of AgCl to nanoporous Ag; nonetheless, the performance can be restored by regenerating AgCl through gentle treatment with HCl. This work provides insights into developing cost-effective, methanol-tolerant, and stable electrocatalysts for ORR.
1. Introduction
The development of alternative methods for producing and storing energy is the prime concern in this era.1,2 Sustainable energy production has attracted significant attention to reduce the over-exploitation of fossil fuels and reduce pollution to the environment.3 Fuel cells are an efficient alternative for sustainable energy production. Among the various types of fuel cells, direct methanol fuel cells (DMFC) possess several advantages, such as high power density and safe fuel storage.4–6 Commercially used electrocatalysts for methanol oxidation reaction (MOR) and oxygen reduction reaction (ORR) are Pt–Ru/C and Pt/C, respectively. The high cost, limited availability, and lower stability hamper the use of Pt-based anode and cathode catalysts, hence the commercialization of DMFC. In addition to that, Pt/C and Pt–alloy-based catalysts are prone to CO poisoning, reducing the efficiency of DMFCs.7,8 Pt/C, when used as a cathode catalyst, is not methanol tolerant, generating a mixed potential in the event of methanol crossover in DMFC. This points to the need for a non-corrosive and selective cathode catalyst.Transition metal oxides (TMO) are materials that have been extensively researched regarding their catalytic activity. Properties like the availability of multiple oxidation states, low cost, earth-abundance, and environmentally benign nature make TMO a promising alternative for high-cost Pt/C catalyst towards ORR. The ability to tailor the catalytic activity by varying the composition and structure or by introducing elements via doping are attractive features of TMOs. Several works exhibiting improved ORR activity of TMOs with proper carbon-based support materials have been reported.9,10 Mixed transition metal oxides (MTMO), a class of TMO existing with different cationic states, are particularly interesting due to the easy tuning of structure and property. MTMOs have many donor–acceptor chemisorption sites because of multiple valence cations, thus facilitating more efficient reversible oxygen adsorption. MTMOs also have higher electrical conductivity, which is tunable compared to TMOs, due to the lower activation energy for electron transfer between cations.11
Manganese oxides have been reported to exhibit good catalytic activity towards ORR.12–14 High abundance, low cost, and facile synthesis procedures make manganese oxides a potential candidate. MnOx-based materials have been reported to exhibit ORR activity at par with Pt/C. Several studies were reported analyzing the role of different oxidation states of Mn and the structural arrangement of oxides on the catalytic activity. Manganese is found in different oxidation states in its various oxides like Mn2+, Mn3+, and Mn4+ in MnO, Mn3O4, Mn2O3, and MnO2.15,16 It was demonstrated that Mn3+/Mn4+ species were relevant for ORR activity.17 A study on crystalline structures of MnO2 reported that α form showed the highest activity among different structures.17 The lower conductivity of oxides was one major challenge that limited manganese oxides in large-scale electrocatalytic applications. The incorporation of transition metals like Pd, Ni, etc., and the addition of high surface area and highly conductive carbon supports have been reported to overcome these challenges.18 Mixed transition metal oxides of Mn, Cu, and Co with carbon supports have also shown superior activity toward ORR.19,20 The literature suggests that the structures possessing octahedrally coordinated Mn(III) display excellent catalytic performance, and the eg1 antibonding electron supports Mn(III) to form flexible Mn(III)–O bonds. It was inferred that the Mn(III)–O in edge-sharing octahedra at the surface are catalytically more effective.
Mn3O4 is the most stable oxide form of Mn that exists in an alkaline medium. The existence of higher surface area and the ability to alter the different valencies, such as 3+ and 4+, can result in enhanced ORR performance.21 The high ratio of Mn3+/Mn2+ suggests the richness in Mn3+ species and results in defect-rich Mn3O4. Mn3+ abundance leads to enhanced ORR performance.22 It is also reported that the defected Mn3O4 species possess a lower ring current and, hence, lower peroxide production. Moreover, the presence of Mn3+ in the Mn3O4 surface also reduces the OH* desorption energy in ORR and enhances the performance. The splitting of O–O bond results due to the coexistence of Mn3+ and Mn4+ oxidation states, further improving the reduction of O2 to OH−. The presence of oxygen vacancies also promotes the adsorption of O2 molecules. It transforms them into OO2− species, an inevitable step similar to OH− desorption in the ORR mechanism. Literature also reports that Mn4+ is superior in peroxide decomposition. Thus, it is proved that the presence of oxygen vacancies, Mn3+, and Mn4+ can together contribute to excellent ORR activity.23,24
Silver doping, or the addition of silver nanoparticles, is also shown to contribute to the enhanced ORR activity of TMOs.10 One drawback of silver is associated with the low-lying d-orbital, which can be solved by forming AgX, in which an upshift of the d-band center occurs. It has been observed that among the halides, silver chloride was showing the most promising activity comparable to that of Pt/C. The presence of a highly electronegative chlorine atom results in the prominent upshift of the d-band center, thereby enhancing the catalytic activity of the compound. A recent study has compared the ORR activities of different halides of silver with that of commercial Pt/C. Choi et al. reported a Bader charge analysis to support the theory that the difference in electronegativity leads to a movement of electrons from Ag to Cl. In AgCl (200), 0.59e− are transferred due to the electronegativity difference from Ag to nearby Cl. Due to the charge transfer, the d-band center energy of Ag in AgCl (−1.79 eV) is higher than that of pure Ag (−3.68 eV), leading in a stronger binding between Ag and oxygen species, which positively contributes towards the ORR activity.25 From DFT calculations, Jin et al. reported that AgCl possesses the highest εd value, which is near to Pt in comparison with AgBr, Ag2O, etc.26 It is reported that the transfer of electrons from Ag to the Mn3O4 promotes the kinetics of O–O bond splitting due to the upshift of the d-band.27,28
In this work, we demonstrate the combination of AgCl, Mn3O4, and Ag-doped Mn3O4 to improve the ORR performance. A simple coprecipitation method is adopted for the synthesis of the composite. The composite exhibited excellent ORR activity with an insignificant production of hydrogen peroxide. The presence of Mn2+, Mn3+, and Mn4+ in Mn3O4 and the upshift of the d band center of Ag in AgCl together leads to the augmented ORR performance.
2. Experimental section
2.1 Chemicals and reagents
Silver nitrate (AgNO3) was purchased from Spectrochem, manganese(II) chloride from Alfa Aesar, sodium hydroxide from Merck India, and the commercial catalyst Pt/C with 20% Pt loading on graphitized carbon from Sigma-Aldrich. No additional purification of chemicals was performed before use. All syntheses and analyses were performed with deionized (DI) distilled water with 18.2 MΩ cm resistivity (Elga—PureLab Quest).2.2 Synthesis of AgCl–Ag:Mn3O4 composite
The AgCl–Ag:Mn3O4 composite was synthesized through the coprecipitation method. 0.05 M silver nitrate and 0.025 M manganese(II) chloride solutions were separately prepared in water. The manganese chloride solution was added dropwise (3 mL min−1) to the silver nitrate solution at room temperature, followed by stirring (600 rpm) for 10 min. The Ag+ in the solution reacts with Cl− and forms AgCl. To this solution, 1 M NaOH is added, and the pH is adjusted to 10, which results in the formation of oxide of Mn, Mn3O4. During this process, a significantly low concentration of Ag is doped into the Mn3O4 lattice. The solution was further stirred for 40 min and washed the product with water and ethanol sequentially. The final product was collected by centrifuging and drying at 80 °C. A schematic of the synthesis method is given in the ESI in Fig. S1.† Detailed characterizations were done, which indicate the formation of AgCl, Mn3O4, and Ag-doped Mn3O4 composite, denoted in this manuscript as AgCl–Ag:Mn3O4. The single-step coprecipitation synthesis resulted in the formation of the composite with structural integrity, and the synthesis with the same integrated structure with the same size ranges could be repeated. Such structural integrity is not observed when AgCl and Mn3O4 are synthesized separately and mixed in a two-step process. It was observed that the reaction conditions such as rate of addition, stirring speed, and order of addition in the single-step method possess a significant role in generating the integrated structure and the size distribution and eliminating Ag2O-like silver oxides, which reduces the ORR performance.To know the role of pristine AgCl and Mn3O4 towards the ORR activity, Mn3O4, and pristine AgCl were synthesized separately, and investigated their ORR performance. Ag–Mn3O4 was synthesized in nano and bulk form to examine the role of AgCl in ORR performance. To apprehend the role of the in situ synthesis conditions in detail, a two-step synthesis of AgCl–Mn3O4 was performed. AgCl and Mn3O4 were synthesized separately and mixed by stirring the two solutions. The physically mixed AgCl and Mn3O4 were analyzed towards ORR. The synthetic procedures of all these materials are explained in the ESI.†
2.3 Material characterization
The morphology analysis was performed with Carl Zeiss Sigma model (RA-ZEI-001), and Carl Zeiss Gemini Sigma 300 SEM operating at a maximum of 15 kV accelerating voltage. EDS analysis was performed using an Energy Dispersive X-ray spectrometer (Horiba, EMAX, 137 eV). Detailed morphology analysis was performed using a Thermofisher (Talos F200 S) Transmission Electron Microscope (TEM) operating at 200 kV accelerating voltage. Crystal structures of all materials were investigated through XRD analysis, and it was performed with Panalytical Xpert3, Netherlands (XRD) within a 2θ range of 10 to 90° with CuKα as the incident radiation. Rietveld refinement of the powder diffraction patterns was conducted using GSAS II software.29 A pseudo-Voigt function was used to generate the profile shape. The irregular background was fitted by selecting points manually and using the Chebychev function. Oxidation states were identified with the XPS using the Omicron Nanotechnology X-ray photoelectron spectrometer with a scanning X-ray source (AlKα). The analysis of the XPS spectrum was performed with Casa XPS software, and the background was corrected by Shirley background correction. PerkinElmer Frontier FTIR spectrometer and Horiba LabRAM HR Evolution Confocal Raman Microscope with laser excitation at 532 nm were used for collecting the FTIR and Raman spectra, respectively.2.4 DFT calculation
The partial density of state (pDOS) of Ag and AgCl was plotted through density functional theory (DFT) calculation using the Quantum Espresso (QE) package.30,31 QE employs a plane-wave basis set and pseudopotentials to simulate quantum-mechanical phenomena in materials. The simulations in QE are executed using the Perdew–Burke–Ernzerhof (PBE) functional, which belongs to the category of generalized gradient approximation (GGA). This provides an improved description of electronic exchange and correlation effects compared to other simpler functionals.2.5 Electrochemical tests
The electrochemical analysis of the catalysts was performed with a three-electrode setup with a potentiostat Autolab M204 instrument (Metrohm) at room temperature. Metrohm AG (Switzerland, Herisau) rotating disc electrode (RDE) system was connected with the potentiostat for all measurements. For the electrochemical measurements, a 5 mm diameter glassy carbon RDE was used as the working electrode, Ag/AgCl, and platinum coil were used as reference and counter electrodes. 0.1 M NaOH was used as the electrolyte, and oxygen saturation was ensured before all ORR measurements. A 30 min purging with 99.6% pure oxygen or nitrogen is performed to ensure the saturation of the respective gases. Peroxide production with ORR was calculated from the disc and ring currents measured with a rotating ring disc electrode (RRDE-5 mm diameter glassy carbon disc with a concentric platinum ring at 375 μm distance). All other conditions remain the same for RDE and RRDE measurements. Before the measurements, electrochemical cleaning of the electrodes was done using 0.1 M perchloric acid. A saturated calomel electrode was used as the reference electrode for electrochemical cleaning purposes. All the measured potentials were calibrated to the reversible hydrogen electrode (RHE) using the equation E(RHE) = E(Ag/AgCl) + E0(Ag/AgCl) + 0.059pH. A 40 minutes continuous sonication was performed to ensure the homogeneous dispersion of catalyst ink with a 1![[thin space (1/6-em)]](https://www.rsc.org/images/entities/char_2009.gif) :1 ratio of DI water to the catalyst, and 10 μL of the ink was drop cast on the working electrodes. Room temperature drying of electrode surfaces was done before measurements. The cyclic voltammetry (CV) was measured in the range of 0.2 V to +1.1 V (vs. RHE) at a scan rate of 10 mV s−1. The polarization curve was measured between 0.2 V to +1.1 V (vs. RHE) with a scan rate of 10 mV s−1 and rotation speeds from zero to 2600 rpm. Electrochemical impedance spectroscopic measurements (EIS) were carried out at the three regions of the polarization curve with a high and low frequency of 25000 Hz and 0.1 Hz. The EIS results were collected at zero rpm and analyzed with Zsimpwin software. ADT analysis was conducted for 2500 cycles of cyclic voltammetry, and polarization curves were plotted before and after the cyclic voltammetry cycles to compare the performance. Methanol tolerance was analyzed with LSV. Linear sweep voltammetry at 1600 rpm was analyzed before and after adding 1 M methanol. The hydrogen peroxide produced during the ORR can be obtained with the equation,
:1 ratio of DI water to the catalyst, and 10 μL of the ink was drop cast on the working electrodes. Room temperature drying of electrode surfaces was done before measurements. The cyclic voltammetry (CV) was measured in the range of 0.2 V to +1.1 V (vs. RHE) at a scan rate of 10 mV s−1. The polarization curve was measured between 0.2 V to +1.1 V (vs. RHE) with a scan rate of 10 mV s−1 and rotation speeds from zero to 2600 rpm. Electrochemical impedance spectroscopic measurements (EIS) were carried out at the three regions of the polarization curve with a high and low frequency of 25000 Hz and 0.1 Hz. The EIS results were collected at zero rpm and analyzed with Zsimpwin software. ADT analysis was conducted for 2500 cycles of cyclic voltammetry, and polarization curves were plotted before and after the cyclic voltammetry cycles to compare the performance. Methanol tolerance was analyzed with LSV. Linear sweep voltammetry at 1600 rpm was analyzed before and after adding 1 M methanol. The hydrogen peroxide produced during the ORR can be obtained with the equation,Id and Ir are the disc and ring electrode currents, and the collection coefficient of H2O2 is 0.32 at the RRDE Pt ring. The electron transfer number involved in the reaction is calculated using the equation,

Fuel cell performance was studied with a single DMFC cell. The detailed preparation of MEA and OCV measurement with the single cell is discussed in ESI.†
3. Results and discussion
Platinum is a widely recognized electrocatalyst for fuel cell applications. However, the cost, poor stability, the tendency to form aggregates, and coarsening during the reaction pathway reduce the electrode's lifetime. In this study, we report a promising alternative catalyst, AgCl–Ag:Mn3O4, in terms of methanol tolerance and stability even after 2500 cycles. A slight reduction in catalytic activity was observed after 2500 cycles, and a mild acid treatment of the composite could regenerate the catalytic activity for long-term application. Fig. 1A shows the accelerated durability test (ADT) of the AgCl–Ag:Mn3O4 and the regeneration of the catalyst. Linear sweep voltammograms (LSV) of the catalyst at 1600 rpm before and after 2500 CV cycles in an O2-saturated electrolyte and the LSV of regenerated material are displayed in Fig. 1A. Initially, the onset potential, E1/2, and limiting current density of AgCl–Ag:Mn3O4 was at 0.834 V, 0.641 V, and −3.97 mA cm−2, which are slightly shifted to 0.795 V, 0.638 V, and −3.75 mA cm−2 after the 2500 cycles. It is to be noted here that the Pt/C shows a significant reduction in performance with a substantial shift compared to the catalyst developed here (see below). The slight change in onset potential and E1/2 of AgCl–Ag:Mn3O4 could be regenerated after a mild treatment with 0.1 M HCl for two hours. The onset potential, E1/2, and the limiting current density were shifted to 0.826 V, 0.648 V, and −3.78 mA cm−2 after regeneration. Characterizations suggested the conversion of AgCl to Ag during repeated electrochemical cycles and regeneration to AgCl after acid treatment, while Mn3O4 is intact. A cartoonic representation of the process during ADT and regeneration is described in Fig. 1B. | ||
| Fig. 1 ADT analysis and regeneration profile of AgCl–Ag:Mn3O4 at 1600 rpm (A), and cartoonic representation of regeneration of AgCl–Ag:Mn3O4 (B). | ||
The excellent stability and remarkable regenerability exhibited by this catalyst, as well as the methanol tolerance underscore its excellent ORR performance and hold great promise for its applications in direct methanol fuel cells.
Detailed morphological and structural characterizations were performed to understand the composition of the catalyst and its catalytic activity. Scanning electron microscopic images were analyzed to infer the morphology of the material, and the occurrence of polydispersed nanosized particles was confirmed from the SEM image shown in Fig. 2A. The aggregates of particles are arranged like layers. The single-step synthesis only formed an integrated structure. The morphological and elemental analysis was performed for Ag–Mn3O4 (bulk) and two-step derived AgCl–Mn3O4. The corresponding results are shown in Fig. S2.†
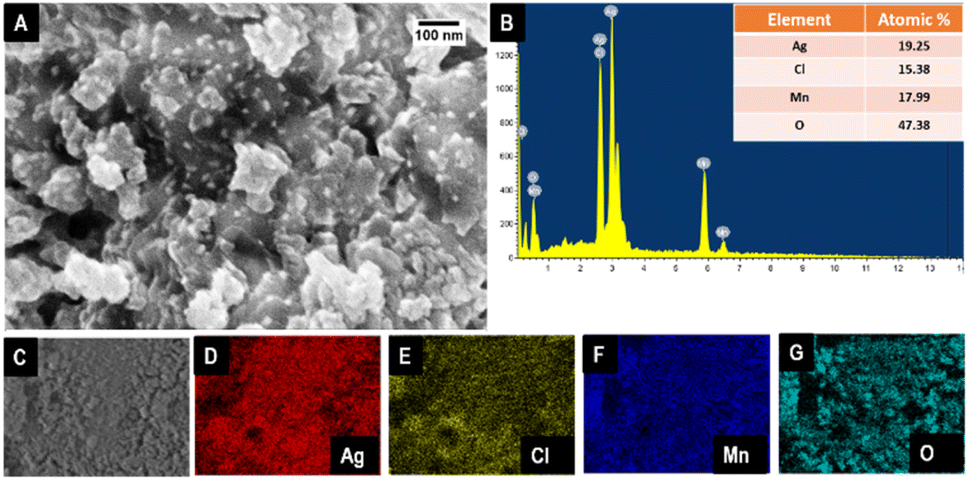 | ||
| Fig. 2 FE-SEM image of AgCl–Ag:Mn3O4 (A), EDS spectrum (B), electronic image (C) and elemental mapping of AgCl–Ag:Mn3O4 (D–G). | ||
Elemental analysis was performed with EDS, establishing the presence of Ag, Cl, Mn, and O within the composite, shown in Fig. 2B. The corresponding atomic percentage is shown in the inset of Fig. 2B. Carbon is from the carbon tape used for drop casting the material for SEM and EDS analysis. Fig. 2C represents the area of the electronic image used for elemental mapping, and Fig. 2D–G represents the uniform distribution of Ag, Cl, Mn, and O within the system.
The TEM image shown in Fig. 3A describes the distribution of polydispersed particles arranged in layers. It may be noted that the same reaction conditions led to the repeatable size ranges of the particles used in this study. Fig. 3B shows the HRTEM image of the material. The lattice spacing corresponds to the planes of both AgCl and Mn3O4 are evident from the image. The lattice spacing of 0.166 nm corresponds to the (311) plane of AgCl. The 0.24 nm lattice spacing is assigned to the (211) plane, and 0.3 nm can be assigned to the (112) plane of tetragonal Mn3O4.
 | ||
| Fig. 3 TEM image (A), HRTEM image (B) of AgCl–Ag:Mn3O4, refined XRD pattern of AgCl–Ag:Mn3O4 (C), the crystal structure of Ag:Mn3O4 (D). | ||
Fig. 3C shows the refined XRD pattern of the AgCl–Ag:Mn3O4 composite. The presence of peaks at 27.7°, 32.1°, 46.1°, 54.7°, 57.3°, 67.3°, 74.3°, 76.6°, 85.6° can be assigned to the characteristic peaks of (111), (200), (220), (311), (222), (400), (331), (420), and (422) planes of cubic AgCl with space group Fm![[3 with combining macron]](https://www.rsc.org/images/entities/char_0033_0304.gif) m. The obtained data are in agreement with the JCPDS 00-031-1238.25,26 The peaks at 35.9°, 38°, 44.2°, 59.8°, and 64.3° can be assigned to tetragonal Mn3O4 planes (211), (004), (220), (224), and (400) respectively. Moreover, the enhancement in the intensity of peak present at 32.1°, 74.3°,76.6°, and 85.6° can be further assigned to the (103), (413), (422), and (424) planes of Mn3O4 and the obtained result agrees with the JCPDS 01-089-4837.32,33 Apart from the AgCl and Mn3O4 phases, metallic silver was also present in the composites, as evident from the diffraction pattern.
m. The obtained data are in agreement with the JCPDS 00-031-1238.25,26 The peaks at 35.9°, 38°, 44.2°, 59.8°, and 64.3° can be assigned to tetragonal Mn3O4 planes (211), (004), (220), (224), and (400) respectively. Moreover, the enhancement in the intensity of peak present at 32.1°, 74.3°,76.6°, and 85.6° can be further assigned to the (103), (413), (422), and (424) planes of Mn3O4 and the obtained result agrees with the JCPDS 01-089-4837.32,33 Apart from the AgCl and Mn3O4 phases, metallic silver was also present in the composites, as evident from the diffraction pattern.
From the Rietveld refinement results, a small amount of Ag+ (7%) was observed to be incorporated into the Mn3+ site of the Mn3O4. The refinement results are summarized in Table S1 in the ESI.† The weight fractions of the phases AgCl, Ag-doped Mn3O4 (Ag:Mn3O4), and metallic Ag were 0.722, 0.194, and 0.083, respectively. The crystal structure of the Ag-doped Mn3O4 drawn using VESTA software is given in Fig. 3D.34,35 The doping of Ag+ in the Mn3+ site leads to the formation of Mn4+ in the lattice. Due to the similar X-ray scattering power of Mn3+ and Mn4+, Mn4+ is not detected in the XRD refinement; however, the presence of Mn4+ is confirmed from XPS. The XRD result obtained for the Ag:Mn3O4, Mn3O4, pristine AgCl, and AgCl–Mn3O4 (two-step derived) is explained in ESI in Fig. S2.†
The electronic state for the AgCl–Ag:Mn3O4, and Ag–Mn3O4 systems were analyzed by XPS, shown in Fig. 4. The survey spectrum of the AgCl–Ag:Mn3O4 system confirms the presence of Ag, Cl, Mn, and O, shown in the ESI in Fig. S3.† The XRD indicated the presence of two types of Ag+, one as doped in the lattice of Mn3O4 and the second as AgCl. These two Ag+ are evident in XPS in the Ag 3d region shown in Fig. 4A. Ag+ in the Mn3O4 lattice possesses characteristic peaks at 366.2 and 372.2 eV with a spin–orbit coupling of 6 eV, and Ag+ in the AgCl is present at 367.97 and 373.99 eV. Ag0 peaks are present at 369.5 and 375.57 eV.36–39 The core level spectrum of Cl 2p can be resolved into four characteristic peaks, as shown in Fig. 4B, at 197.5 and 199.5 eV for Cl 2p3/2 and Cl 2p1/2, respectively, from the AgCl, and the additional peaks obtained at 199.7, and 201.5 eV indicated the presence of residual chlorine.36 Mn 2p region is displayed in Fig. 4C. The characteristic Mn 2p3/2 and 2p1/2 peaks were observed at 640 and 651.96 eV with a separation of 11.9 eV, which agrees with the reported value for mixed valence Mn3O4.39–47 The Mn 2p3/2 and 2p1/2 peaks can be further resolved into three characteristic peaks each at 640, 651.96 eV belonging to Mn2+ 2p3/2, and 2p1/2, 641.75, 653.41 eV are the 2p3/2 and 2p1/2 peaks of Mn3+ and at 643.45 eV attributed to the Mn4+ oxidation state arising from the charge balancing due to the Ag+ doping in the lattice. The presence of Mn3+/Mn4+ couple in the system suggests the suitability of the material in ORR application. The O 1s spectrum can be resolved into three, which is shown in Fig. 4D. The peaks at 528.7 (OI), 530.5(OII), and 532.2(OIII) eV can be attributed to the O2− in Mn3O4 crystal lattice, chemisorbed oxygen or hydroxyl group, and the presence of physisorbed or chemisorbed surface water molecules.
 | ||
| Fig. 4 X-ray photoelectron spectra in the Ag 3d (A), Cl 2p (B), Mn 2p (C), and O 1s (D) regions of AgCl–Ag:Mn3O4, Ag 3d (E), Mn 2p (F), and O 1s (G) of Ag–Mn3O4. | ||
The XPS of Ag–Mn3O4 in the Ag 3d region, shown in Fig. 4E, exhibited characteristic peaks corresponding to metallic Ag (367.89 eV and 373.87 eV) with the Ag peaks in Ag2O. Presence of Mn4+ is not observed in Ag–Mn3O4 (Fig. 4F). The characteristic Mn2+ peaks were observed at 640.3, and 652.18 eV, and Mn3+ peaks were observed at 643.1, and 655.2 eV, respectively. The O 1s spectrum is deconvoluted into three peaks at 529.1, 530.6, and 532.6 eV corresponding to O2− in Mn3O4 crystal lattice, chemisorbed oxygen or hydroxyl group, and physisorbed or chemisorbed surface water molecules (Fig. 4G). The presence of three peaks in the O 1s region is reported as due to the presence of oxygen vacancy in the metal oxides.39
The existence of oxygen vacancies in the catalysts are confirmed with EPR spectrum. The EPR spectra of AgCl–Ag:Mn3O4 and Ag–Mn3O4 are given in the ESI Fig. S4.† The peak is due to the presence of unpaired electrons, which are trapped in the oxygen vacancies. A higher peak intensity is observed for AgCl–Ag:Mn3O4 than Ag–Mn3O4, which supports the greater extent of oxygen vacancy formation in AgCl–Ag:Mn3O4.
FTIR and Raman spectroscopic analyses were performed to gather information about the presence of functional groups. The spectra are shown in Fig. S5A, B, and C,† respectively. The characteristic peaks in the lower region 400–600 cm−1 of FTIR correspond to Mn–O vibrations. The Raman spectrum is consistent with the Mn3O4 reported in the literature. The red shift of the Raman peak in AgCl–Ag:Mn3O4 compared to Mn3O4 also supports the structural distortion in Mn3O4 by the Ag doping (see Fig. S5†).
3.1 Electrochemical ORR evaluation of the catalyst
Fig. 5A compares the cyclic voltammogram of the catalysts in nitrogen and oxygen-saturated 0.1 M NaOH solution in a potential range of 0.2 to 1.1 V vs. RHE (scan rate of 10 mV s−1). A prominent peak at 0.68 V shows the ORR activity for the catalyst in the O2-saturated atmosphere, and the peak was absent in the N2-saturated atmosphere. A detailed evaluation of the catalyst's performance was analyzed with ORR polarization, which was performed using catalyst-coated RDE as the working electrode from zero to 2600 rpm. The result obtained is shown in Fig. 5B. An increased current density with rpm is observed, with the limiting current density reaching −5.89 mA cm−2 at 2600 rpm. | ||
| Fig. 5 CV in N2 and O2 saturated electrolyte (A), LSV of AgCl–Ag:Mn3O4 with different rotation rates (B), ORR comparison of Pt/C, AgCl–Ag:Mn3O4 with Mn3O4, and AgCl at 1600 rpm (C), Tafel plots of the AgCl–Ag:Mn3O4 and Mn3O4, and AgCl (D), and comparison of EIS at 0.776 V of AgCl–Ag:Mn3O4 and Mn3O4 (E). | ||
The ORR activity of the catalyst is compared with Mn3O4 and pristine AgCl, which is shown in Fig. 5C. The potential at −0.1 mA cm−2 current density is the onset potential. The onset potential obtained for the catalysts is in the order 0.941 V (Pt/C) > 0.844 V (AgCl–Ag:Mn3O4) > 0.756 V (Mn3O4) > 0.75 V (AgCl). The E1/2 and the Ilim obtained at 1600 rpm are in the order Pt/C (0.79 V, −4.6 mA cm−2) > AgCl–Ag:Mn3O4 (0.64 V, −4.2 mA cm−2) > Mn3O4 (0.65 V, −2.82 mA cm−2) > AgCl (0.643 V, −2.46 mA cm−2). The more positive onset potential of AgCl–Ag:Mn3O4 than the individual counterparts demonstrates the augmented ORR activity of the catalyst due to the synergistic effect. The Tafel slope obtained from mass transport corrected LSV at 1600 rpm for the composite catalyst is compared with Mn3O4, and pristine AgCl is given in Fig. 5D. The catalyst AgCl–Ag:Mn3O4 showed a Tafel slope of 61.6 mV dec−1, and individual species, the Mn3O4 and pristine AgCl, exhibited a Tafel slope of 95.78 mV dec−1, and 93.08 mV dec−1, respectively. ORR performance of the composite was compared with Ag–Mn3O4 (bulk and nano) to know the effect of AgCl. The performance obtained is shown in Fig. S6.†
The AgCl system exhibited enhanced performance compared to the Ag system, with a similar chemical composition ratio, highlighting the role of AgCl in superior ORR activity. Fig. S6† shows the LSV of Pt/C at different rotation speeds and the comparison of the Tafel slope of benchmark Pt/C with the catalyst AgCl–Ag:Mn3O4. Table S2† shows the comparison of electrocatalytic ORR performance with previously reported AgCl, Ag-based electrocatalysts, which shows the comparative performance of the catalyst reported here.
Additional information on the ORR and the inference on electron transfer rate were obtained using the electrochemical impedance spectroscopy (EIS) technique. Fig. 5E compares characteristic Nyquist plots under the frequency limits of 25 kHz and 0.1 Hz of AgCl–Ag:Mn3O4 and Mn3O4. The circuit used to fit the data is shown in the inset. The composite and Mn3O4 exhibited the Nyquist diagram with semicircles of different arc diameters. The EIS circuit confirms the presence of a time constant. The solution resistance is denoted with Rs, and the charge transfer resistance and constant phase element, representing double-layer capacitance, are described with Rp and Q1. The heterogeneity of the electrode surface results in the substitution of pure capacitance with constant phase element Q. The lower Rct value suggests a higher charge transfer capacity during ORR and leads to higher performance. It was observed that the AgCl–Ag:Mn3O4 system exhibited a lower Rct value, indicating superior performance than the Mn3O4. Similarly, EIS was performed on nano and bulk Ag–Mn3O4 and compared with AgCl–Ag:Mn3O4. The results obtained are portrayed in Fig. S6 D,† and the results support the superior performance of the AgCl–Ag:Mn3O4.
Two possible pathways are available for ORR in an alkaline medium to proceed either through the 4e− pathway or through a 2e− pathway, as represented below,
| 4e− pathway O2 + 2H2O + 4e− → 4OH− | (1) |
| 2e− pathway O2 + H2O + 2e− → HO2−+ OH− | (2) |
| HO2− + H2O + 2e− → 3OH− | (3) |
The detailed mechanism was investigated with EIS by measuring the spectra at the three different regions of LSV. Fig. 6(A, C and E) represents the Nyquist plots at kinetic, mixed diffusion-controlled, and mass transport regions. The respective Bode plots are given in Fig. 6(B, D and F). The EIS spectra in the kinetic and mass transport regions were fitted with a simple equivalent circuit consisting of the solution resistance Rs connected in series with a set of charge transfer resistance Rp and constant phase element Q1. A single time constant suggests the 4e− reduction pathway for the ORR, indicating a reduction of O2 to H2O in a single step in these two regions. In contrast, the mixed diffusion-controlled region possesses two-time constants indicating the generation of H2O2 through a 2e− reduction pathway. The values of the circuit parameters used are given in ESI Table S3.† The exponential decrease in the interfacial charge transfer results in convergence to a semicircle in the lower potentials in the kinetic region, which is evident from the EIS. The convergence to semicircle with increased potential was observed for the mixed diffusion-controlled region with an additional constant phase element. A decrease in the potential in the mass transport region marked an increase in polarization resistance due to the higher mass transfer resistance. In the Bode plot, it is clear that the phase angle decreases with a decrease in the potential in the kinetic region. The trend is reversed in the mass transport region, and the phase shift increases due to the increased mass transfer resistance.48–51 In the kinetic and mass transport region, EIS suggests the four e− pathway and two e− pathway in the mixed diffusion region, which is in agreement with the RRDE result of the slight formation of hydrogen peroxide.
 | ||
| Fig. 6 Nyquist and Bode plots of the AgCl–Ag:Mn3O4 in the kinetic region (A and B), mixed-diffusion region (C and D), and mass transport region (E and F) in 0.1 M NaOH (zero rpm). The equivalent circuit used for fitting the Nyquist plot is displayed in the inset. | ||
The 2e− pathway is prone to corrosion of the electrode material by the generation of HO2− species, and it also affects the performance of the membrane. The electron transfer number and percentage of peroxide production were quantified with a rotating ring disc electrode (RRDE). Fig. 7A shows the disc and ring current generated for the AgCl–Ag:Mn3O4. Fig. 7B represents the percentage of peroxide produced, and the electron transfer number in the reaction pathway is shown in Fig. 7C. The catalyst showed an electron transfer of 3.89 with an average peroxide production of 5.2%. As explained in the previous section, this peroxide is generated via the 2e− reduction pathway in the mixed diffusion region. The significantly lower percentage of peroxide supports that the major reaction pathway is the favorable 4e− reduction.
 | ||
| Fig. 7 RRDE voltammogram of AgCl–Ag:Mn3O4 with disc and ring current (A), percentage of peroxide yield (B), electron transfer involved in the reaction (C) at 1600 rpm. | ||
The Pt/C catalyst possesses several disadvantages, such as low methanol tolerance and high corrosion, which are vital in commercializing DMFC. An effective DMFC-applicable ORR catalyst must be tolerant towards methanol and should possess excellent durability after multiple cycles of continuous operation. The AgCl–Ag:Mn3O4 is studied for its methanol tolerance with the aid of the linear sweep voltammetry before and after the addition of 1 M methanol into the electrolyte. The AgCl–Ag:Mn3O4 system retained the onset potential and E1/2 without any noticeable shift and slightly reduced current density (ΔI = 0.77 mA cm−2) after adding 1 M methanol. In contrast, the benchmark catalyst Pt/C exhibited a visible change in E1/2 and current density (ΔE = 0.2 V and ΔI = 0.98 mA cm−2) with a prominent anodic peak. The LSV of AgCl–Ag:Mn3O4 with Pt/C in the absence and presence of 1 M methanol is exhibited in Fig. 8A and B, respectively. Pt/C showed a better onset potential and E1/2 before adding methanol; however, the onset potential and E1/2 are higher for AgCl–Ag:Mn3O4 than Pt/C in the presence of methanol. The methanol tolerance of the catalyst suggests that AgCl–Ag:Mn3O4 is a better catalyst than Pt/C in the event of methanol crossover in DMFC.
 | ||
| Fig. 8 Comparison of LSV of AgCl–Ag:Mn3O4 (A) and Pt/C (B) in the absence and the presence of 1 M methanol, LSV of AgCl–Ag:Mn3O4 (C) and Pt/C (D) before and after ADT analysis at 1600 rpm. | ||
The comparison of accelerated durability analysis of AgCl–Ag:Mn3O4 and Pt/C is given in Fig. 8C and D. Pt/C exhibited a visible change in E1/2, and current density (ΔE1/2 = 0.04 V, and ΔI = 0.58 mA cm−2) after the stability cycles. AgCl–Ag:Mn3O4, a marginal shift is only observed for the E1/2 and current density (ΔE1/2 = 0.002 V, and ΔI = 0.22 mA cm−2) after 2500 cycles. A change in onset potential observed for the composite catalyst could be restored, as discussed earlier in Fig. 1. It is evident that after multiple cycles of operation, Pt/C shows a significant reduction in the catalytic activity; however, AgCl–Ag:Mn3O4 exhibits better corrosion tolerance. Additionally, as discussed earlier, the catalytic performance of AgCl–Ag:Mn3O4 could be restored by treating the electrode with HCl.
The performance of single-step derived AgCl–Ag:Mn3O4 was compared with the two-step synthesized catalyst composed of AgCl and Mn3O4 and the result is shown in Fig. S7.† AgCl–Mn3O4 (two-step) exhibited a lower performance than AgCl–Ag:Mn3O4, with a visible shift in onset potential after ADT analysis. Hence, it is confirmed that the synergistic effect results from the strong interaction developed through the simple coprecipitation reaction is responsible for the enhanced performance of the ORR catalyst. All these experiments show that the AgCl–Ag:Mn3O4 composite is a potential ORR catalyst, especially in the event of methanol crossover and long-term operation. Table S4† shows the values of Eonset, E1/2, and Ilim of the catalyst AgCl–Ag:Mn3O4, and the benchmark catalyst Pt/C, before and after the ADT cycles, confirming the better corrosion tolerance of AgCl–Ag:Mn3O4.
In the stability analysis, we noticed a slight reduction in the performance. The catalyst was collected after the ADT analysis and investigated to understand the reason. Elemental analysis and elemental mapping were done with EDS, shown in Fig. S8.† All elements except chlorine are present in the material after the stability cycles. Samples were analyzed with XRD after single and multiple LSV cycles to verify the existence of AgCl in the ORR potential. The XRD pattern after the stability analysis shown in Fig. S8C† revealed the presence of a significant amount of metallic Ag. No traces of AgCl were observed, which suggests the conversion of AgCl to Ag during the multiple CV cycles. The composite turned to Ag–Ag:Mn3O4 after the CV cycles. Comparing the onset potential and limiting current density before and after stability analysis, it is evident that AgCl–Ag:Mn3O4 shows higher activity than Ag–Ag:Mn3O4. This study reaffirms the role of AgCl in the observed catalytic activity of AgCl–Ag:Mn3O4.
It was seen that the ORR activity is higher in the electrochemically converted system than the bulk Ag–Mn3O4 synthesized by chemical method. The performance was compared and given in Fig. S8E.† It is confirmed that even though a slight reduction in performance was observed after ADT cycles, the catalysts AgCl–Ag:Mn3O4, and the electrochemically converted Ag–Ag:Mn3O4 are still showing admirable ORR performance. The experiment establishes the excellent ORR activity due to the formation of nanoporous Ag during the electrochemical cycle and its structural integrity with the Mn3O4 system, synergistically contributing to the enhanced activity.
To investigate the performance of the catalyst AgCl–Ag:Mn3O4 under the DMFC conditions, a membrane electrode assembly (MEA) was prepared with Pt–Ru (1:1)/C as the anode, AgCl–Ag:Mn3O4 as the cathode catalyst, and PiperION® AEM as the membrane. The OCV was measured with a DMFC single cell connected to a CHI 400 A workstation. A stable OCV was obtained for 10000 s at room temperature and ambient pressure. The details of MEA preparations, measurement conditions, and results are given in ESI in Fig. S9.†
All the experiments suggest an enhanced ORR performance of AgCl–Ag:Mn3O4, compared to Ag–Mn3O4 and Mn3O4. A schematic representation of the proposed mechanism for enhanced ORR activity in AgCl–Ag:Mn3O4 compared to Ag:Mn3O4 is shown in Fig. 9. By forming AgCl, the d-band center of the Ag metal undergoes an upshift. It becomes very close to the Fermi energy level, making the oxygen adsorption more favorable and leading to better catalytic activity. The d-band center energy (εd − εf) of Ag in AgCl is −2.68 eV, which is higher than the d-band center energy value of pure Ag (−4.13 eV) by the charge transfer. The pDOS of Ag and AgCl is shown in Fig. S10.† With the d-band center theory, the upshift of the d-band center implies a stronger binding with oxygen, leading to an increase in ORR activity.
 | ||
| Fig. 9 Schematic representations of the d-band center shift in AgCl–Ag:Mn3O4 than Ag:Mn3O4 contributing to enhanced ORR activity. | ||
The excellent ORR activity of Mn3O4 is attributed to the presence of multivalent Mn in the oxide. The synergistic effect of the upshift of the d-band center of Ag by the formation of AgCl, and the presence of Mn2+ and Mn3+/Mn4+ redox centers in Ag:Mn3O4 contributed to the enhanced catalytic activity of the composite AgCl–Ag:Mn3O4.
The single-step synthesis points to a viable low-cost, easy-to-mass-produce catalyst with excellent methanol tolerance and durability. It should be noted that even though the AgCl is converted to Ag during multiple electrochemical cycles or long-term operation, it is regenerable with the treatment with HCl. The regeneration of the crystal structure was confirmed by the XRD analysis, which is shown in ESI in Fig. S8D.†
This work demonstrated that Ag–Mn3O4 and AgCl–Ag:Mn3O4 are excellent ORR catalysts and pointed out the role of AgCl in enhancing the catalytic activity of Ag-doped Mn3O4 toward DMFC application.
4. Conclusions
In summary, we have demonstrated a one-step coprecipitation method to synthesize AgCl–Ag doped Mn3O4 for ORR application. The catalyst exhibited superior durability and methanol tolerance compared to the standard Pt/C. The catalytically favored 4e− oxygen reduction reaction mechanism was confirmed by the EIS and RRDE analysis with a minimal peroxide formation. The role of AgCl in the augmentation of ORR is demonstrated by comparing the ORR activity of Ag:Mn3O4 and AgCl–Ag:Mn3O4. However, a reduction in ORR performance was observed after the stability cycles due to the conversion of AgCl to Ag. We established that it should be possible to regenerate AgCl by treating it with HCl, and retain the ORR activity. Thus, a highly stable and methanol-tolerant ORR catalyst is developed in this work. To be effectively used in a DMFC application, a membrane electrode assembly (MEA) that can be regenerated by gentle treatment is under investigation.Conflicts of interest
There are no conflicts to declare.Acknowledgements
The authors gratefully acknowledge the financial support from the Science and Engineering Research Board (SERB), Government of India, for the work on mixed transition metal oxide ORR catalysts under the core research grant program (Grant No. CRG/2019/005715 and CRG/2023/006797). We acknowledge the support of DST for the Inspire fellowship to AY (Grant No. IF180917) NS thanks the SERB for the POWER fellowship (Grant No. SPF/2021/000008). Acknowledgments are due to the Centre for Material Characterization (CMC), NIT Calicut for Raman and XRD analysis, IISER Trivandrum for providing XPS facilities, CRF CeNS for the TEM analysis, and Department of Mechanical Engineering (Coimbatore Institute of Technology) for SEM analysis, Sainergy Fuel Cell India Pvt Ltd for assistance in MEA fabrication. We also thank Mr M. Ibrahim Shah for his help during the MEA experiments. We thank the DST for the FIST support SR/FST/ET-I/2021/840.Notes and references
- A. Yatheendran and N. Sandhyarani, Chapter 9 – Oxygen reduction reaction in methanol fuel cells, Oxygen Reduction Reaction, ed. K. Sengupta, S. Chatterjee and K. Dutta, Elsevier. 2022, pp. 305–336, ISBN 9780323885089 Search PubMed.
- Z. Abdin, N. Al Khafaf, B. McGrath, K. Catchpole and E. Gray, Sustainable Energy Fuels, 2023, 2042–2062 RSC.
- K. Xiao, Y. Wang, P. Wu, L. Hou and Z. Q. Liu, Angew. Chem., Int. Ed., 2023, 62, e202301408 CrossRef CAS PubMed.
- A. Qazi, F. Hussain, N. A. B. D. Rahim, G. Hardaker, D. Alghazzawi, K. Shaban and K. Haruna, IEEE Access, 2019, 7, 63837–63851 Search PubMed.
- X. Li and A. Faghri, J. Power Sources, 2013, 226, 223–240 CrossRef CAS.
- T. Tamaki, A. Yamauchi, T. Ito, H. Ohashi and T. Yamaguchi, Fuel Cells, 2011, 11, 394–403 CrossRef CAS.
- Z. Wang, P. Wu, X. Zou, S. Wang, L. Du, T. Ouyang and Z. Q. Liu, Adv. Funct. Mater., 2023, 33, 2214275, DOI:10.1002/adfm.202214275.
- M. Sharma, N. Jung and S. J. Yoo, Chem. Mater., 2018, 30, 2–24 CrossRef CAS.
- K. Nubla, M. F. Puthiyaparambath, R. Chatanathodi and N. Sandhyarani, Mater. Chem. Front., 2022, 6, 2042–2050 RSC.
- K. Nubla and N. Sandhyarani, Electrochim. Acta, 2020, 340, 135942 CrossRef CAS.
- C. Yuan, H. Bin Wu, Y. Xie and X. W. Lou, Angew. Chem., Int. Ed., 2014, 53, 1488–1504 CrossRef CAS PubMed.
- Z. Huang, X. Qin, X. Gu, G. Li, Y. Mu, N. Wang, K. Ithisuphalap, H. Wang, Z. Guo, Z. Shi, G. Wu and M. Shao, ACS Appl. Mater. Interfaces, 2018, 10, 23900–23909 CrossRef CAS PubMed.
- C. S. Li, Y. Sun, W. H. Lai, J. Z. Wang and S. L. Chou, ACS Appl. Mater. Interfaces, 2016, 8, 27710–27719 CrossRef CAS PubMed.
- L. Li, J. Yang, H. Yang, L. Zhang, J. Shao, W. Huang, B. Liu and X. Dong, ACS Appl. Energy Mater., 2018, 1, 963–969 CrossRef CAS.
- I. M. Mosa, S. Biswas, A. M. El-Sawy, V. Botu, C. Guild, W. Song, R. Ramprasad, J. F. Rusling and S. L. Suib, J. Mater. Chem. A, 2015, 4, 620–631 RSC.
- I. Roche, E. Chaînet, M. Chatenet and J. Vondrák, J. Phys. Chem. C, 2007, 111, 1434–1443 CrossRef CAS.
- F. Cheng, Y. Su, J. Liang, Z. Tao and J. Chen, Chem. Mater., 2010, 22, 898–905 CrossRef CAS.
- Q. Wu, L. Jiang, L. Qi, E. Wang and G. Sun, Int. J. Hydrogen Energy, 2014, 39, 3423–3432 CrossRef CAS.
- H. Q. Dong, Y. Y. Chen, M. Han, S. L. Li, J. Zhang, J. Sen Li, Y. Q. Lan, Z. H. Dai and J. C. Bao, J. Mater. Chem. A, 2014, 2, 1272–1276 RSC.
- D. Z. Khater, R. S. Amin, M. Mahmoud and K. M. El-Khatib, RSC Adv., 2022, 12, 2207–2218 RSC.
- C. Chowde Gowda, A. Mathur, A. Parui, P. Kumbhakar, P. Pandey, S. Sharma, A. Chandra, A. K. Singh, A. Halder and C. S. Tiwary, J. Ind. Eng. Chem., 2022, 113, 153–160 CrossRef CAS.
- Y. C. Zhang, S. Ullah, R. Zhang, L. Pan, X. Zhang and J. J. Zou, Appl. Catal., B, 2020, 277, 119247 CrossRef CAS.
- H. Tian, L. Zeng, Y. Huang, Z. Ma, G. Meng, L. Peng, C. Chen, X. Cui and J. Shi, Nano-Micro Lett., 2020, 12, 1–14 CrossRef PubMed.
- S. K. Bikkarolla, F. Yu, W. Zhou, P. Joseph, P. Cumpson and P. Papakonstantinou, J. Mater. Chem. A, 2014, 2, 14493–14501 RSC.
- S. Choi, Y. Park, J. Choi, C. Lee, H. S. Cho, C. H. Kim, J. Koo and H. M. Lee, ACS Sustain. Chem. Eng., 2021, 9, 7519–7528 CrossRef CAS.
- S. Jin Kim, S. C. Lee, C. Lee, M. H. Kim and Y. Lee, Nano Energy, 2018, 48, 134–143 CrossRef.
- A. L. Nigusie and M. Ujihara, Phys. Chem. Chem. Phys., 2021, 23, 16366–16375 RSC.
- W. Wang, J. Q. Chen, Y. R. Tao, S. N. Zhu, Y. X. Zhang and X. C. Wu, ACS Catal., 2019, 9, 3498–3510 CrossRef CAS.
- B. H. Toby and R. B. Von Dreele, J. Appl. Crystallogr., 2013, 46, 544–549 CrossRef CAS.
- P. Giannozzi, S. Baroni, N. Bonini, M. Calandra, R. Car, C. Cavazzoni, D. Ceresoli, G. L. Chiarotti, M. Cococcioni, I. Dabo, A. Dal Corso, S. De Gironcoli, S. Fabris, G. Fratesi, R. Gebauer, U. Gerstmann, C. Gougoussis, A. Kokalj, M. Lazzeri, L. Martin-Samos, N. Marzari, F. Mauri, R. Mazzarello, S. Paolini, A. Pasquarello, L. Paulatto, C. Sbraccia, S. Scandolo, G. Sclauzero, A. P. Seitsonen, A. Smogunov, P. Umari and R. M. Wentzcovitch, J. Phys.: Condens.Matter, 2009, 21, 395502 CrossRef PubMed.
- P. Giannozzi, O. Andreussi, T. Brumme, O. Bunau, M. B. Nardelli, M. Calandra, R. Car, C. Cavazzoni, D. Ceresoli and M. Cococcioni, et al. , J. Phys.: Condens.Matter, 2017, 29, 465901 CrossRef CAS PubMed.
- H. Dhaouadi, A. Madani and F. Touati, Mater. Lett., 2010, 64, 2395–2398 CrossRef CAS.
- J. Li, M. Zhang, E. A. Elimian, X. Lv, J. Chen and H. Jia, Chem. Eng. J., 2021, 412, 128560 CrossRef CAS.
- K. Momma and F. Izumi, J. Appl. Crystallogr., 2011, 44, 1272–1276 CrossRef CAS.
- Y. Bao and K. Chen, Nano-Micro Lett., 2016, 8, 182–192 CrossRef PubMed.
- A. Shahzad, W. S. Kim and T. Yu, Dalton Trans., 2016, 45, 9158–9165 RSC.
- N. J. Firet, M. A. Blommaert, T. Burdyny, A. Venugopal, D. Bohra, A. Longo and W. A. Smith, J. Mater. Chem. A, 2019, 7, 2597–2607 RSC.
- J. Liu, J. Liu, W. Song, F. Wang and Y. Song, J. Mater. Chem. A, 2014, 2, 17477–17488 RSC.
- W. Wang, J. Q. Chen, Y. R. Tao, S. N. Zhu, Y. X. Zhang and X. C. Wu, ACS Catal., 2019, 9, 3498–3510 CrossRef CAS.
- J. K. Pulleri, S. K. Singh, D. Yearwar, G. Saravanan, A. S. Al-Fatesh and N. K. Labhasetwar, Catal. Lett., 2021, 151, 172–183 CrossRef CAS.
- M. W. Li, M. H. Fu, Y. Cao, H. Wang, H. Yu, Z. Qiao, H. Liang and F. Peng, ChemElectroChem, 2019, 6, 359–368 CrossRef CAS.
- T. Li, B. Xue, B. Wang, G. Guo, D. Han, Y. Yan and A. Dong, J. Am. Chem. Soc., 2017, 139, 12133–12136 CrossRef CAS PubMed.
- M. P. Araújo, M. Nunes, I. M. Rocha, M. F. R. Pereira and C. Freire, J. Mater. Sci., 2019, 54, 8919–8940 CrossRef.
- F. Arshad, N. Parveen, S. A. Ansari, J. A. Khan and M. P. Sk, Environ. Sci. Pollut. Res., 2023, 30, 71464–71471 CrossRef CAS PubMed.
- R. Farzana, K. Hassan and V. Sahajwalla, Sci. Rep., 2019, 9, 1–12 CrossRef CAS PubMed.
- Y. Wang, J. Hao, W. Li, X. Zuo, B. Xiang, Y. Qiang, X. Zou, B. Tan, Q. Hu and F. Chen, J. Mater. Sci., 2020, 55, 724–737 CrossRef CAS.
- V. Hiremath, M. Cho and J. G. Seo, New J. Chem., 2018, 42, 19608–19614 RSC.
- F. Cao, Z. Zang, S. Sun, X. Sun, X. Li, T. Liu and J. Wu, The Influence of Deposited Potential on the ORR Activity of Pt Catalysts on Glassy Carbon Electrode, RSC Adv., 2017, 7(41), 25429–25436 RSC.
- H. Xu, J. Chen, Y. Li, X. Guo, Y. Shen, D. Wang, Y. Zhang and Z. Wang, Sci. Rep., 2017, 7, 1–10 CrossRef PubMed.
- R. K. Singh, R. Devivaraprasad, T. Kar, A. Chakraborty and M. Neergat, J. Electrochem. Soc., 2015, 162, F489–F498 CrossRef CAS.
- A. Yatheendran and N. Sandhyarani, Int. J. Hydrogen Energy, 2023, 48, 2959–2972 CrossRef CAS.
Footnote |
| † Electronic supplementary information (ESI) available. See DOI: https://doi.org/10.1039/d4ta03285c |
| This journal is © The Royal Society of Chemistry 2024 |