 Open Access Article
Creative Commons Attribution 3.0 Unported Licence
Modulating the porosity of N-doped carbon materials for enhanced CO2 capture and methane uptake†
Nawaf
Albeladi
 ab and
Robert
Mokaya
 *ac
*ac
aSchool of Chemistry, University of Nottingham, University Park, Nottingham NG7 2RD, UK
bTaibah University, Yanbu Al Bahr, 46423, Saudi Arabia
cDepartment of Chemistry, Dainton Building, The University of Sheffield, Brook Hill, Sheffield, S3 7HF, UK. E-mail: r.mokaya@sheffield.ac.uk
First published on 24th June 2024
Abstract
N-doped carbons with modulated porosity have been prepared via the addition of melamine or urea as a N source to an activation mixture containing biomass-derived carbonaceous matter of low O/C ratio (air-carbonised date seed, Phoenix dactylifera, ACDS), and potassium hydroxide (KOH) as an activating agent. To access a broad range of surface area and mix of porosity characteristics, a series of carbons were prepared by varying the following: (i) the amount of melamine or urea (at melamine or urea/ACDS ratio of 1 or 2), (ii) the KOH/ACDS ratio (2 or 4), and (iii) activation temperature (600, 700, or 800 °C). We found that the N added to the activation mix acts both as an N-dopant and porogen, with the latter effect enabling formation of larger pores, which extended the pore size distribution of resulting porous carbons into the mesopore region. Furthermore, the presence of N acts to increase the surface area and provides carbons with tuneable porosity (with respect to the mix of microporosity and mesoporosity) and variable packing density, all of which may be tailored towards suitability for enhanced uptake of CO2 and/or methane. The activated carbons have significant N content of up to 18 wt%, surface area of up to 3600 m2 g−1, and pore volume that reaches 2.1 cm3 g−1. Depending on the preparation conditions and resulting mix of micro/mesoporosity, the carbons show excellent low pressure CO2 capture at 25 °C of 1.7 mmol g−1 at 0.15 bar and 4.7 mmol g−1 at 1 bar, and uptake of up to 25 mmol g−1 at 20 bar. The porosity and packing density may also be directed towards excellent methane storage with gravimetric uptake of up to 0.42 g g−1 at 25 °C and 100 bar, volumetric storage capacity of up to 266 cm3 (STP) cm−3 at 25 °C and 100 bar, and a working capacity (for 100 to 5 bar pressure swing) of 196 cm3 (STP) cm−3.
1. Introduction
Increasing environmental pollution, caused in large part by excessive use of fossil fuels, is a serious threat to future generations of mankind, and to all forms of life on Earth. The CO2 produced by the combustion of fossil fuels is widely believed to be a significant factor amongst greenhouse gas (GHG) emissions in causing consequences that engender global warming.1,2 It is, therefore, critical to capture CO2 emissions whilst simultaneously reducing global net GHG emissions via consumption reduction and the use of ‘green’ energy sources. Carbon capture and storage (CCS) via the use of solid adsorbents is currently a promising strategy that has attracted significant attention as a viable solution for mitigating the ever-increasing CO2 emissions.2–6 Research into alternative energy sources is encouraged more than ever, with the goal of shifting from fossil fuels to using renewable, cleaner, and sustainable fuels. As an alternative fuel, natural gas (NG), the main component of which is methane, is more environmentally-friendly compared to traditional fossil fuels.7–11 However, despite the potential benefits of using natural gas, the current storage methods, whether by liquefying or compression, are expensive, energy-intensive, and pose safety concerns, and therefore remain a barrier to its widespread use.7–14 Recently, adsorbed natural gas (ANG), which typically involves physisorption onto porous adsorbents, has attracted attention as a potential alternative method for storing NG under ambient temperature and low pressure conditions that would increase the viability of NG. Storing ANG on a solid material has several advantages over traditional liquefied natural gas (LNG) or compressed natural gas (CNG) techniques, including higher energy density, better safety, and improved energy efficiency.7–11,15–18 Current research is therefore focused on preparing suitable adsorbents that have the desired properties for high performance methane storage.Among the current known adsorbent materials, porous carbons have gained considerable attention in gas capture and storage for environmental remediation.19–25 Due to their widespread availability from low-cost and sustainable resources, ease of synthesis, high thermal and chemical stability, and tuneable structural properties, activated carbons have potential not only for CCS26–35 but also as methane storage materials.36–39 Biomass sources, usually in waste form, are among the most commonly used precursors in the production of activated carbon, due to their wide availability and affordability, and carbon-rich nature.39–44 The surface area and overall porosity of any adsorbent are important factors by which the total amount of gas adsorbed can be determined. The elemental composition, the nature of the precursors, the mode of carbonisation, and the activation parameters, including the type and amount of activating agent, and the temperature, all have an influence on the structural properties of activated carbons.25,36–38 Among the various chemical activation agents, KOH is widely used due to its effectiveness in controlling the surface area and porosity of the resulting carbon via adjustment of the activation conditions.43,45–47 Carbons obtained via this method can exhibit high surface area (>2800 m2 g−1), and their pore size can be tuned between ultramicropores/micropores and small mesopores.19,48 However, although these carbons have shown advantages in certain applications, especially at low-pressure adsorption, their use in energy-related applications at high-pressures remains limited, due to limits on their mesoporosity.49,50 Only a few examples of precursors, such as polypyrrole,50 imidazolium-based ionic liquids,51 zeolite-templated carbons,52 or graphene,53 have generated activated materials with a high level of mesoporosity when activated with KOH.
The surface area and porosity of activated carbons can be modified further by adding so-called mediators.48,54,55 For example, Fuertes and Sevilla prepared high-surface area carbons via the KOH-activation of hydrochar, using melamine as a mediator.56 While a large surface area is important for high-pressure gas storage, the materials must exhibit other characteristics to be suitable for methane uptake. For instance, when materials have a high surface area and pore volume, the packing density decreases, causing a decrease in volumetric gas uptake.57 Hence, in order to obtain a material with suitable properties for methane adsorption, the adsorbent should exhibit an optimal balance between possessing a high surface area, mix of microporosity/mesoporosity, and a high packing density.
We have recently demonstrated that the atomic ratio of oxygen to carbon (O/C ratio) of any precursor (carbonaceous matter) is a key factor via which the porosity and packing density can be predicted and modulated.35–38,43,45,46 Depending on the type of biomass and the mode of carbonisation, the behaviour of carbonaceous matter during activation can vary.34–36,38,43 For example, carbonaceous matter with a high O/C ratio generates activated carbons with high surface area and a large pore volume but with a low packing density.25,58,59 In contrast, a precursor with a low O/C ratio generates carbons with a high degree of microporosity and a high packing density, but with a surface area that hardly exceeds 2500 m2 g−1.25,35,37,38,43,46 This phenomenon is attributed to the susceptibility, or resistance, of a precursor to activation.25,36–38,43 As a consequence, the porosity, and in particular the micropore/mesopore mix, can be influenced by the O/C ratio of the precursor, which in turn plays a key role in predicting the packing density, which is a key factor in determining volumetric gas uptake.24,34,48,60–62 An activated carbon with a high packing density is highly desirable for methane uptake, especially when coupled with high surface area.
The objective of this work was to synthesize activated carbons with modulated porosity, appropriate for CO2 and/or methane storage, by adding a mediator. Specifically an N-containing additive was added to the precursor during activation. In an attempt to enhance both the porosity and packing density, a precursor with a low O/C ratio, namely air-carbonised date seeds (Phoenix dactylifera), designated as ACDS, which is known to be resistant to activation, was utilised.38 The low O content of the ACDS carbon was expected to favour generation of activated carbons with a high packing density, while the presence of N-containing additives would work to increase the surface area. This combination is expected to generate activated carbons with high surface area, tuneable porosity (micropore/mesopore mix), and variable packing density. The interplay between these three factors was expected to yield carbons with a range of desirable properties suited for CO2 and/or methane storage.
2. Experimental section
2.1 Synthesis of N-doped carbons
2.2 Materials characterisation
An exeter analytical CE-440 elemental analyser was used for CHN analysis. A TA instruments SDT Q600 analyser was used to perform thermogravimetric analysis (TGA) in ambient air (100 mL min−1) conditions at heating ramp rate of 10 °C min−1. Powder XRD analysis was performed using a PANalytical X'Pert PRO diffractometer with a Cu-Kα light source (40 kV, 40 mA), a step size of 0.021, and step time of 50 s. Porosity analysis and textural properties of the activated carbons were determined using nitrogen sorption analysis (at −196 °C) using a Micromeritics 3FLEX sorptometer. The samples were degassed under vacuum for 16 h at 240 °C prior to analysis. The surface area was calculated using the Brunauer–Emmett–Teller (BET) method applied to nitrogen sorption isotherms according to Rouquerol rules, in the relative pressure (P/P0) range of 0.02–0.22. The relative pressure range used to calculate surface area was maintained so that the multipoint BET fitting produced a positive y-axis intercept (i.e., C > 0) and Vads(1 − P/P0) increased with P/P0. The total pore volume was determined from the total nitrogen adsorbed at a relative pressure near saturation (P/P0 ≈ 0.99). The micropore surface area and micropore volume were obtained via t-plot analysis. The pore size distributions (PSDs) were determined by applying the non-local density functional theory (NL-DFT) method to the nitrogen adsorption data with the assumption of a slit pore model. Scanning electron microscopy (SEM) images were obtained using a JEOL 7000F FEG-SEM microscope. Transmission electron microscopy (TEM) images were obtained using a JEOL 2100F instrument operating at 200 kV and equipped with a Gatan Orius CCD for imaging. Prior to analysis, the carbon samples were suspended in distilled water and dispersed onto lacey carbon support films.2.3 CO2 and methane uptake measurements
Using a Hiden Isochema intelligent gravimetric analyser (IGA-003), CO2 uptake of the carbons was determined in the pressure range of 0–20 bar at room temperature. The methane uptake was determined using a Hiden Isochema XEMIS analyser at 25 °C and a pressure range of 0–100 bar. In all cases, the carbons were degassed at 240 °C for several hours before performing the gas uptake measurements.3. Results and discussion
3.1 Yield and elemental composition
The yields and/or elemental composition of the raw date seeds, air carbonised date seeds (ACDS), and activated carbons are summarised in Tables 1 and 2. The raw date seeds have a high C content and relatively low O content with an O/C ratio of ∼0.66, which is relatively low for biomass where typical values are between 0.75 and 1.0.38 When biomass is subjected to air-carbonisation, the O/C ratio of the resulting carbonaceous matter is reduced to a greater extent than for other carbonisation methods such as hydrothermal carbonisation or conventional pyrolysis.43 For this reason we adopted air-carbonisation to convert the raw date seeds to carbonaceous matter. Following air-carbonisation, the C content increased from 49.4 wt% for the raw date seeds to 76.7 wt% for the ACDS carbon. On the other hand, the apparent O content decreased from 43.5 wt% to 17.5 wt%, while the H content decreased from 6 wt% to 3.8 wt%. Thus the O/C ratio of the ACDS carbon is 0.171, which is quite low for biomass-derived carbonaceous matter.38 For the premixed precursors (DSM-x and DSU-x), the nominal N content increases significantly while the amount of C and O reduce compared to the ACDS carbon. For activated carbons prepared at melamine/ACDS ratio of 1, the N content is between 0.8 and 8.4 wt% depending on the severity of activation. At melamine/ACDS ratio of 2, the activated carbons have N content of between 1.2 and 18.0 wt%, the latter of which is remarkably high. The N content of the activated carbons decreases with rise in activation temperature and/or amount of KOH used. For example, the N content of DSM2600-1 is 8.4 wt%, which reduces to 2.5 wt% for DSM2800-1, and 4.6 wt% for DSM4600-1. In this way, the N/C ratio decreases at higher activation temperature (ESI Fig. S2†).| Sample | Yield [wt%] | C [%] | H [%] | N [%] | O [%] | (O/C)a | (N/C)a |
|---|---|---|---|---|---|---|---|
| a Atomic ratio | |||||||
| Raw DS | — | 49.4 | 6.0 | 1.1 | 43.5 | 0.660 | 0.019 |
| ACDS | 50 | 76.7 | 3.8 | 2.0 | 17.5 | 0.171 | 0.022 |
| DSM-1 | — | 51.5 | 4.0 | 36.0 | 8.5 | 0.124 | 0.599 |
| DSU-1 | — | 46.1 | 5.3 | 26.2 | 22.4 | 0.364 | 0.487 |
| DSM2600-1 | 40 | 73.4 | 1.5 | 8.4 | 16.7 | 0.171 | 0.098 |
| DSM2700-1 | 31 | 78.6 | 0.9 | 7.2 | 13.3 | 0.127 | 0.079 |
| DSM2800-1 | 25 | 86.9 | 0.1 | 2.5 | 10.5 | 0.091 | 0.025 |
| DSM4600-1 | 32 | 74.8 | 0.5 | 4.6 | 20.1 | 0.202 | 0.053 |
| DSM4700-1 | 28 | 78.0 | 0.3 | 3.8 | 17.9 | 0.172 | 0.042 |
| DSM4800-1 | 16 | 90.0 | 0.0 | 0.8 | 9.2 | 0.077 | 0.008 |
| DSU4800-1 | 21 | 92.6 | 0.1 | 0.5 | 6.8 | 0.055 | 0.005 |
In general, the C content of the activated carbons increases compared to that of the precursors, which is accompanied by a decrease in the amount of N, H and O, except that some samples activated at the lowest temperature show a decrease in their C content associated with their very high N content. Thus, the C content of activated carbons derived from DSM-1 increased from 73.4 wt% for DSM2600-1 to 90.0 wt% for DSM4800-1, while the H and O content decreased from 1.5 and 16.7 wt% to nil and 9.2 wt%, respectively. For DSM-2-derived carbons, the C content increases from 67.7 wt% (DSM2600-2) to 89.6 wt% (DSM4800-2), while the H content decreases from 1.5 to 0.2 wt% and the O content lowers from 12.8 to 9.2 wt%.
The flash air-carbonisation of raw date seeds resulted in a 50% yield of ACDS carbon. For the carbons obtained from DSM-1, the yield is between 16 and 40 wt% and for those derived from DSM-2, the yield is in the range of 10 to 33 wt%. The lower yield at high activation temperature may be ascribed to the decomposition of endogenic carbon nitride. The presence of melamine increased the susceptibility of the ACDS carbon to activation, meaning that the mechanism of activation is likely different from that of N-free precursors.48,55,63–65 At elevated temperatures, the K+ salts etch N species, resulting in N loss from the surface by the formation of inorganic salts (KOCN or KCN) according to eqn (1) and (2).64,65 The strength of interaction between N and K+ depends on how much of each is present in the precursor. This is consistent with the elemental composition of the activated carbons and shows that the overall loss of N, especially for high temperature activation, is related to the K/melamine ratio (N![[thin space (1/6-em)]](https://www.rsc.org/images/entities/char_2009.gif) :
:![[thin space (1/6-em)]](https://www.rsc.org/images/entities/char_2009.gif) K+) during the activation process.
K+) during the activation process.
| K2CO3 + C–N → KOCN + –CO2K | (1) |
| KOCN + C → KCN + CO | (2) |
Altogether, it seems that K+ attacks surface N species easily and preferentially, even when there are large amounts of surface O.64 This provides further evidence that the activation mechanism involves a surface-mediated etching reaction, which has the effect of decreasing the overall yield of the carbons.
3.2 Thermal stability and morphology
Thermogravimetric analysis (TGA) was performed to ascertain the purity of the carbons and their thermal stability. After an initial weight loss below 100 °C, which is attributed to the evaporation of adsorbed moisture, the activated carbons are stable up to 500 °C (ESI Fig. S3 and S4†). This is followed by a significant weight loss in a single step as a result of carbon combustion. In general, the carbons have hardly any residual mass, indicating that they are carbonaceous materials with minimal, trace or nil amounts of inorganic content. X-ray diffraction (XRD) patterns (ESI Fig. S5 and S6†) show broad features at 2-theta = 24.7° and 43° assigned to (002) and (100) diffractions of graphitic carbon, respectively. The intensity of these broad peaks reduced when the amount of activating agent was increased (ESI Fig. S6†), which supports the expectation that the K+ preferentially attacks N atoms, which leads to greater amorphisation. SEM images of representative carbons prepared at low KOH/ACDS ratio reveal a conchoidal morphology (Supporting Fig. S7†), while carbons prepared at higher KOH/ACDS have rough-surface morphology. HRTEM images (Supporting Fig. S8†) reveal a disordered porous structure, which is typical for activated carbons.3.3 Porosity and textural properties
The nitrogen sorption isotherms and corresponding pore size distribution (PSD) curves of activated carbons prepared at melamine or urea/ACDS ratio of 1 are shown in Fig. 1 and 2. The isotherm type depends on the amount of KOH and/or the activation temperature. Thus, as shown in Fig. 1, carbons obtained at a KOH/ACDS ratio of 2 exhibit type I isotherms indicative of microporosity but with a broader adsorption “knee” for samples prepared at higher activation temperature (e.g., DSM2800-1). The broadening in the adsorption knee indicates the presence of larger pores (supermicropores and small mesopores), as confirmed by the PSD curves in Fig. 1B. The isotherms of samples prepared at KOH/ACDS ratio of 4 are either type I (DSM4600-1 and DSM4700-1) or show a greater proportion of mesoporosity at higher activation temperature (DSM4800-1) as shown in Fig. 2. The isotherms of DSM4600-1 and DSM4700-1 are primarily type I but with a broader adsorption knee, indicating the presence of larger micropores. For activation at 800 °C (DSM4800-1 and DSU4800-1), the isotherm shape was close to type IV. The near mesoporous nature of DSM4800-1 and DSU4800-1 contrasts with the microporous nature of carbons prepared from activation of ACDS alone.37 Clearly, the presence of melamine and urea, which introduce N to the activation mix, has the effect of increasing the susceptibility of the ACDS carbon to activation thus generating larger pores with dimensions in the large micropore and small mesopore range as shown in Fig. 2B.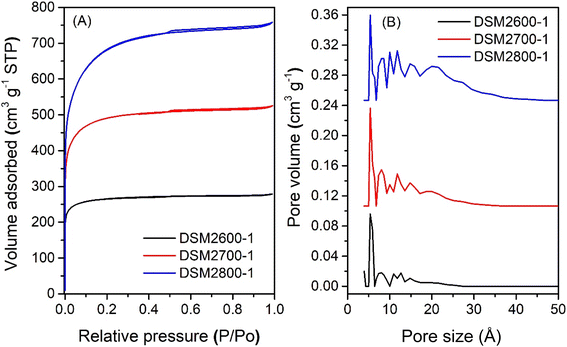 | ||
| Fig. 1 Nitrogen sorption isotherms (A) and pore size distribution curves (B) of activated carbons prepared at melamine/ACDS ratio of 1 and KOH/ACDS ratio of 2. | ||
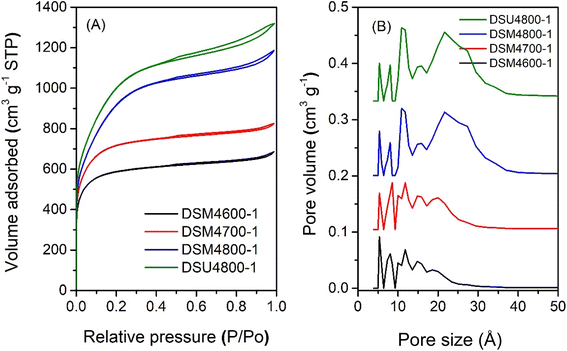 | ||
| Fig. 2 Nitrogen sorption isotherms (A) and pore size distribution curves (B) of activated carbons prepared at melamine or urea/ACDS ratio of 1 and KOH/ACDS ratio of 4. | ||
The nitrogen sorption isotherms and PSD curves of activated carbons prepared at melamine or urea/ACSD ratio of 2 are shown in Fig. 3 and 4. In general, except for samples generated at a high severity of activation (DSM4800-2 and DSU4800-2), all samples show a type I isotherm, typical of microporous materials. The total amount of nitrogen adsorbed rises with the activation temperature and the amount of KOH used. Carbons prepared at a KOH/ACDS ratio of 2 (Fig. 3) are microporous although with a broad adsorption knee for DSM2800-2. For KOH/ACDS ratio of 4 (Fig. 4), the isotherms for DSM4600-2 and DSM4700-2 are typically microporous while those for DSM4800-2 and DSU4800-2 shift towards significant mesoporosity (i.e., type IV character). Overall, the isotherms of samples prepared at melamine/ACDS ratio of 2 are very similar to those generated at a ratio of 1, although the latter suggest higher levels of porosity. This indicates that use of excessive amounts of N-dopants, i.e., melamine or urea/ACDS ratio beyond 1, does not significantly alter the porosity.
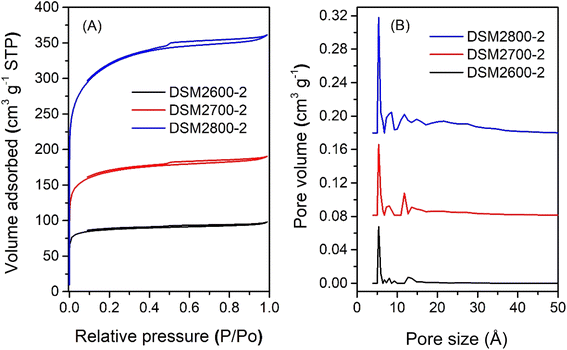 | ||
| Fig. 3 Nitrogen sorption isotherms (A) and pore size distribution curves (B) of activated carbons prepared at melamine/ACDS ratio of 2 and KOH/ACDS ratio of 2. | ||
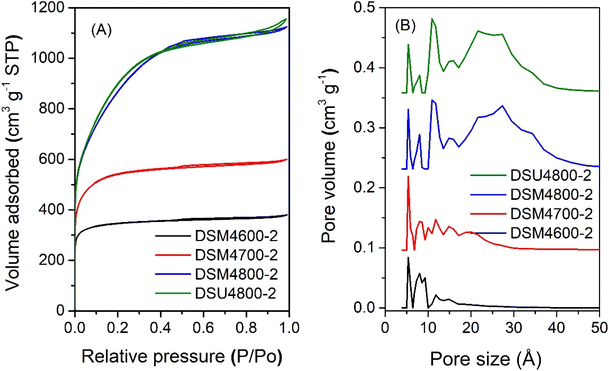 | ||
| Fig. 4 Nitrogen sorption isotherms (A) and pore size distribution curves (B) of activated carbons prepared at melamine or urea/ACDS ratio of 2 and KOH/ACDS ratio of 4. | ||
The porosity depicted in Fig. 1 and 4 clearly shows that the N![[thin space (1/6-em)]](https://www.rsc.org/images/entities/char_2009.gif) :
:![[thin space (1/6-em)]](https://www.rsc.org/images/entities/char_2009.gif) K ratio plays an important role in pore formation. For DSMxT-1 carbons, porosity levels range from microporous to mesoporous depending on the amount of KOH and the activation temperature. For samples DSM2600-1, DSM2700-1 and DSM2800-1, the porosity falls in between micro/supermicroporous to small mesoporous (1.0–2.5 nm pores), with moderate N content retained in the carbons. For samples activated with higher amounts of KOH (KOH/precursor ratio of 4), there was a greater loss of N accompanied by the formation of larger pores. Bimodal pore size distributions are seen in these samples, with a smaller percentage of micropores centred at ca. 0.8 nm and 1.1 nm, and a much greater proportion of mesopores centred at ca. 2.5 nm, as shown in Fig. 1B. Thus the proportion of mesopores in DSM2T-1 carbons is lower than for DSM4T-1 samples, which may be ascribed to greater formation of K2CO3 leading to more etching out of N species with the overall effect of increasing porosity.
K ratio plays an important role in pore formation. For DSMxT-1 carbons, porosity levels range from microporous to mesoporous depending on the amount of KOH and the activation temperature. For samples DSM2600-1, DSM2700-1 and DSM2800-1, the porosity falls in between micro/supermicroporous to small mesoporous (1.0–2.5 nm pores), with moderate N content retained in the carbons. For samples activated with higher amounts of KOH (KOH/precursor ratio of 4), there was a greater loss of N accompanied by the formation of larger pores. Bimodal pore size distributions are seen in these samples, with a smaller percentage of micropores centred at ca. 0.8 nm and 1.1 nm, and a much greater proportion of mesopores centred at ca. 2.5 nm, as shown in Fig. 1B. Thus the proportion of mesopores in DSM2T-1 carbons is lower than for DSM4T-1 samples, which may be ascribed to greater formation of K2CO3 leading to more etching out of N species with the overall effect of increasing porosity.
On the other hand, at melamine/ACDS ratio of 2, there is an increase in the N content relative to the K in the mixture (i.e., rise in N/K ratio), meaning an excess amount of N, which is then retained in the activated carbon at amounts of up to 18 wt% as shown in Table 2. A higher amount of N can also lead to the formation of KCN, an unreacted species, which can result in a decrease in porosity at apparently high N content.64 Thus DSM2600-2, DSM2700-2, and DSM2800-2, have ultra-microporous characteristics with pores centred at 0.5 to 1.1 nm and hardly any pores larger than 2 nm. At melamine/ACDS ratio of 2 and higher KOH/precursor ratio of 4, lowering in the N![[thin space (1/6-em)]](https://www.rsc.org/images/entities/char_2009.gif) :
:![[thin space (1/6-em)]](https://www.rsc.org/images/entities/char_2009.gif) K ratio resulted in the removal of more N (samples DSM4T-2). For activation at 600 and 700 °C, samples DSM4600-2 and DSM4700-2 are micro- and super-microporous and dominated by 1.2 nm pores and some small mesopores. For activation at 800 °C (DSM4800-2 and DSU4800-2), the PSD is comparable to DSM4800-1 and DSU4800-1, with mesopores centred at 2.7 nm. It appears that when higher amounts of melamine are used, KOH serves as the limiting agent and as a result significant N content was retained in the carbons, which limited the overall porosity.
K ratio resulted in the removal of more N (samples DSM4T-2). For activation at 600 and 700 °C, samples DSM4600-2 and DSM4700-2 are micro- and super-microporous and dominated by 1.2 nm pores and some small mesopores. For activation at 800 °C (DSM4800-2 and DSU4800-2), the PSD is comparable to DSM4800-1 and DSU4800-1, with mesopores centred at 2.7 nm. It appears that when higher amounts of melamine are used, KOH serves as the limiting agent and as a result significant N content was retained in the carbons, which limited the overall porosity.
| Sample | Yield [wt%] | C [%] | H [%] | N [%] | O [%] | (O/C)a | (N/C)a |
|---|---|---|---|---|---|---|---|
| a Atomic ratio | |||||||
| Raw DS | — | 49.4 | 6.0 | 1.1 | 43.5 | 0.660 | 0.019 |
| ACDS | 50 | 76.7 | 3.8 | 2.0 | 17.5 | 0.171 | 0.022 |
| DSM-2 | — | 43.7 | 4.2 | 47.5 | 4.6 | 0.079 | 0.932 |
| DSU-2 | — | 38.2 | 5.8 | 33.6 | 22.4 | 0.440 | 0.754 |
| DSM2600-2 | 33 | 67.7 | 1.5 | 18.0 | 12.8 | 0.142 | 0.228 |
| DSM2700-2 | 28 | 72.5 | 0.9 | 14.9 | 11.7 | 0.121 | 0.176 |
| DSM2800-2 | 23 | 77.3 | 0.7 | 10.1 | 11.9 | 0.115 | 0.112 |
| DSM4600-2 | 25 | 74.7 | 1.3 | 7.4 | 16.6 | 0.167 | 0.085 |
| DSM4700-2 | 18 | 76.0 | 0.6 | 7.0 | 16.4 | 0.162 | 0.079 |
| DSM4800-2 | 10 | 89.6 | 0.2 | 1.2 | 9.2 | 0.077 | 0.012 |
| DSU4800-2 | 9 | 90.5 | 0.0 | 0.5 | 8.9 | 0.074 | 0.005 |
The level of porosity in the carbons can be interpreted as follows: according to eqn (1), K2CO3 interacts with N–C on the surface of the ACDS carbon to form N adducts (KOCN) at ca. 600 °C along with generating some porosity from N, and C etching. Sevilla et al.63 found that the intermediate KOCN is a reactive form, and upon further heating, the KOCN works as an oxidising agent and can create significant porosity, as per eqn (2). Thus, the enhancement observed in the mesopore region takes place at 700 °C, which is the temperature at which the decomposition of K2CO3 with N–C occurs. This is accompanied by a decrease in yield from 40% at 600 °C (sample DSM2600-1) to 31% at 700 °C (sample DSM2700-1), and a reduction in N content (Table 1). Further increase in activation temperature from 700 to 800 °C largely enhances the proportion of pores of size ∼3 nm, accompanied by a drop in the carbon yield to 16% for DSM4800-1. As more N atoms are involved in the reaction and removed by the etching reaction with K2CO3, larger pores are generated alongside a small proportion of micropores. However, when the N content is very high and a low amount of KOH is used (DSM2T-2 carbons), the limited amount of K2CO3 generated works as a limiting factor, resulting in excess N content remaining in the resulting carbons. Altogether, in this way, the melamine acts as both an N-dopant and a structure-directing agent (porogen) by extending the size distribution of the pores into the mesopore region.
The textural properties of the N-doped activated carbons in Table 3 show that the surface area and pore volume range from moderate to ultra-high depending on the amount of N-dopant added to the activation mix and the severity of activation. For samples prepared at a melamine/ACDS ratio of 1, the surface area ranges from 1029 m2 g−1 for DSM2600-1 to 2536 m2 g−1 for DSM2800-1, and from 2226 m2 g−1 for DSM4600-1 to 3360 m2 g−1 for DSM4800-1, while the equivalent sample prepared in the presence of urea (DSU4800-1) has the highest surface area of 3646 m2 g−1. A similar pattern is observed for the pore volume, which varies from 0.43 to 1.18 cm3 g−1 for DSM2T-1 samples, 1.06 to 1.84 cm3 g−1 for DSM4T-1 samples, and reaches 2.05 cm3 g−1 for DSU4800-1. When the amount of melamine was increased, the surface area and pore volume decreased under any given activation conditions. Thus DSM2T-2 carbons have surface areas ranging from 340 m2 g−1 for DSM2600-2 to 1161 m2 g−1 for DSM2800-2 and pore volume of 0.15 cm3 g−1 and 0.56 cm3 g−1, respectively. Carbons prepared with a high amount of both melamine and KOH (DSM4T-2 carbons) had higher surface area and pore volume of 1322 m2 g−1 and 0.59 cm3 g−1 respectively, for DSM4600-2, which increased to 3138 m2 g−1 and 1.75 cm3 g−1 for DSM4800-2. Sample DSU4800-2 has the highest surface area (3270 m2 g−1) and pore volume (1.79 cm3 g−1) in this group of samples. In general, the samples prepared in the presence of urea (DSU4800-y) have higher surface area than their counterparts (DSM4800-y) prepared with melamine. This is because melamine has a bulk N content of ∼67 wt% compared to 46 wt% for urea, meaning a higher N/K ratio for the former. It is noteworthy that the retained N content follows the trend DSM4800-2 > DSU4800-2 > DSM4800-1 > DSU4800-1, which is consistent with their surface area of 3138, 3270, 3360 and 3646 m2 g−1. Thus DSU4800-1 has the lowest N/K ratio among all samples in this study and has the highest surface area and pore volume, which may be attributed to an ideal N/K ratio where significant amounts of N are consumed during the activation. Interestingly, the significant increase in the surface area from modest to ultra-high is consistent with the decreasing N content (N/C) in the samples, which, as described above, means more N was involved in the creation of the greater surface area and porosity.64,65
| Sample | Surface area (m2 g−1) | Pore volume (cm3 g−1) | Surface area densityc (m2 cm−3) | Packing densityd (g cm−3) | Volumetric surface areae (m2 cm−3) | ||
|---|---|---|---|---|---|---|---|
| Total | Micro.a![[thin space (1/6-em)]](https://www.rsc.org/images/entities/char_2009.gif) (%) (%) |
Total | Micro.b![[thin space (1/6-em)]](https://www.rsc.org/images/entities/char_2009.gif) (%) (%) |
||||
| a The values in parentheses are the proportion of micropore surface area. b The values in parentheses are the proportion of micropore volume. c Surface area density (SAD) defined as the ratio of surface area to pore volume. d To determine the packing density, a known quantity of carbon was compressed in a 1.3 cm die at 370 MPa for 10 minutes. e Multiplying the surface area by the packing density yields the volumetric surface area. | |||||||
| DSM2600-1 | 1029 | 891 (87) | 0.43 | 0.35 (82) | 2393 | 0.89 | 916 |
| DSM2700-1 | 1859 | 1441 (78) | 0.82 | 0.58 (71) | 2267 | 0.74 | 1376 |
| DSM2800-1 | 2536 | 1513 (60) | 1.18 | 0.60 (57) | 2149 | 0.65 | 1648 |
| DSM4600-1 | 2226 | 1690 (76) | 1.06 | 0.67 (63) | 2100 | 0.68 | 1514 |
| DSM4700-1 | 2672 | 1712 (64) | 1.28 | 0.68 (53) | 2088 | 0.59 | 1577 |
| DSM4800-1 | 3360 | 510 (15) | 1.84 | 0.15 (8) | 1826 | 0.45 | 1512 |
| DSU4800-1 | 3646 | 578 (16) | 2.05 | 0.19 (9) | 1779 | 0.41 | 1495 |
| DSM2600-2 | 340 | 295 (87) | 0.15 | 0.12 (80) | 2267 | — | — |
| DSM2700-2 | 635 | 484 (76) | 0.30 | 0.20 (67) | 2117 | — | — |
| DSM2800-2 | 1161 | 756 (65) | 0.56 | 0.32 (57) | 2073 | — | — |
| DSM4600-2 | 1322 | 1113 (84) | 0.59 | 0.44 (75) | 2241 | — | — |
| DSM4700-2 | 1989 | 1383 (70) | 0.93 | 0.57 (61) | 2139 | — | — |
| DSM4800-2 | 3138 | 400 (13) | 1.75 | 0.14 (8) | 1793 | 0.43 | 1349 |
| DSU4800-2 | 3270 | 366 (11) | 1.79 | 0.11 (6) | 1827 | 0.41 | 1341 |
The surface area density (SAD) of the carbons, defined as the ratio of surface area to pore volume, is shown in Table 3. The SAD shows a clear correlation with the nature of porosity, and decreases at higher levels of mesoporosity. For melamine/ACDS ratio of 1, the SAD ranges between 2393 and 2149 m2 cm−3 for DSM2T-1 carbons, and between 2100 m2 cm−3 and 1826 m2 cm−3 for DSM4T-1 carbons. For melamine/ACDS ratio of 2, the SAD ranges from 2267 to 2073 m2 cm−3 for DSM2T-2 carbons and 2241 to 1793 m2 cm−3 for DSM4T-2 samples. Sample DSU4800-1, which has the highest surface area, had the lowest surface area density of 1779 m2 cm−3 due to a high level of mesoporosity.
3.4 Gas uptake
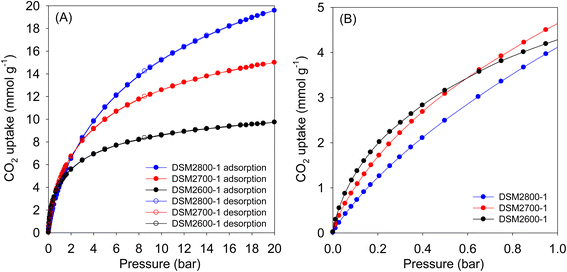 | ||
| Fig. 5 CO2 uptake at 25 °C of N-doped activated carbons prepared at melamine/ACDS ratio of 1 and KOH/ACDS ratio of 2 in the pressure range of (A) 0–20 bar, and (B) 0–1 bar. | ||
| Sample | CO2 uptake (mmol g−1) | ||
|---|---|---|---|
| 0.15 bar | 1 bar | 20 bar | |
| DSM2600-1 | 1.7 | 4.3 | 9.8 |
| DSM2700-1 | 1.4 | 4.6 | 15.0 |
| DSM2800-1 | 1.0 | 4.1 | 19.6 |
| DSM4600-1 | 1.1 | 4.1 | 17.9 |
| DSM4700-1 | 0.9 | 4.0 | 21.3 |
| DSM4800-1 | 0.6 | 3.2 | 24.9 |
| DSU4800-1 | 0.6 | 3.2 | 24.7 |
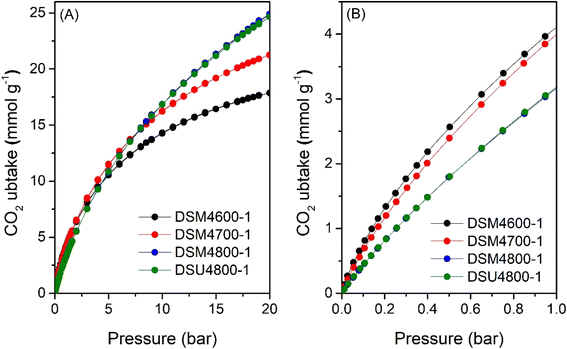 | ||
| Fig. 6 CO2 uptake at 25 °C of N-doped activated carbons prepared at melamine or urea/ACDS ratio of 1 and KOH/ACDS ratio of 4 in the pressure range of (A) 0–20 bar, and (B) 0–1 bar. | ||
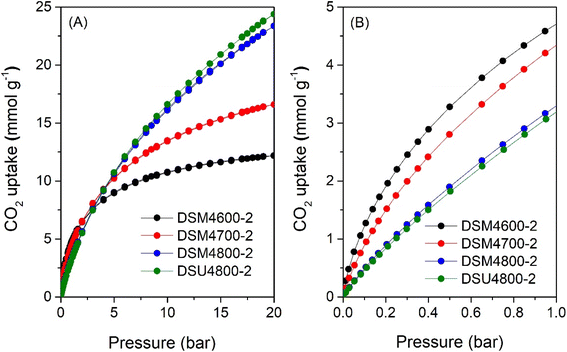
The CO2 uptake isotherms of DSMxT-2 carbons and DSU4800-2 are shown in Fig. 7, 8, and Table 5 summarises the CO2 storage capacity at various pressures. As shown in Fig. 7A, the isotherms are fully reversible, which is consistent with physisorption of CO2 on the carbons. This also rules out any possible trend towards stronger adsorption of CO2 due to the N-doping. At 1 bar, the uptake is 2.5 and 3.4 mmol g−1 for DSM2600-2 and DSM2800-2, respectively. Carbons derived under harsher activation conditions (DSM4T-2) show uptake of ∼3.2 mmol g−1 for DSM4800-2 and DSU4800-2, which rises to 4.7 and 4.3 mmol g−1 for samples obtained at lower activation temperatures of 600 °C and 700 °C, respectively. All the samples approach saturation at 20 bar (Fig. 7A and 8A) with the exception of DSM4800-2 and DSU4800-2. The low uptake for some samples at 20 bar is attributed to the use of high amounts of melamine, which generated lowly porous but highly microporous and N-rich carbons.65 On the other hand, the CO2 uptake at very low pressure of 0.15 bar (Fig. 7B and 8B) is attractive and in a narrow range between 1.2 and 1.3 mmol g−1 for DSM2T-2 carbons. It is interesting to note that the uptake for samples prepared at KOH/ACDS ratio of 2 was similar regardless of activation temperature and N content. The CO2 uptake for samples activated at a KOH/ACDS ratio of 4 is more varied; 1.6 mmol g−1 for DSM4600-2 and 1.2 mmol g−1 for DSM4700-2, and decreases to 0.7 mmol g−1 for DSM4800-2 and DSU4800-2. The lowering in the uptake for DSM4800-2 and DSU4800-2 is expected due to their wider pores. Notably, DSM4600-2 had the highest CO2 uptake at 0.15 and 1 bar of 1.6 and 4.7 mmol g−1, respectively. This uptake is amongst the highest ever reported for N-doped carbon materials, which show great promise as post-combustion CO2 storage materials (ESI Table S1†).28,66–83
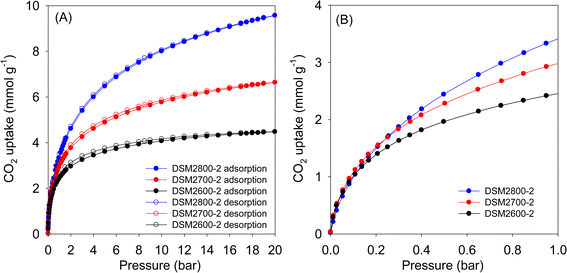 | ||
| Fig. 7 CO2 uptake at 25 °C of N-doped activated carbons prepared at melamine/ACDS ratio of 2 and KOH/ACDS ratio of 2 in the pressure range of (A) 0–20 bar, and (B) 0–1 bar. | ||
| Sample | CO2 uptake (mmol g−1) | ||
|---|---|---|---|
| 0.15 bar | 1 bar | 20 bar | |
| DSM2600-2 | 1.2 | 2.5 | 4.5 |
| DSM2700-2 | 1.3 | 3.0 | 6.6 |
| DSM2800-2 | 1.3 | 3.4 | 9.6 |
| DSM4600-2 | 1.6 | 4.7 | 12.2 |
| DSM4700-2 | 1.2 | 4.3 | 16.0 |
| DSM4800-2 | 0.7 | 3.3 | 23.4 |
| DSU4800-2 | 0.7 | 3.2 | 24.4 |
| θT = θExc + dCH4 × VT | (3) |
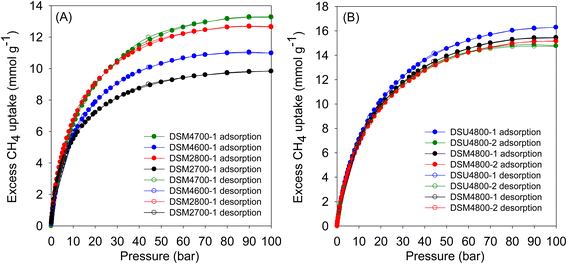
Fig. 9 shows the excess methane uptake isotherms at 25 °C for a selection of samples, and the storage capacity at 35, 65, and 100 bar is summarised in Table 6. Fig. 9A shows the methane uptake of representative DSMxT-1 carbons that have sufficiently high surface area to be of interest as methane stores. These samples have high methane storage capacity, with greater storage for samples that have higher surface area in the order DSM2700-1 < DSM4600-1 < DSM2800-1 < DSM4700-1. Thus, the excess uptake at 35 bar is in the range of 8.5–10.9 mmol g−1, which increased to 9.5–12.4 and 9.8–12.7 mmol g−1 at 65 and 100 bar, respectively. On the other hand, the excess methane uptake of samples obtained under more severe activation conditions (DSM4800-1, DSM4800-2, DSU4800-1 and DSU4800-2), show higher methane uptake (Fig. 9B and Table 6). The methane storage capacity of these carbons is in very narrow ranges; 12.2 and 13.0 mmol g−1 at 35 bar, 14.5 to 15.5 mmol g−1 at 65 bar, and 14.8 to 16.3 mmol g−1 at 100 bar. The excess methane uptake of 13.0 mmol g−1 at 25 °C and 35 bar for DSU4800-1 is among the highest ever reported for any porous materials (ESI Table S2†).7–12,15,36–38,84–87 At 100 bar, the highest excess methane uptake is for samples with the highest surface area (DSU4800-1 and DSM4800-1) at 16.3 and 15.5 mmol g−1, respectively. It may, therefore, be inferred that samples prepared with a low N/K ratio store more methane than those prepared at higher ratio. This is an indication that the strategy of adding N-containing additives, as dopants and structure-directing agents, to the ACDS precursor enhances the methane storage capacity, especially when compared to the uptake of carbons prepared from ACDS carbon only.38
| Sample | Excess gravimetric methane uptake (mmol g−1) or (g g−1)a | ||
|---|---|---|---|
| 35 bar | 65 bar | 100 bar | |
| a The values in parentheses are the excess gravimetric methane uptake (g g−1). | |||
| DSM2700-1 | 8.5 (0.14) | 9.5 (0.15) | 9.8 (0.16) |
| DSM2800-1 | 10.9 (0.17) | 12.4 (0.20) | 12.7 (0.21) |
| DSM4600-1 | 9.5 (0.15) | 10.8 (0.17) | 11.0 (0.18) |
| DSM4700-1 | 11.1 (0.18) | 12.8 (0.21) | 13.3 (0.22) |
| DSM4800-1 | 12.5 (0.20) | 14.8 (0.24) | 15.5 (0.25) |
| DSM4800-2 | 12.2 (0.19) | 14.5 (0.23) | 15.2 (0.24) |
| DSU4800-1 | 13.0 (0.21) | 15.5 (0.25) | 16.3 (0.26) |
| DSU4800-2 | 12.4 (0.20) | 14.5 (0.23) | 14.8 (0.24) |
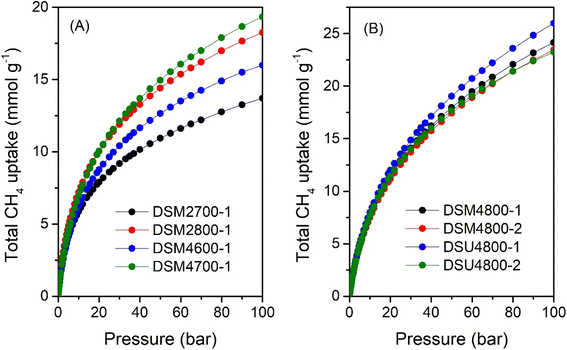
Fig. 10 shows the total gravimetric methane uptake isotherms of samples DSM2700-1, DSM2800-1, DSM4600-1, DSM4700-1, DSM4800-1, and DSM4800-2, as well as those of DSU4800-1 and DSU4800-2. Table 7 provides a summary of the total gravimetric methane uptake at 35, 65, and 100 bar. The total methane storage for carbons produced under milder conditions is 9.7, 12.6, 11.1 and 13.0 mmol g−1 (at 35 bar), 11.9, 15.8, 13.9 and 16.6 mmol g−1 (at 65 bar), and 13.7, 18.3, 16.0 and 19.4 mmol g−1 (at 100 bar), respectively, for DSM2700-1, DSM2800-1, DSM4600-1 and DSM4700-1. At 35 bar, the total methane uptake is 15.3 and 14.8 mmol g−1 for DSM4800-1 and DSM4800-2, respectively, while for DSU4800-1 and DSU4800-2, the total uptake is 16.1 and 15.1 mmol g−1, respectively. At 65 bar, the total methane uptake rises to 20.2 and 19.6 mmol g−1 for DSM4800-1 and DSM4800-2, respectively, and increases further to 24.2 and 23.5 mmol g−1 at 100 bar. While the total uptake is 21.5 and 19.7 mmol g−1 at 65 bar, and 26.0 and 23.4 mmol g−1 at 100 bar for DSU4800-1 and DSU4800-2, respectively. It is noteworthy that at 100 bar, the uptake of some carbons (i.e., 0.39 and 0.38 g g−1 for DSM4800-1 and DSM4800-2, and 0.42 and 0.37 g g−1 for DSU4800-1 and DSU4800-2, respectively) is close to the DOE target of 0.5 g g−1. The N-doping process, therefore, generates carbons with attractive gravimetric methane uptake that either matches or exceeds those previously reported to date for carbon or MOF materials (ESI Table S2†).7–14,37,38,84,87–92 Furthermore, the gravimetric uptake of all the present carbons is higher than that of carbons prepared from ACDS only.38
| Sample | Total gravimetric methane uptake (mmol g−1) or (g g−1)a | ||
|---|---|---|---|
| 35 bar | 65 bar | 100 bar | |
| a The values in parentheses are the total gravimetric methane uptake donated as (g g−1). | |||
| DSM2700-1 | 9.7 (0.16) | 11.9 (0.19) | 13.7 (0.22) |
| DSM2800-1 | 12.6 (0.20) | 15.8 (0.25) | 18.3 (0.29) |
| DSM4600-1 | 11.1 (0.18) | 13.9 (0.22) | 16.0 (0.26) |
| DSM4700-1 | 13.0 (0.21) | 16.6 (0.27) | 19.4 (0.31) |
| DSM4800-1 | 15.3 (0.25) | 20.2 (0.32) | 24.2 (0.39) |
| DSM4800-2 | 14.8 (0.24) | 19.6 (0.31) | 23.5 (0.38) |
| DSU4800-1 | 16.1 (0.26) | 21.5 (0.35) | 26.0 (0.42) |
| DSU4800-2 | 15.1 (0.24) | 19.7 (0.32) | 23.4 (0.37) |
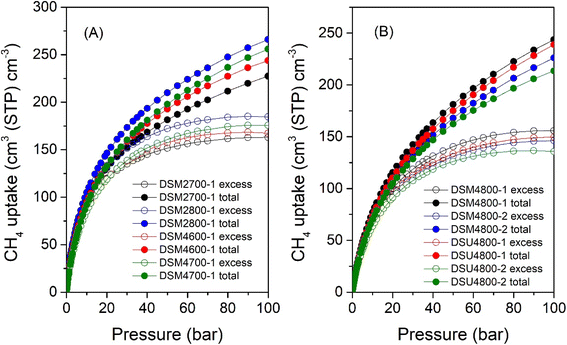
The volumetric uptake (i.e., cm3 (STP) cm−3), which is the amount of methane that can be held by an adsorbent per unit of tank volume, is an important parameter for methane storage performance from a practical perspective. The volumetric uptake is determined by the packing density of the adsorbent and the gravimetric uptake. If an adsorbent has a higher packing density, it could potentially allow more of it to be filled in a given tank, which in turn increases the volumetric capacity. The United States Department of Energy (U.S. DOE) has established a target for volumetric methane uptake at 25 °C and moderate pressure (i.e., 35–100 bar) of 263 cm3 (STP) cm−3. The total volumetric methane uptake isotherms are shown in Fig. 11, and Table 8 provides a summary of storage capacity at 35, 65 and 100 bar. The volumetric uptake isotherms do not show any saturation at 100 bar, which suggests that the carbons could store greater amounts of methane above 100 bar. This contrasts with most benchmark MOFs that reach saturation at pressures of ca. 80 bar.14,93 For carbons obtained at milder activation conditions (DSM2700-1, DSM2800-1, DSM4600-1 and DSM4700-1), at 35 bar, the total volumetric methane uptake (cm3 (STP) cm−3) varies from 161 to 184, while it is between 154 and 138 for those obtained under harsher conditions (DSM4800-y and DSU4800-y). The highest volumetric methane uptake capacity at 35 bar, observed for DSM2800-1 at 184 cm3 (STP) cm−3, is amongst the best reported for porous materials.8,16,37,94,95 At 65 bar, the uptake is between 198 and 230 cm3 (STP) cm−3 for DSM2700-1, DSM2800-1, DSM4600-1 and DSM4700-1, and in the range of 181 to 203 cm3 (STP) cm−3 for DSM4800-y and DSU4800-y. At 100 bar, DSM2700-1, DSM2800-1, DSM4600-1, and DSM4700-1 carbons have total methane uptake of 227, 266, 244, and 256 cm3 (STP) cm−3, respectively, and DSM4800-1, DSM4800-2, and DSU4800-1 and DSU4800-2 have total methane uptake of 244, 226, 239, and 214 cm3 (STP) cm−3. The best volumetric uptake at 100 bar is for sample DSM2800-1 at 266 cm3 (STP) cm−3, which meets the DOE target and outperforms or is comparable to the best activated carbons or MOFs (ESI Table S2†).8,12,37,84 On the other hand, it is interesting to note that, at 25 °C and 100 bar, the uptake of DSU4800-1 is only ∼9% lower than the DOE target values (0.5 g g−1 and 263 cm3 (STP) cm−3) for gravimetric and volumetric uptake, i.e., 0.42 g g−1 and 239 cm3 (STP) cm−3, respectively. The attractive performance of the DSU4800-1 samples can be attributed to a well-balanced combination of porosity and packing density as a result of an optimal N![[thin space (1/6-em)]](https://www.rsc.org/images/entities/char_2009.gif) :
:![[thin space (1/6-em)]](https://www.rsc.org/images/entities/char_2009.gif) K ratio during synthesis. Overall, the volumetric uptake obtained by the activated carbons in this study is attractive in the context of previous reports on carbons or MOFs (ESI Table S2†).7–11,15,16,37,38,85–87,94–100
K ratio during synthesis. Overall, the volumetric uptake obtained by the activated carbons in this study is attractive in the context of previous reports on carbons or MOFs (ESI Table S2†).7–11,15,16,37,38,85–87,94–100
| Sample | Total volumetric methane uptake (cm3 (STP) cm−1) | ||
|---|---|---|---|
| 35 bar | 65 bar | 100 bar | |
| a The values in parentheses are volumetric working capacity (i.e., deliverable methane), which is calculated by subtracting the storage pressure at 5 bar. | |||
| DSM2700-1 | 161 (92) | 198 (129) | 227 (158) |
| DSM2800-1 | 184 (113) | 230 (159) | 266 (195) |
| DSM4600-1 | 169 (105) | 212 (148) | 244 (180) |
| DSM4700-1 | 171 (111) | 219 (159) | 256 (196) |
| DSM4800-1 | 154 (105) | 203 (154) | 244 (195) |
| DSM4800-2 | 143 (97) | 189 (143) | 226 (180) |
| DSU4800-1 | 148 (102) | 197 (151) | 239 (193) |
| DSU4800-2 | 138 (93) | 181 (136) | 214 (169) |
The working capacity, i.e., the efficacy of materials to deliver the stored gas between two finite pressures, is more important than the total storage capacity. The efficiency of this process is largely dependent on the type of porosity. Highly microporous materials absorb a large amount of methane at lower pressures (e.g., 5 bar), thereby reducing their working capacity. Thus, to achieve high working capacity, the mix of microporosity and mesoporosity is important; the former is critical for high packing density, while the latter plays an important role in minimising the uptake at lower pressure, leading to an increase in the working capacity of the materials. Deliverable methane, or volumetric working capacity, calculated by subtracting the storage at release pressure of 5 bar from the uptake at 35, 65 or 100 bar, is given in Table 8. The volumetric working capacity, for a 100 to 5 bar pressure swing, reaches 196, 195, 195, and 193 cm3 (STP) cm−3 for samples DSM4700-1, DSM2800-1, DSM4800-1 and DSU4800-1, respectively. It's interesting that the volumetric capacities of DSM4800-1 and DSU4800-1 are almost the same as for DSM2800-1, even though the later has the highest total volumetric uptake of 266 cm3 (STP) cm−3. This is ascribed to the presence of greater mesoporosity in DSM4800-1 and DSU4800-1, which lowers the uptake at 5 bar.93 It is noteworthy that the present carbons have volumetric working capacities approaching the values of the best MOFs (i.e., monolithic monoHKUST1 and monoUiO-66_D), which are considered to be 50% better than any powder MOF (ESI Table S3†).12,98
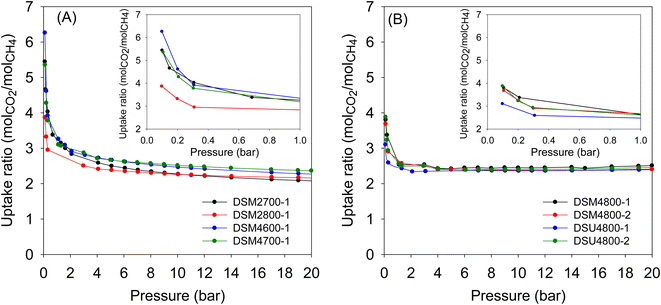
Although the main focus of this work was the storage of CO2 and methane, we also explored the performance in the N-doped activated carbons in the separation of CO2/CH4 mixtures. Such separation is important especially for the purification of natural gas or biomethane, where CO2 and other impurities are removed, prior to use as a fuel. The porosity of the present carbons means that they adsorb more CO2 compared to methane (ESI Fig. S9†). The relative uptake of CO2 and methane depends on the porosity of the carbons. By assuming a 50/50 mix of CO2 and methane, we are able to estimate the CO2/CH4 selectivity based on the uptake ratio. Fig. 12 shows the CO2/CH4 uptake ratio as a function of pressure in the range 0–20 bar. As expected, the CO2/CH4 uptake ratio is highest at pressures close to zero and then reduces at higher pressure. The more microporous carbons (Table 3) generally achieve higher CO2/CH4 uptake ratio. These carbons can therefore be effective for the enrichment of methane from CO2/CH4 gas streams.
4. Conclusions
N-doped carbons with well controlled porosity were prepared via the addition of N-containing additives (melamine or urea) to an activation mixture containing KOH as an activating agent and carbonaceous matter derived from biomass, i.e., air-carbonised date seed, Phoenix dactylifera, ACDS. Depending on the preparation conditions, and by varying the amount of melamine or urea, the amount of KOH, and the activation temperature, carbons with a wide range of porosity were generated. The activated carbons feature a large N content, which can reach up to 18 wt%, with surface area of between 340 to 3646 m2 g−1 and pore volume in the range of 0.15 to 2.1 cm3 g−1. It was observed that the N added to the activation mix serves as both an N-dopant and a structure-directing agent (porogen) by extending the size of pores generated into the mesopore region. This study provides evidence that N-containing additives can play a key role determining the structural properties of the activated carbons, and their use in this study acted to increase the susceptibility of the biomass-derived ACDS carbon to activation. It appears that K+ from the KOH reacts with surface N species readily, leading to a significant increase in the surface area, which is accompanied with a lowering of the N content of the carbons. Furthermore, the presence of N provides activation pathways to carbons with a unique combination of textural properties (i.e., surface area, mix of microporosity and mesoporosity and packing density) that can be tuned towards suitability for enhanced uptake of CO2 and/or methane. Depending on the preparation conditions and resulting mix of micro/mesoporosity, the carbons show excellent low pressure CO2 capture at 25 °C of 1.7 mmol g−1 at 0.15 bar and 4.7 mmol g−1 at 1 bar. At 25 °C and 100 bar the methane uptake of the carbons reaches 0.42 g g−1 and 266 cm3 (STP) cm−3, respectively, and working capacity of 196 cm3 (STP) cm−3 for a 100 to 5 bar pressure swing. The impressive performance is attributed to the balanced combination of porosity and packing density as a result of an optimal N![[thin space (1/6-em)]](https://www.rsc.org/images/entities/char_2009.gif) :
:![[thin space (1/6-em)]](https://www.rsc.org/images/entities/char_2009.gif) K ratio during the activation process.
K ratio during the activation process.
Data availability
Data that support the findings of this study are available within the paper (and its ESI Files†) and from the corresponding author on reasonable request.Author contributions
N. A.: methodology, formal analysis, investigation, writing. R. M.: conceptualisation, writing – review & editing, supervision, funding acquisition, resources.Conflicts of interest
There are no conflicts to declare.Acknowledgements
We are grateful to the Nanoscale and Microscale Research Centre (nmRC) at the University of Nottingham for assistance with electron microscopy analysis. We thank Taibah University, Yanbu Al Bahr, 46423, Saudi Arabia, for funding a PhD studentship for NA. RM thanks the Royal Society for a Research Grant, and for a Royal Society Wolfson Research Merit Award.References
-
J. Rogelj, D. Shindell, K. Jiang, S. Fifita, P. Forster, V. Ginzburg, C. Handa, H. Kheshgi, S. Kobayashi and E. Kriegler, Global warming of 1.5 °C. An IPCC special report on the impacts of global warming of 1.5 °C above pre-industrial levels and related global greenhouse gas emission pathways, in The Context of Strengthening the Global Response to the Threat of Climate Change, Sustainable Development, and Efforts to Eradicate Poverty, 2018 Search PubMed
.
- International Energy Agency (IEA), Global CO2 Emissions Rebounded to their Highest Level in History in 2021, https://www.iea.org/news/global-co2-emissions-rebounded-to-their-highest-level-in-history-in-2021, accessed 8 March 2022 Search PubMed.
- C. F. Schleussner, J. Rogelj, M. Schaeffer, T. Lissner, R. Licker, E. M. Fischer, R. Knutti, A. Levermann, K. Frieler and W. Hare, Nat. Clim. Change, 2016, 6, 827–835 CrossRef
.
- L. Shi, K.-Y. Liao, Y.-H. Dong, Y.-A. Wang, Y. Zhou, X.-G. Yi, M.-S. Sun, W. Hui and D.-J. Tao, Sustainable Mater. Technol., 2024, 40, e00880 CrossRef CAS
.
- S. Choi, J. H. Drese and C. W. Jones, ChemSusChem, 2009, 2, 796–854 CrossRef CAS PubMed
.
- G. P. Peters, R. M. Andrew, J. G. Canadell, S. Fuss, R. B. Jackson, J. I. Korsbakken, C. Le Quere and N. Nakicenovic, Nat. Clim. Change, 2017, 7, 118–122 CrossRef
.
- T. A. Makal, J. R. Li, W. Lu and H. C. Zhou, Chem. Soc. Rev., 2012, 41, 7761–7779 RSC
.
- J. A. Mason, M. Veenstra and J. R. Long, Chem. Sci., 2014, 5, 32–51 RSC
.
- K. V. Kumar, K. Preuss, M. M. Titirici and F. Rodriguez-Reinoso, Chem. Rev., 2017, 117, 1796–1825 CrossRef CAS PubMed
.
- B. Li, H. M. Wen, W. Zhou, J. Q. Xu and B. L. Chen, Chem, 2016, 1, 557–580 CAS
.
- Y. He, W. Zhou, G. Qian and B. Chen, Chem. Soc. Rev., 2014, 43, 5657–5678 RSC
.
- T. Tian, Z. Zeng, D. Vulpe, M. E. Casco, G. Divitini, P. A. Midgley, J. Silvestre-Albero, J. C. Tan, P. Z. Moghadam and D. Fairen-Jimenez, Nat. Mater., 2018, 17, 174–179 CrossRef CAS PubMed
.
- Y. C. Lin, C. L. Kong, Q. J. Zhang and L. Chen, Adv. Energy Mater., 2017, 7, 1601296 CrossRef
.
- Y. Peng, V. Krungleviciute, I. Eryazici, J. T. Hupp, O. K. Farha and T. Yildirim, J. Am. Chem. Soc., 2013, 135, 11887–11894 CrossRef CAS PubMed
.
- S. Dutta, A. Bhaumik and K. C. W. Wu, Energy Environ. Sci., 2014, 7, 3574–3592 RSC
.
- M. E. Casco, M. Martínez-Escandell, E. Gadea-Ramos, K. Kaneko, J. Silvestre-Albero and F. Rodríguez-Reinoso, Chem. Mater., 2015, 27, 959–964 CrossRef CAS
.
- M. Namvar-Asl, M. Soltanieh and A. Rashidi, Energy Convers. Manage., 2008, 49, 2478–2482 CrossRef CAS
.
- M. Feroldi, A. C. Neves, C. E. Borba and H. J. Alves, J. Clean Prod., 2018, 172, 921–926 CrossRef CAS
.
- M. Sevilla and R. Mokaya, Energy Environ. Sci., 2014, 7, 1250–1280 RSC
.
- J. C. Wang and S. Kaskel, J. Mater. Chem., 2012, 22, 23710–23725 RSC
.
- L. Wei and G. Yushin, Nano Energy, 2012, 1, 552–565 CrossRef CAS
.
- M. M. Titirici, R. J. White, C. Falco and M. Sevilla, Energy Environ. Sci., 2012, 5, 6796–6822 RSC
.
- Y. D. Xia, Z. X. Yang and Y. Q. Zhu, J. Mater. Chem. A, 2013, 1, 9365–9381 RSC
.
- L. S. Blankenship, N. Balahmar and R. Mokaya, Nat. Commun., 2017, 8, 1545 CrossRef PubMed
.
- L. S. Blankenship and R. Mokaya, Mater. Adv., 2022, 3, 1905–1930 RSC
.
- M. Sevilla, A. B. Fuertes and R. Mokaya, Int. J. Hydrogen Energy, 2011, 36, 15658–15663 CrossRef CAS
.
- E. S. Hanley, J. P. Deane and B. P. O. Gallachoir, Renew. Sustainable Energy Rev., 2018, 82, 3027–3045 CrossRef
.
- N. P. Wickramaratne and M. Jaroniec, J. Mater. Chem. A, 2013, 1, 112–116 RSC
.
- B. Adeniran, E. Masika and R. Mokaya, J. Mater. Chem. A, 2014, 2, 14696–14710 RSC
.
- N. Balahmar, A. C. Mitchell and R. Mokaya, Adv. Energy Mater., 2015, 5, 1500867 CrossRef
.
- B. Adeniran and R. Mokaya, J. Mater. Chem. A, 2015, 3, 5148–5161 RSC
.
- G. Singh, K. S. Lakhi, S. Sil, S. V. Bhosale, I. Kim, K. Albahily and A. Vinu, Carbon, 2019, 148, 164–186 CrossRef CAS
.
- B. Adeniran and R. Mokaya, Nano Energy, 2015, 16, 173–185 CrossRef CAS
.
- W. Sangchoom, D. A. Walsh and R. Mokaya, J. Mater. Chem. A, 2018, 6, 18701–18711 RSC
.
- E. Haffner-Staton, N. Balahmar and R. Mokaya, J. Mater. Chem. A, 2016, 4, 13324–13335 RSC
.
- I. Alali and R. Mokaya, Energy Environ. Sci., 2022, 15, 4710–4724 RSC
.
- A. Altwala and R. Mokaya, J. Mater. Chem. A, 2022, 10, 13744–13757 RSC
.
- A. Altwala and R. Mokaya, Energy Environ. Sci., 2020, 13, 2967–2978 RSC
.
- O. F. Cruz Jr, J. Silvestre-Albero, M. E. Casco, D. Hotza and C. R. Rambo, Mater. Chem. Phys., 2018, 216, 42–46 CrossRef
.
- G. K. Parshetti, S. Chowdhury and R. Balasubramanian, Fuel, 2015, 148, 246–254 CrossRef CAS
.
- J. Saleem, U. Bin Shahid, M. Hijab, H. Mackey and G. McKay, Biomass Convers. Biorefin., 2019, 9, 775–802 CrossRef CAS
.
- H. M. Wei, J. Chen, N. Fu, H. J. Chen, H. L. Lin and S. Han, Electrochim. Acta, 2018, 266, 161–169 CrossRef CAS
.
- E. A. Hirst, A. Taylor and R. Mokaya, J. Mater. Chem. A, 2018, 6, 12393–12403 RSC
.
- L. Shao, Y. Sang, N. Liu, J. Liu, P. Zhan, J. Huang and J. Chen, ACS Omega, 2020, 5, 17450–17462 CrossRef CAS PubMed
.
- N. Balahmar, A. S. Al-Jumialy and R. Mokaya, J. Mater. Chem. A, 2017, 5, 12330–12339 RSC
.
- N. Balahmar and R. Mokaya, J. Mater. Chem. A, 2019, 7, 17466–17479 RSC
.
- E. Masika and R. Mokaya, Energy Environ. Sci., 2014, 7, 427–434 RSC
.
- M. Sevilla, W. Sangchoom, N. Balahmar, A. B. Fuertes and R. Mokaya, ACS Sustainable Chem. Eng., 2016, 4, 4710–4716 CrossRef CAS
.
- M. E. Casco, M. Martinez-Escandell, J. Silvestre-Albero and F. Rodriguez-Reinoso, Carbon, 2014, 67, 230–235 CrossRef CAS
.
- M. Sevilla, R. Mokaya and A. B. Fuertes, Energy Environ. Sci., 2011, 4, 2930–2936 RSC
.
- M. H. Kim, S. Yun, H. S. Park, J. T. Han, K. B. Kim and K. C. Roh, J. Mater. Chem. A, 2015, 3, 2564–2567 RSC
.
- M. Sevilla, N. Alam and R. Mokaya, J. Phys. Chem. C, 2010, 114, 11314–11319 CrossRef CAS
.
- Y. Zhu, S. Murali, M. D. Stoller, K. J. Ganesh, W. Cai, P. J. Ferreira, A. Pirkle, R. M. Wallace, K. A. Cychosz, M. Thommes, D. Su, E. A. Stach and R. S. Ruoff, Science, 2011, 332, 1537–1541 CrossRef CAS PubMed
.
- M. Sevilla, G. A. Ferrero, N. Diez and A. B. Fuertes, Carbon, 2018, 131, 193–200 CrossRef CAS
.
- M. Sevilla, A. S. M. Al-Jumialy, A. B. Fuertes and R. Mokaya, ACS Appl. Mater. Interfaces, 2018, 10, 1623–1633 CrossRef CAS PubMed
.
- A. B. Fuertes and M. Sevilla, Carbon, 2015, 94, 41–52 CrossRef CAS
.
- M. Cox and R. Mokaya, Sustainable Energy Fuels, 2017, 1, 1414–1424 RSC
.
- A. E. Ogungbenro, D. V. Quang, K. A. Al-Ali, L. F. Vega and M. R. M. Abu-Zahra, J. Environ. Chem. Eng., 2018, 6, 4245–4252 CrossRef CAS
.
- A. M. Aljumialy and R. Mokaya, Mater. Adv., 2020, 1, 3267–3280 RSC
.
- H. M. Coromina, D. A. Walsh and R. Mokaya, J. Mater. Chem. A, 2016, 4, 280–289 RSC
.
- X. D. Zhu, Y. C. Liu, F. Qian, C. Zhou, S. C. Zhang and J. M. Chen, ACS Sustainable Chem. Eng., 2015, 3, 833–840 CrossRef CAS
.
- T. S. Blankenship and R. Mokaya, Energy Environ. Sci., 2017, 10, 2552–2562 RSC
.
- A. B. Fuertes, G. A. Ferrero and M. Sevilla, J. Mater. Chem. A, 2014, 2, 14439–14448 RSC
.
- J. V. Guerrera, J. N. Burrow, J. E. Eichler, M. Z. Rahman, M. V. Namireddy, K. A. Friedman, S. S. Coffman, D. C. Calabro and C. B. Mullins, Energy Fuel, 2020, 34, 6101–6112 CrossRef CAS
.
- J. E. Eichler, J. N. Burrow, Y. Wang, D. C. Calabro and C. B. Mullins, Carbon, 2022, 186, 711–723 CrossRef CAS
.
- M. Sevilla and A. B. Fuertes, Energy Environ. Sci., 2011, 4, 1765–1771 RSC
.
- M. Sevilla and A. B. Fuertes, J. Colloid Interface Sci., 2012, 366, 147–154 CrossRef CAS PubMed
.
- G. Srinivas, V. Krungleviciute, Z.-X. Guo and T. Yildirim, Energy Environ.
Sci., 2014, 7, 335–342 RSC
.
- J. Silvestre-Albero, A. Wahby, A. Sepúlveda-Escribano, M. Martínez-Escandell, K. Kaneko and F. Rodríguez-Reinoso, Chem. Commun., 2011, 47, 6840–6842 RSC
.
- N. P. Wickramaratne and M. Jaroniec, ACS Appl. Mater. Interfaces, 2013, 5, 1849–1855 CrossRef CAS PubMed
.
- G. P. Hao, W. C. Li, D. Qian, G. H. Wang, W. P. Zhang, T. Zhang, A. Q. Wang, F. Schuth, H. J. Bongard and A. H. Lu, J. Am. Chem. Soc., 2011, 133, 11378–11388 CrossRef CAS PubMed
.
- J. Wang, A. Heerwig, M. R. Lohe, M. Oschatz, L. Borchardt and S. Kaskel, J. Mater. Chem., 2012, 22, 13911–13913 RSC
.
- X. Q. Fan, L. X. Zhang, G. B. Zhang, Z. Shu and J. L. Shi, Carbon, 2013, 61, 423–430 CrossRef CAS
.
- M. Sevilla, P. Valle-Vigon and A. B. Fuertes, Adv. Funct. Mater., 2011, 21, 2781–2787 CrossRef CAS
.
- W. Xing, C. Liu, Z. Zhou, L. Zhang, J. Zhou, S. Zhuo, Z. Yan, H. Gao, G. Wang and S. Z. Qiao, Energy Environ. Sci., 2012, 5, 7323–7327 RSC
.
- Y. D. Xia, R. Mokaya, G. S. Walker and Y. Q. Zhu, Adv. Energy Mater., 2011, 1, 678–683 CrossRef CAS
.
- Y. Zhao, L. Zhao, K. X. Yao, Y. Yang, Q. Zhang and Y. Han, J. Mater. Chem., 2012, 22, 19726–19731 RSC
.
- Z. Zhang, J. Zhou, W. Xing, Q. Xue, Z. Yan, S. Zhuo and S. Z. Qiao, Phys. Chem. Chem. Phys., 2013, 15, 2523–2529 RSC
.
- M. Nandi, K. Okada, A. Dutta, A. Bhaumik, J. Maruyama, D. Derks and H. Uyama, Chem. Commun., 2012, 48, 10283–10285 RSC
.
- M. Saleh, J. N. Tiwari, K. C. Kemp, M. Yousuf and K. S. Kim, Environ. Sci. Technol., 2013, 47, 5467–5473 CrossRef CAS PubMed
.
- I. Alali and R. Mokaya, J. Mater. Chem. A, 2023, 11, 6952–6965 RSC
.
- M. Sevilla, C. Falco, M.-M. Titirici and A. B. Fuertes, RSC Adv., 2012, 2, 12792–12797 RSC
.
- A. Altwala and R. Mokaya, Energy Adv., 2022, 1, 216–224 RSC
.
- Z. Chen, P. Li, R. Anderson, X. Wang, X. Zhang, L. Robison, L. R. Redfern, S. Moribe, T. Islamoglu, D. A. Gomez-Gualdron, T. Yildirim, J. F. Stoddart and O. K. Farha, Science, 2020, 368, 297–303 CrossRef CAS PubMed
.
- P. Pfeifer, L. Aston, M. Banks, S. Barker, J. Burress, S. Carter, J. Coleman, S. Crockett, C. Faulhaber, J. Flavin, M. Gordon, L. Hardcastle, Z. Kallenborn, M. Kemiki, C. Lapilli, J. Pobst, R. Schott, P. Shah, S. Spellerberg, G. Suppes, D. Taylor, A. Tekeei, C. Wexler, M. Wood, P. Buckley, T. Breier, J. Downing, S. Eastman, P. Freeze, S. Graham, S. Grinter, A. Howard, J. Martinez, D. Radke, T. Vassalli and J. Ilavsky, Chaos, 2007, 17, 041108 CrossRef CAS PubMed
.
- J. Romanos, S. Sweany, T. Rash, L. Firlej, B. Kuchta, J. C. Idrobo and P. Pfeifer, Adsorpt. Sci. Technol., 2014, 32, 681–691 CrossRef CAS
.
- D. A. Gómez-Gualdrón, C. E. Wilmer, O. K. Farha, J. T. Hupp and R. Q. Snurr, J. Phys. Chem. C, 2014, 118, 6941–6951 CrossRef
.
- H. Nishihara and T. Kyotani, Chem. Commun., 2018, 54, 5648–5673 RSC
.
- D. Lozano-Castello, D. Cazorla-Amoros and A. Linares-Solano, Energy Fuel, 2002, 16, 1321–1328 CrossRef CAS
.
- T. A. Rash, A. Gillespie, B. P. Holbrook, L. H. Hiltzik, J. Romanos, Y. C. Soo, S. Sweany and P. Pfeifer, Fuel, 2017, 200, 371–379 CrossRef CAS
.
- J. Jiang, H. Furukawa, Y. B. Zhang and O. M. Yaghi, J. Am. Chem. Soc., 2016, 138, 10244–10251 CrossRef CAS PubMed
.
- H. Wu, W. Zhou and T. Yildirim, J. Am. Chem. Soc., 2009, 131, 4995–5000 CrossRef CAS PubMed
.
- S. Bracco, D. Piga, I. Bassanetti, J. Perego, A. Comotti and P. Sozzani, J. Mater. Chem. A, 2017, 5, 10328–10337 RSC
.
- S. Choi, M. A. Alkhabbaz, Y. G. Wang, R. M. Othman and M. Choi, Carbon, 2019, 141, 143–153 CrossRef CAS
.
- M. E. Casco, M. Martinez-Escandell, K. Kaneko, J. Silvestre-Albero and F. Rodriguez-Reinoso, Carbon, 2015, 93, 11–21 CrossRef CAS
.
- B. M. Connolly, D. G. Madden, A. E. H. Wheatley and D. Fairen-Jimenez, J. Am. Chem. Soc., 2020, 142, 8541–8549 CrossRef CAS PubMed
.
- V. Rozyyev, D. Thirion, R. Ullah, J. Lee, M. Jung, H. Oh, M. Atilhan and C. T. Yavuz, Nat. Energy, 2019, 4, 604–611 CrossRef CAS
.
- B. M. Connolly, M. Aragones-Anglada, J. Gandara-Loe, N. A. Danaf, D. C. Lamb, J. P. Mehta, D. Vulpe, S. Wuttke, J. Silvestre-Albero, P. Z. Moghadam, A. E. H. Wheatley and D. Fairen-Jimenez, Nat. Commun., 2019, 10, 2345 CrossRef CAS PubMed
.
- N. Albeladi, L. Scott Blankenship and R. Mokaya, Energy Environ. Sci., 2024, 17, 3060–3076 RSC
.
- C. M. Simon, J. Kim, D. A. Gomez-Gualdron, J. S. Camp, Y. G. Chung, R. L. Martin, R. Mercado, M. W. Deem, D. Gunter, M. Haranczyk, D. S. Sholl, R. Q. Snurr and B. Smit, Energy Environ. Sci., 2015, 8, 1190–1199 RSC
.
Footnote |
| † Electronic supplementary information (ESI) available. See DOI: https://doi.org/10.1039/d4ta03273j |
| This journal is © The Royal Society of Chemistry 2024 |

