 Open Access Article
Creative Commons Attribution 3.0 Unported Licence
Mixed-phase titania foams via 3D-printing for pharmaceutical degradation†
Zachary
Warren
 ab,
Thais Tasso
Guaraldo
c,
Ivan
Barisic
b,
Garyfalia A.
Zoumpouli
 b,
Jannis
Wenk
 b and
Davide
Mattia
 *b
*b
aDepartment of Chemistry, University of Bath, BA27AY, UK
bDepartment of Chemical Engineering, University of Bath, BA27AY, UK. E-mail: d.mattia@bath.ac.uk
cCentre for Manufacturing and Materials, Coventry University, CV1 5FB, UK
First published on 3rd April 2024
Abstract
The continuing accumulation of organic micropollutants, particularly pharmaceuticals, in water is now considered an urgent threat to human health and the environment. Although the photocatalytic degradation of these compounds using slurries of photoactive nanoparticles has been proven to be highly effective at laboratory scale, this technology has not been implemented in industry due to cost and safety concerns. Here, 3D printed titania foams which are nanoparticle-free, mechanically robust and photoactive, are presented for the first time as a viable alternative to slurries for the photocatalytic degradation of pharmaceuticals. By optimizing the resin used to 3D print highly porous gyroid structures and the subsequent sintering conditions, it was possible to obtain a pure titania foam with a high anatase content, leading to the high photoactivity observed. Using carbamazepine, the pharmaceutical most found in waterways around the world, as a model pollutant, the 3D printed foams were tested in a recirculating flow reactor, with a quantum yield and electrical energy per order of 7.6 × 10⁻³ and 67.6 kW h m−3, respectively, outperforming literature results for titania nanoparticle slurries. These results, along with the reproducibility afforded by 3D printing methods, shows a clear pathway for photocatalysts to be implemented in practice, helping to solve an urgent health problem while addressing the risk of nanoparticulate release in the environment.
Introduction
There is growing evidence of the adverse effects on the health of ecosystems and humans by the continued release of, and exposure to pharmaceutical compounds.1–3 Many of these organic compounds are persistent and are often found at low concentrations of ng L−1 to μg L−1, leading to their passing through traditional wastewater treatment plants with little to no removal.4,5 Through the wastewater effluent, micropollutants are released into the wider aquatic environment where they can bioaccumulate and enter the human food chain.6 As a result, novel, energy efficient approaches are urgently required for their removal. Advanced oxidation processes (AOPs) consist of a range of processes that produce highly reactive hydroxyl radicals as the main oxidising species to facilitate the degradation of pollutants in water.7,8 UV/H2O2 systems, have seen use,9 however their efficiency is limited by the low molar absorption coefficient of H2O2.10,11 Ozonation systems are an alternative cost-effective and highly efficient method of pollutant removal due to direct oxidation of pollutants as well as reactions with water forming reactive hydroxyl radicals.12 However the formation of harmful bromate compounds in water supplies rich in bromides can limit its application.13 The photocatalytic degradation of organic pollutants addresses these issues,10,14,15 but still faces challenges to widescale implementation:16 Slurry systems use a suspension of photocatalyst nanoparticles within the reaction solution,17 providing high surface areas for pollutant adsorption and higher rates of degradation when compared with supported photocatalysts.18,19 The drawback of slurry systems is the need for downstream removal of the catalyst to ensure no leaching of nanoparticles.20 Similarly to micropollutants, nanoparticles can bioaccumulate and have been shown to have potentially synergistic interactions, amplifying their toxicity.21 Supported photocatalysts do not require downstream removal, but lower surface areas result in lower treatment efficiencies.22 In addition, there are issues of shadowing, where the non-transparent support material blocks irradiation of the photocatalyst.23Photocatalytic foams, are an emerging alternative to slurry and supported catalysts,22 integrating the benefits of both, while mitigating the drawbacks associated with each.24 Foams with hierarchical porosity (macro and micro) possess surface areas similar to slurries while the porosity, pore size and shape leads to tortuous flow of pollutants to the photocatalyst surface, thereby overcoming the diffusion limitations present in supported photocatalysts.25 Photocatalyst nanoparticles decorated onto a porous support have been shown to outperform an equivalent amount of unsupported catalyst,25 but the weak catalyst–support interaction can lead to leaching.22 Substrate-free foams, where photoactivity is intrinsic to the catalyst with no support present, remove this concern, but these foams are often synthesised via liquid templating,26 or via aeration of a sol–gel,27 limiting the ability to precisely control the microstructure of the foams.
3D printing of photocatalytic foams could offer such precise control, as it builds objects layer by layer from a digital design.28 Common 3D printing techniques currently available include fused deposition modelling, selective laser sintering, stereolithography apparatus and digital light processing (DLP).29 3D printing technologies have already been explored in water treatment, e.g. for the direct printing of structured membranes,30–32 or printing of porous substrates which act as support for photocatalytic nanoparticles to be grafted upon.33,34
There is no report, to the authors knowledge, of direct 3D printing of a photocatalytic foam, where the material of the foam is itself photoactive. This work reports, for the first time, the fabrication and characterisation of 3D printed photocatalytic foams, with favourable characteristics for the degradation of organic pollutants. The foams were printed using a titanium acrylate photopolymer which, after sintering, fully converts to titanium oxide. The resulting foams have high porosities of >90%, i.e. a pore structure providing an interconnected tortuous path which generates turbulence and mixing to improve mass transfer and decrease the boundary layer at the catalyst surface. Additionally, the use of 3D printing allows repeatability when compared with wet chemical methods of foam production.
As a photocatalyst, TiO2 demonstrates optimal performance when containing a combination of its two primary photocatalytically active crystalline forms, anatase and rutile. Anatase is the more photocatalytically active polymorph,35,36 which can be attributed to the (101) crystal surface exhibiting high photoactivity and an enhanced generation rate of hydroxyl radicals compared to the (110) surface of rutile.37 Additionally, the (101) surface facilitates the direct transfer of hydroxyl radicals to the adsorbed reagents. However the combination of rutile and anatase crystal phases leads to a significant increase in photocatalytic activity when compared with either crystal phase alone.38 This increase is attributed to the formation of junctions between the crystal phases, across which electron transfer is facilitated from the rutile phase to the lower energy anatase phase, leading to increased charge separation, longer charge pair lifetimes and a reduction in charge recombination reactions.38,39 Production of TiO2 that contains both phases, while also maintaining mechanical stability, presents a significant challenge as rutile is the thermodynamically favoured polymorph of TiO2 at most temperatures, and anatase is prone to an irreversible transformation into rutile when sintered.40 However, a pivotal outcome of this research has been the successful identification of specific printing and sintering conditions that yield a titania foam which is not only mechanically robust but also retains its photocatalytic activity by preserving a mixture of rutile and anatase phases.
Experimental
Materials
Acrylic acid (anhydrous 99%) and titanium(IV) ethoxide were purchased from Fischer Scientific and used as received. A proprietary UHR resin for Titan 2 printers that was purchased from MicroSLA and, henceforth, called ‘unmodified’ resin. Carbamazepine (>98%), was purchased from Sigma Aldrich and used as received.Modified resin synthesis
The synthesis of titania photocatalyst was modified from a previous report,41,42 to increase metal loading: acrylic acid (38.9 g, 0.53 mol) was mixed with titanium(IV) ethoxide (30.8 g, 0.14 mol) in a round bottom flask and stirred for 30 minutes. Addition of the Ti(OEt)4 caused a colour change from colourless to orange. After stirring, the titanium(IV) acrylate was added to 131.6 g of unmodified resin (Customized Green Titan 2 UHR resin for Titan 3 printer), leading to the formation of a dark green/black resin which was stirred until required for printing. While the initial addition of the photoresist to the commercial resin led to a decrease in viscosity, exposure of the modified resin to ambient conditions lead to an increase of its viscosity, accompanied by a change in colour to a lighter green.Production of porous macrostructures
The 3-D shapes for polymer foams were designed using a combination of Triply Periodic Minimal Surface (TPMS), namely Gyroid, and Constructive Solid Geometry (CSG) in MATLAB software. Autodesk Meshmixer and SULIS software were also used to tailor the shapes with the purpose of reducing the file sizes, smoothing out sharp edges and achieving an optimal distribution of vertices.The design equation for the Gyroid TPMS used here is:
| sin(f × x)cos(f × y) + sin(f × y)cos(f × z) + sin(f × z)cos(f × x) − t = 0 | (1) |
Starting in Matlab, two TPMS were created using the equation above and, with the use of the t parameter, an offset distance between them was defined. Using CSG, the space between two surfaces was filled and the whole object constrained to fill a cylinder with the dimensions of the photocatalytic reactor (see below). The cell unit size was the 3-dimensional span that one unit cell of gyroid covers, which can be adjusted by editing the frequency f in eqn (1).
Files of digital shapes designed as described above were then exported into other software for further editing: firstly, to Sulis software to decrease file size and smooth out sharp edges to obtain a higher quality printed object. The second editing step was done using Meshmixer software where the object's mesh obtained from Matlab was re-meshed to better spread-out vertices on the surface of the foam. This resulted in a better representation of the surface, enabling accurate calculation of the total and illuminated surface areas.
The final design was then exported as an .stl file to be read by the 3D printer. Objects were printed using a digital light processing (DLP) based 3D printer (Kudo3D Titan 3) to print the object layer by layer with each layer having a thickness of 50 μm. Parameters such as light exposure time and lift speed are reported in Table S1.† Printing was conducted with 130 mL of Ti-modified photo-initiator resin, 65 mL of which was removed from stirring and transferred to a wide glass dish for 1 day prior to printing to allow ageing to provide the resin with the desired viscosity to print. After printing, resinous foams were removed from the build plate and washed sequentially in soapy water and 1![[thin space (1/6-em)]](https://www.rsc.org/images/entities/char_2009.gif) :
:![[thin space (1/6-em)]](https://www.rsc.org/images/entities/char_2009.gif) 1 isopropanol
1 isopropanol![[thin space (1/6-em)]](https://www.rsc.org/images/entities/char_2009.gif) :
:![[thin space (1/6-em)]](https://www.rsc.org/images/entities/char_2009.gif) water and soap for 10 minutes each before being rinsed with water and air dried.
water and soap for 10 minutes each before being rinsed with water and air dried.
Samples were then sintered in a Carbolite tubular furnace using a multistage programme of 750 °C for 1.0 hours, followed by 700 °C for 30.0 hours at a heating and cooling rate of 20 °C min−1. This process is shown graphically below in Fig. 1.
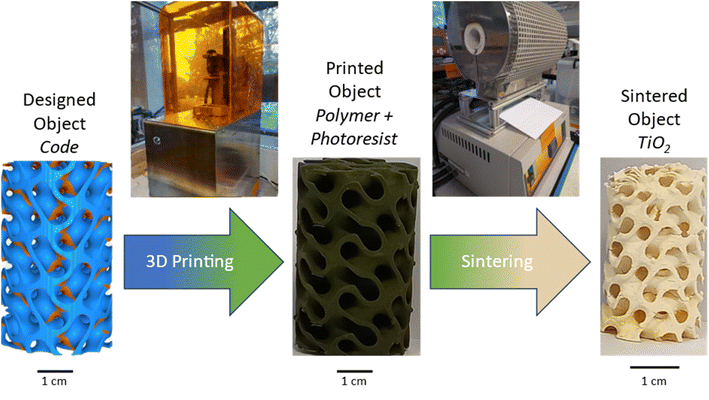 | ||
| Fig. 1 Fabrication process steps to obtain mixed phase titania foams via 3D printing, using a custom titanium acrylate-based resin and a commercial DLP printer. | ||
Characterisation of resin and printed objects
NMR analysis of the titania photoresist was conducted as the orange product (Ti(IV) acrylate) and acrylic acid precursor were dissolved in deuterated chloroform (CDCl3) for analysis on a 400 MHz Bruker Avance III NMR spectrometer.Thermogravimetric analysis was conducted using a Setsys Evolution TGA 16/18 by Setaram, with the acquisition program Calisto. 20 mg of sample was loaded in an open alumina crucible. Analysis was performed under air or argon atmosphere (20 mL min−1) and heated up to 800 °C for 1 h at a rate of 10 °C min−1.
The rheometry of all resins used in this study was conducted on a Brookfield HADV-III Ultra-Viscometer with a CP52 cone spindle. The surface morphology of the foams was studied using a JEOL 6301F FESEM and JEOL JSM-7900F FESEM. Samples were adhered to Al stubs using carbon paste. To minimise sample charging, the samples were coated with 20 nm Cr and, prior to imaging, a TEM grid was placed over the sample and adhered with copper tape.
The crystal structure of the foams was investigated using a STOE STADI P dual powder transmission X-ray diffractometer using a scanning range of 2θ = 20°–90° and a scan time of 20 minutes.
Raman spectra used in this work were collected using a Renishaw InVia Confocal Raman microscope, excitation laser wavelength 532 nm, 100% laser power at 74 mW on the sample with 2.6 s exposure time, and a diffraction grating of size 1800 I/mm with slit opening of 65 mm. Detector used was a 1040 × 256 pixel CCD camera.
The porosity and internal structure of the foams were determined using a combination of different characterisation methods: first, gravimetric porosity measurements were conducted using the Archimedes principle:43
 | (2) |
The porosity and internal structure of the foams were further analysed using microcomputer tomography. The slices were collected using a Nikon XT H 225 ST using a 178 kV X-ray source and 0.708 second exposure time, 3141 projections and 4 frames per projection and analysed using Thermo Scientific AvizoSoftware 9 3D data visualisation software.
Photocatalytic reactor setup
For the recirculating photocatalytic experiments, reactor cartridges were made up of a quartz tube (h = 250 mm, OD = 25 mm, ID = 22 mm) with a 3D printed plastic holder designed to keep the foams in place and prevent loss of the foam into the tubing and pump, and positioned to avoid interference with the light source. TiO2 foams of known mass (1.0 g) were placed inside the cartridge and secured using subaseal fittings, connected to a stirred jacketed beaker with a volume of 500 mL (acting as the reservoir) via a pulseless gear pump. The temperature of the reservoir was maintained using a water-cooled bath (RC-10 Digital Chiller, VWR). Three UV lamps (Aquatix pond UV lamp, λ = 254 nm, 5 W) positioned equidistant around the quartz tube reactor containing the TiO2 foam at a distance of 3 cm served as the light source with a total measured light intensity of 10.4 mW cm−2. Further details can be found in previous work.27Photocatalytic activity (PCA) experiments
PCA experiments were conducted using 10 μM solutions of pollutants in 500 mL unbuffered ultrapure water at 10 ± 1 °C. Carbamazepine (CBZ) was selected as a model micropollutant for photocatalytic activity (PCA) studies, due to being the top most detected pharmaceutical micropollutant worldwide.44 Furthermore carbamazepine was used as the target compound to allow for comparison with the literature,27,45 and because its degradation pathways using hydroxyl radicals generated by photocatalysis are well known and widely reported in the literature.46,47 The recirculating reactors were operated at a flow rate of 250 mL min−1. Photolysis control experiments were conducted in the absence of photocatalyst in the reactor and adsorption experiments were conducted using photocatalyst foams in the dark. Adsorption and removal of pollutant under dark conditions were found to be low. For all photocatalysis experiments, samples of 1 mL aliquots collected during sampling every 15 minutes for the first hour and every 30 minutes thereafter for a total of 120 minutes, such that the total volume removed was less than 10% of the starting reservoir volume. Samples were stored at 4 °C and analysed within 3 days using high performance liquid chromatography (HPLC).All experiments were repeated in triplicate. HPLC analysis of CBZ was performed on a Thermo Scientific Ultimate 3000 liquid chromatograph with a UV detector. CBZ analysis used a Thermo Scientific Acclaim 120 C18 column (3.0 × 75.0 mm, particle size 3.0 μm) and a Thermo Scientific Acclaim 120 C18 guard column®120 C18 (3.0 × 10.0 mm, particle size 5.0 μm). The mobile phase was made up using 5.0 mM phosphoric acid and acetonitrile 70![[thin space (1/6-em)]](https://www.rsc.org/images/entities/char_2009.gif) :
:![[thin space (1/6-em)]](https://www.rsc.org/images/entities/char_2009.gif) 30 (v
30 (v![[thin space (1/6-em)]](https://www.rsc.org/images/entities/char_2009.gif) :
:![[thin space (1/6-em)]](https://www.rsc.org/images/entities/char_2009.gif) v) with a flow rate of 0.8 mL min−1, injection volume of 20 μL and detection wavelength of 285 nm.
v) with a flow rate of 0.8 mL min−1, injection volume of 20 μL and detection wavelength of 285 nm.
The degradation of pollutant was measured via plotting (Ct/C0) vs. time where C0 is the initial concentration of pollutant and Ct is the concentration of pollutant at a given time. The pseudo first order degradation kinetics (k) was calculated via linear regression of a plot of ln(Ct/C0) vs. time.
After each experiment, the foam was removed from the reactor and dried overnight, before being weighed and stored under ambient conditions. A small change in mass was recorded (<2%), most likely due to handling of the foams.
Figures of merit for photocatalytic performance: quantum yield and electrical energy per order
Comparing photocatalytic performance across different materials, shapes and conditions requires using universal figures of merit which normalise results across such a range of parameters.48,49 Here, the activity of the catalyst was assessed using the quantum yield (Φ), defined as the number of molecules of pollutant undergoing degradation relative to the number of photons reaching the catalyst surface.50 The quantum yield was calculated by measuring the photon flux (Eqf) arriving at the surface of the photocatalyst and the kinetic constant (k) for the degradation of the pollutants, with the assumption there is negligible photon loss due to scattering and all photons are absorbed by the photocatalyst.51The electrical energy per order (EEO), defined as the kilowatt hour of electrical energy needed to decrease the concentration of a pollutant by an order of magnitude (90%) in one cubic metre of solution,52 was calculated to assess the technology's scale-up potential:
 | (3) |
Details of both calculations are provided in the ESI.†
Results and discussion
Modified resin synthesis
The mixing of the titanium(IV) ethoxide with acrylic acid caused a colour change from colourless to orange, indicating ligand exchange at the metal centre and the formation of titanium tetraacrylate (Fig. 2).1H-NMR spectra of the photoresist and acrylic acid (Fig. 3) show all expected signals for acrylic acid with shifts at 6.15, 5.85 and 6.53 ppm assigned to the a, b and c hydrogen from the double bond, respectively, and the signal at 12.8 ppm from the OH group.53 The prepared Ti(IV) acrylate product demonstrates the signals in the range of 5.0–6.0 ppm in the same position confirming these groups were present. The signal at 4.0 and 1.0 ppm are attributed to the hydrogen from the ethanol product. Additional peaks are from solvent CDCl3 (reference ○) and solvent impurities (□).
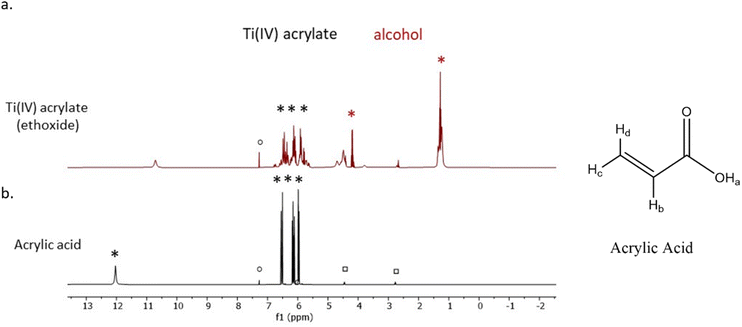 | ||
| Fig. 3 1H-NMR spectra of (a) the synthesised Ti(IV) acrylate photoresist and (b) the commercial acrylic acid. | ||
3D printing of mixed phase titania
Preliminary 3D print attempts using the modified resin containing 26 wt% Ti confirmed the method reported previously41 is suitable for printing with the 3D printer used herein. However, the samples printed in this way were mechanically fragile and easily damaged even with gentle handling. To overcome this, as well as to reduce the volume of organic material to be subsequently removed and increase of the metal content of the final foams, the proportion of titanium acrylate was increased such that the Ti content of the resin was 36 wt%. However, the increased amount of titanium acrylate significantly changed the modified resin's viscosity to the extent that the 3D printer was unable to print the structures. As such, a systematic rheometric study was conducted, showing that in the fresh modified resin, the addition of the titanium acrylate led to a significant decrease in viscosity, compared to the unmodified resin, likely due to the large molecule and metal centre of the titanium acrylate acting as a plasticiser. On the other hand, leaving the modified resin to age in air, resulted in such a high viscosity that the print arm was unable to lift out of the resin and was, therefore, unable to print more than a single layer. However, it was found that, using a 1![[thin space (1/6-em)]](https://www.rsc.org/images/entities/char_2009.gif) :
:![[thin space (1/6-em)]](https://www.rsc.org/images/entities/char_2009.gif) 1 mixture of the fresh and aged modified resins gave a viscosity similar to the unmodified resin, as shown in Fig. 4. The effect of the mixture of the two resins leading to a comparable viscosity to unmodified resins is further enhanced at higher temperatures, as shown in Fig. S1.†
1 mixture of the fresh and aged modified resins gave a viscosity similar to the unmodified resin, as shown in Fig. 4. The effect of the mixture of the two resins leading to a comparable viscosity to unmodified resins is further enhanced at higher temperatures, as shown in Fig. S1.†
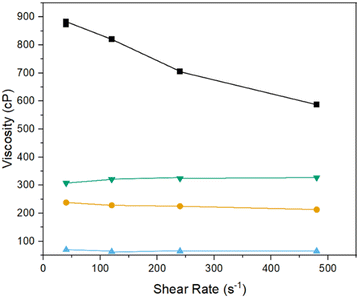 | ||
Fig. 4 Rheometric data at 20 °C of  unmodified resin, unmodified resin,  fresh Ti – modified resin, ■ aged Ti – modified resin and fresh Ti – modified resin, ■ aged Ti – modified resin and  1 1![[thin space (1/6-em)]](https://www.rsc.org/images/entities/char_2009.gif) : :![[thin space (1/6-em)]](https://www.rsc.org/images/entities/char_2009.gif) 1 mixed resin used for printing. 1 mixed resin used for printing. | ||
After optimising the printing parameters, primarily the exposure time and resin viscosity, structures with a gyroid triply periodic minimal surface (TPMS) could be successfully printed.
Characterisation of printed objects
Upon removal from the printer, the printed objects were green in colour and 52.4 ± 0.4 mm in height and 32.6 ± 0.3 mm in diameter. Wall thickness and pore diameter of these printed objects were 1.5 ± 0.1 mm and 3.9 ± 0.1 mm respectively. After sintering, the foams became a cream ceramic colour with dimensions of 31.5 ± 0.2 mm height and 19.0 ± 0.4 mm diameter with a change in mass of −94%, in agreement with thermogravimetric analysis (Fig. S2†). The small deviation in dimensions of the printed object highlights a key benefit of the 3D printing process, repeatability. Given the identical post-printing treatment of all samples, the resolution of the printer and the controlled design of the printed object, foams of specific size and geometry could be printed regularly and repeatably. The gravimetric porosity of the foams was measured using the Archimedes principle and was, in all cases, 93 ± 1%. This porosity can be attributed to both the design of the object, incorporating interconnected pores and channels, but also the microporosity that occurs between crystallites and is formed during the sintering process. The mechanical properties of the foams are affected by their high porosity. The compressive strength of porous tubes produced with the same procedure as the foams was 15 to 17 kPa.42 The thickness of the pore walls, measured in MicroCT reconstructions was 0.81 ± 0.02 mm. The slices and 3D reconstructions from the MicroCT show the highly porous interior and gyroid shape required for a tortuous fluid flow, with large macropores with a diameter of 2 mm (Fig. 5c and d), while the SEM micrographs show a microporous structure at the foam surface (Fig. 5).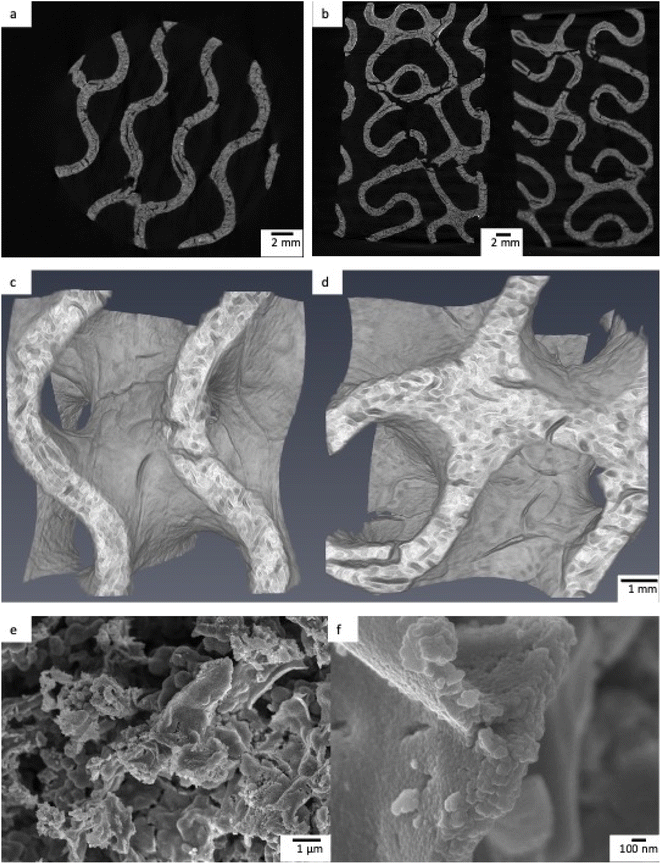 | ||
| Fig. 5 a and b) MicroCT slices of TiO2 printed foams. (c and d) MicroCT reconstructions of a 7 × 7 × 7 mm cube of TiO2 foam. (e and f) SEM micrograph of TiO2 foam. | ||
This combination of tortuous structure and hierarchical pore structure is highly desirable for photocatalytic foams as the combined effects of tortuous flow, which results in significant mixing and overcomes diffusion limitations, and highly porous structure, leading to high surface areas for photocatalytic reactions to occur at.
The XRD pattern (Fig. 6) shows the temperature dependence on the formation of both anatase and rutile TiO2, with the higher temperature sintering condition yielding mostly rutile phase, while the lower temperature yielding both anatase and rutile phase TiO2. Anatase peaks indicate the formation of tetragonal anatase structure with lattice parameters of a = b = 3.79 Å and C = 9.51 Å,54 with all peaks and parameters in agreement with those reported in JCPDS card no. 21-1272,55 and rutile peaks showing tetragonal structure with lattice parameters of a = b = 4.59 Å and C = 2.96 Å (ref. 54) with all peaks and parameters in agreement with those reported in JCPDS card no. 21-1276.56 All peaks were sharp, indicating that all samples were highly crystalline.
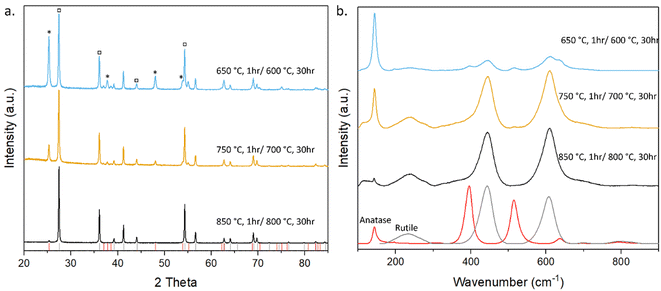 | ||
| Fig. 6 (a) XRD of TiO2 sintered under various conditions. * corresponds to anatase phase while □ corresponds to rutile. (b) Raman spectra of TiO2 sintered under various conditions. | ||
Raman spectroscopy was also employed to characterise the crystalline structure of the TiO2 as shown in Fig. 6. As the sintering temperature of the samples increases, the Raman spectra show more rutile characteristic peaks than anatase compared to the lower sintering temperatures. In the samples sintered at 650 °C, the predominant peak at 144 cm−1 corresponds to the Eg mode caused by symmetric stretching vibration of O–Ti–O bonds in the anatase phase of TiO2, with smaller peaks corresponding to the B1g and A1g modes of rutile TiO2 at wavenumbers 445 and 610 cm−1 caused by symmetric and asymmetric bending of O–Ti–O bonds, respectively.57
Samples sintered at all temperatures show the presence of both anatase and rutile phase TiO2. This is due to the transition between anatase and rutile TiO2 occurring around 600 °C,58,59 with the intensity of the anatase peaks in both the XRD and Raman spectra decreasing with increased temperature while the intensity of the rutile peaks increases. This can be seen in Tables S2–S5† as the normalised intensity of the Eg mode peak decreases as the temperature increases while the intensity of the A1g modes of rutile TiO2 increases and in the samples sintered at temperatures above 750 °C it becomes the predominant peak, while the Eg peak becomes the 3rd most intense peak with the ratio between these two peaks (An-Eg/Ru-A1g) decreasing from 4.132 to 0.659, further decreasing to 0.130 when sintered at 850 °C. This combination of anatase and rutile phases with a significant proportion of anatase, coupled with the mechanical stability of the samples sintered at 750 °C identified this as the optimal condition to assess the photocatalytic activity of the printed foams.
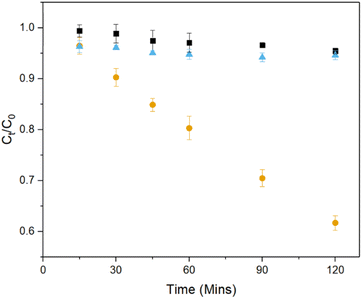
The photocatalytic activity of the 3D printed TiO2 foams was assessed by investigating the degradation of carbamazepine in a recirculating batch reactor design validated in previous works.27,45 In the absence of light, the removal of carbamazepine via adsorption of pollutant onto the catalyst is low as is the photolysis, conducted in the absence of catalyst, with both showing removal values of ∼5%. Application of both catalyst and irradiation lead to an increase in removal to 39% for carbamazepine.
A comparison of performance of the TiO2 3D printed foams made here with the vast literature on TiO2 nanoparticle slurries cannot be done simply using degradation data as shown in Fig. 7, given the significant differences in shape, size, conditions, etc.22 However, a quantitative comparison between different photocatalytic systems can be done using two figures of merit which take into account such differences, the quantum yield and electrical energy per order.52 The former measures the efficiency of photon utilisation of a system – the higher the quantum yield, the more efficiently the photons are used – for desired reactions rather than electron–hole recombination. Similarly, the electrical energy per order measures the electrical efficiency of a reactor system.
Comparing the photocatalytic activity of these 3D printed foams with TiO2 in the literature for the degradation of carbamazepine, when compared to TiO2 nanoparticle slurries the 3D printed foams show lower reaction rate constants, but higher quantum yields and electrical energies per order of 7.6 × 10⁻³ and 67.6 kW h m−3 respectively.60,61 A comparison of these metrics relative to other photocatalytic systems for the degradation of carbamazepine can be seen in Fig. 8. This clearly shows the merits of utilisation of a foam-based photocatalyst as it shows higher quantum and electrical efficiencies than all slurry and immobilised systems of TiO2. The values for the removal of carbamazepine, along with quantum yields and EEO show a reduction, when compared to previous studies using ZnO foams,27 which can be attributed to the higher rates of electron–hole recombination suffered by TiO2.62
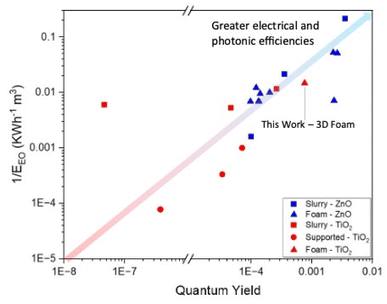 | ||
| Fig. 8 Map of quantum yields and 1/EEO of various photocatalytic systems for the degradation of carbamazepine. | ||
This difference in metrics highlights the advantage of a controllable synthetic process wherein shape and size can be fine-tuned, and reactor design can be considered as a parallel research track alongside material development of photocatalysts for water treatment.
Conclusions
Highly porous, yet mechanically robust, TiO2 foams containing both rutile and anatase phases were synthesised using a nanoparticle-free 3D printing approach, allowing for the production of regular and repeating gyroid structures of controlled size and structure. These structures retained their shape during heat treatment and formation of ceramic structures consisting of mixed phase TiO2. The impact of heat treatment parameters was assessed and found that a moderate temperature approach using a two-step sintering process with a maximum temperature of 750 °C led to the formation of both rutile and anatase crystal phases within the foam structures, which was seen as a boon for photocatalysis. These foams were applied in a recirculating photocatalytic reactor for the degradation of carbamazepine showing 40% removal of pollutant after 2 hours with quantum yields and electrical energy per order values of 7.58 × 10⁻³ and 67.56 kW h m−3, respectively, showing values higher than those reported for slurries and supported photocatalyst systems using TiO2. The repeatability of the production of these foams, provided by 3D printing, coupled with the ease of structure design and potential scalability, shows promise for the application of photocatalytic foams for the removal of micropollutants from water.Author contributions
Zachary Warren: conceptualisation, investigation, methodology, validation, visualisation, writing – original draft. Thais Tasso Guaraldo: conceptualisation, investigation, writing – review & editing. Ivan Barisic: conceptualisation, investigation, methodology, formal analysis. Garyfalia Zoumpouli: conceptualisation, investigation, methodology. Jannis Wenk: conceptualisation, supervision, writing – review & editing. Davide Mattia: conceptualisation, funding acquisition, project administration, resources, supervision, writing – review & editing.Conflicts of interest
There are no conflicts to declare.Acknowledgements
The authors would like to acknowledge the EPSRC for funding (EP/P031382/1). ZW would also like to acknowledge K. Proctor, R. Castaing, P. Fletcher, and D. Lednitzky of MC2 University of Bath analytical facilities as well as G. Kociok-Köhn of Department of Chemistry for support and assistance in collection of the data presented here. We are also grateful to Mr Paul Frith for the technical support on the reactor design. IB would like to acknowledge the University of Bath for funding his PhD. All data produced during this research are available from the University of Bath open access data archive at https://doi.org/10.15125/BATH-01368.References
- M. Macova, B. I. Escher, J. Reungoat, S. Carswell, K. L. Chue, J. Keller and J. F. Mueller, Water Res., 2010, 44, 477–492 CrossRef CAS PubMed
.
- P. Bhatt, G. Bhandari and M. Bilal, J. Environ. Chem. Eng., 2022, 10, 107598 CrossRef CAS
.
- Y. Y. Yang, G. S. Toor, P. C. Wilson and C. F. Williams, Water Res., 2017, 123, 258–267 CrossRef CAS PubMed
.
- M. A. Launay, U. Dittmer and H. Steinmetz, Water Res., 2016, 104, 82–92 CrossRef CAS PubMed
.
- R. Troger, P. Klockner, L. Ahrens and K. Wiberg, Sci. Total Environ., 2018, 627, 1404–1432 CrossRef PubMed
.
- K. Fent, A. A. Weston and D. Caminada, Aquat. Toxicol., 2006, 76, 122–159 CrossRef CAS PubMed
.
- D. Kanakaraju, B. D. Glass and M. Oelgemoller, J. Environ. Manage., 2018, 219, 189–207 CrossRef CAS PubMed
.
- Z.-z. Yang, C. Zhang, G.-m. Zeng, X.-f. Tan, H. Wang, D.-l. Huang, K.-h. Yang, J.-j. Wei, C. Ma and K. Nie, J. Mater. Chem. A, 2020, 8, 4141–4173 RSC
.
- Z. Shu, J. R. Bolton, M. Belosevic and M. G. El Din, Water Res., 2013, 47, 2881–2889 CrossRef CAS PubMed
.
- D. B. Miklos, C. Remy, M. Jekel, K. G. Linden, J. E. Drewes and U. Hubner, Water Res., 2018, 139, 118–131 CrossRef CAS PubMed
.
- M. Jekel, I. Zucker and U. Hübner, J. Water Reuse Desalin., 2015, 5, 8–16 CrossRef
.
- J. Wang and R. Zhuan, Sci. Total Environ., 2020, 701, 135023 CrossRef CAS PubMed
.
- C. M. Morrison, S. Hogard, R. Pearce, A. Mohan, A. N. Pisarenko, E. R. V. Dickenson, U. von Gunten and E. C. Wert, Environ. Sci. Technol., 2023, 57, 18393–18409 CrossRef CAS PubMed
.
- N. Tian, H. Huang, X. Du, F. Dong and Y. Zhang, J. Mater. Chem. A, 2019, 7, 11584–11612 RSC
.
- N. Liang, J. Zai, M. Xu, Q. Zhu, X. Wei and X. Qian, J. Mater. Chem. A, 2014, 2, 4208–4216 RSC
.
- S. K. Loeb, P. J. J. Alvarez, J. A. Brame, E. L. Cates, W. Choi, J. Crittenden, D. D. Dionysiou, Q. Li, G. Li-Puma, X. Quan, D. L. Sedlak, T. David Waite, P. Westerhoff and J. H. Kim, Environ. Sci. Technol., 2019, 53, 2937–2947 CrossRef CAS PubMed
.
- C. Yu, W. Zhou, H. Liu, Y. Liu and D. D. Dionysiou, Chem. Eng. J., 2016, 287, 117–129 CrossRef CAS
.
- L. Xiong, Y. Yang, J. Mai, W. Sun, C. Zhang, D. Wei, Q. Chen and J. Ni, Chem. Eng. J., 2010, 156, 313–320 CrossRef CAS
.
- A. Manassero, M. L. Satuf and O. M. Alfano, Chem. Eng. J., 2017, 326, 29–36 CrossRef CAS
.
-
H. d. Lasa, Photocatalytic Reaction Engineering, Springer US, Boston, MA, 2005 Search PubMed
.
- B. Nowack and T. D. Bucheli, Environ. Pollut., 2007, 150, 5–22 CrossRef CAS PubMed
.
- Z. Warren, T. Tasso Guaraldo, A. S. Martins, J. Wenk and D. Mattia, J. Environ. Chem. Eng., 2023, 11, 109238 CrossRef CAS
.
- R. J. Braham and A. T. Harris, Ind. Eng. Chem. Res., 2009, 48, 8890–8905 CrossRef CAS
.
- M. Vargová, G. Plesch, U. F. Vogt, M. Zahoran, M. Gorbár and K. Jesenák, Appl. Surf. Sci., 2011, 257, 4678–4684 CrossRef
.
- I. J. Ochuma, O. O. Osibo, R. P. Fishwick, S. Pollington, A. Wagland, J. Wood and J. M. Winterbottom, Catal. Today, 2007, 128, 100–107 CrossRef CAS
.
- T. Tasso Guaraldo, J. Wenk and D. Mattia, Adv. Sustainable Syst., 2021, 5, 2000208 CrossRef CAS
.
- Z. Warren, T. T. Guaraldo, J. Wenk and D. Mattia, J. Mater. Chem. A, 2022, 10, 11542–11552 RSC
.
- C.-Y. Lee, A. C. Taylor, A. Nattestad, S. Beirne and G. G. Wallace, Joule, 2019, 3, 1835–1849 CrossRef CAS
.
- T. D. Ngo, A. Kashani, G. Imbalzano, K. T. Q. Nguyen and D. Hui, Composites, Part B, 2018, 143, 172–196 CrossRef CAS
.
- A. Al-Shimmery, S. Mazinani, J. Ji, Y. M. J. Chew and D. Mattia, J. Membr. Sci., 2019, 574, 76–85 CrossRef CAS
.
- N. H. Mohd Yusoff, L.-R. Irene Teo, S. J. Phang, V.-L. Wong, K. H. Cheah and S.-S. Lim, Chem. Eng. J., 2022, 429, 132311 CrossRef CAS
.
- L. D. Tijing, J. R. C. Dizon, I. Ibrahim, A. R. N. Nisay, H. K. Shon and R. C. Advincula, Appl. Mater. Today, 2020, 18, 100486 CrossRef
.
- M. Grandcolas and A. Lind, Mater. Lett., 2022, 307, 131044 CrossRef CAS
.
- R. A. Borges, M. F. Pedrosa, Y. A. Manrique, C. G. Silva, A. M. T. Silva, J. L. Faria and M. J. Sampaio, Chem. Eng. J., 2023, 470, 144066 CrossRef CAS
.
- Y. Zhang, Z. Jiang, J. Huang, L. Y. Lim, W. Li, J. Deng, D. Gong, Y. Tang, Y. Lai and Z. Chen, RSC Adv., 2015, 5, 79479–79510 RSC
.
- O.-O. Prieto-Mahaney, N. Murakami, R. Abe and B. Ohtani, Chem. Lett., 2009, 38, 238–239 CrossRef CAS
.
- T. Hirakawa, K. Yawata and Y. Nosaka, Appl. Catal., A, 2007, 325, 105–111 CrossRef CAS
.
- J. Zhang, Q. Xu, Z. Feng, M. Li and C. Li, Angew Chem. Int. Ed. Engl., 2008, 47, 1766–1769 CrossRef CAS PubMed
.
- L. Ding, S. Yang, Z. Liang, X. Qian, X. Chen, H. Cui and J. Tian, J. Colloid Interface Sci., 2020, 567, 181–189 CrossRef CAS PubMed
.
- D. Regonini, C. R. Bowen, A. Jaroenworaluck and R. Stevens, Mater. Sci. Eng., R, 2013, 74, 377–406 CrossRef
.
- A. Vyatskikh, A. Kudo, S. Delalande and J. R. Greer, Mater. Today Commun., 2018, 15, 288–293 CrossRef CAS
.
- G. A. Zoumpouli, T. T. Guaraldo, Z. Warren, D. Mattia and J. Chew, Appl. Mater. Today, 2024, 37, 102136 CrossRef
.
- Y. Liao, R. Wang, M. Tian, C. Qiu and A. G. Fane, J. Membr. Sci., 2013, 425–426, 30–39 CrossRef CAS
.
- J. L. Wilkinson, A. B. A. Boxall, D. W. Kolpin, K. M. Y. Leung, R. W. S. Lai, C. Galban-Malagon, A. D. Adell, J. Mondon, M. Metian, R. A. Marchant, A. Bouzas-Monroy, A. Cuni-Sanchez, A. Coors, P. Carriquiriborde, M. Rojo, C. Gordon, M. Cara, M. Moermond, T. Luarte, V. Petrosyan, Y. Perikhanyan, C. S. Mahon, C. J. McGurk, T. Hofmann, T. Kormoker, V. Iniguez, J. Guzman-Otazo, J. L. Tavares, F. Gildasio De Figueiredo, M. T. P. Razzolini, V. Dougnon, G. Gbaguidi, O. Traore, J. M. Blais, L. E. Kimpe, M. Wong, D. Wong, R. Ntchantcho, J. Pizarro, G. G. Ying, C. E. Chen, M. Paez, J. Martinez-Lara, J. P. Otamonga, J. Pote, S. A. Ifo, P. Wilson, S. Echeverria-Saenz, N. Udikovic-Kolic, M. Milakovic, D. Fatta-Kassinos, L. Ioannou-Ttofa, V. Belusova, J. Vymazal, M. Cardenas-Bustamante, B. A. Kassa, J. Garric, A. Chaumot, P. Gibba, I. Kunchulia, S. Seidensticker, G. Lyberatos, H. P. Halldorsson, M. Melling, T. Shashidhar, M. Lamba, A. Nastiti, A. Supriatin, N. Pourang, A. Abedini, O. Abdullah, S. S. Gharbia, F. Pilla, B. Chefetz, T. Topaz, K. M. Yao, B. Aubakirova, R. Beisenova, L. Olaka, J. K. Mulu, P. Chatanga, V. Ntuli, N. T. Blama, S. Sherif, A. Z. Aris, L. J. Looi, M. Niang, S. T. Traore, R. Oldenkamp, O. Ogunbanwo, M. Ashfaq, M. Iqbal, Z. Abdeen, A. O’Dea, J. M. Morales-Saldana, M. Custodio, H. de la Cruz, I. Navarrete, F. Carvalho, A. B. Gogra, B. M. Koroma, V. Cerkvenik-Flajs, M. Gombac, M. Thwala, K. Choi, H. Kang, J. L. C. Ladu, A. Rico, P. Amerasinghe, A. Sobek, G. Horlitz, A. K. Zenker, A. C. King, J. J. Jiang, R. Kariuki, M. Tumbo, U. Tezel, T. T. Onay, J. B. Lejju, Y. Vystavna, Y. Vergeles, H. Heinzen, A. Perez-Parada, D. B. Sims, M. Figy, D. Good and C. Teta, Proc. Natl. Acad. Sci. U. S. A., 2022, 119, e2113947119 CrossRef CAS PubMed
.
- Z. Warren, J. Wenk and D. Mattia, RSC Adv., 2023, 13, 2438–2450 RSC
.
- S. Chiron, C. Minero and D. Vione, Environ. Sci. Technol., 2006, 40, 5977–5983 CrossRef CAS PubMed
.
- W. L. Wang, Q. Y. Wu, N. Huang, T. Wang and H. Y. Hu, Water Res., 2016, 98, 190–198 CrossRef CAS PubMed
.
- J. M. Buriak, P. V. Kamat and K. S. Schanze, ACS Appl. Mater. Interfaces, 2014, 6, 11815–11816 CrossRef CAS PubMed
.
- B. Ohtani, Chem. Lett., 2008, 37, 216–229 CrossRef
.
- N. Serpone and A. Salinaro, Pure Appl. Chem., 1999, 71, 303–320 CrossRef CAS
.
- S. E. Braslavsky, Pure Appl. Chem., 2007, 79, 293–465 CrossRef CAS
.
-
J. R. Bolton, K. G. Bircher, W. Tumas and C. A. Tolman, Figures-of-merit for the Technical Development and Application of Advanced Oxidation Technologies for Both Electric- and Solar-Driven Systems (IUPAC Technical Report), 2001 Search PubMed
.
- F. Ramos-Lara, A. L. C, M. O. Ramírez, M. Flores, R. Arroyo and U. Caldiño, J. Phys.: Condens. Matter, 2006, 18, 7951–7959 CrossRef CAS
.
- T. L. Thompson and J. T. Yates Jr, Chem. Rev., 2006, 106, 4428–4453 CrossRef CAS PubMed
.
- L. Mardiana, A. Y. P. Wardoyo, Masruroh and H. A. Dharmawan, J. Phys.: Conf. Ser., 2022, 2165 Search PubMed
.
- I. M. Joni, L. Nulhakim and C. Panatarani, J. Phys.: Conf. Ser., 2018, 1080 Search PubMed
.
- J. Yan, G. Wu, N. Guan, L. Li, Z. Li and X. Cao, Phys. Chem. Chem. Phys., 2013, 15, 10978–10988 RSC
.
- C. Su, K.-F. Lin, Y.-H. Lin and B.-H. You, J. Porous Mater., 2006, 13, 251–258 CrossRef CAS
.
- D. A. H. Hanaor and C. C. Sorrell, J. Mater. Sci., 2010, 46, 855–874 CrossRef
.
- S. Teixeira, R. Gurke, H. Eckert, K. Kühn, J. Fauler and G. Cuniberti, J. Environ. Chem. Eng., 2016, 4, 287–292 CrossRef CAS
.
- N. F. F. Moreira, M. J. Sampaio, A. R. Ribeiro, C. G. Silva, J. L. Faria and A. M. T. Silva, Appl. Catal., B, 2019, 248, 184–192 CrossRef CAS
.
- R. Qiu, D. Zhang, Y. Mo, L. Song, E. Brewer, X. Huang and Y. Xiong, J. Hazard. Mater., 2008, 156, 80–85 CrossRef CAS PubMed
.
Footnote |
| † Electronic supplementary information (ESI) available. See DOI: https://doi.org/10.1039/d4ta00869c |
| This journal is © The Royal Society of Chemistry 2024 |


