 Open Access Article
Creative Commons Attribution 3.0 Unported Licence
Influence of iron content on water uptake and charge transport in BaCe0.6Zr0.2Y0.2−xFexO3−δ triple-conducting oxides†
Jagoda
Budnik
 *,
Aleksandra
Mielewczyk-Gryń
 ,
Maria
Gazda
 and
Tadeusz
Miruszewski

Institute of Nanotechnology and Materials Engineering and Advanced Materials Centre, Gdańsk University of Technology, Narutowicza 11/12, 80-233, Gdańsk, Poland. E-mail: jagoda.budnik@pg.edu.pl
First published on 13th May 2024
Abstract
In this work, we studied the BaCe0.6Zr0.2Y0.2−xFexO3−δ system which belongs to the triple-conducting oxides (TCOs) group. The electrochemical properties of BaCe0.6Zr0.2Y0.2−xFexO3−δ were investigated using electrochemical impedance spectroscopy (EIS) and the water uptake was analyzed using thermogravimetry (TG). All investigated materials exhibited water uptake, with proton concentration increasing with decreasing iron content. BaCe0.6Zr0.2Y0.18Fe0.02O3−δ and BaCe0.6Zr0.2Y0.15Fe0.05O3−δ showed a significant electrical conductivity increase in wet air at low temperatures, indicating a hydration reaction occurring in these materials. The oxygen nonstoichiometry was determined using iodometric titration, revealing a linear decrease in oxygen vacancy concentration with increasing iron content in the materials. The partial oxygen ionic and electronic conductivity was determined at 600 and 800 °C. All compositions exhibited p-type electronic conductivity in air, and both types of partial conductivity decreased with increasing iron content. Water uptake kinetics was analyzed using electrical conductivity relaxation (ECR). Water uptake followed single-fold monotonic relaxation for BaCe0.6Zr0.2Y0.15Fe0.05O3−δ and BaCe0.6Zr0.2Y0.1Fe0.1O3−δ across the entire temperature range and, in the case of BaCe0.6Zr0.2Y0.18Fe0.02O3−δ, below 550 °C. At 550 °C and above, a two-fold relaxation kinetics in BaCe0.6Zr0.2Y0.18Fe0.02O3−δ was observed. The surface exchange coefficient and the chemical diffusion coefficient of water for different compositions were determined. The influence of water vapor on the oxidation and reduction kinetics in BaCe0.6Zr0.2Y0.18Fe0.02O3−δ and BaCe0.6Zr0.2Y0.1Fe0.1O3−δ was investigated. In both materials, a significant increase in the oxygen surface exchange and diffusion coefficients was observed in wet conditions in the case of oxidation.
Introduction
Triple-conducting oxides (TCOs) are a class of materials that exhibit conduction of electrons or electron holes, oxygen vacancies, and protons, which hold significant promise for various electrochemical applications. These materials, including perovskite-based compounds, have been considered potential electrode materials in protonic ceramic fuel cells (PCFCs),1,2 electrolyzers (PCECs),3 and membrane reactors.4 The triple-conducting oxides offer remarkable opportunities for the design of advanced electrochemical devices, paving the way for future advancements in energy conversion and storage technologies.The defect chemistry in perovskite compounds (ABO3) is influenced by multiple factors, e.g. the electronegativity of A and B cations which affects the ionicity/covalency of A–O and B–O bonds. Previously, a smaller difference in electronegativity between the cations has been observed to correspond to a diminished enthalpy of hydration, thereby leading to improved efficiency of proton incorporation into the structure.5 Additionally, lower average electronegativity of the cations can decrease electron transfer from oxygen, enhancing its basicity. That potentially affects electron hole mobility and promotes higher proton concentration.6
Beyond the cation composition, other properties, including the structural distortions and electronic structure of the oxide, also impact the feasibility of proton uptake. Raimondi et al. investigated the complex interplay between cation composition, structural distortions, and electronic structure features in (Ba,Sr,La)(Fe,Zn,Y)O3−δ perovskite materials, revealing their collective influence on proton uptake. The authors further highlighted the influence of oxygen states on the covalency of Fe–O bonds and charge transfer to transition metal cations, which ultimately affected the basicity of oxide ions. The materials showing the highest proton uptake exhibited the most pronounced structural distortions.7 Furthermore, Raimondi et al. discussed the relationship between the buckling of Fe–O–B bonds and the Fe(3d)–O(2p) orbital overlap, elucidating its impact on the proton uptake capabilities of (Ba,La)(Fe,Zn,Y)O3−δ perovskites.8
Motivated by these findings, a series of compounds, namely BaCe0.6Zr0.2Y0.2−xFexO3−δ (x = 0.02, 0.05, 0.1), was investigated in this work to explore the influence of varying iron content on the transport properties, proton uptake, as well as the surface exchange and diffusion behavior of these materials. BaCe0.6Zr0.2Y0.2−xFexO3−δ is a series related to a well-established mixed oxygen ionic–protonic conductor Ba(Ce,Zr,Y)O3−δ (BCZY), often employed as an electrolyte in PCFCs.9–11 By substituting cerium, zirconium, or yttrium with mixed-valence cations such as praseodymium,12 cobalt,13 or ruthenium,14 the electronic conductivity of the material can be enhanced. The investigation of diffusion and surface exchange processes, both those of water and oxygen, offers a valuable approach to studying the ionic (oxygen ionic and proton) transport phenomena in ceramic materials. By examining the diffusion kinetics of mobile species, valuable insight can be gained into the complex interplay between oxygen ions, protons, and electronic charge carriers within triple-conducting materials. In the case of TCOs, the mechanisms associated with water diffusion and its description are more complex compared to materials with only two mobile charge carriers.15 Several research groups have conducted investigations on the hydration kinetics in mixed proton-oxygen ion conductors16,17 and TCOs,18,19 aiming to unravel the transport mechanisms of charge carriers and highlighting the importance of understanding water uptake in various types of conductive oxides. Similarly, studies of the surface exchange coefficient, which represents the rate of chemical species exchange at the material's surface, are very important and, in materials with multiple mobile charge carriers, may bring interesting results.20 The surface exchange process can act as a limiting factor in electrochemical processes and catalytic reactions, affecting the overall properties of the material. Therefore, thorough research and an accurate description of this process are critical for acquiring knowledge of the transport characteristics and optimizing the performance of TCOs in diverse electrochemical applications. Additionally, for a comprehensive understanding and exploration of useful materials for electrochemical devices, it is essential to investigate how the surface exchange and diffusion of water and oxygen influence one another. This includes examining how the presence of water vapor in the atmosphere influences processes involving oxygen ions. This is especially significant since electrochemical devices typically operate in a humid environment, which can have a substantial impact on their overall efficiency. Furthermore, in the case of triple-conducting oxides, water strongly influences their defect chemistry, leading to significant implications for their electrochemical properties.
So far, several studies have explored the impact of water on the surface exchange of oxygen in various materials, including La0.58Sr0.4Co0.2Fe0.8O3−δ studied by Bucher et al.,21 LaxWO12−δ examined by Solís et al.,22 and BaCe0.6Zr0.2Y0.1Tb0.1O3−δ reported in our recent work.23 However, the current knowledge regarding this influence remains limited, necessitating further research to fully understand these effects.
In this work, electrochemical studies were conducted on a series of BaCe0.6Zr0.2Y0.2−xFexO3−δ (x = 0.02, 0.05, 0.1) ceramics. Water uptake, electrical properties, as well as chemical diffusion and chemical surface exchange of water were examined. The dependence of these characteristics on the relative content of iron and yttrium was explored. A possible correlation between the relaxation mechanisms associated with water diffusion and the transference number of holes in these materials was analyzed. The surface exchange and diffusion of oxygen were examined under both dry and humid conditions for the materials with the lowest and highest iron content, BaCe0.6Zr0.2Y0.18Fe0.02O3−δ and BaCe0.6Zr0.2Y0.1Fe0.1O3−δ, revealing the significant impact of water vapor on the oxidation kinetics. A thorough investigation of the limiting processes, including surface exchange, is critical to the conscious development of new materials for electrochemical applications in the field of protonic conductors. This study provides valuable insights into the intricate surface and bulk kinetics governing the behavior of triple-conducting oxides.
Experimental methods
Materials synthesis
Polycrystalline samples of BaCe0.6Zr0.2Y0.2−xFexO3−δ (where x = 0.02, 0.05, 0.1) were synthesized using the solid-state reactive sintering method. To initiate the procedure, powder forms of BaCO3, CeO2, ZrO2, Y2O3, and Fe3O4 (all purities >99%) in stoichiometric proportions were mixed in a mortar. The reactants were then ball-milled in isopropyl alcohol for 12 hours at 450 rpm. Subsequently, the mixture was calcined under a constant flow of synthetic air and a temperature of 950 °C for 24 hours. After the calcination, the powder, with the addition of 1 wt% of NiO as a sintering aid, was milled again in the same conditions. The powders were uniaxially pressed (250 MPa) into pellets and sintered at 1300 °C for 10 hours in the air.X-ray diffractometry
The phase composition and crystal structure of the obtained samples were analyzed by the X-ray powder diffraction technique using Phillips X'Pert Pro diffractometer. The data were collected at 10–90° using Cu Kα radiation at room temperature under ambient pressure. The diffraction patterns were analyzed using the HighScore Plus XRD Analysis Software. Unit cell parameters were determined based on the Rietveld analysis of the X-ray diffraction (XRD) patterns within the cubic perovskite crystal structure (Pm![[3 with combining macron]](https://www.rsc.org/images/entities/char_0033_0304.gif) m).24
m).24
Thermogravimetric analysis
To analyze the water uptake, the thermogravimetry (TG) method was performed with Netzsch STA 449. The measurements were carried out in synthetic air (pO2 ≈ 0.2 atm, flow 50 mL min−1). The samples in the form of powder (obtained by crushing and milling the pellets prepared through the steps described in the Material synthesis section) were initially annealed in dry air (pH2O ≈ 10−5 atm) at 800 °C for 5 hours to eliminate the remaining water and carbon dioxide adsorbed on the surface of the particles of powdered samples. Then, the temperature was decreased to 300, 450, or 600 °C with a cooling rate of 2 °C min−1. After 2 hours, the atmosphere was switched to humidified air (pH2O = 0.023 atm) and the time evolution of mass was recorded. To avoid a buoyancy effect a blank TG experiment was carried out before the measurement of each sample. The data obtained at 300, 450 and 600 °C, can be found in the ESI.†Iodometric titration
The determination of oxygen nonstoichiometry in the series of BaCe0.6Zr0.2Y0.2−xFexO3−δ (x = 0.02, 0.05, 0.1) compounds was carried out using the iodometric titration method. Considering the composition of the materials in this series, the cations with variable oxidation states were iron (4+, 3+, or 2+) and cerium (4+ or 3+). The procedure began by purging the flask with argon for 20 minutes to remove air, after which the powdered material (15–20 mg), along with KI (0.2 g), was dissolved in 2 M hydrochloric acid. After the dissolution of the material, Fe4+ and Fe3+ ions were reduced by iodide ions to Fe2+, while Ce4+ ions were reduced to Ce3+, as described by the reactions (1)–(3)| 2Fe3+ + 3I− → 2Fe2+ + I3−, | (1) |
| Fe4+ + 3I− → Fe2+ + I3−, | (2) |
| 2Ce4+ + 3I− → 2Ce3+ + I3−. | (3) |
Subsequently, 0.01 M Na2S2O3 was slowly added to the solution. To enhance the visibility of the color change, a few milliliters of 1 wt% starch water solution were incorporated towards the end of the titration, until the mixture was completely decolorized. At this stage, the liberated iodine was reduced by thiosulfate according to eqn (4)
| 2S2O32− + I3− → S4O62− + 3I−. | (4) |
The amount of I3− ions released in reactions (1)–(3) was evaluated based on the volume of sodium thiosulfate used in the titration (reaction (4)), which allowed for the determination of oxygen nonstoichiometry.
Electrical properties
 | (5) |
Results and discussion
Material characterization
The phase composition analysis and crystal structure characterization of the synthesized samples were performed using the XRD technique at room temperature, whereas the oxygen stoichiometry was determined using the titration method. Fig. 1 presents the diffraction patterns obtained for the samples of BaCe0.6Zr0.2Y0.18Fe0.02O3−δ (BCZYFe2), BaCe0.6Zr0.2Y0.15Fe0.05O3−δ (BCZYFe5), BaCe0.6Zr0.2Y0.1Fe0.1O3−δ (BCZYFe10),23 and the reference sample BaCe0.6Zr0.2Y0.2O3−δ (BCZY622).26 The patterns indicate that the samples are single-phase, with only minute reflections of nickel oxide observed in the diffraction patterns of BCZYFe5 and BCZYFe10, which is due to the usage of NiO as a sintering aid.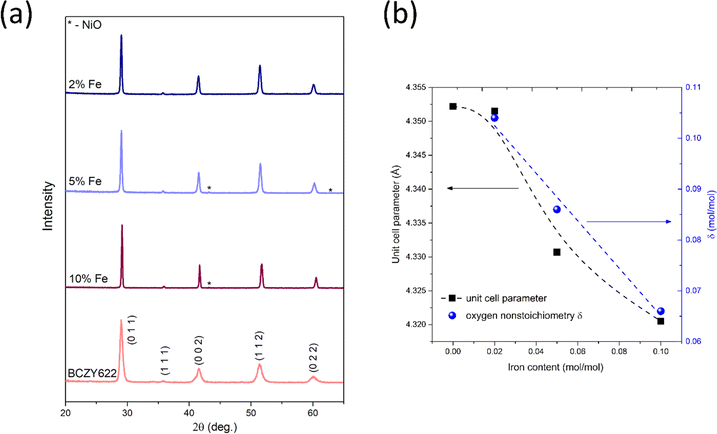 | ||
| Fig. 1 (a) XRD patterns of BaCe0.6Zr0.2Y0.18Fe0.02O3−δ (2% Fe), BaCe0.6Zr0.2Y0.15Fe0.05O3−δ (5% Fe), BaCe0.6Zr0.2Y0.1Fe0.1O3−δ (10% Fe),23 and the reference sample BaCe0.6Zr0.2Y0.2O3−δ (BCZY622),26 collected at room temperature under atmospheric air. (b) The pseudo-cubic unit cell parameter and oxygen nonstoichiometry as a function of iron content. The dashed lines serve as visual aids intended to improve the readability of the displayed data. | ||
To determine the concentration of oxygen vacancies, iodometric titration was performed. The calculated oxygen nonstoichiometry δ values are presented in Table 1 and Fig. 1b. As the iron content decreases, the δ assumes higher values, which corresponds directly to a higher oxygen vacancy concentration. The oxygen nonstoichiometry shows a linear dependence on the amount of Fe. In the material with 2% of Fe, δ is slightly above the nominal 0.1 value (0.104), however, this difference is within the experimental accuracy. While most cerium ions are at the 4+ oxidation state in air at room temperature,27 the presence of a small fraction of cerium ions at the 3+ oxidation state cannot be excluded, as cerium ions in barium cerate have been reported to exist in a partially reduced state, even under an air atmosphere.28 The observed dependence of oxygen nonstoichiometry is a probable reason for the non-linear dependence of the unit cell parameter on x which could be expected based on the Vegard rule.
| Sample | Unit cell parameter a = b = c (Å) | t | δ (mol mol−1) | Relative density (%) |
|---|---|---|---|---|
| BaCe0.6Zr0.2Y0.2O3−δ (ref. 26) | 4.3522(1) | 0.948 | — | >98 |
| BaCe0.6Zr0.2Y0.18Fe0.02O3−δ | 4.3515(1) | 0.951 | 0.104(3) | 99.1 |
| BaCe0.6Zr0.2Y0.15Fe0.05O3−δ | 4.3307(1) | 0.955 | 0.086(4) | 98.6 |
| BaCe0.6Zr0.2Y0.1Fe0.1O3−δ (ref. 23) | 4.3205(2) | 0.963 | 0.066(5) | 90.2 |
The Goldschmidt tolerance factors29t for each stoichiometry were calculated using ionic radii data for charge and the coordination number for each ion.30 The charge of iron ions was assumed to be 4+ for the calculation of t, which corresponds to the most disadvantageous case, in which the difference between the size of iron and the size of other atoms on the B-site is the greatest. The t parameters of the analyzed stoichiometries were between 0.951 and 0.963 (Table 1), which indicates the stability of the cubic crystal structure. Nevertheless, based on the X-ray diffraction technique, we cannot exclude a small deviation from the cubic structure. Therefore, the Rietveld refinements using the Pm![[3 with combining macron]](https://www.rsc.org/images/entities/char_0033_0304.gif) m (cubic), R
m (cubic), R![[3 with combining macron]](https://www.rsc.org/images/entities/char_0033_0304.gif) c (trigonal), and Imma (orthorhombic) space groups were performed. XRD diffraction patterns with the corresponding fitting and differential curves for BCZYFe2, BCZYFe5, and BCZYFe10, refined using cubic, orthorhombic and trigonal unit cells are included in the ESI (Fig. S1).† The lowest Rwp obtained for the cubic structure for BCZYFe2 indicate that in this case it is the best model, whereas the results for the BCZYFe5 and BCZYFe10 are not conclusive. The structural distortions associated with the introduction of iron into the BCZY structure present in the material would be localized and undetectable by the XRD analysis. Therefore, the structure of the materials is described as pseudo-cubic, since the existence of some small distortions cannot be excluded and is expected based on the reports concerning similar materials. Mirfakhraei et al. reported this effect in Fe-doped BCZY,31 indicating that the materials under investigation in this study are likely to be impacted by this phenomenon. The variation in symmetries within the perovskite structures may arise from the tilting of BO6 octahedra.32,33 The parameters of the pseudo-cubic unit cell are collected in Table 1. The values for the BCZYFe10 are comparable to the parameters reported by Tarutina et al. for the same material composition.34 It can be seen that with increasing iron content, the unit cell size decreases, because iron, substituting yttrium in the BCZY structure, has a smaller ionic radius.
c (trigonal), and Imma (orthorhombic) space groups were performed. XRD diffraction patterns with the corresponding fitting and differential curves for BCZYFe2, BCZYFe5, and BCZYFe10, refined using cubic, orthorhombic and trigonal unit cells are included in the ESI (Fig. S1).† The lowest Rwp obtained for the cubic structure for BCZYFe2 indicate that in this case it is the best model, whereas the results for the BCZYFe5 and BCZYFe10 are not conclusive. The structural distortions associated with the introduction of iron into the BCZY structure present in the material would be localized and undetectable by the XRD analysis. Therefore, the structure of the materials is described as pseudo-cubic, since the existence of some small distortions cannot be excluded and is expected based on the reports concerning similar materials. Mirfakhraei et al. reported this effect in Fe-doped BCZY,31 indicating that the materials under investigation in this study are likely to be impacted by this phenomenon. The variation in symmetries within the perovskite structures may arise from the tilting of BO6 octahedra.32,33 The parameters of the pseudo-cubic unit cell are collected in Table 1. The values for the BCZYFe10 are comparable to the parameters reported by Tarutina et al. for the same material composition.34 It can be seen that with increasing iron content, the unit cell size decreases, because iron, substituting yttrium in the BCZY structure, has a smaller ionic radius.
The relative densities of the samples were found to be 99.1% for BCZYFe2, 98.6% for BCZYFe5, and 90.2% for BCZYFe10 (Table 1), indicating that the presence of iron diminishes the sinterability of the samples. Due to the low density of the BCZYFe10 sample, a second sample of higher density (96.9%) was prepared to avoid the diffusion of gas through the pores during the ECR measurements.
Water uptake and defect chemistry analysis
Facilitating proton conduction in ceramic oxides requires the introduction of proton defects in the material. The incorporation of protons can occur through two mechanisms: hydration, involving the dissociative absorption of water through an acid–base reaction: | (6) |
 | (7) |
Materials with a prevalent concentration of oxygen vacancies  mainly exhibit hydration, while those with a higher concentration of electron holes
  tend to undergo hydrogenation.35 To investigate the water uptake behavior in the BaCe0.6Zr0.2Y0.2−xFexO3−δ series, a thermogravimetric analysis was performed. The change in mass over time was analyzed during the isothermal switch of the atmosphere from dry (pH2O ≈ 10−5 atm) to humid (pH2O ≈ 2.3 × 10⁻² atm) synthetic air at 300, 450, and 600 °C. The water uptake profiles for the studied compounds and the BCZY622 reference material26 at 300 °C are presented in Fig. 2. The data collected at 300, 450, and 600 °C can be found in the ESI (Fig. S2).†
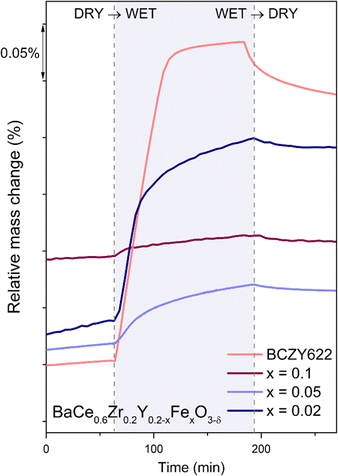 | ||
| Fig. 2 Relative mass change of BaCe0.6Zr0.2Y0.18Fe0.02O3−δ (x = 0.02), BaCe0.6Zr0.2Y0.15Fe0.05O3−δ (x = 0.05), BaCe0.6Zr0.2Y0.1Fe0.1O3−δ (x = 0.1)23 samples, and the reference sample BaCe0.6Zr0.2Y0.2O3−δ (BCZY622),26 collected at 300 °C during the atmosphere switches: from dry to wet and from wet to dry air. | ||
The comparative analysis of the thermograms indicates that the presence of iron within the BCZY structure diminishes the water uptake. As the iron content increases, the mass change corresponding to the proton incorporation is smaller. Furthermore, mass growth becomes progressively slower as the amount of iron increases, as evidenced by the time derivative of mass plots shown in Fig. 3. Additionally, a gradual mass increase after the initial sharp mass jump suggests the possible occurrence of another process, potentially related to material oxidation.
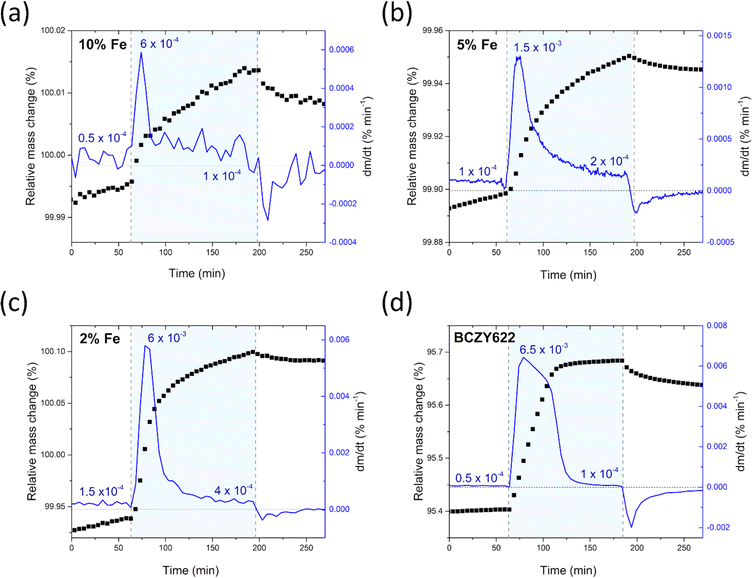 | ||
| Fig. 3 Relative mass change and the time derivative of mass of BaCe0.6Zr0.2Y0.1Fe0.1O3−δ (a),23 BaCe0.6Zr0.2Y0.15Fe0.05O3−δ (b), BaCe0.6Zr0.2Y0.18Fe0.02O3−δ (c) samples, and the reference sample BaCe0.6Zr0.2Y0.2O3−δ (d),23 collected at 300 °C during the atmosphere switches: from dry to wet and from wet to dry air. | ||
It is worth noting that the transition from humid air back to dry air proceeds differently in comparison to the mass increase observed in the preceding atmosphere switch. The rate of mass change is significantly reduced, and the mass does not return to the pre-hydration level, indicating that a fraction of the proton defects remains in the structure of the material. The considerably lower rate of mass change during dehydration suggests slower kinetics for the release of protons from the structure. This observation is consistent with the high stability of proton defects in the material at low temperatures, which can be attributed to the negative enthalpy of hydration, typical of proton conductors.36
Based on previous studies,23 it has been established that the water incorporation process in BCZYFe10 involves hydration rather than hydrogenation. Taking that into account, we may assume that BCZYFe5 and BCZYFe2, containing less iron, also hydrate. What is more, they are more prone to hydration than BCZYFe10. This is caused by a higher concentration of oxygen vacancies in those materials. As was shown based on the titration analysis, the oxygen content is the lowest in BCZYFe2 and increases with increasing iron content (Table 1), which corresponds to a decreasing oxygen vacancy concentration, since  .
.
Therefore, the proton concentrations in the studied compounds (Table 2) were calculated using the equation
 | (8) |
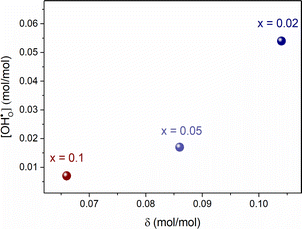 | ||
| Fig. 4 The proton concentration as a function of oxygen nonstoichiometry in the series of BaCe0.6Zr0.2Y0.2−xFexO3−δ compounds. | ||
Furthermore, the average of Pauling electronegativities of A and B cations (χA and χB, respectively), as well as the difference between them, exhibit an increasing trend with the higher iron content, as shown in Table 2. It was reported, that as the average electronegativities of A and B decrease, the basicity of the oxygen ion increases,6 while a smaller difference between the electronegativities of A and B cations leads to a decrease in the enthalpy of hydration.37 Both of these effects contribute to the enhancement of water uptake efficiency and, consequently, to a higher proton concentration in the material. These findings are consistent with the results obtained in the present study.
Ionic and electronic charge transport
To analyze the ionic (oxygen and proton) and electronic charge transport in BaCe0.6Zr0.2Y0.2−xFexO3−δ (x = 0.02, 0.05, 0.1), their electrical properties were investigated over a wide range of temperatures and oxygen partial pressures using the EIS method. The representative Nyquist plots with the corresponding fitting curves for each material at 300 and 800 °C measured in dry and wet air are included in the ESI (Fig. S3).†Fig. 5 illustrates the temperature dependence of the total electrical conductivity of BaCe0.6Zr0.2Y0.2−xFexO3−δ (x = 0.02, 0.05, 0.1) measured in dry and humid synthetic air (pO2 ≈ 0.2 atm; pH2O ≈ 10−5 atm and pH2O ≈ 2.3 × 10⁻² atm, respectively). By analyzing the differences in electrical conductivity at different water partial pressures, conclusions can be drawn regarding the proton conductivity in the investigated compounds. Typically, if proton defect formation occurs via the hydration reaction, enhanced total electrical conductivity in a wet atmosphere is observed. On the other hand, if the hydrogenation reaction occurs, a decrease in total conductivity in a wet atmosphere is seen. This is mostly associated with the different mobilities of the proton created and the charge carrier consumed in each reaction (eqn (6) and (7)). In BCZYFe2 and BCZYFe5, the conductivity in wet air is higher than that in dry air, which is consistent with the results of TGA indicating that the hydration reaction takes place in these materials. The difference in conductivity between dry and humid conditions becomes more pronounced as the temperature decreases. This occurs because, at lower temperatures, the proton concentration increases due to the exothermic nature of the hydration reaction. Therefore, the increase in total electrical conductivity in materials in wet atmospheres results from an increase in the concentration of protons, which typically exhibit higher mobility than oxygen vacancies.38 At 300 °C, the difference between the conductivity in wet and dry air is 2.2 × 10⁻⁴ S cm−1 and 5.9 × 10⁻⁵ S cm−1 for BCZYFe2 and BCZYFe5, respectively. However, in the case of the material with the highest iron content, BCZYFe10, though water uptake characteristics indicate hydration process,23 a very small difference in conductivities is observed. This is consistent with a very low concentration of proton defects found by TG (0.007 mol mol−1 at 300 °C). Moreover, this effect could be also linked to the large impact of proton-trapping on the mobility of proton defects caused by acceptor dopant, as reported by Oikawa et al. in a study for Sc-doped barium zirconates.39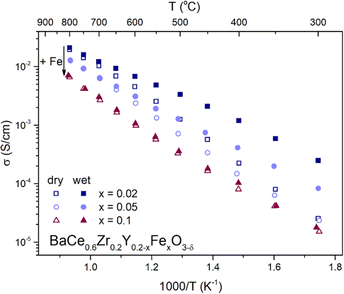 | ||
| Fig. 5 Temperature dependence of total electrical conductivity of BaCe0.6Zr0.2Y0.2−xFexO3−δ (x = 0.02, 0.05, 0.1) series measured in dry and wet air. | ||
Furthermore, comparing the conductivities of the materials in dry air reveals that with increasing iron content, the total conductivity decreases, which is consistent with the results of Tarutina et al.34 Moreover, the activation energy of conduction decreases (see Table 3). The activation energies of conduction in dry air are (0.72 ± 0.02) eV, (0.68 ± 0.01) eV, and (0.64 ± 0.02) eV for BCZYFe2, BCZYFe5, and BCZYFe10, respectively. Under humid conditions, the activation energy significantly decreases in the case of BCZYFe2 and BCZYFe5, reaching values of (0.46 ± 0.01) eV and (0.53 ± 0.01) eV, respectively. Such a pronounced reduction in activation energy for materials containing 2% and 5% iron in the B-site sublattice is associated with a significant contribution of proton conductivity at lower temperatures.
| Sample | Activation energy (eV) | |
|---|---|---|
| Dry air | Wet air | |
| BaCe0.6Zr0.2Y0.18Fe0.02O3−δ | 0.72 ± 0.02 | 0.46 ± 0.01 |
| BaCe0.6Zr0.2Y0.15Fe0.05O3−δ | 0.68 ± 0.01 | 0.53 ± 0.01 |
| BaCe0.6Zr0.2Y0.1Fe0.1O3−δ | 0.64 ± 0.02 | 0.63 ± 0.02 |
Substituting cerium, zirconium, or yttrium with mixed-valence cations like praseodymium, cobalt, or ruthenium can increase the electronic conductivity of the material.12–14 Since iron is also a transition metal, it is plausible to assume that it would have a similar impact on the electronic partial conductivity compared to the BCZY material. To separate the contributions of ionic and electronic conductivity in the investigated materials, an analysis of electrical conductivity was performed at various oxygen partial pressures at two temperatures: 600 °C (Fig. 6a) and 800 °C (Fig. 6b). In low pO2 (below a pressure between 10−3 to 10−4 atm), the total conductivity of BaCe0.6Zr0.2Y0.18Fe0.02O3−δ can be assumed to be ascribed to oxygen vacancies. The conductivity of the oxides with higher iron content, in this pressure range, cannot be considered constant but weakly dependent on the oxygen partial pressure. Therefore, they are mixed conductors with an additional electronic component, associated with the increasing concentration of electron holes due to the filling of oxygen vacancies by the oxygen from the atmosphere which is compensated with electron holes according to the eqn (9)
 | (9) |
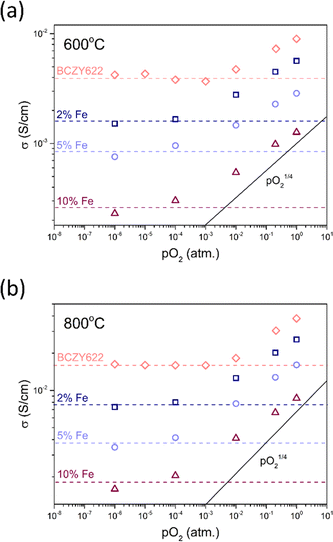 | ||
| Fig. 6 Total electrical conductivity as a function of oxygen partial pressure measured at 600 °C (a) and 800 °C (b) for BaCe0.6Zr0.2Y0.18Fe0.02O3−δ (2% Fe), BaCe0.6Zr0.2Y0.15Fe0.05O3−δ (5% Fe), BaCe0.6Zr0.2Y0.1Fe0.1O3−δ (10% Fe), and BCZY622.26 | ||
In higher pO2 atmospheres, above 10−3 atm, in all three studied oxides, this process becomes important. The total conductivity of mixed conductors depends on the oxygen partial pressure and, in dry conditions, can be written as
| σtotal = σO + σh = σO + ah0 × pO21/4, | (10) |
The ionic and electronic partial conductivities for a given pO2 were estimated through the application of eqn (10) to the σ(pO2) experimental data. The parameters found for the investigated BaCe0.6Zr0.2Y0.2−xFexO3−δ (x = 0.02, 0.05, 0.1) materials at 600 °C and 800 °C in air are summarized in Table 4. The values for BCZY622 (ref. 26) at 800 °C were also included in the table as a reference. With increasing iron content, the total electrical conductivity decreases at both analyzed temperatures.
| Sample | T (°C) | σ total (S cm−1) | σ O (S cm−1) | σ h (S cm−1) | t h˙ |
|---|---|---|---|---|---|
| BCZYFe2 | 600 | 4.5 × 10⁻³ | 1.4 × 10⁻³ | 3.0 × 10⁻³ | 0.66 |
| 800 | 2.0 × 10⁻² | 6.7 × 10⁻³ | 1.3 × 10⁻² | 0.64 | |
| BCZYFe5 | 600 | 2.3 × 10⁻³ | ∼8.5 × 10⁻⁴ | 1.4 × 10⁻³ | 0.60 |
| 800 | 1.3 × 10⁻² | ∼4.2 × 10⁻³ | 8.1 × 10⁻³ | 0.63 | |
| BCZYFe10 | 600 | 9.8 × 10⁻⁴ | ∼2.3 × 10⁻⁴ | 7.1 × 10⁻⁴ | 0.72 |
| 800 | 6.6 × 10⁻³ | ∼2.1 × 10⁻³ | 4.5 × 10⁻³ | 0.67 | |
| BCZY622 | 800 | 3.9 × 10⁻² | 7.4 × 10⁻³ | 3.1 × 10⁻² | 0.80 |
As can also be seen, the ionic partial conductivity significantly decreases with increasing iron content, due to a decrease in the concentration of mobile oxygen vacancies in the materials (see Table 2). The additional reason for that behavior might be the lower mobility of oxygen ions compared to the mobility of electron holes. Iron ions, regardless of oxidation state, have a significantly smaller ionic radius than yttrium ions (0.55 Å, 0.585 Å, and 0.9 Å, for Fe3+, Fe4+, and Y3+, respectively).30 Therefore, an increased iron content at the expense of yttrium leads to a reduction in the unit cell volume, as evidenced by XRD analysis (see Table 1). This could lead to a decrease in the mobility of oxygen vacancies. Interestingly, the electronic partial conductivity also decreases in compounds with higher iron content, suggesting that the presence of iron does not enhance, but rather diminishes electronic conductivity in BaCe0.6Zr0.2Y0.2−xFexO3−δ compounds. The cause of this phenomenon is not clear, however, it is likely due to the trapping of electron holes on iron ions. The effect of hole trapping was reported by Merkle et al. for another representative of the triple-conducting oxide family containing iron: Fe-doped SrTiO3.18 Another possible cause of decreasing electronic conductivity in BaCe0.6Zr0.2Y0.2−xFexO3−δ could be the clustering of defects,41 which may also hinder the movement of electron holes. The transference number of holes of the analyzed compounds at 600 °C and 800 °C ranges from 0.60 to 0.72, with no clear trend observed for the temperature nor iron content in the materials. However, the transference number of holes of BCZY622 at 800 °C is higher than that of the BCZYFe series, which indicates the trapping effect of the iron ions in the iron-containing materials.
Diffusion and surface exchange studies
Similarly, the surface exchange coefficient, which describes species exchange reactions at the material's surface, proceeds differently in materials with multiple mobile charge carriers. Depending on the transference number of electronic charge carriers, the surface exchange coefficient related to water uptake can manifest itself as either a single value or as two distinct values. The more detailed descriptions of the surface exchange processes regarding the hydration/dehydration and oxidation/reduction in BCZY-related material can be found elsewhere.23
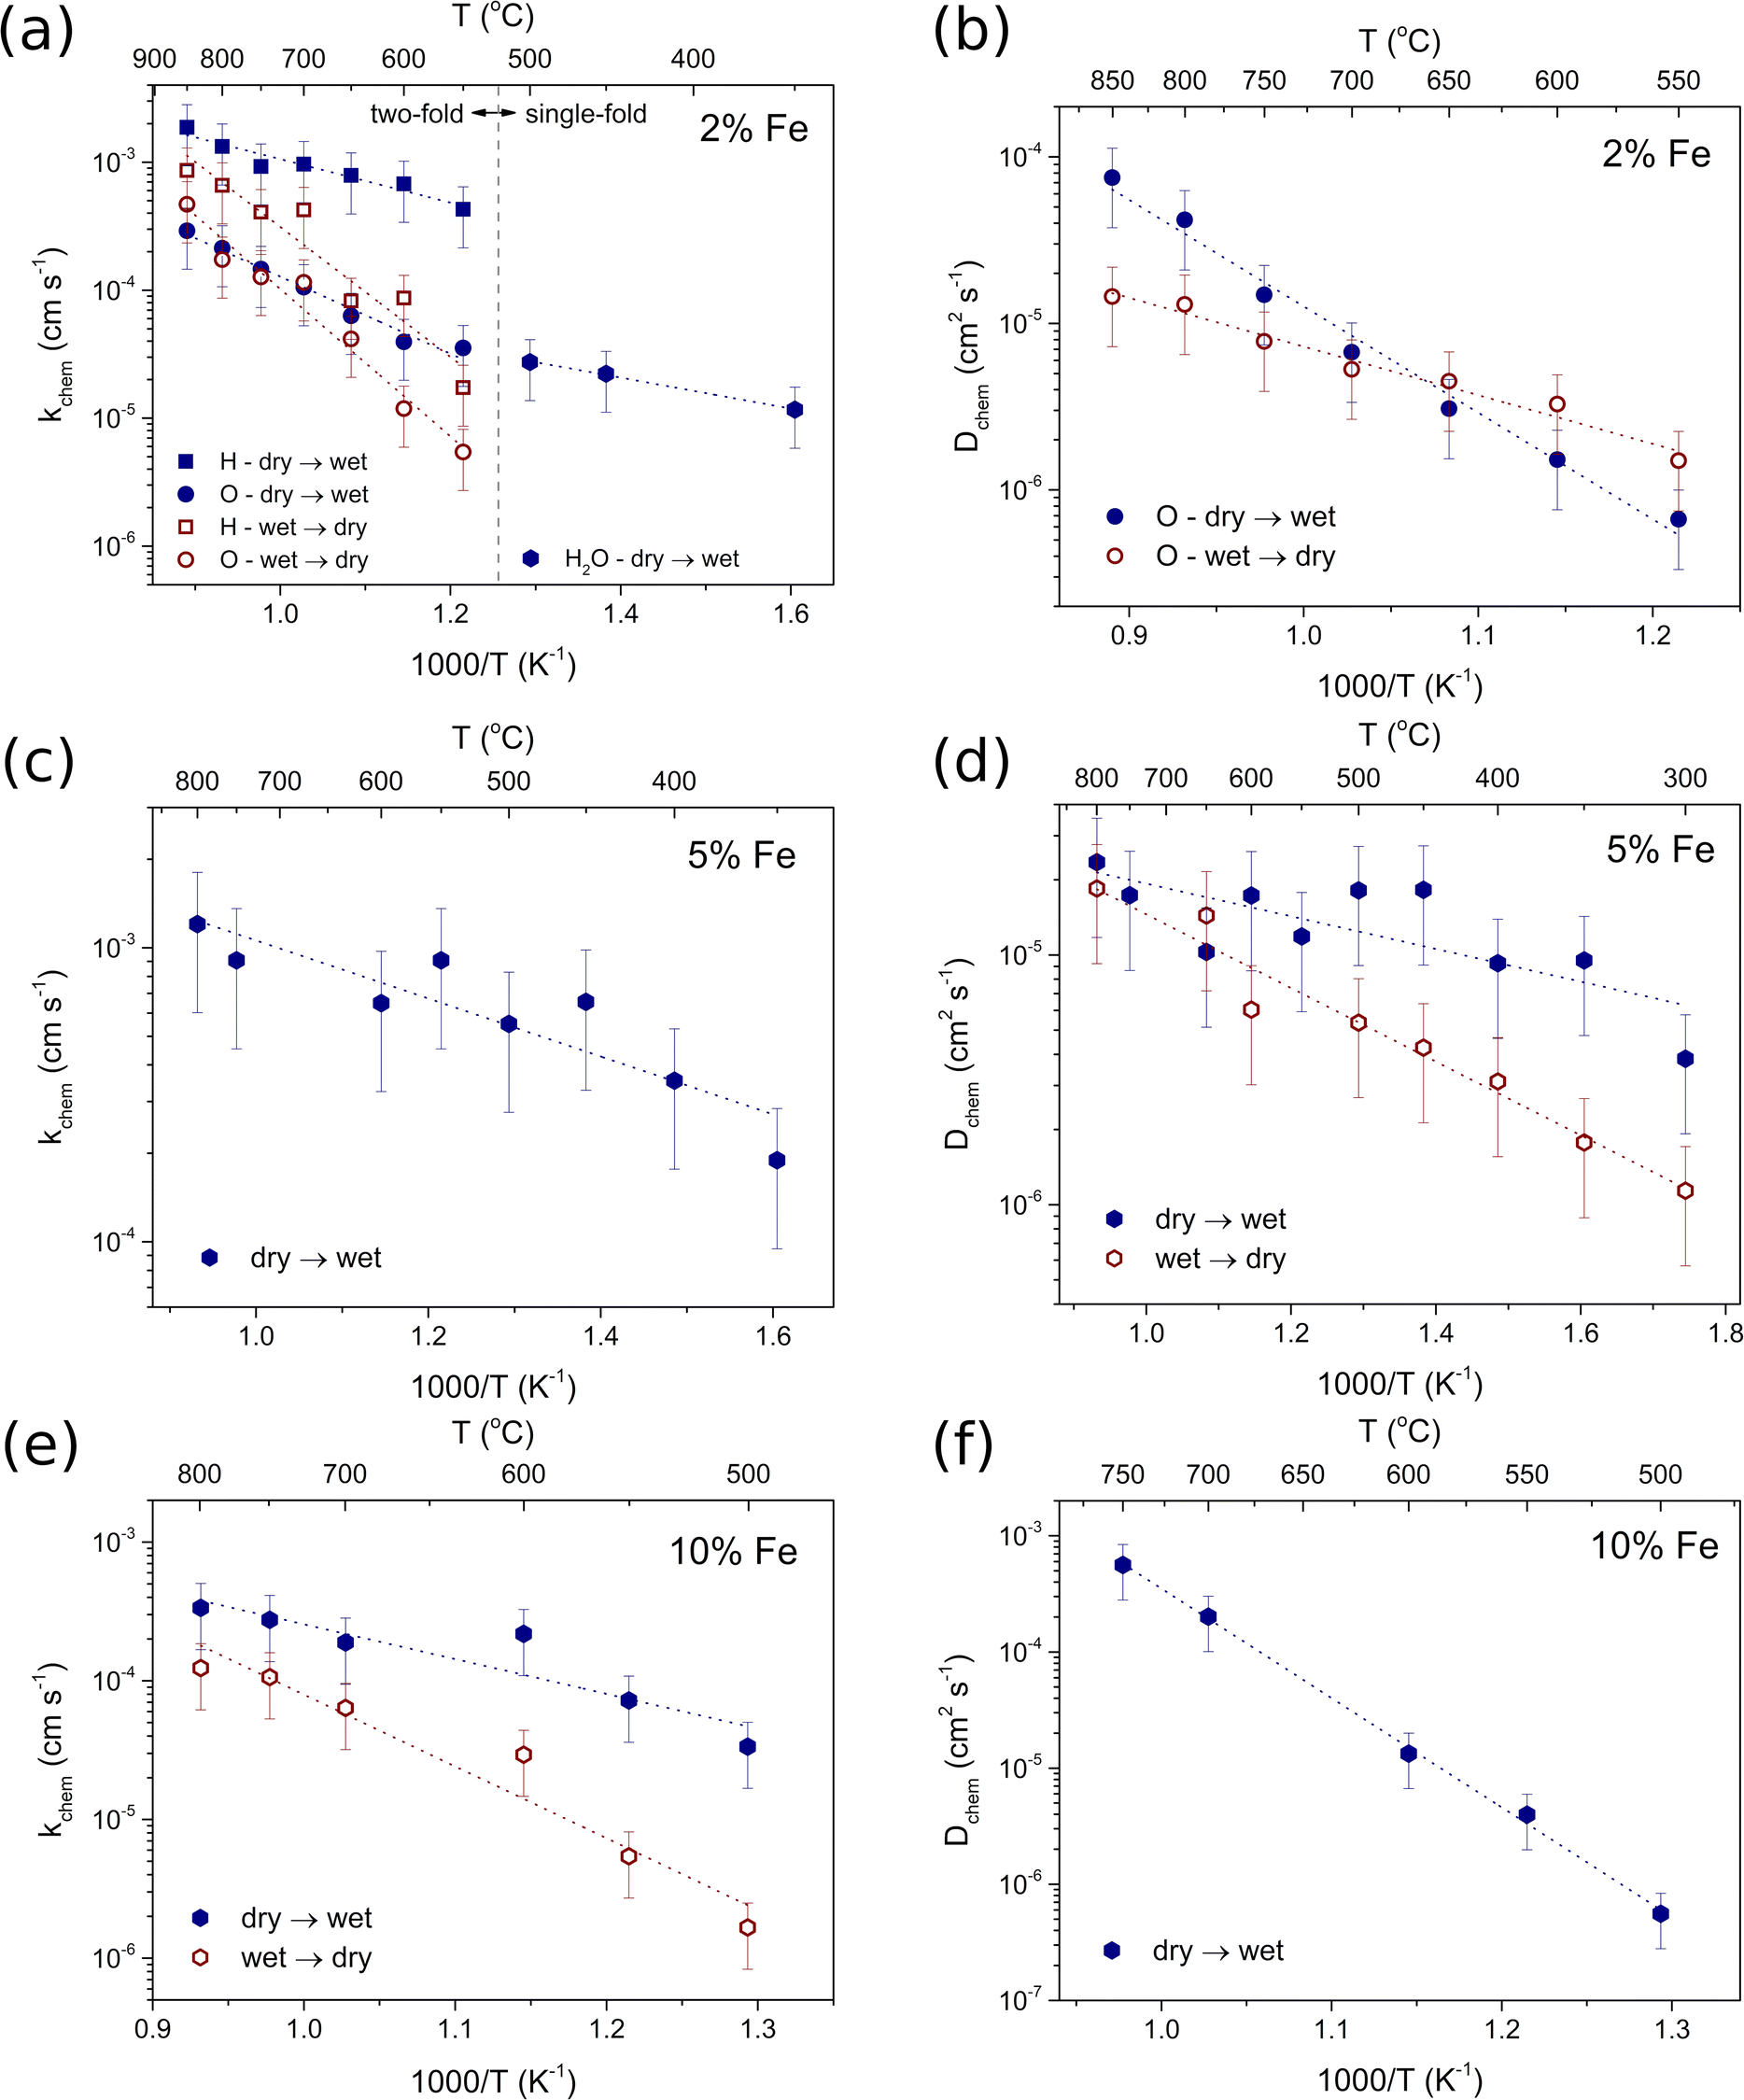
Diffusion studies were conducted using the ECR method in synthetic air (pO2 ≈ 0.2 atm). The representative plots of electrical conductivity relaxation during hydration/dehydration of BaCe0.6Zr0.2Y0.18Fe0.02O3−δ at 800 °C and 500 °C are shown in Fig. 7a and b, respectively. The representative plots for all materials at two temperatures with the corresponding fitting curves are included in the ESI (Fig. S4).† Notably, in the case of BCZYFe2, the water incorporation process exhibited a two-fold non-monotonic behavior in the temperature range of 550–850 °C. This allowed the estimation of separate surface exchange and diffusion coefficients for protons and oxygen ions (Fig. 8a and b). The occurrence of two-fold hydration in this material suggests a significant involvement of mobile electron holes in the process, which facilitates the independent diffusion of protons and oxygen ions. However, below 550 °C, a single-fold behavior of hydration was observed in the same material, implying the occurrence of ambipolar diffusion of protons and oxygen vacancies. The reason for this change in the relaxation behavior may be the reduction in the mobility of electron holes with a decreasing temperature, significantly decreasing the electronic conductivity of the material. In the case of BCZYFe5 and BCZYFe10, hydration occurred as a single-fold process in the entire analyzed temperature range. The surface exchange of water for these materials is presented in Fig. 8c and e, respectively. The material with the lowest iron content BaCe0.6Zr0.2Y0.18Fe0.02O3−δ undergoes two-fold hydration, consistent with its significantly higher electronic partial conductivity. However, the transference number of holes in BCZYFe2 is not substantially higher than that of the other materials, contrary to the prediction of Poetzsch et al. that the nature of hydration (single-fold or two-fold) can be solely determined by the transference number of electron holes in the material.35 We believe it might be connected not only to the transference number of electron holes but also to their concentration.
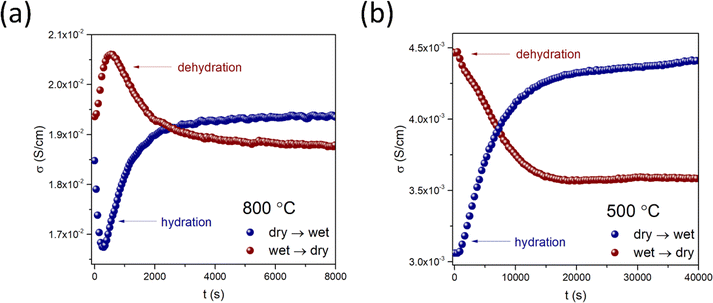 | ||
| Fig. 7 Electrical conductivity relaxation curves recorded during hydration and dehydration of BaCe0.6Zr0.2Y0.18Fe0.02O3−δ at 800 °C (a) and 500 °C (b). | ||
Due to the different nature of hydration in BCZYFe2 at 550–850 °C compared to the other two materials undergoing the single-fold relaxation, a direct comparison of the water uptake kinetics in the BaCe0.6Zr0.2Y0.2−xFexO3−δ series (x = 0.02, 0.05, 0.1) is challenging. The activation energies of surface exchange for these processes vary significantly depending on the material and the direction of the change in the atmosphere. However, the activation energies of kchem corresponding to hydration are lower than those of dehydration in all materials, which suggests that the incorporation of protons is a more favorable reaction than the opposite process in the studied conditions. The activation energy values related to the surface exchange and diffusion of water (or hydrogen and oxygen, separately) during the hydration and dehydration processes in BaCe0.6Zr0.2Y0.2−xFexO3−δ series are shown in Table 5. For BCZYFe2 in the temperature range of 550–850 °C, the activation energies associated with the surface exchange of oxygen were higher ((0.60 ± 0.05) eV and (1.14 ± 0.10) eV for hydration and dehydration, respectively) than the activation energies for the surface exchange of hydrogen ((0.34 ± 0.04) eV and (1.00 ± 0.13) eV for hydration and dehydration, respectively). This indicates that the processes related to oxygen ions in the surface exchange of water require more energy compared to proton-related processes. Additionally, dehydration exhibits significantly higher activation energies compared to hydration, suggesting that even at elevated temperatures (550–850 °C), water tends to react with the material's surface, and the incorporated protons do not easily leave the structure. Interestingly, in the case of the same material in the lower temperature range (350–500 °C) kchem, related to water surface exchange, show similar values to the oxygen exchange at the two-fold temperature region. This observation points to the limiting influence of the slower oxygen processes on the kinetics of water uptake. However, the activation energy of the surface exchange of water corresponding to hydration show similar value to the activation energy related to hydrogen and much lower than that of the oxygen at 550–850 °C. This could be attributed to the enhancing effect of protonic defects presence on the mobility of oxygen ions during water diffusion, as described by Hancke et al. as a drag-effect.42
| Activation energy (eV) | T (°C) | |||||
|---|---|---|---|---|---|---|
| Hydration | Dehydration | |||||
| Hydrogen | Oxygen | Hydrogen | Oxygen | |||
| BCZYFe2 | Surface exchange | 0.34 ± 0.04 | 0.60 ± 0.05 | 1.00 ± 0.13 | 1.14 ± 0.10 | 550–850 |
| 0.24 ± 0.02 | — | 350–500 | ||||
| BCZYFe5 | 0.20 ± 0.04 | — | 350–800 | |||
| BCZYFe10 | 0.50 ± 0.11 | 1.03 ± 0.13 | 500–800 | |||
| BCZYFe2 | Diffusion | — | 1.27 ± 0.07 | — | 0.60 ± 0.05 | 550–850 |
| BCZYFe5 | 0.13 ± 0.04 | 0.29 ± 0.03 | 300–800 | |||
| BCZYFe10 | 1.87 ± 0.05 | — | 500–750 | |||
The activation energy associated with water surface exchange for the hydration of BCZYFe5 was 0.20 ± 0.02 eV, which was much lower than the activation energies for BCZYFe10 corresponding to hydration and dehydration (0.50 ± 0.11 eV and 1.03 ± 0.13 eV, respectively). Moreover, the reaction facilitating water incorporation into the BCZYFe10 leads to a decrease in the total conductivity (see Fig. S4 in the ESI†). The conductivity decrease after the proton incorporation may result from the lower proton mobility than that of oxygen vacancies. This effect might also arise from the reduction in the electronic conductivity due to the filling of the electron holes during water uptake, which could indicate some contribution of hydrogenation in addition to the predominant hydration reaction.32 It could be also related to the change in the oxidation enthalpy caused by the introduction of protonic defects. This may lead to a reduction in the wet atmosphere, as we previously reported.43
The temperature dependence of diffusion coefficients of oxygen for BCZYFe2 and of water in the case of BCZYFe5 and BCZYFe10 during proton incorporation and release is presented in Fig. 8b, d and f, respectively. At the highest temperatures, the diffusion of water reaches the highest level in the sample containing the highest amount of iron. It may be related to the highest activation energy for water diffusion (1.87 ± 0.05 eV). The opposite can be said about BCZYFe5, for which the activation energy of diffusion is the lowest (0.13 ± 0.04 eV and 0.29 ± 0.03 eV for the hydration and dehydration, respectively). Furthermore, the chemical diffusion coefficient for the hydration step is higher than for dehydration. At the highest temperatures, the difference is no longer visible, which indicates that the kinetics of water uptake and release become comparable. The opposite relationship is observed for the diffusion of oxygen during hydration and dehydration in BCZYFe2. Dchem corresponding to hydration becomes higher than for dehydration between 650 and 700 °C, while it is lower below 650 °C. The activation energy of oxygen diffusion during hydration (1.27 ± 0.07 eV) is higher than that for dehydration (0.60 ± 0.05 eV).
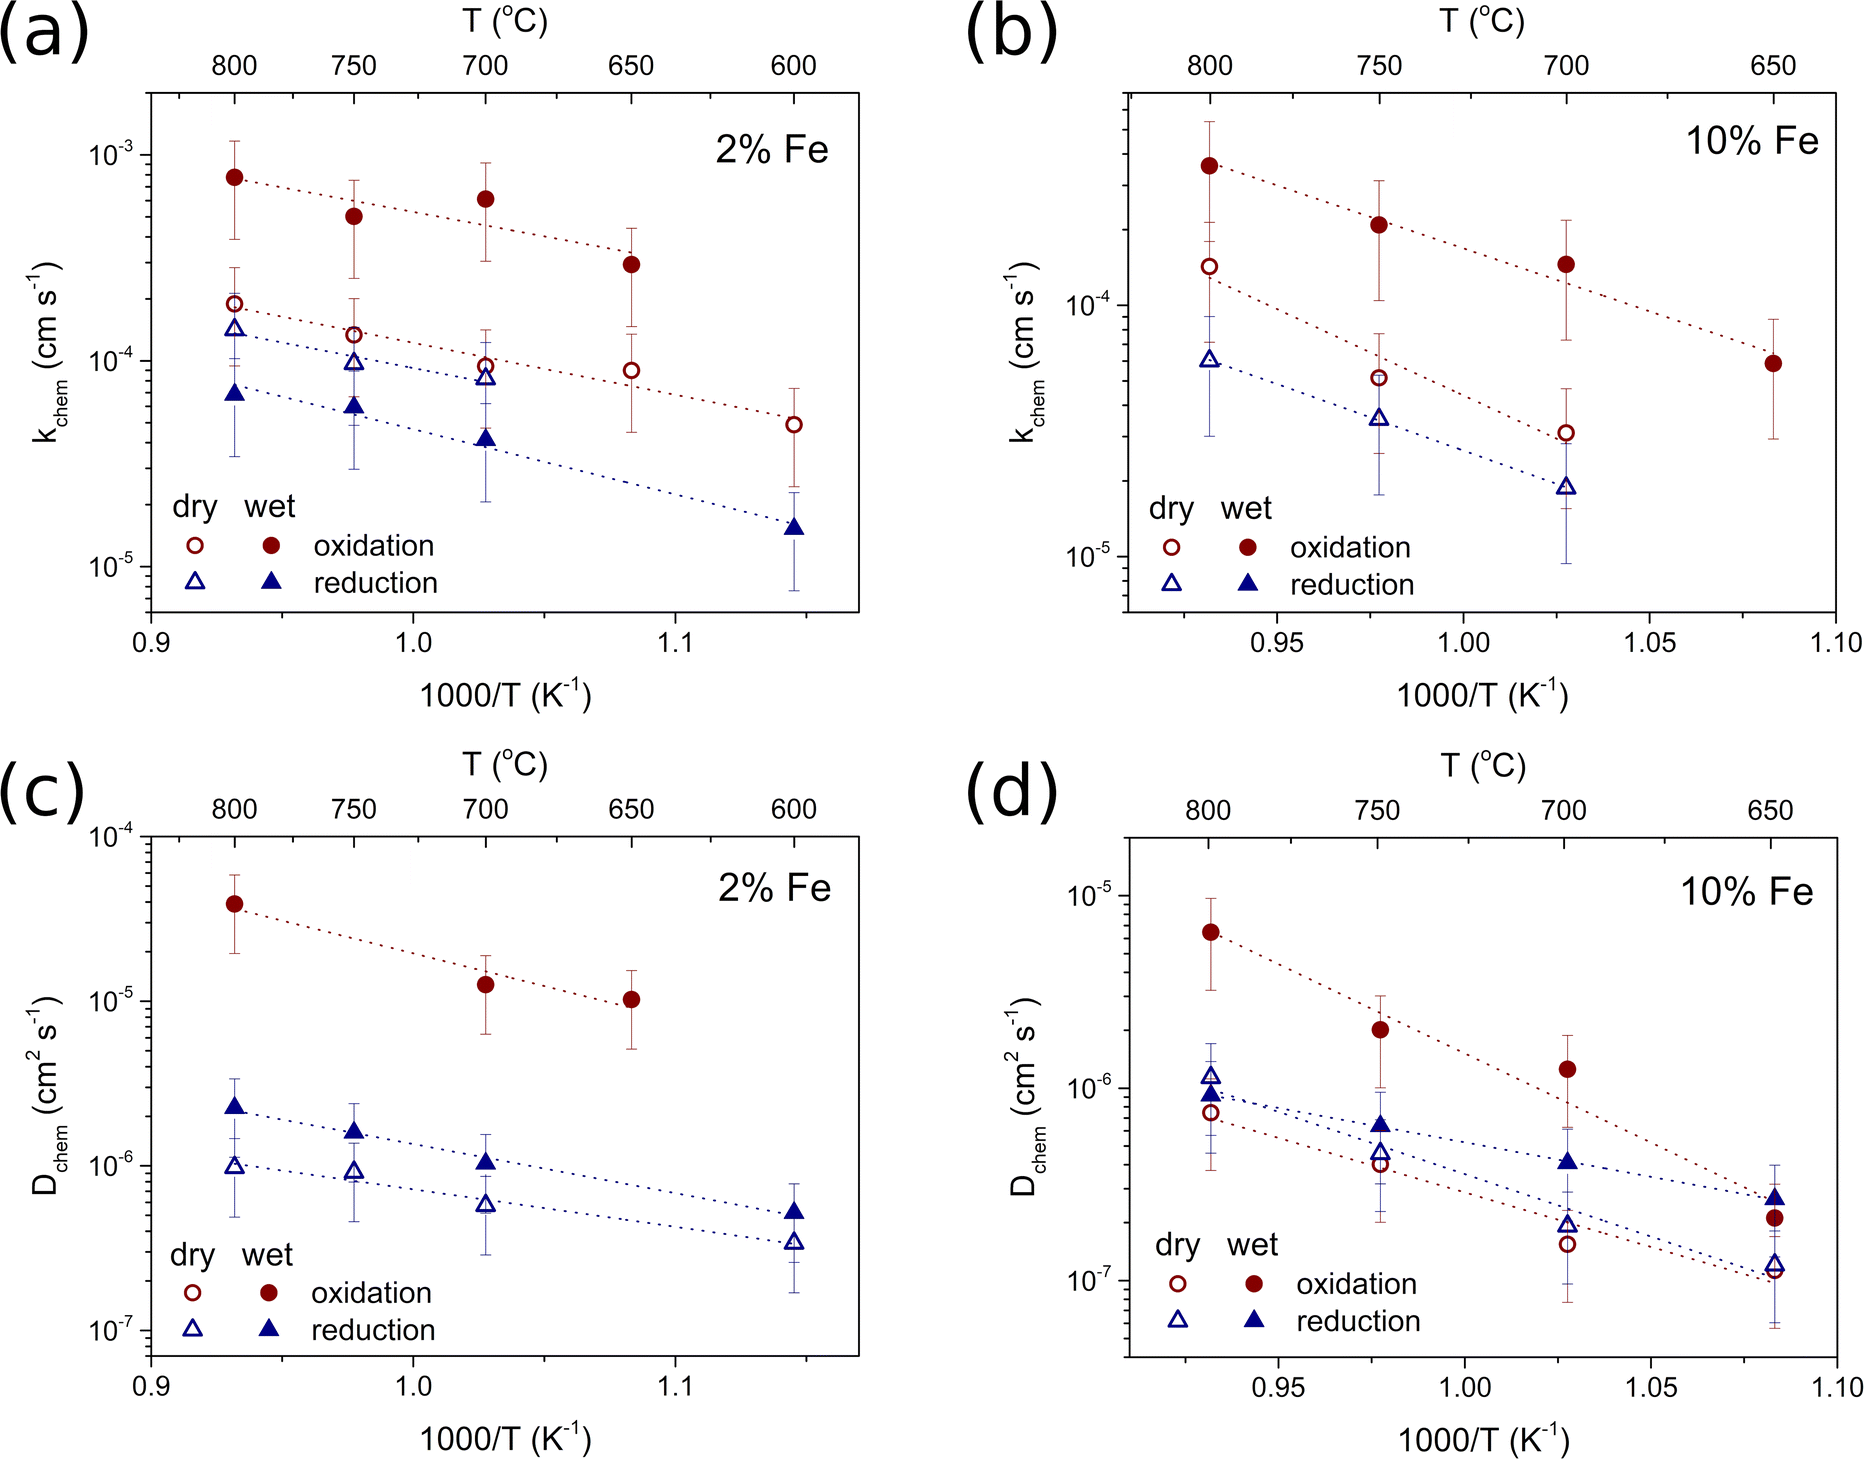
 present on the surface of the oxide. Polfus et al. reported the results of first-principles calculations showing the occurrence of an accumulated positive charge associated with the presence of protons segregated on the surface of barium cerate doped with yttrium.44 The accumulating charge on the surface and the segregation of defects can significantly impact the surface defect chemistry of an oxide. However, considering the enhanced reaction kinetics observed for oxidation and deteriorated kinetics for reduction, it is plausible that the kinetics are not solely governed by the concentration of defects but are predominantly influenced by their mobilities. This indicates an influence of near-surface proton defects on the mobilities of oxygen vacancies.
In the analyzed materials, the oxygen diffusion coefficient in wet conditions was higher compared to the dry conditions in the case of oxidation, while the diffusion coefficient corresponding to reduction was higher. In the case of reduction, the difference was not as pronounced, and in BCZYFe10 Dchem in wet conditions reached the level of Dchem in dry conditions at the highest temperatures.
Table 6 shows the activation energies for oxygen surface exchange and diffusion during the oxidation and reduction steps of BaCe0.6Zr0.2Y0.18Fe0.02O3−δ and BaCe0.6Zr0.2Y0.1Fe0.1O3−δ under dry and wet conditions. The activation energies for surface exchange and diffusion in the case of BCZYFe2 do not differ much, regardless of the pH2O or the direction of pO2 change. For dry oxidation and reduction of BCZYFe10, the activation energy values for diffusion are comparable within the experimental error, while under humid conditions, the activation energy for reduction – (0.71 ± 0.02) eV – is much lower than that for oxidation, which is (1.84 ± 0.27) eV. The activation energies for diffusion in dry and humid oxidation and reduction differ ((1.12 ± 0.17) eV and (1.84 ± 0.27) eV for dry and wet oxidation; and (1.29 ± 0.17) eV and (0.71 ± 0.02) eV for dry and wet reduction, respectively), indicating the role of water vapor in facilitating both the oxidation and reduction process in BCZYFe10.
| Activation energy (eV) | ||||
|---|---|---|---|---|
| Dry | Wet | |||
| BCZYFe2 | Surface exchange | Oxidation | 0.50 ± 0.07 (600–800 °C) | 0.47 ± 0.20 (600–800 °C) |
| Reduction | 0.49 ± 0.13 (700–800 °C) | 0.63 ± 0.07 (600–800 °C) | ||
| BCZYFe10 | Oxidation | 1.36 ± 0.31 (700–800 °C) | 0.99 ± 0.12 (650–800 °C) | |
| Reduction | 1.05 ± 0.02 (700–800 °C) | — | ||
| BCZYFe2 | Diffusion | Oxidation | — | 0.79 ± 0.19 (650–800 °C) |
| Reduction | 0.45 ± 0.06 (600–800 °C) | 0.59 ± 0.04 (600–800 °C) | ||
| BCZYFe10 | Oxidation | 1.12 ± 0.17 (650–800 °C) | 1.84 ± 0.27 (650–800 °C) | |
| Reduction | 1.29 ± 0.17 (650–800 °C) | 0.71 ± 0.02 (650–800 °C) | ||
The activation energies related to surface exchange and diffusion irrespective of the pO2 change direction were significantly higher in the case of BCZYFe10 compared to BCZYFe2. The values of kchem and Dchem were also considerably greater for the BCZYFe2, which agrees with the results presented in Fig. 6 and Table 4, in which the ionic conductivity of materials decreased with the higher amount of Fe in the structure.
Conclusions
In this study, the influence of iron content on the water uptake, defect chemistry, and transport properties of BaCe0.6Zr0.2Y0.2−xFexO3−δ compounds was investigated.The BaCe0.6Zr0.2Y0.2−xFexO3−δ compounds were single-phase pseudo-cubic perovskites. Increasing iron content caused the following physicochemical changes: (1) a decrease in unit cell parameter; (2) a linear decrease in oxygen vacancy concentration (δ); and (3) an increase in the average B-cation electronegativity accompanied with an increase in the difference between the A and B cations electronegativities.
All BaCe0.6Zr0.2Y0.2−xFexO3−δ compounds exhibited water uptake which was interpreted as the hydration process. The proton concentration decreased with increasing iron content. The relationship between the proton concentration and oxygen vacancy concentration was found to be nonlinear. It was proposed that both the partial delocalization of electron hole from iron towards oxygen ion and iron contribution to the difference between the A and B cations electronegativities, apart from Fe influence on oxygen vacancy concentration, affect the proton concentration.
All compositions exhibited p-type, oxygen-ionic conductivity, and, in humid air, proton conductivity. Total electrical conductivity and partial conductivities decreased with increasing iron content. BaCe0.6Zr0.2Y0.18Fe0.02O3−δ and BaCe0.6Zr0.2Y0.15Fe0.05O3−δ showed a significant proton conductivity in wet air, whereas that of BaCe0.6Zr0.2Y0.1Fe0.1O3−δ was very low. Iron substituting yttrium in the B sublattice decreased the electronic partial conductivity, indicating the possible trapping of electron holes on iron ions.
Two-fold relaxation kinetics was observed in the case of BaCe0.6Zr0.2Y0.18Fe0.02O3−δ at higher temperatures than 550 °C, whereas single-fold monotonic relaxation was exhibited in this material below 550 °C. In the case of BaCe0.6Zr0.2Y0.15Fe0.05O3−δ and BaCe0.6Zr0.2Y0.1Fe0.1O3−δ, a single-fold relaxation process was observed in the entire studied temperature range.
The investigation of the influence of water vapor on the oxidation and reduction kinetics in BaCe0.6Zr0.2Y0.18Fe0.02O3−δ and BaCe0.6Zr0.2Y0.1Fe0.1O3−δ allowed for the observation of the significant increase in the surface exchange and diffusion coefficient of oxygen under wet conditions for the oxidation, suggesting that water influences the kinetics of surface electrochemical reactions as well as the diffusion in the bulk of the materials.
Author contributions
Jagoda Budnik: investigation, visualisation, funding acquisition, formal analysis, project administration, writing – original draft. Aleksandra Mielewczyk-Gryń: investigation, writing – review & editing. Maria Gazda: conceptualization, resources, supervision, writing – review & editing. Tadeusz Miruszewski: conceptualization, project administration, writing – original draft.Conflicts of interest
There are no conflicts to declare.Acknowledgements
This research was supported by the National Science Centre Poland under grant number 2021/41/N/ST5/03437.Notes and references
- J. Kim, S. Sengodan, G. Kwon, D. Ding, J. Shin, M. Liu and G. Kim, ChemSusChem, 2014, 7, 2811–2815 CrossRef CAS PubMed.
- C. Duan, J. Tong, M. Shang, S. Nikodemski, M. Sanders, S. Ricote, A. Almansoori and R. O'Hayre, Science, 2015, 349, 1321–1326 CrossRef CAS PubMed.
- H. Ding, W. Wu, C. Jiang, Y. Ding, W. Bian, B. Hu, P. Singh, C. J. Orme, L. Wang, Y. Zhang and D. Ding, Nat. Commun., 2020, 11, 1–11 CrossRef.
- M. Papac, V. Stevanović, A. Zakutayev and R. O'Hayre, Nat. Mater., 2021, 20, 301–313 CrossRef CAS PubMed.
- R. Zohourian, R. Merkle, G. Raimondi and J. Maier, Adv. Funct. Mater., 2018, 28, 1–10 CrossRef.
- W. Munch, K.-D. Kreuer, G. Seifert and J. Maier, Solid State Ionics, 2000, 183–189 CrossRef CAS.
- G. Raimondi, F. Giannici, A. Longo, R. Merkle, A. Chiara, M. F. Hoedl, A. Martorana and J. Maier, Chem. Mater., 2020, 32, 8502–8511 CrossRef CAS.
- G. Raimondi, A. Longo, F. Giannici, R. Merkle, M. F. Hoedl, A. Chiara, C. J. Sahle and J. Maier, J. Mater. Chem. A, 2022, 10, 8866–8876 RSC.
- K. Bae, D. H. Kim, H. J. Choi, J. W. Son and J. H. Shim, Adv. Energy Mater., 2018, 8, 1–4 Search PubMed.
- D. Han, X. Liu, T. S. Bjørheim and T. Uda, Adv. Energy Mater., 2021, 11, 1–11 Search PubMed.
- Y. Okuyama, N. Ebihara, K. Okuyama and Y. Mizutani, ECS Meeting Abstracts, 2015, MA2015-03, p. 364 Search PubMed.
- J. Melnik, J. Luo, K. T. Chuang and A. R. Sanger, Open Fuels Energy Sci. J., 2008, 1, 7–10 CAS.
- T. Shimura, H. Tanaka, H. Matsumoto and T. Yogo, Solid State Ionics, 2005, 176, 2945–2950 CrossRef CAS.
- H. Matsumoto, T. Shimura, T. Higuchi, H. Tanaka, K. Katahira, T. Otake, T. Kudo, K. Yashiro, A. Kaimai, T. Kawada and J. Mizusaki, J. Electrochem. Soc., 2005, 152, A488 CrossRef CAS.
- D. Poetzsch, R. Merkle and J. Maier, Adv. Funct. Mater., 2015, 25, 1542–1557 CrossRef CAS.
- K. D. Kreuer, T. Dippel, Y. M. Baikov and J. Maier, Solid State Ionics, 1996, 86–88, 613–620 CrossRef CAS.
- H. I. Yoo, J. Y. Yoon, J. S. Ha and C. E. Lee, Phys. Chem. Chem. Phys., 2008, 10, 974–982 RSC.
- R. Merkle, W. Sitte and J. Maier, Solid State Ionics, 2020, 347, 115174 CrossRef CAS.
- A. Falkenstein, R. A. De Souza, W. A. Meulenberg and M. Martin, Phys. Chem. Chem. Phys., 2020, 22, 25032–25041 RSC.
- A. Seong, J. Kim, D. Jeong, S. Sengodan, M. Liu, S. Choi and G. Kim, Advanced Science, 2021, 8, 1–6 Search PubMed.
- E. Bucher and W. Sitte, Solid State Ionics, 2011, 192, 480–482 CrossRef CAS.
- C. Solís, S. Escolastico, R. Haugsrud and J. M. Serra, J. Phys. Chem. C, 2011, 115, 11124–11131 CrossRef.
- J. Budnik, A. Mielewczyk-Gryń, M. Gazda and T. Miruszewski, J. Mater. Chem. A, 2023, 11, 13389–13398 RSC.
- I. Levin, T. Amos, S. Bell, L. Farber, R. Roth, T. Vanderah and B. Toby, J. Solid State Chem., 2003, 175, 170–181 CrossRef CAS.
- H. Abernathy, T. Yang, J. Liu and B. Na, NETL Electrical Conductivity Relaxation(ECR) Analysis Tool, United States: N. p., 2021, DOI:10.18141/1762415.
- T. Miruszewski, K. Dzierzgowski, P. Winiarz, S. Wachowski, A. Mielewczyk-Gryń and M. Gazda, J. Mater. Chem. A, 2022, 10, 7218–7227 RSC.
- M. Oishi, K. Yashiro, K. Sato, J. Mizusaki, N. Kitamura, K. Amezawa, T. Kawada and Y. Uchimoto, Solid State Ionics, 2008, 179, 529–535 CrossRef CAS.
- Q. Chen, F. El Gabaly, F. Aksoy Akgul, Z. Liu, B. S. Mun, S. Yamaguchi and A. Braun, Chem. Mater., 2013, 25, 4690–4696 CrossRef CAS.
- V. M. Goldschmidt, Naturwissenschaften, 1926, 14, 477–485 CrossRef CAS.
- R. D. Shannon, Acta Crystallogr., 1976, 751–767 CrossRef CAS.
- B. Mirfakhraei, F. Ramezanipour, S. Paulson, V. Birss and V. Thangadurai, Front. Energy Res., 2014, 2, 1–10 Search PubMed.
- G. Heras-Juaristi, U. Amador, J. Romero De Paz, R. O. Fuentes, A. L. Chinelatto, C. Ritter, D. P. Fagg, D. Pérez-Coll and G. C. Mather, Inorg. Chem., 2018, 57, 15023–15033 CrossRef CAS PubMed.
- G. Heras-Juaristi, U. Amador, R. O. Fuentes, A. L. Chinelatto, J. Romero De Paz, C. Ritter, D. P. Fagg, D. Pérez-Coll and G. C. Mather, J. Mater. Chem. A, 2018, 6, 5324–5334 RSC.
- L. R. Tarutina, G. K. Vdovin, J. G. Lyagaeva and D. A. Medvedev, J. Alloys Compd., 2020, 831, 1–11 CrossRef.
- D. Poetzsch, R. Merkle and J. Maier, Faraday Discuss., 2015, 182, 129–143 RSC.
- C. Duan, J. Huang, N. Sullivan and R. O'Hayre, Appl. Phys. Rev., 2020, 7, 1–40 Search PubMed.
- R. Zohourian, R. Merkle, G. Raimondi and J. Maier, Adv. Funct. Mater., 2018, 28, 1–10 CrossRef.
- M. Huse, T. Norby and R. Haugsrud, Int. J. Hydrogen Energy, 2012, 37, 8004–8016 CrossRef CAS.
- I. Oikawa and H. Takamura, Chem. Mater., 2015, 27, 6660–6667 CrossRef CAS.
- C. R. Song and H. I. Yoo, J. Am. Ceram. Soc., 2000, 83, 773–779 CrossRef CAS.
- J. Kai, R. Yufang and S. U. Qiang, Sci. China, Ser. B: Chem., 1999, 42, 298–304 CrossRef.
- R. Hancke, Z. Li and R. Haugsrud, J. Electrochem. Soc., 2013, 160, F757–F763 CrossRef CAS.
- T. Miruszewski, K. Dzierzgowski, P. Winiarz, D. Jaworski, K. Wiciak-Pawłowska, W. Skubida, S. Wachowski, A. Mielewczyk-Gryń and M. Gazda, RSC Adv., 2021, 11, 19570–19578 RSC.
- J. M. Polfus, T. S. Bjørheim, T. Norby and R. Bredesen, J. Mater. Chem. A, 2016, 4, 7437–7444 RSC.
Footnote |
| † Electronic supplementary information (ESI) available. See DOI: https://doi.org/10.1039/d3ta06917f |
| This journal is © The Royal Society of Chemistry 2024 |


