Sorption enhanced CO2 hydrogenation to formic acid over CuZn-MOF derived catalysts†
Jyotishman
Kaishyop
 ab,
Jyoti
Gahtori
a,
Suman
Dalakoti
 bc,
Md. Jahiruddin
Gazi
ab,
Tuhin Suvra
Khan
bd and
Ankur
Bordoloi
 *ab
*ab
aNanocatalysis Area, Light Stock Processing Division, CSIR-Indian Institute of Petroleum, Dehradun 248005, Uttarakhand, India
bAcademy of Scientific and Innovative Research (AcSIR), Ghaziabad, 201002, India
cSeparation Processes Division, CSIR-Indian Institute of Petroleum, Dehradun 248005, Uttarakhand, India
dClimate Change and Data Science Area, Director's Division, CSIR-Indian Institute of Petroleum, Dehradun 248005, Uttarakhand, India
First published on 6th March 2024
Abstract
A series of Cu–Zn@CNx catalysts incorporated with platinum group metal (PGM) elements, such as Ru, Pd, Pt, and Ir were synthesised via the hard template approach, where a metal–organic framework (MOF) is utilised as a hard template. The developed materials were capitalised for sorption-enhanced synthesis of formic acid from CO2. The pyrolysis process has proven effective in stabilising the metallic Cu in a carbon–nitrogen matrix environment. Moreover, the diverse PGM group metal promoters facilitate enhanced CO2 adsorption behaviour on the catalyst surface. Structure–activity relationship, catalyst lifetime and deactivation are established through rigorous analysis of fresh and spent catalyst materials with various analytical techniques, including XRD, Raman, BET, SEM, XPS, chemisorption, physisorption and HRTEM. The utilisation of water as a reaction medium has been found to alleviate thermodynamic constraints, thereby promoting enhanced formic acid formation. Furthermore, the promotional effect of doped metals is elucidated by utilising density functional theory (DFT) calculations and revealed that Ru–CZ exhibited the highest CO2 adsorption energy, concomitant with the experimental findings, wherein the Ru–CZ catalyst displayed an outstanding CO2 conversion rate of 12.91% with an impressive TON of 11![[thin space (1/6-em)]](https://www.rsc.org/images/entities/char_2009.gif) 435.
435.
Introduction
The profound impact of the industrial revolution and the extensive utilization of fossil fuels has resulted in a substantial release of anthropogenic CO2 into the Earth's atmosphere. Consequently, the atmospheric CO2 concentration surged to 416 ppm in 2021, marking an approximate 1.45-fold increase compared to the levels recorded in 1850.1,2 CO2 emission is a critical environmental issue that poses significant challenges to global sustainability. The quest for sustainable solutions to address escalating carbon dioxide (CO2) levels in the atmosphere has spurred significant research efforts worldwide. Carbon capture, utilization, and storage (CCUS) represents a pivotal strategy in the global effort to combat climate change and mitigate the environmental impacts of CO2 emissions. The IEA estimates that around 20% of anthropogenic CO2 emissions can be curtailed through the application of CCUS.3 The initial phase of CCUS, CO2 capture, focuses on concentrating CO2 from the exhaust gases of various sources, such as power plants and other industries such as cement and steel.4 Notably, CO2 capture is the most energy-intensive of these phases and constitutes roughly 60–70% of the total CCS costs.5 In contrast, indirect CO2 utilisation, often referred to as CO2 conversion, involves the transformation of CO2 into value-added chemicals and fuels via diverse chemical processes, which is more attractive than direct CO2 utilisation such as enhanced oil recovery (EOR), as it offers the potential to simultaneously address environmental concerns and the energy crisis.6 Currently, extensive research endeavours have been dedicated to the field of CO2 mitigation,7–9 with a special focus on thermocatalysis,10–12 photocatalysis,13–15 electrocatalysis,16,17 emerging CO2 catalytic conversion techniques such as thermo-photocatalysis and the application of external magnetic fields.18,19 Although value-added chemicals and fuels, such as CH4, syngas, and methanol, can be produced through carbon capture and conversion (CCC), the high cost associated with CO2 compression and transportation remains a significant challenge for the CCC process. To make the CCC process more economically viable and realise its application on a large scale, novel sorption-enhanced CO2 utilisation is proposed and has been a hot topic in current research.20–22 Thus far, various kinds of relevant processes have been developed by combinations of different CO2 sorption and CO2 conversion approaches, such as the ionic liquids-based hybrid process,23 the solvent-based CO2 capture and electrolysis process,24 high-temperature electrochemistry-based CO2 transport membranes,25 the hybrid CO2 capture and photocatalytic conversion process by using a novel hybrid sorbent/photocatalyst,26 and the hybrid CO2 sorption (based on a solid CO2 sorbent) and thermocatalytic conversion process.21Formic acid has emerged as a potential candidate for hydrogen storage due to its high hydrogen content (4.4 wt%) and its ability to release hydrogen upon decomposition. This makes it an attractive medium for storing and delivering hydrogen as an energy carrier, particularly for fuel cell applications.27 The reversible reaction between formic acid and hydrogen allows for the controlled release of hydrogen when needed, making it a promising alternative to conventional hydrogen storage methods such as compressed gas or liquid hydrogen, which often face challenges related to storage and transportation.28 Limited research efforts have been directed towards heterogeneous catalysis processes aimed at the direct hydrogenation of CO2 into formic acid, essentially due to unfavorable thermodynamics.29 Converting two gaseous substrates into one liquid product typically involves a phase change, which is inherently unfavorable entropy. To overcome this thermodynamic barrier, two prevailing strategies have usually been deployed: (i) utilization of base additives (such as amines, hydroxides, and (bi)carbonates) and (ii) careful choice of a reaction medium (such as water, alcohols, DMSO, and ionic liquids). These approaches have demonstrated fascinating turnover numbers (TONs) in the CO2 hydrogenation to formic acid process with various homogeneous catalysts. However, the practical adoption of such molecular complexes faces limitations linked to the intricate separation, reusability and mechanical losses of metal complexes, as well as the utilisation of expensive and air-sensitive ligands.27,29,30
To delimit these hurdles, significant research efforts have been focused on heterogeneous catalysts, which offer advantages in terms of ease of separation, handling, and recyclability. These attributes are particularly favorable for continuous operation, inspiring substantial research efforts to realize the heterogeneous catalytic synthesis of formic acid through CO2 hydrogenation. Cu–ZnO catalysts are well-known non-noble-based catalysts for CO2 adsorption, activation and further efficient hydrogenation to methanol.31–34 However, this catalyst can also be employed to synthesise formic acid as it is an essential key intermediate for the process of CO2 hydrogenation to methanol.29 In a study conducted by Chiang et al. in 2018, Cu/ZnO/Al2O3 was employed for the direct conversion of CO2 to formic acid, resulting in a 13.1% CO2 conversion, 59.6% selectivity for formic acid, and a TON of 6.17.35 However, the catalytic performance of this system is considerably lower compared to platinum group metal (PGM)-based catalysts reported previously as the activity of the Cu/ZnO/Al2O3 catalyst system mainly relies on the number of active sites and the dispersion of Cu/Zn species.36,37 A key challenge associated with the Cu/ZnO/Al2O3 system is the hydrophilic nature of Al2O3, which absorbs water produced during the reaction, leading to the agglomeration of Cu particles and consequently leading to rapid catalyst deactivation.38,39 Therefore, a new approach needs to be adopted for synthesising the Cu–Zn-based catalyst system considering the aforementioned limitations and enhancing CO2 hydrogenation to formic acid with an activity proximate to that of noble metals.
Metal–organic frameworks (MOFs) are a significant group of materials recognized for their remarkable surface area, high thermal stability, and uniform porosity.40–42 These properties make them highly valuable in absorbing gas molecules, including CO2, CH4, C3H8, C3H6,etc. These materials are also well known for developing appropriate catalyst systems as they provide a porous support for metal nanoparticles (NPs) or clusters for CO2 hydrogenation reactions.43,44 However, the majority of MOFs exhibit instability in aqueous environments due to weak metal–ligand bonding.45 A potential solution to this challenge involves the pyrolysis of MOFs, resulting in the formation of porous carbon materials with high surface area and well-defined structures suitable for capitalisation in aqueous phase reactions.46 Additionally, during MOF pyrolysis, metal ions present in the MOF can be reduced, leading to the formation of metal nanoparticles that function as active sites for catalytic reactions. Moreover, the carbon matrix developed during MOF pyrolysis acts as an encapsulating agent for the metal nanoparticles, averts their aggregation, and confers stability upon the active sites. Previously, the feasibility of producing Cu@C through the pyrolysis of Cu-BTC was successfully demonstrated by Won Cheol Yoo and coworkers in 2015.47
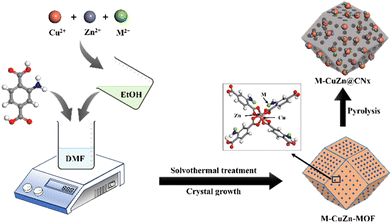
In this study, a series of catalysts, M–CZ@CNx (M = Ru, Pd, Pt, Ir) were synthesised through the formation of a metal–organic framework by the solvothermal method, followed by pyrolysis at high temperature, which was highly active for both the adsorption of CO2 and further conversion to formic acid efficiently. A comprehensive comparison was carried out by introducing active metals for CO2 hydrogenation to formic acid, including Ru, Pd, Pt and Ir. Among all the catalysts, Ru–CZ achieved remarkable catalytic activity with a maximum CO2 conversion of 12.91% and a TON of 11![[thin space (1/6-em)]](https://www.rsc.org/images/entities/char_2009.gif) 435 for formic acid production under the optimized reaction conditions. Additionally, DFT calculations were applied to understand role of noble metals on CO2 adsorption and conversion to formic acid by the CuZn@CNx material. Significantly, the Ru–CZ/CNx catalyst exhibited exceptional resilience and maintained consistent performance throughout continuous recycling tests.
435 for formic acid production under the optimized reaction conditions. Additionally, DFT calculations were applied to understand role of noble metals on CO2 adsorption and conversion to formic acid by the CuZn@CNx material. Significantly, the Ru–CZ/CNx catalyst exhibited exceptional resilience and maintained consistent performance throughout continuous recycling tests.
Experimental
Methods
Raman spectroscopy analysis was carried out using a Horiba LabRAM HR Evolution Raman spectrometer. The synapse detector of the instrument was thermoelectrically cooled to −75 °C before analysis. The instrument was calibrated using a silicon wafer, and a thin layer of the sample on a glass slide was placed on the stage and focused using a 50× lens. The sample was excited using a 532 nm laser with a neutral density filter, and the spectrum range was scanned from 50 to 4000 cm−1 with 10 s acquisition and 2-time accumulation.
N2 adsorption–desorption isotherms were obtained using a Micromeritics ASAP 2020 instrument at a temperature of 77 K. This analysis aimed to investigate the pore structure of the catalysts that were synthesized. Before conducting the measurements, each sample underwent a degassing process in a vacuum at 393 K for a duration of 6 hours.
The CO2 gas adsorption equilibrium isotherms were obtained using a Micromeritics Tristar II instrument at a temperature of 298 K and a pressure of 1 bar. Prior to the analysis, the samples were subjected to activation at 120 °C for 12 hours while concurrently being evacuated using a vacuum pump.
X-ray photoelectron spectroscopy (XPS) examination was conducted using a Thermo Scientific NEXSA XPS spectrometer that featured a monochromatic AlKα X-ray source operating at 15 kV. This analysis was carried out under conditions of an ultrahigh vacuum, ranging from 10−8 to 10−9 mbar. The reference for calibrating the binding energies of individual elements was established by utilizing the binding energy peak of C 1s at 284.8 eV.
Transmission electron microscope (TEM) analysis was conducted using a JEOL JEM-2100 instrument. A small amount of solid catalyst was dispersed in ethanol by sonication, and then 2–3 drops were cast on a Cu grid supported by lacey carbon, which was dried in a vacuum desiccator. The filament voltage was set to 160 kV for analysis.
Scanning electron microscope (SEM) images were obtained using a Zeiss Gemini FE-SEM 300 from Carl Zeiss. The SEM images were taken at an accelerating voltage of 10 kV, and the working distance between the specimen and the lower pole piece was around 9.0 to 9.3 mm.
Temperature-programmed desorption (TPD) of CO2 was performed on a Micrometrics® Autochem II 2920 instrument. The ex situ reduced sample was placed in a U-shaped quartz tube over a layer of quartz wool, and TPD was conducted with different gases at specific temperatures and flow rates. Gases were analyzed using a TCD with helium as a reference gas.
The H2 temperature-programmed reduction (H2-TPR) analysis was conducted utilising a Micromeritics Autochem 2020 instrument employing a hydrogen chemisorption technique. Initially, a 50 mg sample underwent reduction using a 5% hydrogen in a nitrogen flow (at a rate of 30 mL min−1) with a temperature ramp reaching 850 °C, and this temperature was held for a duration of 1 hour. Subsequently, the reduced sample was cooled to 40 °C under a stream of nitrogen and subjected to ten discrete pulses of hydrogen of known volumes. The quantity of hydrogen chemisorbed served as the basis for determining the quantity of surface Cu and M (Ru, Pd, Pt, and Ir) present on the catalyst, assuming a one-to-one ratio of adsorbed hydrogen atoms to active sites. The dispersion of metals (Dm) was calculated employing the subsequent formula.
| Dm = Msurface/Mtotal × 100% |
The Mtotal was obtained through ICP-MS analysis carried out on a Thermo Scientific™ iCAP™ RQ instrument.
![[thin space (1/6-em)]](https://www.rsc.org/images/entities/char_2009.gif) :
:![[thin space (1/6-em)]](https://www.rsc.org/images/entities/char_2009.gif) 1, p/p) at ambient temperature. Once the desired reaction temperature was attained, stirring was initiated at a speed of 400 rpm, considering the commencement of the reaction. Following the completion of the reaction, the reactor was depressurized at room temperature and the vessel was opened. The reaction solution was then retrieved through centrifugation.
1, p/p) at ambient temperature. Once the desired reaction temperature was attained, stirring was initiated at a speed of 400 rpm, considering the commencement of the reaction. Following the completion of the reaction, the reactor was depressurized at room temperature and the vessel was opened. The reaction solution was then retrieved through centrifugation.
To analyze the gaseous products, an online GC system (Agilent 7890B) in conjunction with the reactor was utilized. The gases H2, CO2, N2, CH4, CO, and C2–C3 were separated using a Molsieve 5A column and then subjected to analysis with a thermal conductivity detector (TCD). Furthermore, the remaining gaseous C4 hydrocarbons were separated using an HP-PONA column and subsequently analyzed utilizing a flame ionization detector (FID).
The carbon balance of each reaction was computed using the atom balance technique and was observed to fall within the range of 94–98%. The assessment of catalytic performance, encompassing CO2 conversion, HCOOH selectivity, and TON, was carried out employing the formulae provided by the Microsoft Excel (2021) software.
 | (1) |
 | (2) |
 | (3) |
The Cu (111) surfaces were modelled using a three-layer surface slab, and the surface of the catalyst ZnO/Cu (111) was developed through the attachment of a Zn6O7 nanocluster onto the Cu (111) surface. A vacuum of 25 Å was employed in the z-direction for all surface slabs. The M–ZnO/Cu (111) (M = Ru, Pd, Pt, and Ir) surface was obtained by replacing one Cu atom of the Cu (111) surface with the ‘M’ atoms. In the process of DFT geometry optimization and transition state calculations, the lower two layers of the surface slabs were maintained in a fixed position, while the upper layer, along with the ZnO and adsorbates, were permitted to undergo relaxation. The binding energy (BE) of the adsorbate on the surfaces of ZnO/Cu (111) and M–ZnO/Cu (111) was determined using the following formula:
| BE = Esurface+ads − (Esurface + Eads,gas) | (4) |
The reaction energies (Ereaction) of elementary reaction steps were calculated as the difference between the final and initial state energies,
| Ereaction = EIS − EFS | (5) |
The activation barrier (Ea) of elementary reaction steps was calculated as the energy difference between the TS and initial state,
| Ea = ETS − EIS | (6) |
Results and discussion
Physical and structural properties of catalysts
The powder XRD pattern for the CZ and M–CZ catalysts is obtained and illustrated in Fig. 2(a). In all the freshly prepared catalysts, the diffraction lines of pure metallic copper are prominently observed. The characteristic peaks of metallic copper are observed at 2θ angles of 43.8°, 50.9°, and 74.4°, which are attributed to the (111), (200), and (220) planes, respectively (indexed as per JCPDS Card No. 003-1018). Significantly, the XRD pattern does not reveal distinct peaks associated with Zn species. This absence can be attributed to the substantial evaporation of the Zn element during the high-temperature carbonization process, owing to its low boiling point (905 °C).51 As a result, only a small amount of Zn remains, leading to undetectable diffraction intensity in the XRD analysis. The characteristic diffraction peaks for the Ru, Pd, Pt and Ir phases for respective catalysts were not visible in the diffractograms of catalysts, possibly owing to the low loading of these metals.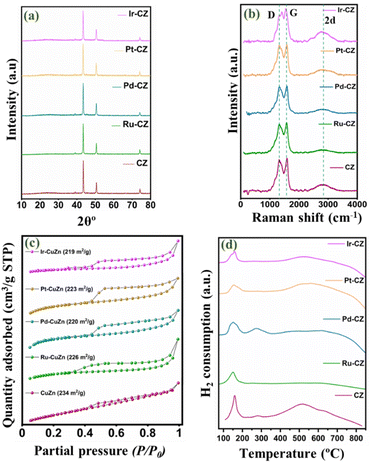 | ||
| Fig. 2 (a) XRD pattern, (b) Raman spectrum, (c) N2 physisorption isotherm and (d) TPR profile of CZ, Ru–CZ, Pd–CZ, Pt–CZ and Ir–CZ. | ||
Fig. 2(b) presents the Raman spectra of CZ and M–CZ, featuring three distinct peaks at 1332, 1596, and 2915 cm−1. The broad Raman peaks at 1596 cm−1, referred to as the G-band, correspond to the Raman-active E2g mode. This mode arises from the vibration generated during the movement in opposite directions of two neighbouring sp2-bonded carbon atoms in a single-crystal graphite sheet. The D band at around 1332 cm−1 indicates defects in the graphite layer. Another band at 1350 cm−1 (D-band) signifies defects within the carbon textures, indicating the presence of disordered graphitic carbon.52–54 The intensity ratio of both the G and D bands is nearly 1.
The N2 adsorption–desorption isotherm technique was employed to analyse the surface area and pore size distribution of all the catalysts. Fig. 2(c) shows that each catalyst exhibited isotherm type IV with an H4 hysteresis loop, suggesting the presence of sharp mesopores dominating the catalyst surface within a narrow pore size range of 2 to 5 nm.55 The CZ catalyst demonstrated a BET surface area of 234 m2 g−1, an average pore size of 7.5 nm, and a pore volume of 0.6 cm3 g−1. However, with the incorporation of metals, the surface area decreased and ranged from 219 to 226 m2 g−1, attributable to pore blocking on the catalyst surface. This observation was confirmed by a reduction in pore volume, as presented in Table 1.
| Entry | Catalysts | Surface composition (%) | S BET (m2 g−1) | PD (nm) | PV (cm3 g−1) | D Cu (%) | Particle size of Cu0 (nm) | CO2 desorbed (cm3 per g STP) | |||
|---|---|---|---|---|---|---|---|---|---|---|---|
| Cu | Zn | M | XRD | TEM | |||||||
| a S BET: BET surface area, PD: pore diameter, PV: pore volume, and DCu: dispersion of Cu. | |||||||||||
| 1 | CZ | 5.32 | 0.034 | — | 234 | 7.2 | 1.9 | 37.94 | 6.8 | 6.72 | 0.6347 |
| 2 | Ru–CZ | 5.31 | 0.035 | 0.0049 | 226 | 6.8 | 1.6 | 38.59 | 5.1 | 5.03 | 1.1912 |
| 3 | Pd–CZ | 4.95 | 0.051 | 0.0066 | 220 | 6.4 | 1.3 | 36.93 | 6.2 | 6.11 | 0.9453 |
| 4 | Pt–CZ | 5.14 | 0.038 | 0.0044 | 221 | 6.5 | 1.4 | 35.89 | 6.0 | 5.87 | 0.9511 |
| 5 | Ir–CZ | 5.18 | 0.031 | 0.0047 | 219 | 6.2 | 1.3 | 36.49 | 5.9 | 5.76 | 0.9940 |
H2-TPR was conducted to study the reducibility of the catalysts, and the TPR profiles of CZ and M–CZ catalysts are shown in Fig. 2(d). The profiles of CZ and Pd–CZ showed two peaks below 400 °C, indicating the existence of two reducible species below 400 °C. It is usually believed that the peak at low temperatures corresponds to the reduction of highly dispersed CuO species and CuO strongly interacting with the support, respectively. The existence of CuO species is mainly due to the oxidation of surface Cu particles by air exposure during sample handling, which is further supported by XPS analysis. However, the disappearance of peak-2 in Ru–CZ, Pt–CZ, and Ir–CZ catalysts may be due to the impact of oxidation resistance properties of noble metals, including Ru, Pt and Ir. These noble metals can resist the catalysts or alloys to oxidation by diatomic oxygen in air at temperatures up to 1000 °C. Along with this, the slight shifting of the Peak-1 position to the low-temperature region in the M–CZ catalysts compared to CZ catalysts suggested a highly dispersed Cu species in the M–CZ catalysts reflected in the comparatively smaller particle sizes measured by TEM and XRD than the CZ catalyst.
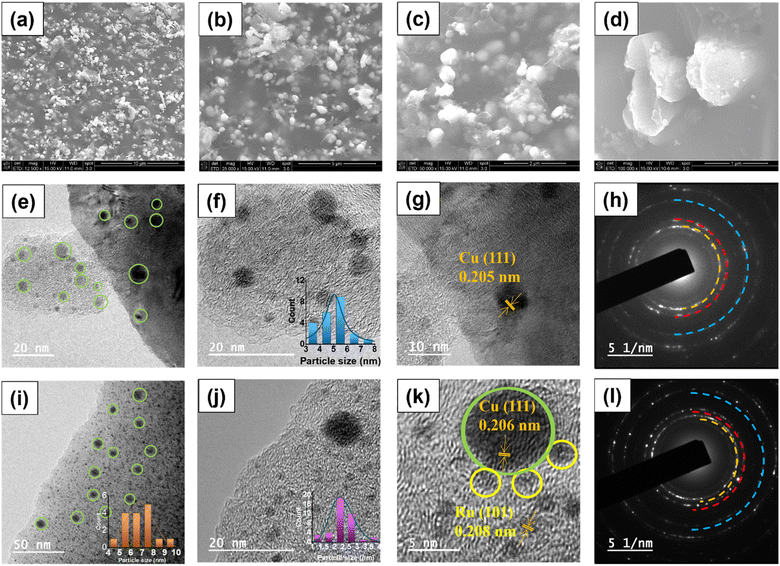
The morphology of the most effective Ru–CZ catalyst was examined using scanning electron microscopy (SEM) and transmission electron microscopy (TEM). SEM analysis was conducted following carbonisation, and the resulting images revealed well-dispersed, spherical Cu particles distributed throughout the CNx matrix, as depicted in Fig. 3(a–d). The EDX analysis confirms the presence of elements, as shown in Fig. S1(a),† which is in line with the surface composition measured by XPS. The elemental mapping suggested good distribution of elements throughout the catalyst surface, as displayed in Fig. S1(b–g).† The TEM images of the CZ catalyst confirmed the spherical shape of the Cu nanoparticles which were well-dispersed over the CNx matrix and can be seen in Fig. 3(e) with an average particle size of 6.8 nm (Fig. 3(f)). In the HRTEM (Fig. 3(g)), a d-spacing value of 0.205 nm indicates the prevalence of the Cu (111) planes, supported by XRD diffractograms, and the selected area electron diffractograms signify their highly crystalline nature (Fig. 3(h)). Fig. 3(i) displays the TEM images of Ru–CZ, where the Ru particles were found to be monodispersed and uniformly distributed on the CNx surface, with an average particle size of 2.3 nm along with the Cu nanoparticles. Interestingly, the Cu nanoparticles were found to possess an enhanced average particle size of 5.1 nm upon the addition of noble metals to the catalyst. High-resolution TEM (HR-TEM) micrographs displayed an interplanar distance of 2.08 nm for the spherical Ru nanoparticles, suggesting the presence of the 101 planes. In addition, the SAED pattern confirms that the catalysts are highly crystalline. Similarly, the TEM images of Pd–CZ, Pt–CZ and Ir–CZ suggested that the Cu nanoparticles possess an average size of 5–6 nm, and the HRTEM images reveal the predominance of the Cu (111) plane, as illustrated in Fig. S2.† The EDX-mapping for all the catalysts is shown in Fig. S3 to S7 (ESI).†
X-ray photoelectron spectroscopy (XPS) was utilized to gain insight into the oxidation states exhibited by the metals within the catalysts. The survey spectrum of CZ and M–CZ catalysts displays well-defined peaks corresponding to Cu, Zn, C, Z, O, and the respective metals (Fig. S8†), affirming the successful incorporation of these elements onto the CNx support. The Cu 2p3/2 high-resolution spectrum was subjected to deconvolution, yielding two distinct peaks centered at 932.7 and 933.6 eV (Fig. 4(a)), which have been attributed to Cu (0) or Cu(I) and Cu(II), respectively.56,57 Further refinement of the Cu LMM peak in Fig. 4(b) provides additional evidence of the primary presence of Cu species in the Cu(I) state on the surface.58 The occurrence of CuO and Cu2O indicated that copper on the surface region is oxidized easily at room temperature.59 The Zn 2p spectrum exhibits peaks at 1021.7 and 1022.0 eV in the Zn 2p3/2 region (Fig. 4(c)), which correspond to ZnO and satellite peaks, across all CZ and M–CZ catalysts.60 The N 1s region was deconvoluted into three components, identified as pyridinic N (398.6 eV), pyrrolic N (400.6 eV), and graphitic-N (403.1 eV),61 as depicted in Fig. 4(d). The high-resolution C 1s spectrum for both CZ and M–CZ catalysts (Fig. 4(e)) was resolved into four distinct peaks positioned at 284.5, 286.3, and 288.0 eV, attributed to C–C, C–O, and C![[double bond, length as m-dash]](https://www.rsc.org/images/entities/char_e001.gif) O carbon species, respectively.60 The fitted XPS spectra of Ru 3d5/2 have demonstrated that Ru occurred in the metallic state (280.1 eV) and +4 oxidation state (280.7 eV),62 as shown in Fig. 4(f). The peak features at 335.6 eV and 337.4 eV in the Pd 3d5/2 region indicated the coexistence of Pd in the 0 and +2 oxidation states, respectively63 (Fig. 4(g)). Similarly, the binding energies of 71.0 eV and 72.9 eV within the Pt 4f7/2 region (Fig. 4(h)) confirm the occurrence of Pt in the metallic and +2 oxidation states, respectively.64 The fitted peaks originating at 61.2 eV and 62.1 eV in the XPS spectra of Ir 4f, shown in Fig. 4(i), are attributed to the Ir oxidation states of 0 and +4, respectively.65
O carbon species, respectively.60 The fitted XPS spectra of Ru 3d5/2 have demonstrated that Ru occurred in the metallic state (280.1 eV) and +4 oxidation state (280.7 eV),62 as shown in Fig. 4(f). The peak features at 335.6 eV and 337.4 eV in the Pd 3d5/2 region indicated the coexistence of Pd in the 0 and +2 oxidation states, respectively63 (Fig. 4(g)). Similarly, the binding energies of 71.0 eV and 72.9 eV within the Pt 4f7/2 region (Fig. 4(h)) confirm the occurrence of Pt in the metallic and +2 oxidation states, respectively.64 The fitted peaks originating at 61.2 eV and 62.1 eV in the XPS spectra of Ir 4f, shown in Fig. 4(i), are attributed to the Ir oxidation states of 0 and +4, respectively.65
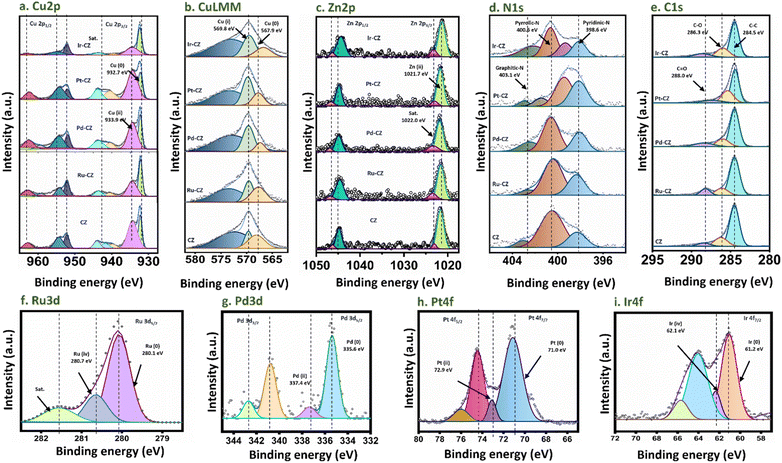 | ||
| Fig. 4 XPS spectra of (a) Cu 2p, (b) Cu LMM, (c) Zn 2p, (d) N 1s, (e) C 1s, (f) Ru 3d, (g) Pd 3d, (h) Pt 4f and (i) Ir 4f. | ||
In order to calculate the amount of metals available in M–CZ catalysts, inductively coupled plasma mass spectrometry (ICP-MS) was carried out, and the actual contents of metals are furnished in Table S2 in the ESI.† It was observed that the amount of Zn was decreased compared to the loaded amount, which was also evidenced in XRD and XPS analysis. This may be attributed to the evaporation of Zn metals during carbonisation as Zn has a lower boiling point of 905 °C. However, the amount of Cu and other noble metals remains close to a nominal value of 15% and 0.03% for Cu and other noble metals (M), respectively.
Catalyst activity analysis
The catalytic performance of the CZ and M–CZ catalysts was examined for hydrogenation of CO2 to formic acid at a total pressure (CO2![[thin space (1/6-em)]](https://www.rsc.org/images/entities/char_2009.gif) :
:![[thin space (1/6-em)]](https://www.rsc.org/images/entities/char_2009.gif) H2 = 1
H2 = 1![[thin space (1/6-em)]](https://www.rsc.org/images/entities/char_2009.gif) :
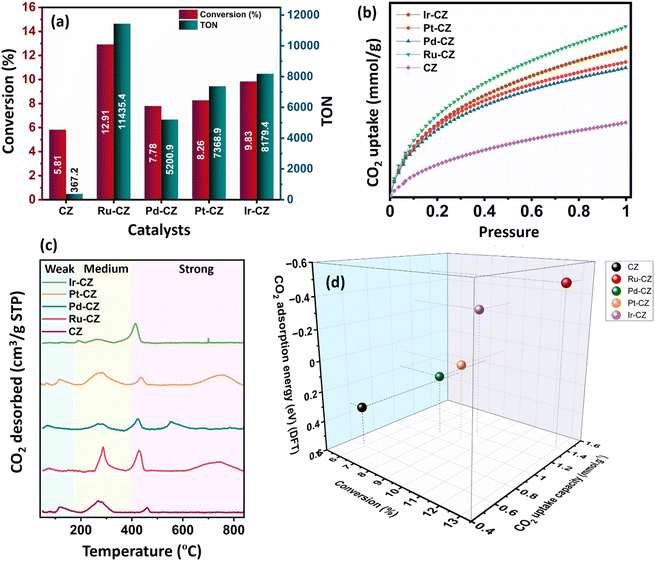
:![[thin space (1/6-em)]](https://www.rsc.org/images/entities/char_2009.gif) 1) of 60 bar and a temperature of 80 °C for 20 h. Irrespective of all the catalysts reported in this study, formic acid was found to be a highly selective (>99%) product, where no competing byproducts such as CO, CH4, or CH3OH were detected in the residual gas analysis (RGA) conducted using GC and HPLC. This can be ascribed to the execution of the reaction at a low temperature, where the likelihood of CO2 dissociation is minimal, reducing the generation of alternative products aside from formic acid. The catalytic activity of these catalysts was compared with that of the best-reported catalysts for CO2 hydrogenation to formic acid composed of the metals considered for this study, including, Cu, Zn, Ru, Pd, Pt and Ir, as depicted in Fig. 5. Fig. 6(a) illustrates that CZ showed a 5.81% conversion with a TON of 367 for formic acid, which is significantly more active than Cu/ZnO/Al2O3.35 The superior catalytic activity of MOF-derived catalysts is obvious, as metal catalysts with smaller particle sizes generally display improved catalytic performance due to an increased percentage of surface atoms. Interestingly, the activity of the catalysts was significantly boosted while the third metal (M: Ru, Pd, Pt, and Ir) was introduced, exhibiting a very strong inhibition effect. The highest catalytic activity was achieved in the Ru–CZ catalyst with a maximum CO2 conversion of 12.91%, followed by Ir–CZ exhibiting a conversion of 9.21%. The catalysts Pt–CZ and Pd–CZ showed comparatively inferior CO2 conversions of 8.86% and 7.78%, compared to Ru–CZ. The turnover number (TON) values, which represent the number of product molecules formed per active site of the catalyst, were determined to assess their catalytic efficiency. The results revealed intriguing insights into the effects of different metal promoters on catalytic activity. The CZ catalyst showed a TON of 367, which serves as the reference point for comparison. The introduction of Pd as a promoter significantly enhanced the catalytic activity resulting in a TON of 5200, showcasing a substantial improvement in catalytic performance. Similarly, the Pt–CZ catalyst displayed a TON of 7368, indicating its favorable influence on formic acid formation. Moreover, Ir–CZ achieved a TON of 8179. This substantial increase can be attributed to the unique electronic and structural properties of Ir, which may lead to CO2 activation and formic acid production. Interestingly, the Ru–CZ catalyst displayed the highest TON of 11
1) of 60 bar and a temperature of 80 °C for 20 h. Irrespective of all the catalysts reported in this study, formic acid was found to be a highly selective (>99%) product, where no competing byproducts such as CO, CH4, or CH3OH were detected in the residual gas analysis (RGA) conducted using GC and HPLC. This can be ascribed to the execution of the reaction at a low temperature, where the likelihood of CO2 dissociation is minimal, reducing the generation of alternative products aside from formic acid. The catalytic activity of these catalysts was compared with that of the best-reported catalysts for CO2 hydrogenation to formic acid composed of the metals considered for this study, including, Cu, Zn, Ru, Pd, Pt and Ir, as depicted in Fig. 5. Fig. 6(a) illustrates that CZ showed a 5.81% conversion with a TON of 367 for formic acid, which is significantly more active than Cu/ZnO/Al2O3.35 The superior catalytic activity of MOF-derived catalysts is obvious, as metal catalysts with smaller particle sizes generally display improved catalytic performance due to an increased percentage of surface atoms. Interestingly, the activity of the catalysts was significantly boosted while the third metal (M: Ru, Pd, Pt, and Ir) was introduced, exhibiting a very strong inhibition effect. The highest catalytic activity was achieved in the Ru–CZ catalyst with a maximum CO2 conversion of 12.91%, followed by Ir–CZ exhibiting a conversion of 9.21%. The catalysts Pt–CZ and Pd–CZ showed comparatively inferior CO2 conversions of 8.86% and 7.78%, compared to Ru–CZ. The turnover number (TON) values, which represent the number of product molecules formed per active site of the catalyst, were determined to assess their catalytic efficiency. The results revealed intriguing insights into the effects of different metal promoters on catalytic activity. The CZ catalyst showed a TON of 367, which serves as the reference point for comparison. The introduction of Pd as a promoter significantly enhanced the catalytic activity resulting in a TON of 5200, showcasing a substantial improvement in catalytic performance. Similarly, the Pt–CZ catalyst displayed a TON of 7368, indicating its favorable influence on formic acid formation. Moreover, Ir–CZ achieved a TON of 8179. This substantial increase can be attributed to the unique electronic and structural properties of Ir, which may lead to CO2 activation and formic acid production. Interestingly, the Ru–CZ catalyst displayed the highest TON of 11![[thin space (1/6-em)]](https://www.rsc.org/images/entities/char_2009.gif) 435, indicating its exceptional catalytic efficiency and suggesting potential synergistic effects between Ru and the CuZn catalyst. The presence of Ru improves the adsorption and activation of CO2 on the catalyst surface, promoting the formation of formate intermediates. The notable variations in catalytic effect in terms of CO2 conversion and TON of Ru, Pd, Pt, and Ir as promoters among the metal-promoted catalysts highlight the crucial role of each metal in influencing the catalytic activity of the CZ catalyst. Nevertheless, no competing byproducts such as CO, CH4, or CH3OH were detected in the residual gas analysis (RGA) conducted using GC and HPLC. This can be ascribed to the execution of the reaction at a low temperature, where the likelihood of CO2 dissociation is minimal, reducing the generation of alternative products aside from formic acid.
435, indicating its exceptional catalytic efficiency and suggesting potential synergistic effects between Ru and the CuZn catalyst. The presence of Ru improves the adsorption and activation of CO2 on the catalyst surface, promoting the formation of formate intermediates. The notable variations in catalytic effect in terms of CO2 conversion and TON of Ru, Pd, Pt, and Ir as promoters among the metal-promoted catalysts highlight the crucial role of each metal in influencing the catalytic activity of the CZ catalyst. Nevertheless, no competing byproducts such as CO, CH4, or CH3OH were detected in the residual gas analysis (RGA) conducted using GC and HPLC. This can be ascribed to the execution of the reaction at a low temperature, where the likelihood of CO2 dissociation is minimal, reducing the generation of alternative products aside from formic acid.
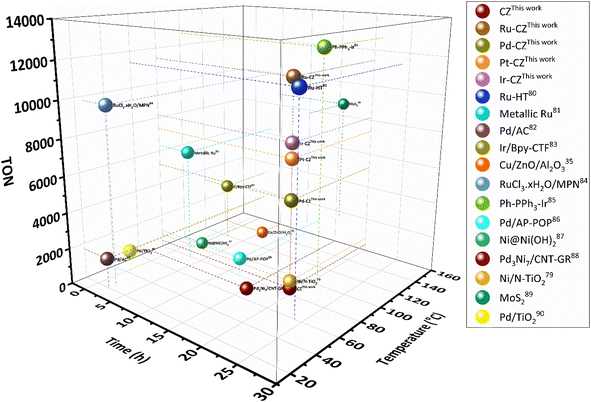 | ||
| Fig. 5 Comparison of nanostructured heterogeneous catalysts for CO2 hydrogenation to formate/formic acid.35,79–90 | ||
The observed trend in CO2 conversion was in accordance with the CO2 uptake capacity among the different catalysts, as shown in Fig. 7(b). The CO2 adsorption isotherm for all the catalysts was recorded under conditions of 25 °C and ambient pressure. Among the catalysts, Ru–CZ exhibited the highest CO2 uptake capacity at 1.4 mmol gcat−1, followed by Ir–CZ with 1.2 mmol gcat−1, Pt–CZ with 1.1 mmol gcat−1, Pd–CZ with 0.9 mmol gcat−1, and finally, CZ with 0.6 mmol gcat−1. This overall observation was substantiated by additional DFT calculations related to CO2 adsorption.
The temperature-programmed desorption of CO2 (CO2-TPD) was carried out to study the surface basicity of the catalysts, and the desorption profiles are depicted in Fig. 6(c). The detailed analysis of weak, moderate and strong basic sites is furnished in Table S1.† From the amount of CO2 desorbed, it has been seen that the basicity of the catalysts increases in the order of CZ < Pd–CZ < Pt–CZ < Ir–CZ < Ru–CZ, which contributes to a higher density of active sites for CO2 adsorption to the respective catalysts. As per the literature, desorption between 90 and 180 °C offers insights into the presence of weak basic sites, whereas desorption within the range of 180–400 °C indicates the existence of moderate basic sites, and desorption surpassing 400 °C is associated with adsorption onto strong basic sites.66 Strongly and moderately adsorbed CO2 is an active species that can potentially undergo hydrogenation processes, whereas weakly adsorbed CO2 is regarded as physical adsorption and not activated.67
Fig. 6(d) illustrates a correlation between conversion, CO2 uptake capacity, and the theoretical determination of CO2 adsorption energy using DFT calculations. It was observed that as the CO2 uptake capacity of the catalysts increases, the CO2 conversion increases accordingly. This is absolutely in line with the fact that the higher the adsorption of CO2, the higher will be the activation and, hence, the higher the CO2 conversion. Furthermore, DFT calculated CO2 adsorption energy confirms that CO2 adsorption increases in the order of CZ < Pd–CZ < Pt–CZ < Ir–CZ < Ru–CZ, aligning with CO2 uptake capacity and hence CO2 conversion. Hence, a strong correlation was evident between CO2 adsorption capacity, conversion, and theoretical assessments.
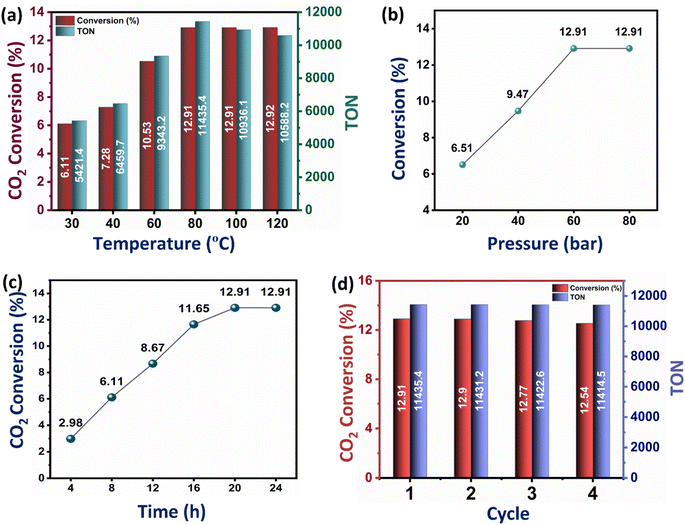
While the conversion of CO2 to formic acid inherently depends on the CO2 adsorption capacity of the catalysts, it is also influenced by several factors, including temperature, pressure, and reaction time. The effect of temperature on the catalytic conversion of CO2 to formic acid was studied on the best-performing catalyst Ru–CZ, and it shows a clear trend of an increase in CO2 conversion and TON with an increase in temperature (Fig. 7(a)). As the temperature is raised from 30 °C to 80 °C, the conversion of CO2 to formic acid gradually increases from 6.61% to 12.91% and then remains unaffected upon a further increase in temperature. However, a decline in the TON was noted above 100 °C, stemming from the diminished stability of formic acid beyond this temperature. The residual gas analysis (RGA) conducted after reactions at 100 °C and 120 °C substantiated the existence of carbon monoxide (CO) in the residual gas mixture. This observation suggested that the decomposition of formic acid beyond 100 °C results in the production of CO and water (H2O), HCOOH → CO + H2O, aligning with the findings of Barham and Clark in 1951.68
Similarly, the effect of pressure on the CO2 hydrogenation to formic acid was systematically investigated with the Ru–CZ catalyst by increasing pressure from 20 bar to 80 bar, as shown in Fig. 7(b). As the pressure increases from 20 bar to 40 bar and further to 60 bar, there is a noticeable enhancement in the conversion of CO2 to formic acid. The conversions increase from 6.51% at 20 bar to 9.47% at 40 bar and further to 12.91% at 60 bar. This trend suggests that higher pressures favour the CO2 hydrogenation reaction and promote the formation of formic acid. The elevated pressure leads to a higher concentration of reactants on the catalyst surface, which, in turn, facilitates more frequent collisions between CO2 and hydrogen molecules, increasing the chances of productive adsorption and subsequent reactions. However, it is noteworthy that the conversion remains constant at 12.91% when the pressure is further increased to 80 bar. This behaviour indicates that a saturation point might have been reached, where the increase in reaction pressure does not provide any enhancement in catalytic activity.
The impact of reaction time on CO2 hydrogenation to formic acid was monitored carefully, and the results revealed a clear dependence of the conversion on the duration of the reaction (Fig. 7(c)). The experimental data indicated that as the reaction time increased from 4 hours to 24 hours, the conversion of CO2 to formic acid also increased progressively. The conversion rates were found to be 2.98%, 6.11%, 8.67%, 11.65%, 12.91%, and 12.91% for reaction times of 4 h, 8 h, 12 h, 16 h, 20 h, and 24 h, respectively. The initial low conversion at 4 hours suggested that the reaction required a certain induction period to reach an active state. With prolonged reaction time, the concentration of intermediates and active species increased, leading to enhanced reaction rates and higher formic acid yields. However, the conversion plateaued after 20 hours, indicating that the catalytic reaction reached equilibrium, and further extension of reaction time did not result in additional formic acid formation.
The recyclability of the Ru–CZ catalyst for CO2 hydrogenation to formic acid was thoroughly examined, and the results demonstrated its excellent stability and consistent catalytic performance over multiple cycles, as illustrated in Fig. 7(d). In the first cycle, the Ru–CZ catalyst exhibited a remarkable conversion of 12.91% with a turnover number (TON) of 11![[thin space (1/6-em)]](https://www.rsc.org/images/entities/char_2009.gif) 435, indicating its high activity and efficiency in promoting the desired reaction. After the first cycle, the catalyst was subjected to subsequent cycles to evaluate its recyclability. Surprisingly, even after multiple cycles, the Ru–CZ catalyst retained its catalytic activity with consistently high conversions of 12.9%, 12.77%, and 12.54% in the second, third, and fourth cycles, respectively, with an associated TON of 11
435, indicating its high activity and efficiency in promoting the desired reaction. After the first cycle, the catalyst was subjected to subsequent cycles to evaluate its recyclability. Surprisingly, even after multiple cycles, the Ru–CZ catalyst retained its catalytic activity with consistently high conversions of 12.9%, 12.77%, and 12.54% in the second, third, and fourth cycles, respectively, with an associated TON of 11![[thin space (1/6-em)]](https://www.rsc.org/images/entities/char_2009.gif) 431.2, 11
431.2, 11![[thin space (1/6-em)]](https://www.rsc.org/images/entities/char_2009.gif) 422.6, and 11
422.6, and 11![[thin space (1/6-em)]](https://www.rsc.org/images/entities/char_2009.gif) 414.5, respectively. The negligible loss of catalytic activity over multiple cycles highlights the remarkable recyclability of the Ru–CZ catalyst throughout the reaction.
414.5, respectively. The negligible loss of catalytic activity over multiple cycles highlights the remarkable recyclability of the Ru–CZ catalyst throughout the reaction.
Stability of the catalyst
In order to investigate the stability of the catalyst, Ru–CZ, which exhibited the highest catalytic activity, underwent thorough systematic characterization after the completion of the 4th catalytic cycle by the use of XRD, Raman spectroscopy, N2 physisorption, and HR-TEM analysis. The characteristic peaks featuring 2θ = 43.5, 50.6, 74.3° in the XRD diffractograms, shown in Fig. 8(a), indicated the consistency of the Cu metallic phase, as per JCPDS card no. 003–1018. The Raman spectrum shows two peaks at around 1336 cm−1 (D band) and 1588 cm−1 (G band), which represent the existence of carbon atoms with sp2 bonding and sp3 bonding indicative of defects and disorder,53 respectively. The N2 physisorption isotherm illustrated a Type-IV isotherm with H4 hysteresis (Fig. 8(c)), suggesting the mesoporosity of the catalyst surface. A slightly lower BET surface area of 212 m2 g−1 was observed in the spent catalyst in comparison to the fresh Ru–CZ catalyst (226 m2 g−1), which may be attributed to the gradual agglomeration of Cu particles in each catalytic cycle. The HR-TEM analysis was performed to examine the dispersion and variation in particle size after the reaction and the images are shown in Fig. 8(d–f). A homogeneous dispersion of Cu was observed throughout the CNx support with a relatively larger average particle size of 7.8 nm in comparison to the fresh catalyst, concomitant with the crystallite size calculated from the XRD diffractograms (7.7 nm).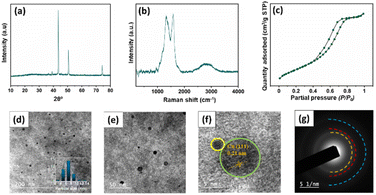 | ||
| Fig. 8 Characterization of the spent Ru–CZ catalyst. (a) XRD diffractogram, (b) Raman spectroscopy spectra, (c) N2 isotherm profile, (d–e) TEM images, (f) HR-TEM and (g) SAED. | ||
Plausible mechanism for CO2 hydrogenation to HCOOH over the surface of M–CZ catalysts
In a composite catalyst comprising multiple components, each species is responsible for a distinct role within the reaction system. Fig. 9 illustrates a conceivable mechanism outlining the individual contributions of these species. Similar mechanisms for the formation of formic acid via CO2 hydrogenation have been documented in prior studies involving ruthenium69 and gold70 catalysts. Within this context, the interface of Cu and ZnO acts as an active site for CO2 adsorption and activation,71 as indicated in Fig. 9(1). Notably, the incorporation of noble metals such as Ru, Pd, Pt, and Ir significantly enhances CO2 adsorption by intensifying Lewis's acid–base interactions with both CO2 and the catalyst surface.72–75 The Cu (111) surface plays a critical role in the dissociation of hydrogen molecules (H2) into individual hydrogen atoms (H*), which promptly adsorb onto the Cu (111) surface,35,76,77 as depicted in Fig. 9(2).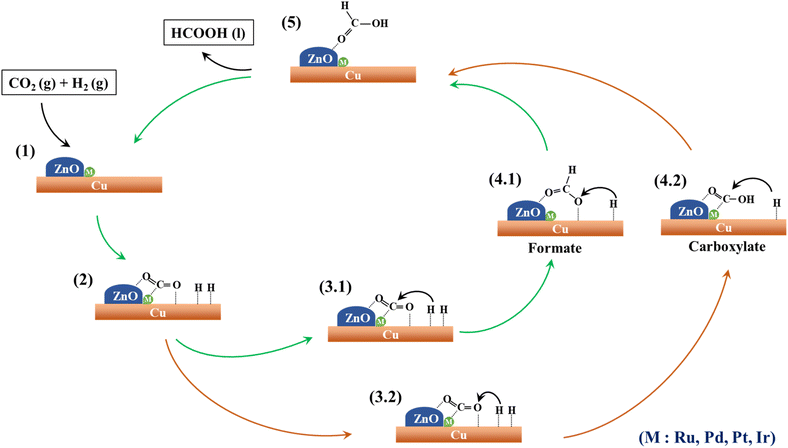 | ||
| Fig. 9 A proposed mechanism for CO2 hydrogenation to formic acid over the surface of M–CZ catalysts. | ||
Subsequently, these surface hydrogen atoms traverse the catalyst surface, interacting with adsorbed CO2. As documented in the literature, CO2 can undergo hydrogenation to produce formic acid through two alternate pathways involving intermediate species, specifically formate (HCOO) and carboxylate (COOH).78,79 In the ensuing step, an individual hydrogen atom can bind to the carbon (C) atom of CO2 to yield the HCOO intermediate (Fig. 9; 3.1 → 4.1) or alternatively form a bond with the nearest oxygen (O) atom of CO2, resulting in the COOH intermediate (Fig. 9; 3.2 → 4.2). Subsequently, these HCOO and COOH intermediates undergo a second hydrogenation step facilitated by surface-bound hydrogen atoms, ultimately yielding formic acid. In the final step, the formic acid desorbs from the catalyst surface, giving rise to the final product.
DFT results
DFT calculations were employed to investigate the impact of various PGM elements, including Ru, Pd, Pt, and Ir, on the CuZn (CZ) catalyst for the synthesis of formic acid through CO2 hydrogenation. In addition, a detailed study was carried out to get an insight into the mechanism through which CO2 hydrogenated to formic acid. The optimized geometry of the Cu (111) surface is depicted in Fig. 10(a), while the ZnO/Cu (111) catalyst surface is obtained by grafting a Zn6O7 nanocluster onto the Cu (111) surface, as illustrated in Fig. 10(b). The geometry-optimized ZnO/Cu (111) surface exhibits strong interactions between the Cu (111) surface and the Zn6O7 nanoparticle, forming multiple Cu–Zn bonds, as shown in Fig. 10(b). Subsequently, the Ru–CZ, Pd–CZ, Pt–CZ, and Ir–CZ model surfaces were generated by replacing one Cu atom at the ZnO/Cu (111) interface with Ru, Pd, Pt, and Ir atoms, respectively, as presented in Fig. 10(c), (d), (e), and (f), respectively.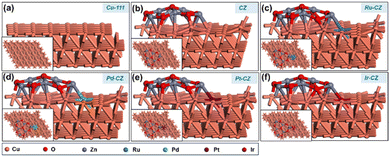 | ||
| Fig. 10 The DFT optimized geometry of (a) Cu-111, (b) CZ, (c) Ru–CZ, (d) Pd–CZ, (e) Pt–CZ and (f) Ir–CZ surfaces. | ||
CO2 adsorption
CO2 adsorption was studied on the CZ and M–CZ surfaces, and it was found that the Cu (111) surface is not active for CO2 activation as CO2 does not adsorb at the Cu (111) surface, as shown in Fig. 11(a). However, the interface of Cu and ZnO was found to be a suitable site for CO2 adsorption, as can be seen in Fig. 11(b). CO2 was adsorbed strongly on the interface of Cu and ZnO nanocluster by possessing a bent geometry through the formation of one Zn–O, one Cu–C and one Cu–O bond (Fig. 11(c)). The bond lengths of Zn–O, Cu–C and Cu–O bonds were measured to be 1.97 Å, 2.09 Å and 2.15 Å, respectively, and the O–C–O bond angle was calculated to be 124°. The corresponding binding energy for CO2 adsorption on CZ was computed to be 0.23 eV, which was endothermic in nature. Similarly, it was found that the M–CZ surfaces also act as an active site for CO2 adsorption. The adsorbate molecule CO2 adsorbs strongly on Ru–CZ, Pd–CZ, Pt–CZ and Ir–CZ surfaces forming Zn–O, M–C (M: Ru, Pd, Pt, and Ir) and Cu–O bonds as shown in Fig. 11 (c), (d), (e), and (f), respectively. The bond length of Ru–C, Pd–C, Pt–C and Ir–C was calculated to be 2.07 Å, 2.12 Å, 2.09 Å, and 2.06 Å, respectively. Likewise, the distances between Zn and O atoms in the Ru–CZ, Pd–CZ, Pt–CZ, and Ir–CZ catalysts were determined to be 1.97 Å, 1.99 Å, 1.99 Å, and 1.98 Å, respectively, and the lengths of the Cu–O bonds in these catalysts were found to be 2.11 Å, 2.21 Å, 2.19 Å, and 2.11 Å, respectively. Among all the M–CZ catalysts, the adsorption of CO2 on Ru–CZ has the highest binding energy of −0.41 eV, followed by Ir–CZ exhibiting a binding energy of −0.34 eV, which was 0.05 eV less exothermic than Ru–CZ. However, the CO2 adsorption process became further less exothermic with the Pt–CZ catalyst with a binding energy of −0.15 eV. The adsorption energy of CO2 on the Pd–CZ catalyst was computed to be 0.03 eV, indicating endothermic adsorption. Overall, the trend of CO2 adsorption energy over the set of catalysts was observed to follow the following trend: CZ < Pd–CZ < Pt–CZ < Ir–CZ < Ru–CZ. The stronger the adsorption energy, the higher the stability of the species and hence the higher the catalyst activity. So, it can be concluded that the result obtained from the DFT study has a good correlation with the CO2 TPD data (Table 1) and conversion data collected from experimental data.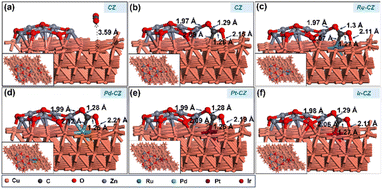 | ||
| Fig. 11 The DFT optimised geometry of CO2 adsorption on (a) CZ, (b) CZ, (c) Ru–CZ, (d) Pd–CZ, (e) Pt–CZ and (f) Ir–CZ surfaces. | ||
CO2 + H co-adsorption
The co-adsorption of CO2 and H is a crucial step for the subsequent reaction to produce intermediates such as HCOO and COOH. Fig. 12(a–e) show the geometry-optimized structure of CO2 + H co-adsorption on the CZ and M–CZ surfaces, respectively. The most stable configuration for the co-adsorption of CO2 and H shows that CO2 possesses a V-shape geometry and the H is positioned at a nearby pseudo-threefold site. The bond lengths of Zn–O, M–C and Cu–O were measured to be nearly 1.9 Å, 2.0 Å, and 2.1 Å, respectively, where the bond length of each Cu–H bond was ∼1.7 Å. The binding energy of CO2 + H on the surface of CZ was calculated to be 0.12 eV, indicating a slightly endothermic interaction. In contrast, Ru–CZ exhibited a binding energy of −0.44 eV, which was the most exothermic among all the catalysts studied for CO2 + H co-adsorption. A binding energy of −0.05 eV was determined for the co-adsorption on the surface of Pd–CZ, which was 0.39 eV less exothermic than the Ru–CZ surface. Accordingly, the binding energy for the Pt–CZ surface was calculated to be −0.19 eV, comparatively 0.25 eV less exothermic than the Ru–CZ surface and 0.14 eV higher exothermic than the Pd–CZ surface. Moreover, Ir–CZ displayed a binding energy of −0.36 eV for the co-adsorption, 0.31 eV and 0.17 eV more exothermic in comparison to Pd–CZ and Pt–CZ, respectively. However, it is 0.07 eV less exothermic than Ru–CZ. Hence, the Ru–CZ surface was found to be a more suitable catalyst surface for the co-adsorption of CO2 + H, followed by Ir–CZ, Pt–CZ, Pd–CZ and CZ, respectively.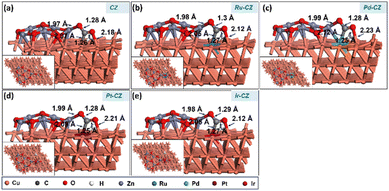 | ||
| Fig. 12 The DFT optimised geometry of the CO2 + H co-adsorption on (a) CZ, (b) Ru–CZ, (c) Pd–CZ, (d) Pt–CZ and (e) Ir–CZ surfaces. | ||
HCOO vs. COOH adsorption
After determining the ideal co-adsorption site of CO2 and H, a first insight was obtained for the formation of intermediates, including formate and carboxylate, which will provide information regarding the mechanism of the reaction. The formate (HCOO) intermediate was found to be adsorbed on the CZ and M–CZ catalyst surfaces through the formation of Zn–O and M–O (where M includes Cu, Ru, Pd, Pt, and Ir) bonding as illustrated in Fig. 13(a–e). The H-atom was attached to the C atom of CO2 with a bond distance of ∼1.1 Å for all the catalyst surfaces. The Zn–O bond length was determined to be nearly 1.9 Å, and the Cu–O, Ru–O, Pd–O, Pt–O, and Ir–O bond lengths were measured to be 2.33 Å, 2.24 Å, 2.56 Å, 2.94 Å and 2.39 Å, respectively. The HCOO intermediate was adsorbed on the surface of the CZ catalyst with a computed binding energy of −0.71 eV, which is exothermic in nature. The Ru–CZ catalyst shows a binding energy of −1.00 eV, that was −0.29 eV higher exothermic than the CZ catalyst, indicating a strong affinity towards HCOO adsorption. Pd–CZ displayed a binding energy of −0.73 eV, while Pt–CZ exhibited −0.86 eV, which was 0.27 eV and 0.14 eV less exothermic as compared to the Ru–CZ surface, respectively. Ir–CZ possesses a binding energy of −0.87 eV, signifying substantial exothermic behaviour, which was 0.13 eV less than Ru–CZ and 0.14 eV and 0.01 eV more than Pd–CZ and Pt–CZ surfaces, respectively. This analysis reveals that Ru–CZ is the most favorable catalyst for HCOO adsorption, implying its potential for efficient catalytic performance in CO2 hydrogenation to formic acid. Ir–CZ, Pd–CZ, and Pt–CZ also exhibit favorable exothermic adsorption, albeit with varying degrees, while CZ demonstrates moderate exothermic behaviour in HCOO adsorption.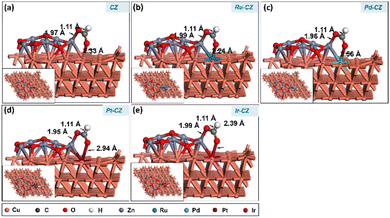 | ||
| Fig. 13 The DFT optimised geometry of the HCOO adsorption on (a) CZ, (b) Ru–CZ, (c) Pd–CZ, (d) Pt–CZ and (e) Ir–CZ surfaces. | ||
A subsequent calculation was performed for the hydrogenation of CO2 to formic acid through the carboxyl intermediate. Carboxyl is an isomeric intermediate of formate, where the former has its H bonded to an oxygen atom and the latter to its carbon atom. The COOH prefers to adsorb on the catalyst surface in a trans-configuration with its H pointing towards the surface, forming a Zn–O bond and an M–C bond as shown in Fig. 14(a–e). The bond lengths of the Zn–O bond, M–C bond and O–H bonds were measured to be ∼1.9 Å, 2.0 Å and 1.0 Å, respectively. Among the catalysts investigated, Ru–CZ exhibited the highest binding energy of −0.80 eV for the adsorption of COOH, associated with the exothermic nature of this adsorption. Pd–CZ displayed a binding energy of −0.16 eV, while Pt–CZ exhibited −0.35 eV, both representing favourable exothermic adsorption. Accordingly, the binding energy of COOH on the surface of Ir–CZ was calculated to be −0.77 eV. In contrast, CZ, the unmodified catalyst, showed a positive binding energy of 0.08 eV, suggesting an endothermic adsorption process.
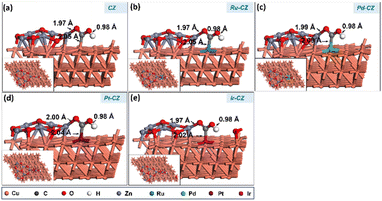 | ||
| Fig. 14 The DFT optimised geometry of the COOH adsorption on (a) CZ, (b) Ru–CZ, (c) Pd–CZ, (d) Pt–CZ and (e) Ir–CZ surfaces. | ||
It was observed that the carboxyl intermediate was 0.79 eV, 0.2 eV, 0.57 eV, 0.51 eV and 0.1 eV less stable as compared to the formate intermediate on CZ, Ru–CZ, Pd–CZ, Pt–CZ and Ir–CZ surfaces, respectively. Therefore, the formate intermediate is found to be more energetically favourable than the carboxyl intermediate.
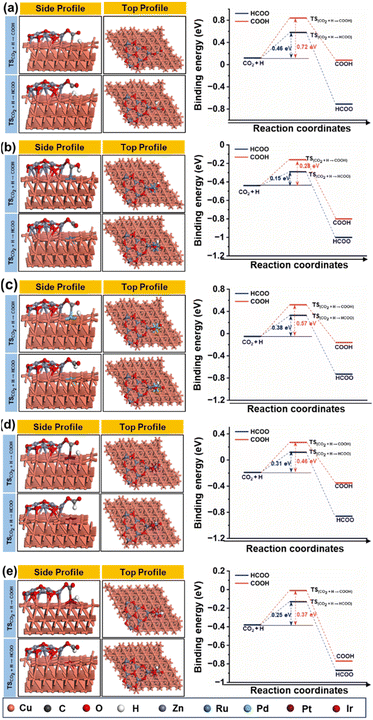
Fig. 15(a–e) depict the DFT-optimized structures of transition states and the energy profile diagrams for the conversion of CO2 + H to HCOO and COOH intermediates on the surfaces of CZ and M–CZ catalysts. In the transition state of CO2 + H to HCOO on the CZ surface, H was positioned on the short-bridge (SB) site of the Cu (111) surface, where CO2 was activated by breaking the Cu–C and Cu–O bonds. However, on the surfaces of Ru–CZ, Pd–CZ, Pt–CZ and Ir–CZ, H was attached to the C atom, with simultaneous breaking of the Cu–C and Cu–O bonds. The activation barrier for the formation of the HCOO intermediate was calculated to be 0.46 eV, 0.15 eV, 0.38 eV, 0.31 eV, and 0.25 eV for the CZ, Ru–CZ, Pd–CZ, Pt–CZ and Ir–CZ surfaces, respectively. The transition state from CO2 + H to the COOH intermediate on the CZ surface showed that the H atom attached to the Cu (111) surface by forming a Cu–H bond, whereas CO2 was found to be in an activated state with the breaking of the Cu–O bond. For the formation of the COOH intermediate the activation barrier was calculated to be 0.72 eV, 0.28 eV, 0.57 eV, 0.46 eV and 0.37 eV for the CZ, Ru–CZ, Pd–CZ, Pt–CZ and Ir–CZ surfaces, respectively, which were 0.26 eV, 0.13 eV, 0.19 eV, 0.15 eV and 0.27 eV higher in comparison to the formation of the HCOO intermediate, respectively. These findings suggested that the CO2 underwent hydrogenation on the catalyst's surface to formic acid through the formation of a formate intermediate. In addition, the trend of the activation energy on the various catalysts was determined to be Ru–CZ < Ir–CZ < Pt–CZ < Pd–CZ < CZ, which stated that the CO2 hydrogenates to the HCOO intermediate faster in Ru–CZ followed by Ir–CZ, Pt–CZ, Pd–CZ and CZ, respectively. Hence, the formate intermediate was considered for further investigations.
HCOO + H co-adsorption
The further work entails attaching a surface H atom to the formate to produce the formic acid molecule. For the further hydrogenation of adsorbed HCOO to HCOOH, it is important to co-adsorb the HCOO intermediate along with a H, and the best co-adsorbed state for HCOO and H on the catalyst surface has H at the PT site on the Cu (111) surface (as shown in Fig. 16(a–e)), with the interaction between HCOO and H being negligible. The Cu–H bond length was determined to be ∼1.7 Å, while the bond distance related to the HCOO intermediate remains similar to that of the adsorbed HCOO without the surface H atom. Ru–CZ demonstrated the highest exothermicity of the examined catalysts, with a binding energy of −1.05 eV, indicating relatively higher affinity for HCOO + H co-adsorption. Ir–CZ came in second with a binding energy of −0.93 eV, comparatively 0.12 eV less exothermic than the Ru–CZ surface. Both Pt–CZ and Pd–CZ demonstrated binding energies of −0.90 eV and −0.79 eV, respectively, which were 0.15 and 0.26 eV less exothermic than the Ru–CZ surface. Comparatively lower HCOO + H co-adsorption is shown by CZ, the unmodified catalyst, which had a negative but less exothermic binding energy of −0.75 eV.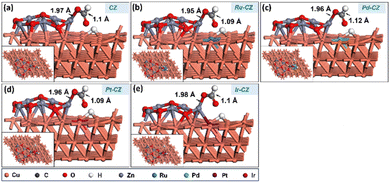 | ||
| Fig. 16 The geometry optimized structure of HCOO + H co-adsorption on (a) CZ, (b) Ru–CZ, (c) Pd–CZ, (d) Pt–CZ and (e) Ir–CZ surfaces. | ||
Activation barrier for hydrogenation of HCOO to HCOOH
The CI-NEB calculation for the hydrogenation of HCOO to HCOO suggested that, in the transition state H formed a single bond with Cu of the Cu (111) surface on CZ and Ru–CZ surfaces, as shown in Fig. 17(a) and (b), respectively, whereas the H-atom was co-ordinated on the short-bridge (SB) position on the surfaces of Pd–CZ, Pt–CZ and Ir–CZ, as depicted in Fig. 17(c), (d), and (e) respectively. The Cu–O bond with the HCOO intermediate was observed to be cleaved in the transition state on all the catalyst surfaces. The activation energy associated with hydrogenation of HCOO to HCOOH was calculated to be 0.52 eV, 0.13 eV, 0.41 eV, 0.35 eV and 0.21 eV for the CZ, Ru–CZ, Pd–CZ, Pt–CZ and Ir–CZ catalyst surfaces, respectively.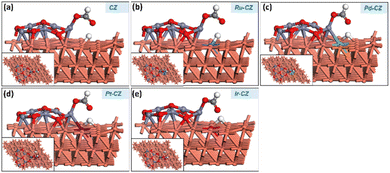 | ||
| Fig. 17 The geometry optimised structure of the transition state during conversion of CO2 + H to HCOO and COOH for (a) CZ, (b) Ru–CZ, (c) Pd–CZ, (d) Pt–CZ and (e) Ir–CZ. | ||
HCOOH adsorption
In the final stage, the adsorption of HCOOH was studied on the surfaces of CZ and M–CZ catalysts. In the most stable configuration, HCOOH was found to be adsorbed on the catalyst surface by the formation of a Zn–O bond, which was approximately 2.1 Å long, as depicted in Fig. 18(a–e). It was observed that the adsorption of HCOOH was independent of metal promoters by showing very few variations in the binding energies in the range of −0.88 eV to −0.93 eV.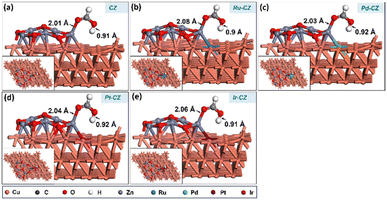 | ||
| Fig. 18 The geometry-optimized structure of HCOOH adsorption on (a) CZ, (b) Ru–CZ, (c) Pd–CZ, (d) Pt–CZ and (e) Ir–CZ surfaces. | ||
An overall energy profile diagram is illustrated in Fig. 19 consisting of all the intermediates and transition states taking part in the reaction mechanism for all the CZ and M–CZ catalysts. The DFT calculations led to the important information that the hydrogenation of CO2 to formic acid progressed through the involvement of the formate intermediate. On the basis of the adsorption of intermediates and activation energy associated with the hydrogenation of CO2 to HCOO and HCOO to HCOOH, it could be stated that the hydrogenation of CO2 to formic acid was more feasible on the Ru–CZ surface followed by Ir–CZ, Pt–CZ, Pd–CZ and CZ catalysts, respectively, which was absolutely in line with the experimental outcomes.
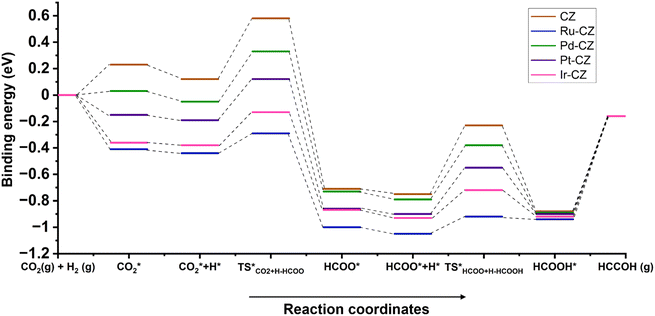 | ||
| Fig. 19 The energy profile diagram for the hydrogenation of CO2 to formic acid on CZ and M–CZ catalyst surfaces. | ||
Conclusions
In conclusion, a successful single-step pyrolysis auto-reduction approach was adopted to synthesize a series of CuZn@CNx catalysts for efficient CO2 adsorption and further hydrogenation to formic acid in a base-free aqueous medium. Incorporating noble metals such as Ru, Pd, Pt, and Ir into the CZ (CuZn@CNx) catalyst system enhanced the adsorption capacity and catalytic activity of the reported catalyst system. Detail characterization of the catalysts confirmed that the active metal nanoparticles were securely encapsulated within the porous carbon–nitrogen matrix, preventing agglomeration. Among the catalysts tested, Ru–CZ exhibited the highest catalytic activity, achieving a substantial CO2 conversion of 12.91% and a TON of 11![[thin space (1/6-em)]](https://www.rsc.org/images/entities/char_2009.gif) 434. This exceptional performance was attributed to the synergistic effects between Ru, Cu, and Zn, as well as the uniform dispersion of active sites and excellent textural properties. DFT studies supported the experimental findings, showing that CO2 adsorption on the Ru–CZ surface had the strongest binding energy compared to the other catalysts studied in this report. Additionally, the Ru–CZ catalyst demonstrated notable reusability for up to 4 cycles. This research not only highlights the potential of transforming MOFs into high-performance catalysts but also opens the door for integrated CO2 sorption and selective conversion to formic acid, promoting sustainability.
434. This exceptional performance was attributed to the synergistic effects between Ru, Cu, and Zn, as well as the uniform dispersion of active sites and excellent textural properties. DFT studies supported the experimental findings, showing that CO2 adsorption on the Ru–CZ surface had the strongest binding energy compared to the other catalysts studied in this report. Additionally, the Ru–CZ catalyst demonstrated notable reusability for up to 4 cycles. This research not only highlights the potential of transforming MOFs into high-performance catalysts but also opens the door for integrated CO2 sorption and selective conversion to formic acid, promoting sustainability.
Author contributions
Jyotishman Kaishyop conducted experiments, performed theoretical calculations, and prepared the initial manuscript draft. Jyoti Gahtori was involved in data curation and contributed to manuscript drafting. Suman Dalakoti and Jahiruddin Gazi assisted with instrumentation, data curation, and manuscript drafting. Tuhin Suvra Khan provided support in theoretical calculations and manuscript editing. Ankur Bordoloi was responsible for conceptualizing the idea, providing supervision and guidance, arranging funding, and participating in manuscript drafting and editing. All authors collaborated in the manuscript's preparation.Conflicts of interest
There are no conflicts to declare.Acknowledgements
JK acknowledges the DST-INSPIRE Fellowship, New Delhi, India, for a fellowship. A. B. gratefully acknowledges the CSIR-India (HCP-048) grant. The Director, CSIR-IIP, is gratefully acknowledged for his kind encouragement. The authors thank the analytical science division CSIR-IIP for providing their analytical services.Notes and references
- A. Gul and U. Tezcan Un, Eur. J. Sustain. Dev., 2022, 6, em0181 CrossRef PubMed.
- F. Mountourakis, A. Papazi and K. Kotzabasis, Symmetry, 2021, 13, 997 CrossRef CAS.
- J. Chen, Y. Xu, P. Liao, H. Wang and H. Zhou, Carbon Capture Sci. Technol., 2022, 4, 100052 CrossRef CAS.
- P. Bains, P. Psarras and J. Wilcox, Prog. Energy Combust. Sci., 2017, 63, 146–172 CrossRef.
- A. S. Bhown and B. C. Freeman, Environ. Sci. Technol., 2011, 45, 8624–8632 CrossRef CAS PubMed.
- M. N. Anwar, A. Fayyaz, N. F. Sohail, M. F. Khokhar, M. Baqar, A. Yasar, K. Rasool, A. Nazir, M. U. F. Raja, M. Rehan, M. Aghbashlo, M. Tabatabaei and A. S. Nizami, J. Environ. Manage., 2020, 260, 110059 CrossRef CAS PubMed.
- S. Das, J. Pérez-Ramírez, J. Gong, N. Dewangan, K. Hidajat, B. C. Gates and S. Kawi, Chem. Soc. Rev., 2020, 49, 2937–3004 RSC.
- Y. Jiang, R. Long and Y. Xiong, Chem. Sci., 2019, 10, 7310–7326 RSC.
- W. Zhang, D. Ma, J. Pérez-Ramírez and Z. Chen, Adv. Energy Sustainability Res., 2022, 3(2), 2100169 CrossRef CAS.
- S. Das, J. Pérez-Ramírez, J. Gong, N. Dewangan, K. Hidajat, B. C. Gates and S. Kawi, Chem. Soc. Rev., 2020, 49, 2937–3004 RSC.
- J. Liang, Q. Wu, Y. Huang and R. Cao, EnergyChem, 2021, 3, 100064 CrossRef CAS.
- Y. Wang, X. Gao, M. Wu and N. Tsubaki, EcoMat, 2021, 3(1), 12080 CrossRef.
- Y. Gao, K. Qian, B. Xu, Z. Li, J. Zheng, S. Zhao, F. Ding, Y. Sun and Z. Xu, Carbon Resour. Convers., 2020, 3, 46–59 CrossRef CAS.
- T. Kong, Y. Jiang and Y. Xiong, Chem. Soc. Rev., 2020, 49, 6579–6591 RSC.
- J. Ran, M. Jaroniec and S. Qiao, Adv. Mater., 2018, 30(7), 1704649 CrossRef.
- F. Liang, K. Zhang, L. Zhang, Y. Zhang, Y. Lei and X. Sun, Small, 2021, 17(44), 2100323 CrossRef CAS PubMed.
- W. Zhang, Y. Hu, L. Ma, G. Zhu, Y. Wang, X. Xue, R. Chen, S. Yang and Z. Jin, Adv. Sci., 2018, 5(1), 1700275 CrossRef PubMed.
- R. Ma, J. Sun, D. H. Li and J. J. Wei, Int. J. Hydrogen Energy, 2020, 45, 30288–30324 CrossRef CAS.
- Y. Zhang, C. Liang, J. Wu, H. Liu, B. Zhang, Z. Jiang, S. Li and P. Xu, ACS Appl. Energy Mater., 2020, 3, 10303–10316 CrossRef CAS.
- I. S. Omodolor, H. O. Otor, J. A. Andonegui, B. J. Allen and A. C. Alba-Rubio, Ind. Eng. Chem. Res., 2020, 59, 17612–17631 CrossRef CAS.
- S. Sun, H. Sun, P. T. Williams and C. Wu, Sustainable Energy Fuels, 2021, 5, 4546–4559 RSC.
- A. I. Tsiotsias, N. D. Charisiou, I. V. Yentekakis and M. A. Goula, Catalysts, 2020, 10, 812 CrossRef CAS.
- S. Lian, C. Song, Q. Liu, E. Duan, H. Ren and Y. Kitamura, J. Environ. Sci., 2021, 99, 281–295 CrossRef CAS.
- T. Daniel, A. Masini, C. Milne, N. Nourshagh, C. Iranpour and J. Xuan, Carbon Capture Sci. Technol., 2022, 2, 100025 CrossRef CAS.
- P. Zhang, J. Tong, K. Huang, X. Zhu and W. Yang, Prog. Energy Combust. Sci., 2021, 82, 100888 CrossRef.
- L. Liu, C. Zhao, J. Xu and Y. Li, Appl. Catal., B, 2015, 179, 489–499 CrossRef CAS.
- R. Sun, Y. Liao, S.-T. Bai, M. Zheng, C. Zhou, T. Zhang and B. F. Sels, Energy Environ. Sci., 2021, 14, 1247–1285 RSC.
- Y. Kim, S. hoon Kim, H. C. Ham and D. H. Kim, J. Catal., 2020, 389, 506–516 CrossRef CAS.
- A. Álvarez, A. Bansode, A. Urakawa, A. V. Bavykina, T. A. Wezendonk, M. Makkee, J. Gascon and F. Kapteijn, Chem. Rev., 2017, 117, 9804–9838 CrossRef.
- T. Singh, S. Jalwal and S. Chakraborty, Asian J. Org. Chem., 2022, 11, e202200330 CrossRef CAS.
- T. Fujitani and J. Nakamura, Appl. Catal., A, 2000, 191, 111–129 CrossRef CAS.
- F. Liao, Z. Zeng, C. Eley, Q. Lu, X. Hong and S. C. E. Tsang, Angew. Chem., Int. Ed., 2012, 51, 5832–5836 CrossRef CAS PubMed.
- S. Zander, E. L. Kunkes, M. E. Schuster, J. Schumann, G. Weinberg, D. Teschner, N. Jacobsen, R. Schlögl and M. Behrens, Angew. Chem., Int. Ed., 2013, 52, 6536–6540 CrossRef CAS PubMed.
- M. S. Spencer, Top. Catal., 1999, 8, 259–266 CrossRef CAS.
- C. L. Chiang, K. S. Lin and H. W. Chuang, J. Cleaner Prod., 2018, 172, 1957–1977 CrossRef CAS.
- Q. Zhang, Y. Z. Zuo, M. H. Han, J. F. Wang, Y. Jin and F. Wei, Catal. Today, 2010, 150, 55–60 CrossRef CAS.
- U. R. Pillai and S. Deevi, Appl. Catal., B, 2006, 64, 146–151 CrossRef CAS.
- H. H. Kung, Catal. Today, 1992, 11, 443–453 CrossRef CAS.
- G. Prieto, J. Zečević, H. Friedrich, K. P. De Jong and P. E. De Jongh, Nat. Mater., 2012, 12, 34–39 CrossRef PubMed.
- B. Li, H. M. Wen, Y. Cui, W. Zhou, G. Qian and B. Chen, Adv. Mater., 2016, 28, 8819–8860 CrossRef CAS PubMed.
- P. Kumar, K. Vellingiri, K.-H. Kim, R. J. C. Brown and M. J. Manos, Microporous Mesoporous Mater., 2017, 253, 251–265 CrossRef CAS.
- Y. T. Guntern, J. Vávra, V. V. Karve, S. B. Varandili, O. Segura Lecina, C. Gadiyar and R. Buonsanti, Chem. Mater., 2021, 33, 2646–2654 CrossRef CAS.
- H. Wang, Nano Res., 2022, 15, 2834–2854 CrossRef CAS.
- M. Usman, A. Helal, M. M. Abdelnaby, A. M. Alloush, M. Zeama and Z. H. Yamani, Chem. Rec., 2021, 21, 1771–1791 CrossRef CAS PubMed.
- N. ul Qadir, S. A. M. Said and H. M. Bahaidarah, Microporous Mesoporous Mater., 2015, 201, 61–90 CrossRef.
- B. An, K. Cheng, C. Wang, Y. Wang and W. Lin, ACS Catal., 2016, 6, 3610–3618 CrossRef CAS.
- W. Bak, H. S. Kim, H. Chun and W. C. Yoo, Chem. Commun., 2015, 51, 7238–7241 RSC.
- G. Kresse and J. Furthmüller, Comput. Mater. Sci., 1996, 6, 15–50 CrossRef CAS.
- B. Hammer, L. B. Hansen and J. K. Nørskov, Phys. Rev. B: Condens. Matter Mater. Phys., 1999, 59, 7413–7421 CrossRef.
- D. Vanderbilt, Phys. Rev. B: Condens. Matter Mater. Phys., 1990, 41, 7892–7895 CrossRef PubMed.
- Q. Huo, J. Li, X. Qi, G. Liu, X. Zhang, B. Zhang, Y. Ning, Y. Fu, J. Liu and S. Liu, Chem. Eng. J., 2019, 378, 122106 CrossRef CAS.
- M. Ignat and E. Popovici, Rev. Roum. Chim., 2011, 56, 947–952 CAS.
- Z. Wei, R. Pan, Y. Hou, Y. Yang and Y. Liu, Sci. Rep., 2015, 5, 15664 CrossRef PubMed.
- A. Kaniyoor and S. Ramaprabhu, AIP Adv., 2012, 2(3), 032183, DOI:10.1063/1.4756995.
- S. Tanaka and N. Nishiyam, in Progress in Molecular and Environmental Bioengineering – From Analysis and Modeling to Technology Applications, InTech, 2011 Search PubMed.
- C. E. Dubé, B. Workie, S. P. Kounaves, A. Robbat, M. L. Aksub and G. Davies, J. Electrochem. Soc., 1995, 142, 3357–3365 CrossRef.
- X. Wang, B. Zhang, W. Zhang, M. Yu, L. Cui, X. Cao and J. Liu, Sci. Rep., 2017, 7, 1584 CrossRef PubMed.
- I. Platzman, R. Brener, H. Haick and R. Tannenbaum, J. Phys. Chem. C, 2008, 112, 1101–1108 CrossRef CAS.
- S. Chen, L. Brown, M. Levendorf, W. Cai, S.-Y. Ju, J. Edgeworth, X. Li, C. W. Magnuson, A. Velamakanni, R. D. Piner, J. Kang, J. Park and R. S. Ruoff, ACS Nano, 2011, 5, 1321–1327 CrossRef CAS PubMed.
- J. Gahtori, V. Kumar Shrivastaw, T. S. Khan, M. Ali Haider, S. Paul and A. Bordoloi, Fuel, 2022, 326, 124961 CrossRef CAS.
- T. C. Nagaiah, A. Bordoloi, M. D. Sánchez, M. Muhler and W. Schuhmann, ChemSusChem, 2012, 5, 637–641 CrossRef CAS PubMed.
- D. J. Morgan, Surf. Interface Anal., 2015, 47, 1072–1079 CrossRef CAS.
- B. T. X. Lam, M. Chiku, E. Higuchi and H. Inoue, J. Power Sources, 2015, 297, 149–157 CrossRef CAS.
- M. A. Matin, E. Lee, H. Kim, W.-S. Yoon and Y.-U. Kwon, J. Mater. Chem. A, 2015, 3, 17154–17164 RSC.
- N. S. Date, A. M. Hengne, K.-W. Huang, R. C. Chikate and C. V. Rode, Green Chem., 2018, 20, 2027–2037 RSC.
- A. S. Al-Fatesh, Y. Arafat, H. Atia, A. A. Ibrahim, Q. L. M. Ha, M. Schneider, M. M-Pohl and A. H. Fakeeha, J. CO2 Util., 2017, 21, 395–404 CrossRef CAS.
- D. Goma, J. J. Delgado, L. Lefferts, J. Faria, J. J. Calvino and M. Á. Cauqui, Nanomaterials, 2019, 9(11), 1582, DOI:10.3390/NANO9111582.
- H. N. Barham and L. W. Clark, J. Am. Chem. Soc., 1951, 73, 4638–4640 CrossRef CAS.
- C. Hao, S. Wang, M. Li, L. Kang and X. Ma, Catal. Today, 2011, 160, 184–190 CrossRef CAS.
- C. Wu, Z. Zhang, Q. Zhu, H. Han, Y. Yang and B. Han, Green Chem., 2015, 17, 1467–1472 RSC.
- R. M. Palomino, P. J. Ramírez, Z. Liu, R. Hamlyn, I. Waluyo, M. Mahapatra, I. Orozco, A. Hunt, J. P. Simonovis, S. D. Senanayake and J. A. Rodriguez, J. Phys. Chem. B, 2018, 122, 794–800 CrossRef CAS.
- E. Zaĝli and J. L. Falconer, J. Catal., 1981, 69, 1–8 CrossRef.
- S. Kattel, B. Yan, J. G. Chen and P. Liu, J. Catal., 2016, 343, 115–126 CrossRef CAS.
- F. Solymosi and A. Berk, J. Catal., 1986, 101, 458–472 CrossRef CAS.
- C. Shen, K. Sun, Z. Zhang, N. Rui, X. Jia, D. Mei and C. J. Liu, ACS Catal., 2021, 11, 4036–4046 CrossRef CAS.
- F. Dalena, A. Senatore, M. Basile, S. Knani, A. Basile and A. Iulianelli, Membranes, 2018, 8, 98 CrossRef PubMed.
- H. Liu, X. Gao, D. Shi, D. He, Q. Meng, P. Qi and Q. Zhang, Energy Technol., 2022, 10(2), 804, DOI:10.1002/ente.202100.
- G. Peng, S. J. Sibener, G. C. Schatz, S. T. Ceyer and M. Mavrikakis, J. Phys. Chem. C, 2012, 116, 3001–3006 CrossRef CAS.
- J. Kaishyop, T. S. Khan, S. Panda, P. R. Chandewar, D. Shee, T. C. R. Rocha, F. C. Vicentin and A. Bordoloi, Green Chem., 2023, 25, 7729–7742 RSC.
- M. S. Maru, S. Ram, J. H. Adwani and R. S. Shukla, ChemistrySelect, 2017, 2, 3823–3830 CrossRef CAS.
- T. Umegaki, Y. Enomoto and Y. Kojima, Catal. Sci. Technol., 2016, 6, 409–412 RSC.
- J. Su, L. Yang, M. Lu and H. Lin, ChemSusChem, 2015, 8, 813–816 CrossRef CAS PubMed.
- K. Park, G. H. Gunasekar, N. Prakash, K. D. Jung and S. Yoon, ChemSusChem, 2015, 8, 3410–3413 CrossRef CAS PubMed.
- A. Jaleel, S.-H. Kim, P. Natarajan, G. H. Gunasekar, K. Park, S. Yoon and K.-D. Jung, J. CO2 Util., 2019, 35, 245–255 CrossRef.
- J. Hu, W. Ma, Q. Liu, J. Geng, Y. Wu and X. Hu, iScience, 2023, 26, 106672 CrossRef CAS PubMed.
- X. Shao, X. Miao, X. Yu, W. Wang and X. Ji, RSC Adv., 2020, 10, 9414–9419 RSC.
- X. P. Fu, L. Peres, J. Esvan, C. Amiens, K. Philippot and N. Yan, Nanoscale, 2021, 13, 8931–8939 RSC.
- L. T. M. Nguyen, H. Park, M. Banu, J. Y. Kim, D. H. Youn, G. Magesh, W. Y. Kim and J. S. Lee, RSC Adv., 2015, 5, 105560–105566 RSC.
- Z. Wang, Y. Kang, J. Hu, Q. Ji, Z. Lu, G. Xu, Y. Qi, M. Zhang, W. Zhang, R. Huang, L. Yu, Z.-Q. Tian and D. Deng, Angew Chem. Int. Ed. Engl., 2023, 62(45), 202302789 Search PubMed.
- J. Zhang, W. Liao, H. Zheng, Y. Zhang, L. Xia, B. T. Teng, J. Q. Lu, W. Huang and Z. Zhang, J. Catal., 2022, 405, 152–163 CrossRef CAS.
Footnote |
| † Electronic supplementary information (ESI) available. See DOI: https://doi.org/10.1039/d3ta06859e |
| This journal is © The Royal Society of Chemistry 2024 |

