 Open Access Article
Creative Commons Attribution 3.0 Unported Licence
Effect of Pb 6s2 lone pair on the potential flattening of fluoride-ion conduction in perovskite-type fluoride†
Naoki
Matsui
 *a,
Miwa
Murakami
 b,
Kazuhiro
Mori
 c,
Takashi
Saito
 c,
Keisuke
Shimizu
 a,
Kota
Suzuki
 a and
Ryoji
Kanno
*a
aResearch Center for All-Solid-State Battery, Institute of Innovative Research, Tokyo Institute of Technology, 4259 Nagatsuta-cho, Midori-ku, Yokohama 226-8502, Japan. E-mail: matsui.n.aa@m.titech.ac.jp; kanno.r.ab@m.titech.ac.jp
bOffice of Society-Academia Collaboration for Innovation, Kyoto University, Gokasho, , Uji, Kyoto 611-0011, Japan
cInstitute of Materials Structure Science, High Energy Accelerator Research Organization (KEK), 203-1 Shirakata, Tokai, Ibaraki 319-1106, Japan
First published on 17th January 2024
Abstract
Materials containing ns2 lone pairs exhibit superior fluoride-ion conductivity, acting as promising candidates for solid electrolytes in all-solid-state fluoride-ion batteries. However, the effect of lone pairs on fluoride-ion conduction remains unclear, especially for 6s2 in Pb2+. This study investigated the relationships between the ionic conductivity, crystal structure, and electronic structure of CsPb0.9K0.1F2.9. Cubic CsPb0.9K0.1F2.9 exhibited a low activation energy of 7.9 kJ mol−1, resulting in high conductivity at 223 K (1.0 × 10⁻³ S cm−1, bulk conductivity). 19F nuclear magnetic resonance spectroscopy confirmed facile local migration of the fluoride ions with a low activation barrier of 3.8 kJ mol−1. Theoretical calculations revealed that the fluoride ions migrated with a low migration energy via an exchange reaction between the Pb 6s lone pairs and fluoride ions. The localised lone pair in the PbF5 polyhedron stabilised the saddle-point structure and mitigated the migration barrier. These findings are beneficial for material design, providing superionic conductivity with a low migration barrier for fluoride ions as well as other anions, such as oxide and chloride.
Introduction
Materials containing cations with ns2 (n = 5, 6) lone pair electrons, such as Pb2+, Sn2+, and Bi3+, exhibit excellent macroscopic properties. Ferroelectric oxides of PbTiO3 display superior dielectric properties, and perovskite-type Na0.5Bi0.5TiO3 and layered fluorite-type PbSnF4 exhibit high anion conductivities.1–3 These cations with lone pairs possess high electronic polarisability.4 The larger the polarisation of the lattice ions in the same structure, the lower the activation barrier for ionic conduction of the carrier ion.5 Several superior anion conductors have been found in polarisable cation systems with ns2 valence electron configuration.1,6–11 Particularly, the demand for the fluoride-ion conductors as solid electrolytes for use in all-solid-state fluoride-ion batteries (ASSFIBs) has increased.12 ASSFIBs exhibit high energy density, making them suitable candidates for post-lithium-ion batteries.13 Fluoride-ion conductors exhibiting high conductivity in a wide temperature range are essential to achieve ASSFIBs with high power densities and wide operating temperature ranges. Various crystal structures are known for fluoride-ion conductors, such as fluorite-type MSnF4 (M = Pb, Ba)14,15 and Pb1−xMxF2±δ (M = K, Zr),16,17 perovskite-type APbF3 (A = Cs, Rb),9,18 and ASn2F5-type compounds (A = Na–Cs, Tl, and NH4).19 Ternary tin fluorides with open space in their structures, such as PbSnF4 and ASn2F5, exhibit high fluoride-ion conductivities above 10−4 S cm−1. The strong stereochemical activity of the Sn 5s2 lone pair leads to its localisation, resulting in an asymmetric local structure.20 Therefore, fluorides containing Sn2+ possess open spaces in their structures. The effect of the Sn2+ lone pair on the fluoride-ion conductivity has been investigated in MSnF4 (M = Pb, Ba),21 wherein the lone pair of Sn2+ pushes the F away from the tetrahedral towards octahedral sites, forming the Frenkel defect pair Fi and VF, which are interstitial F and F vacancies, respectively. In the layered fluorite-type PbSnF4, the cations stack in the [Pb–Pb–Sn–Sn] manner along the c-axis in the tetragonal lattice. G. Dénès et al. systematically investigated the coordination environment and charge density of Sn2+ using neutron diffraction and 119Sn Mössbauer spectroscopy.23,24 According to their research, the stereoactive lone pair of Sn is oriented to the [Sn–Sn] interlayer along the c-axis in tetragonal PbSnF4. The fluoride ions disappear in the [Sn–Sn] interlayer; however, they occupy the interstitial sites in the [Pb–Sn] interlayer. This arrangement enables concerted fluoride-ion migration involving interstitial sites with a low activation energy.22 In contrast, the role of the Pb 6s2 lone pair in fluoride-ion conduction remains unclear.The stereochemical activity of 6s2 in Pb2+ is relatively low compared to that of 5s2 in Sn2+.20 Consequently, no defect structure is present in the lead fluoride system, and the effect of the 6s2 lone pair on the conductivity is overlooked. Cubic perovskite-type CsPbF3, in which Cs+ and Pb2+ occupy A- and B-sites, respectively, exhibit high ionic conductivity on the order of 10−5 S cm−1 at room temperature.9 Recently, exceptionally high ionic conductivity of the order 10−3 S cm−1 was reported for CsPb0.9K0.1F2.9.25 The F vacancy introduced via the substitution of K+ at the host Pb2+ site triggered fast fluoride-ion conduction. However, the detailed conduction mechanism in addition to the effect of the lone pair remains unclear. This study investigated the ionic conductivities and crystal structures of CsPbF3 and CsPb0.9K0.1F2.9 in detail using impedance spectroscopy and neutron diffraction measurements. Additionally, the F dynamics was studied using nuclear magnetic resonance (NMR) spectroscopy. Furthermore, the effect of the lone pair of Pb2+ ions on the high fluoride-ion conductivity was elucidated using first-principles calculations. This study provides new insights into the mechanism through which migration energies are mitigated in Pb-perovskite systems.
Experimental
Synthesis
CsPbF3 and CsPb0.9K0.1F2.9 were prepared via mechanochemical synthesis. The starting materials, CsF, PbF2, and KF, were weighed in an Ar-filled glove box and subjected to mechanochemical milling (zirconia pot with a volume of 45 mL and 18 balls of diameter 10 mm) in an Ar atmosphere for 12 h at 600 rpm using a planetary ball mill (Fritsch, P-7). The obtained sample was enclosed in an airtight Cu capsule under an Ar atmosphere and then annealed at 473 K for 12 h.Characterisation
The ionic conductivities were determined using alternating current (AC) impedance spectroscopy. The sample was compressed to a diameter of 10.0 mm, thickness of approximately 1 mm, and relative density of over 90% under a pressure of 340 MPa. The Pt sheets were used as current collectors. The AC impedance measurements were performed using a frequency response analyser (Keysight E4990A) at an applied voltage of 10 mV and a frequency range of 100 MHz–20 Hz in the 423–173 K temperature range. The activation energy (Ea) was obtained using the Arrhenius equation, σ = A0/T![[thin space (1/6-em)]](https://www.rsc.org/images/entities/char_2009.gif) exp(–Ea/kT), where A0, k, and T are pre-exponential factor, Boltzmann constant, and absolute temperature, respectively.
exp(–Ea/kT), where A0, k, and T are pre-exponential factor, Boltzmann constant, and absolute temperature, respectively.
Synchrotron X-ray diffraction data were collected at the BL02B2 beamline within the SPring-8 facility.26 Diffraction data were collected in the 2–75° 2θ range using a Debye–Scherrer diffraction camera. Neutron powder diffraction (NPD) data were acquired using a time-of-flight neutron powder diffractometer (BL09 SPICA) at the J-PARC facility.27 The crystal structures were refined via Rietveld analysis using the computer programs Z-Rietveld and RIETAN-FP.28,29 The nuclear scattering length density distribution was analysed through the maximum entropy method (MEM) using the Z-MEM code.30 The NMR measurements were performed using a JEOL ECA600 NMR spectrometer at 14 T with the triply tuned magic-angle spinning (MAS) probe (Agilent Technologies Inc.) with a 1.6 mm rotor. The resonance frequencies for 19F and 207Pb were 564 and 126 MHz, respectively. The 19F chemical shifts were calibrated in ppm relative to CCl3F, employing the 19F chemical shift for C6F6 (−163 ppm (ref. 31)) as an external reference. The 207Pb chemical shifts were calibrated in ppm relative to a saturated aqueous solution of Pb(NO3)2. The temperature-calibration experiment was conducted using 207Pb NMR of Pb(NO3)2.32 The NMR spectra of 19F and 207Pb were observed using a single pulse with the Hahn echo under MAS at 35 kHz. Application of 19F decoupling showed no appreciable narrowing effects on the 207Pb spectra (not shown). The two-dimensional (2D) exchange NMR experiment was performed with the conventional three-pulse sequence.33 The spin–lattice relaxation time (T1) was obtained using the saturation-recovery method under MAS. The 207Pb T1 was also measured at 4.7 T by utilizing an OPENCORE spectrometer.34
Calculation
First-principles density functional theory calculations were performed using the projector-augmented wave method35 and the PBEsol functional36 as implemented in the Vienna Ab initio Simulation Package code.37,38 Firstly, geometrical optimisation of the unit cell of CsMF3 (M = Pb, Sr) was conducted. The energy cutoff was set to 520 eV for structural optimisation. The Cs 5s5p6s, Pb 6s6p, Sr 4s4p5s, and F 2s2p orbitals were treated as valence states. The total energies and forces converged to less than 1 × 10⁻⁵ eV, and the force criterion was 0.01 eV Å−1. Nudged elastic band (NEB) calculation, the most convenient method for finding the saddle point and path that requires the least energy, was performed for the F− vacant supercell with an energy cutoff at 400 eV. Five intermediate points were considered in the NEB calculations. A 2 × 2 × 2 supercell with a gamma-centred 2 × 2 × 2 k-mesh was used. The F− vacancy was charge-compensated by removing eight electrons from the valence electrons in the supercell. The densities of states (DOSs) for the initial, intermediate, and endpoint structures in the NEB calculations were determined using the hybrid exchange–correlation functional (HSE06).39–41 The partial electron density was analysed for states between −10 eV and the Fermi level. The crystal structures and electron densities were visualised using visualisation for electronic and structural analysis.42Results and discussion
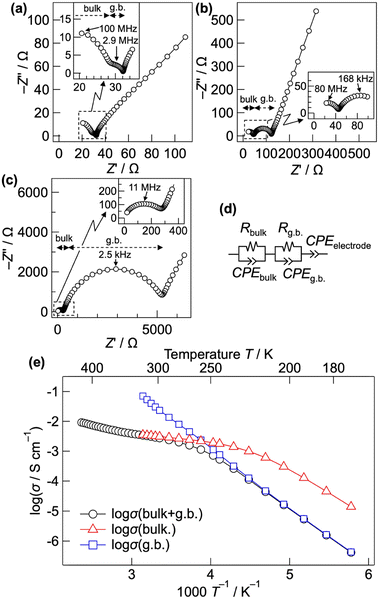
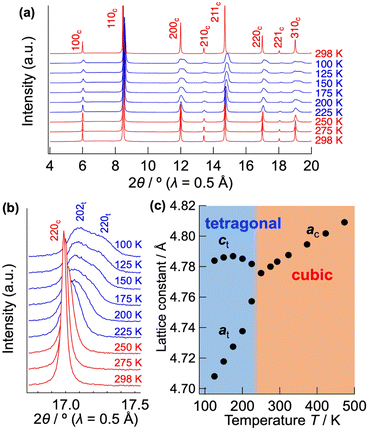
Fig. 1(a)–(c) show the Nyquist plots of CsPb0.9K0.1F2.9 at 298, 248, and 203 K, respectively. Two semicircles with capacitances of 3 × 10⁻¹¹ and 1 × 10⁻⁸ F, corresponding to the bulk and grain-boundary resistances, respectively, are observed in the high frequency region. The bulk and grain boundary resistances were calculated by fitting the Nyquist plots to the equivalent circuit, as shown in Fig. 1(d). The total ionic conductivity was obtained by taking the sum of the bulk and grain boundary resistances. Above 323 K, the total conductivity was calculated solely from the bulk resistance owing to the difficult separation of the grain boundary resistance. Fig. 1(e) shows the Arrhenius plot of the ionic conductivity of CsPb0.9K0.1F2.9. Table S1† summarises the conductivities and activation energies of the bulk, grain boundary, and total conductivities. The total conductivity is 2.7 × 10⁻³ S cm−1 at 298 K, which is comparable to the previously reported value of 1.2 × 10⁻³ S cm−1.25 A low activation energy of 10.89(4) kJ mol−1 for the total conductivity is observed in the 298–348 K range, similar to those of the superionic conductors α-Ag3SI (13–19 kJ mol−1)43,44 and PbSnF4 (10 kJ mol−1).1 At temperatures below 258 K, the activation energy increases to 37.62(17) kJ mol−1, considerably decreasing the total conductivity. The increased activation energy can be explained by the change of the dominant component of the resistance from the bulk to the grain-boundary resistance, as shown in Fig. 1(b) and (c). The bulk conductivity is 3.1 × 10⁻³ S cm−1 at 298 K, with an exceptionally low activation energy of 7.92(9) kJ mol−1. Owing to this low activation energy, high ionic conductivity is maintained even at temperatures lower than room temperature, with a bulk conductivity of 1.0 × 10⁻³ at 223 K. At temperatures below 233 K, the activation energy of the bulk conductivity spontaneously increases to 31.8(5) kJ mol−1. This increase is attributed to the displacive phase transition from a cubic to a tetragonal system, as discussed later. In contrast, the grain boundary conductivity consistently follows the Arrhenius-law in the wide temperature range of 173–318 K, yielding an activation energy of 40.0(2) kJ mol−1. For comparison, the ionic conductivity of CsPbF3 was evaluated, as shown in Fig. S1.† The total conductivity is 2.1 × 10⁻⁴ S cm−1 at 298 K, which is one order of magnitude lower than that of CsPb0.9K0.1F2.9. The activation energy is 7.1(2) kJ mol−1 for the bulk conductivity in the 193–233 K temperature range. The low activation energies of CsPbF3 and CsPb0.9K0.1F2.9 reflect an intrinsically low migration barrier for the fluoride-ion conduction in CsPbF3, whereas the enhanced conductivity of CsPb0.9K0.1F2.9 is attributable to the increased carrier concentration, i.e. F vacancies.Fig. 2(a) shows the low temperature XRD patterns of CsPb0.9K0.1F2.9. With decreasing temperature, the symmetry changes at 225 K, represented by splitting of the hh0 reflection into two (Fig. 2(b)). Fig. 2(c) depicts the temperature dependence of the lattice parameters. Cubic CsPb0.9K0.1F2.9 exhibits monotonic thermal expansion in the 250–450 K temperature range. Conversely, it undergoes a phase transition to the tetragonal phase associated with a contraction of the a-axis and an expansion of the c-axis from 225 to 175 K. Fig. S2(a)† presents the Rietveld refinement results for tetragonal CsPb0.9K0.1F2.9 at 200 K. In tetragonal CsPb0.9K0.1F2.9 with a space group of P4mm, the B-site Pb2+ is marginally displaced from the PbF6 octahedral centre (z(Pb2+) ≈ 0.47), elongating the c-axis (a ≈ 4.71 Å, c ≈ 4.78 Å, Fig. S2(b) and Table S2†). Off-centred Pb2+ has been previously observed in other perovskite halides45 owing to the localised 6s2 lone pair of Pb2+. Additionally, the P4mm space group is consistent with that of ferroelectric PbTiO3. In contrast, the bare CsPbF3 undergoes a phase transition from a cubic to a rhombohedral structure at 185 K, featuring PbF6 octahedra tilting.9 This phase transition is supported by a sudden decrease in the ionic conductivity from 188 to 183 K for CsPbF3 (Fig. S1†). However, such a transition is absent in CsPb0.9K0.1F2.9. The different low temperature forms, tetragonal CsPb0.9K0.1F2.9 and rhombohedral CsPbF3, can be attributed to fluoride ion vacancies. Given the presence of open space in the structure, the Pb lone pair preferentially localises to fill this open space.46 The fluoride-ion vacancy in CsPb0.9K0.1F2.9 can induce the stereochemical activity of Pb 6s, stabilising the tetragonal form by orienting the lone pair along its c-axis while displacing Pb2+ along the opposite direction. The tetragonal form possesses two crystallographically non-equivalent F sites, resulting in an anisotropic energy landscape for fluoride-ion conduction. In contrast, within the cubic structure of CsPb0.9K0.1F2.9, the lone pair of Pb is expected to be randomly oriented, providing an isotropic conduction pathway. This displacive phase transition from a cubic to a tetragonal system in CsPb0.9K0.1F2.9 is responsible for the spontaneous change in the activation energy of the bulk conductivity below 233 K (Fig. 1(e)).
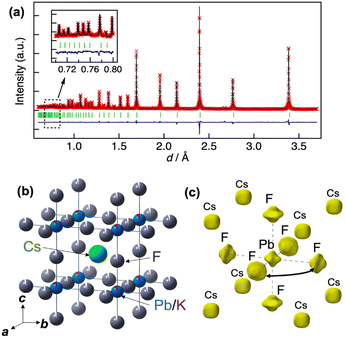
Fig. 3(a) shows the Rietveld analysis results for the neutron powder diffraction data for cubic CsPb0.9K0.1F2.9 (see Table 1 for the structural parameters). The presence of 9% K at the Pb site and approximately 3% vacancies at the F site ensure charge compensation of the F vacancies for K substitution at the Pb site. The atomic displacement parameter (ADP) of F is large, Ueq = 0.0835(2) Å2. Additionally, the ADP of F exhibits remarkable anisotropy, with U22 = 0.0990(3) and U11 = 0.0525(4) Å2. The large U22 value for F corresponds to a substantial displacement perpendicular to the Pb–F bond. The large U22 value is confirmed for un-doped CsPbF3 (see Fig. S3†), which features an intrinsically flat energy landscape for F towards neighbouring sites in CsPbF3. Fig. 3(c) presents the nuclear density distribution obtained using MEM. MEM analysis reproduces the wide distribution of F perpendicular to the Pb–F bond direction. No other nuclear densities corresponding to interstitial F are observed. The nuclear density for the Pb site shows a non-spherical shape spreading towards neighbour F sites, whereas Pb exhibits a spherical shape in the density map of CsPbF3 (Fig. S3(c)†). The non-spherical shape of the Pb site in CsPb0.9K0.1F2.9 could be attributed to the static disorder of Pb owing to the K+-substitution, which was detected in the NMR study discussed later. In addition to the presence of vacancies at the F site, the broad distribution of F towards adjacent sites suggests that fluoride ions diffuse via single hopping between adjacent F sites along the edges of the PbF6 octahedron.
| Atom | Site | g | x | y | z | U eq/Å2 | U 11/Å2 | U 22/Å2 | U 33/Å2 |
|---|---|---|---|---|---|---|---|---|---|
a Unit cell: cubic Pm![[3 with combining macron]](https://www.rsc.org/images/entities/char_0033_0304.gif) m (221); a = b = c = 4.788192(6) Å, Rwp = 3.51%, Re = 2.19%, Rp = 3.11%, RB = 4.21%, RF = 6.28%, goodness of fit S = Rwp/Re = 1.60. m (221); a = b = c = 4.788192(6) Å, Rwp = 3.51%, Re = 2.19%, Rp = 3.11%, RB = 4.21%, RF = 6.28%, goodness of fit S = Rwp/Re = 1.60.
|
|||||||||
| Cs | 1b | 1 | 0.5 | 0.5 | 0.5 | 0.03932(15) | 0.03932(15) | =U11(Cs) | =U11(Cs) |
| Pb | 1a | 0.910(2) | 0 | 0 | 0 | 0.019105(10) | 0.019105(10) | =U11(Pb) | =U11(Pb) |
| K | 1a | =1 − g(Pb) | 0 | 0 | 0 | =Ueq(Pb) | =U11(Pb) | =U11(Pb) | =U11(Pb) |
| F | 3d | 0.9701(7) | 0.5 | 0 | 0 | 0.0835(2) | 0.0525(4) | 0.0990(3) | =U22(F) |
To explore the origin of the low activation energy for fluoride-ion conduction in CsPbF3, NEB calculations were performed. Fig. 4 shows the migration barrier of fluoride ions between adjacent F sites through vacancy-mediated hopping in cubic CsPbF3 obtained using NEB calculations. The estimated migration barrier is 8 kJ mol−1, which is close to the experimental value, Ea = 7.1(2) kJ mol−1. For comparison, the migration barrier of fluoride ions for CsSrF3 was calculated, in which Sr2+ at the B site has a similar ionic radius (rSr2+ = 1.18 Å and rPb2+ = 1.19 Å)47 and lacks ns2 electrons within the valence electron configuration (Fig. S4†). CsSrF3 exhibits a relatively high migration barrier of 35 kJ mol−1, highlighting the effect of ns2 electrons in the B-site cations, which facilitate reduction of the migration barrier.
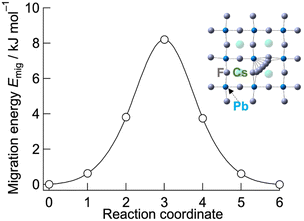 | ||
| Fig. 4 Migration energy of fluoride ions in cubic CsPbF3. The migrating fluoride ions corresponding to the reaction coordinate are depicted in the inset. | ||
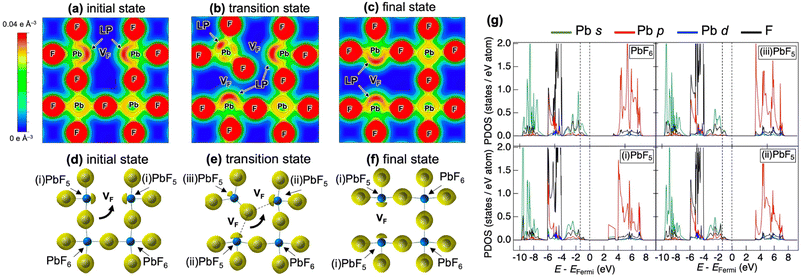
Fig. 5 shows the partial density of states (PDOS) for CsPbF3, including one F− vacancy corresponding to the initial state of the NEB calculation. The valence band comprises three regions. The first region near the Fermi level primarily comprises the F 2p orbital with the hybridisation of the Pb 6s orbital. The other F 2p orbitals are located below −4 eV, partly hybridising the Cs 5p and Pb 6p orbitals in the second region. The third region around −8 eV encompasses contributions from Pb 6s and Cs 5p orbitals, in addition to a small amount of F. The partial electron densities were analysed for states between −10 eV and the Fermi level to gain deeper insight into the role of the lone pair in the conduction mechanism. Fig. 6(a)––(f) present the cross-sectional contour and isosurface plots, respectively, of the partial electron density during fluoride-ion migration in CsPbF3. The stereochemical activity of Pb 6s depends on its coordination environment. In the initial structure, the electron density of Pb in the PbF5 square pyramid adjacent to the F vacancy is asymmetric and localised in the direction of the F vacancy (VF). In contrast, the electron density of Pb in the PbF6 octahedral region, which is not adjacent to the F vacancy, is symmetrical and delocalised. Walsh reported similar selectivity for the stereochemical activity of Pb 6s electrons, where Pb 6s in the PbO6 octahedra of rock salt-type PbO was delocalised.46 Conversely, Pb 6s in the distorted PbO8 hexahedra is asymmetrically localised towards open space in litharge-type PbO. Similarly, Pb 6s becomes stereochemically active when five F atoms coordinate with Pb in F-defective CsPbF3, localising the 6s lone pair towards open space at F-vacant sites. During the transition state, one fluoride ion in the PbF6 octahedron cleaves the Pb–F bond and passes through a bottleneck comprising 1 × Pb and 2 × Cs. The former delocalised Pb electron density in the PbF6 octahedra localises towards the new VF created by the cleavage of the Pb–F bond. Furthermore, the electron density of Pb in the PbF5 trigonal bipyramid labelled as (iii) in Fig. 6(e) is marginally localised in the opposite direction to the travelling F. In the endpoint structure, the travelling F is associated with the PbF5 square pyramid to form a PbF6 octahedron, delocalising the Pb electron density. These results confirm that fluoride ions are carried by the exchange reaction between the fluoride ions and the Pb 6s lone pair localised in the VF. Fig. 6(g) shows the site-projected PDOS of the PbF6 octahedra and three PbF5 polyhedra: (i) and (ii) square pyramids and (iii) a trigonal bipyramid. The region near the Fermi level of PbF6 is occupied by Pb 6s and F 2p electrons. In contrast, in the PbF5 polyhedron, the DOS of Pb shifts to the lower-energy side (as indicated by the dashed line), stabilising the Pb 6s state and PbF5 geometry. One VF and two PbF5 geometries exist in the initial structure, but two VF and three PbF5 geometries are present in the transition structure. The three stable PbF5 polyhedral geometries in the transition state stabilise the structure and reduce the migration barrier of fluoride ions.
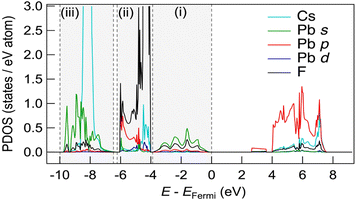 | ||
| Fig. 5 PDOS of the supercell of CsPbF3 with an F-defective structure. Three valence band regions are surrounded by dashed vertical lines. | ||
Further, high resolution 19F/207Pb NMR spectroscopy was used to explore the F dynamics correlated with Pb in CsPb0.9K0.1F2.9. Fig. 7 compares the 19F and 207Pb MAS NMR spectra of CsPbF3 and CsPb0.9K0.1F2.9. The narrower 19F line shape for CsPb0.9K0.1F2.9 indicates efficient motional narrowing, which is consistent with its better ionic conductivity. The 207Pb spectrum of CsPbF3 is a simple Lorentzian reflecting better local symmetry in the unit cell than that of the CsPb0.9K0.1F2.9, which exhibits substantial broadening. The broad line shape does not depend on temperature up to 100 °C (not shown). To explore the nature of this broadening, a 2D exchange spectrum at 80 °C with a mixing time of 50 ms was obtained (Fig. 8), in which only the narrow diagonal signal exists. This finding indicates that the broad linewidth in the 1D spectrum is a sum of an individual sharp signal with its isotropic chemical shift distributed over 1000–1800 ppm, approximately. Further, the absence of off-diagonal signals indicates that exchange among these broadly distributed 207Pb signals is less evident in 50 ms at 80 °C. The linewidth of each 207Pb spin isochromat is separately observed via the Hahn-echo sequence to be 470 Hz (T2 ∼ 0.68(3) ms), which is consistent with the narrow diagonal signal in Fig. 8. The broad distribution of the isotropic chemical shift of 207Pb in CsPb0.9K0.1F2.9 is attributed to the variation of the local structure of the Pb atom owing to 10% K+ substitution on the Pb site. The distortion of the Pb site is observed as non-spherical nuclear density obtained using the MEM analysis (Fig. 3(c)). The 207Pb chemical shift is sensitive to its local structure, leading to the wide chemical shift range from −6000 to 6000 ppm.48
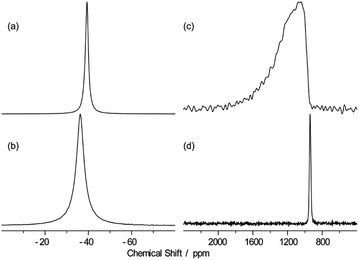 | ||
| Fig. 7 19F (a and b) and 207Pb (c and d) MAS spectra of CsPbF3 (b and d) and CsPb0.9K0.1F2.9 (a and c) with the MAS frequency of 25 kHz at 40 °C. | ||
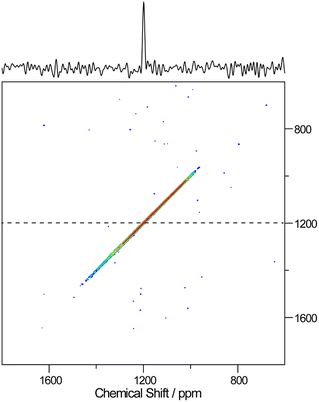 | ||
| Fig. 8 207Pb–207Pb 2D-exchange spectrum of CsPb0.9K0.1F2.9 obtained at 80 °C with a mixing time of 50 ms. The cross-section spectrum at 1200 ppm is represented by the dashed line at the top. | ||
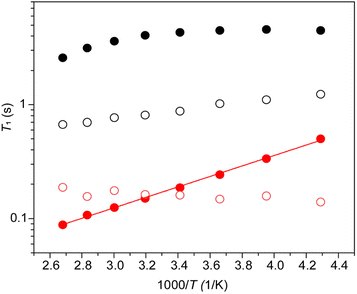
The absence of exchange among the different Pb sites in CsPb0.9K0.1F2.9 as confirmed by the 2D-exchange NMR experiment establishes that the broad distribution of the chemical shift of 207Pb is due to the variation of the configuration between Pb and immobile K rather than mobile F (or F vacancy). The dynamics of Pb and F by T1 were examined further. At first, the anisotropy of 207Pb-T1 for the broadly distributed peaks of CsPb0.9K0.1F2.9 was ignored and 207Pb-T1 was obtained from the recovery curve for the whole signal. Fig. 9 shows the temperature dependence of T1 of 19F and 207Pb in CsPbF3 and CsPb0.9K0.1F2.9. The 19F-T1 of CsPbF3 shows that fluoride-ion motion is too slow to affect T1 below 20 °C. The 10% K+ substitution reduces the 19F-T1 of CsPb0.9K0.1F2.9 by more than one order of magnitude, indicating better fluoride-ion mobility in CsPb0.9K0.1F2.9. The slope of log(T1) vs. 1/T gives an activation energy of 3.8(1) kJ mol−1, which is much smaller than the value of 7.92(9) kJ mol−1 obtained from the temperature dependence of the bulk ionic conductivity in the similar temperature range. It appears that the motion governing 19F T1 is local with smaller activation energies. The T1 of immobile 207Pb is smaller than that of mobile 19F for CsPbF3 and 207Pb-T1 ∼ 19F-T1 for CsPb0.9K0.1F2.9. Short T1 has been reported for 119Sn spin in PbSnF4,49 in which the 5s2 lone pair of Sn2+ is stereochemically active and the fluctuating chemical-shielding anisotropy (CSA) invokes the relaxation. To confirm that the 207Pb-T1 is governed by the fluctuation of CSA, the 207Pb-T1 of CsPb0.9K0.1F2.9 was observed at 4.7 T. The observed 207Pb-T1 at 40 °C is 0.43 s, which is longer than that observed at 14 T (0.16 s). The ratio 0.43/0.16 is close to the ratio of the strength of the static field (14/4.7), confirming the relaxation mechanism being the fluctuation of CSA. The CSA relaxation is consistent with the exchange model among the fluoride ions and the F vacancies, as illustrated in Fig. 6(d)–(f). It should be mentioned here that a simple F–F mutual exchange around a 207Pb spin does not affect the CSA of the 207Pb spin and the fluctuation of CSA is only caused by the migration of F vacancies.49 The temperature dependence of the 207Pb-T1 of CsPb0.9K0.1F2.9 is limited (Fig. 9), which could be ascribed to a broad distribution of the correlation time of CSA fluctuation.
Further, the anisotropy of 207Pb-T1 of CsPb0.9K0.1F2.9 was investigated. The broad 207Pb signal at 40 °C was separated into two components: 800–1200 ppm and 1200–1700 ppm. The obtained 207Pb-T1 values were 0.174(8) s for the former and 0.057(6) s for the latter. As the shorter T1 value indicates a larger CSA, in this case, the observed high frequency 207Pb shift for CsPb0.9K0.1F2.9 compared to that of the CsPbF3 peak correlates with the size of CSA. This shift of 207Pb towards the high frequency region represents a diverse configuration against the 10% K substitution at the Pb sites because the 2D exchange spectrum shows no exchange between the different 207Pb sites (Fig. 8). The large CSA for the high frequency side of 207Pb suggests that the migration of F vacancies is considerably pronounced around Pb, yielding a more distorted local structure near K in CsPb0.9K0.1F2.9.
Conclusion
Cubic CsPb0.9K0.1F2.9 exhibits an exceptionally low activation energy of 7.9 kJ mol−1 for fluoride-ion conductivity. A combination of structural analysis using NPD data and NEB calculations elucidated the conduction mechanism as single F hopping via neighbouring vacancies. 19F and 207Pb NMR studies indicated facile migration of the fluoride ions involving F vacancies. The electron density analysis suggested that the fluoride ions migrated via an exchange reaction between the Pb 6s lone pairs and fluoride ions. Furthermore, the origin of the mitigated migration barrier was revealed: the localised lone pair in the PbF5 polyhedron stabilised the saddle-point structure. The low migration energy enabled the retention of high conductivity at 223 K (1.0 × 10⁻³ S cm−1 for bulk conductivity). These findings provide valuable insights into material design for achieving superior ionic conductivity with a low migration barrier for fluoride as well as other anions, such as oxide and chloride.Author contributions
R. K. designed and directed the project. K. M. and T. S. conducted neutron powder diffraction measurement. M. M. conducted NMR measurement. N. M. conducted first-principles calculations, synchrotron X-ray diffraction, and impedance measurements. N. M. wrote the manuscript in consultation with M. M., K. S., K. S., and R. K. All authors discussed the results and contributed to the final manuscript.Conflicts of interest
There are no conflicts to declare.Acknowledgements
This study was conducted using grants from two projects (JPNP16001 and JPNP21006) commissioned by the New Energy and Industrial Technology Development Organization (NEDO). The synchrotron XRD experiments were performed as approved by the Japan Synchrotron Radiation Research Institute (JASRI) (Proposal No. 2020A1645). Neutron diffraction studies were conducted as part of a project approved by the Neutron Scattering Program Advisory Committee of the Institute of Materials Structure Science and KEK (Proposal No. 2019S10). The computational sources of the TSUBAME3.0 supercomputer at the Tokyo Institute of Technology were used. The authors thank Mr Sugihara at the Design and Manufacturing Division, Open Facility Centre, Tokyo Institute of Technology, for manufacturing the sample holder.References
- R. Kanno, S. Nakamura, S. Kawamura and Y. Kawamoto, Solid State Ionics, 1992, 51, 53–59 CrossRef CAS.
- M. Li, M. J. Pietrowski, R. A. De Souza, H. R. Zhang, I. M. Reaney, S. N. Cook, J. A. Kilner and D. C. Sinclair, Nat. Mater., 2014, 13, 31–35 CrossRef CAS PubMed.
- R. E. Cohen, Nature, 1992, 358, 136–138 CrossRef CAS.
- R. D. Shannon and R. X. Fischer, Phys. Rev. B: Condens. Matter Mater. Phys., 2006, 73, 235111–235128 CrossRef.
- M. A. Kraft, S. P. Culver, M. Calderon, F. Bocher, T. Krauskopf, A. Senyshyn, C. Dietrich, A. Zevalkink, J. Janek and W. G. Zeier, J. Am. Chem. Soc., 2017, 139, 10909–10918 CrossRef CAS PubMed.
- M. W. Shafer, G. V. Chandrashekhar and R. A. Figat, Solid State Ionics, 1981, 5, 633–636 CrossRef CAS.
- F. Abraham, J. C. Boivin, G. Mairesse and G. Nowogrocki, Solid State Ionics, 1990, 40–1, 934–937 CrossRef.
- P. Shuk, H. D. Wiemhofer, U. Guth, W. Gopel and M. Greenblatt, Solid State Ionics, 1996, 89, 179–196 CrossRef CAS.
- P. Berastegui, S. Hull and S. G. Eriksson, J. Phys.: Condens.Matter, 2001, 13, 5077–5088 CrossRef CAS.
- M. Uno, M. Onitsuka, Y. Ito and S. Yoshikado, Solid State Ionics, 2005, 176, 2493–2498 CrossRef CAS.
- L. N. Patro and K. Hariharan, Solid State Ionics, 2013, 239, 41–49 CrossRef CAS.
- M. A. Reddy and M. Fichtner, J. Mater. Chem., 2011, 21, 17059–17062 RSC.
- F. Gschwind, G. Rodriguez-Garcia, D. J. S. Sandbeck, A. Gross, M. Weil, M. Fichtner and N. Hormann, J. Fluorine Chem., 2016, 182, 76–90 CrossRef CAS.
- K. Mori, A. Mineshige, T. Emoto, M. Sugiura, T. Saito, K. Namba, T. Otomo, T. Abe and T. Fukunaga, J. Phys. Chem. C, 2021, 125, 12568–12577 CrossRef CAS.
- M. Murakami, F. Fujisaki and Y. Morita, Solid State Ionics, 2020, 355, 115398 CrossRef CAS.
- S. Hull and P. Berastegui, J. Phys.: Condens.Matter, 1999, 11, 5257–5272 CrossRef CAS.
- V. Y. Kavun, A. B. Slobodyuk, E. A. Tararako, E. Y. Mikhteeva, V. K. Goncharuk, N. F. Uvarov and V. I. Sergienko, Inorg. Mater., 2005, 41, 1228–1235 CrossRef CAS.
- Y. Yamane, K. Yamada and K. Inoue, Solid State Ionics, 2008, 179, 605–610 CrossRef CAS.
- G. Denes, T. Birchall, M. Sayer and M. F. Bell, Solid State Ionics, 1984, 13, 213–219 CrossRef CAS.
- A. Walsh, D. J. Payne, R. G. Egdell and G. W. Watson, Chem. Soc. Rev., 2011, 40, 4455–4463 RSC.
- S. F. Matar and J. Galy, Solid State Sci., 2016, 52, 29–36 CrossRef CAS.
- F. Fujisaki, K. Mori, M. Yonemura, Y. Ishikawa, T. Kamiyama, T. Otomo, E. Matsubara and T. Fukunaga, J. Solid State Chem., 2017, 253, 287–293 CrossRef CAS.
- T. Birchall, G. Dénès, K. Ruebenbauer and J. Pannetier, Hyperfine Interact., 1986, 29, 1331–1334 CrossRef CAS.
- G. Dénès, M. C. Madamba, H. Merazig, A. Muntasar and Z. Zhu, AIP Conf. Proc., 2016, 1781, 020006 CrossRef.
- J. Z. Wang, J. P. Hao, C. M. Duan, X. C. Wang, K. Wang and C. Ma, Small, 2022, 18, 2104508 CrossRef CAS PubMed.
- S. Kawaguchi, M. Takemoto, K. Osaka, E. Nishibori, C. Moriyoshi, Y. Kubota, Y. Kuroiwa and K. Sugimoto, Rev. Sci. Instrum., 2017, 88, 085111 CrossRef CAS PubMed.
- M. Yonemura, K. Mori, T. Kamiyama, T. Fukunaga, S. Torii, M. Nagao, Y. Ishikawa, Y. Onodera, D. S. Adipranoto, H. Arai, Y. Uchimoto and Z. Ogumi, J. Phys.: Conf. Ser., 2014, 502, 012053 CrossRef.
- R. Oishi, M. Yonemura, Y. Nishimaki, S. Torii, A. Hoshikawa, T. Ishigaki, T. Morishima, K. Mori and T. Kamiyama, Nucl. Instrum. Methods Phys. Res., Sect. A, 2009, 600, 94–96 CrossRef CAS.
- F. Izumi and K. Momma, Solid State Phenom., 2007, 130, 15–20 CAS.
- Y. Ishikawa, J. R. Zhang, R. Kiyanagi, M. Yonemura, T. Matsukawa, A. Hoshikawa, T. Ishigaki, S. Torii, R. Oishi-Tomiyasu and T. Kamiyama, Phys. B, 2018, 551, 472–475 CrossRef CAS.
- W. S. Brey and M. L. Brey, in Encyclopedia of Nuclear Magnetic Resonance, John Wiley and Sons, Inc., Chichester, 1996, vol. 3, pp. 2063–2071 Search PubMed.
- A. Bielecki and D. P. Brum, J. Magn. Reson., Ser. A, 1995, 116, 215–220 CrossRef CAS.
- J. Jeener, B. H. Meier, P. Bachmann and R. P. Ernst, J. Chem. Phys., 1979, 71, 4546–4563 CrossRef CAS.
- K. Takeda, J. Magn. Reson., 2008, 192, 218–229 CrossRef CAS PubMed.
- P. E. Blochl, Phys. Rev. B: Condens. Matter Mater. Phys., 1994, 50, 17953–17979 CrossRef PubMed.
- J. P. Perdew, A. Ruzsinszky, G. I. Csonka, O. A. Vydrov, G. E. Scuseria, L. A. Constantin, X. L. Zhou and K. Burke, Phys. Rev. Lett., 2008, 100, 136406 CrossRef PubMed.
- G. Kresse and J. Furthmuller, Phys. Rev. B: Condens. Matter Mater. Phys., 1996, 54, 11169–11186 CrossRef CAS PubMed.
- G. Kresse and J. Hafner, Phys. Rev. B: Condens. Matter Mater. Phys., 1993, 48, 13115–13118 CrossRef CAS PubMed.
- J. Heyd, G. E. Scuseria and M. Ernzerhof, J. Chem. Phys., 2003, 118, 8207–8215 CrossRef CAS.
- J. Heyd, G. E. Scuseria and M. Ernzerhof, J. Chem. Phys., 2006, 124, 219901–219906 CrossRef.
- J. Paier, M. Marsman, K. Hummer, G. Kresse, I. C. Gerber and J. G. Angyan, J. Chem. Phys., 2006, 125, 249901–249902 CrossRef.
- K. Momma and F. Izumi, J. Appl. Crystallogr., 2008, 41, 653–658 CrossRef CAS.
- M. Gombotz, I. Hanghofer, S. Eisbacher-Lubensky and H. M. R. Wilkening, Solid State Sci., 2021, 118, 106680 CrossRef CAS.
- A. Kojima, K. Tozaki, T. Ogawa, T. Takizawa and T. Kanashiro, J. Phys. Soc. Jpn., 1988, 57, 176–187 CrossRef CAS.
- C. C. Stoumpos, C. D. Malliakas and M. G. Kanatzidis, Inorg. Chem., 2013, 52, 9019–9038 CrossRef CAS PubMed.
- A. Walsh and G. W. Watson, J. Solid State Chem., 2005, 178, 1422–1428 CrossRef CAS.
- R. D. Shannon, Acta Crystallogr., Sect. A: Found. Adv., 1976, 32, 751–767 CrossRef.
- C. Brevard and P. Granger, Handbook of High Resolution Multinuclear NMR, Wiley, New York, 1981 Search PubMed.
- M. Murakami, Y. Morita and M. Mizuno, J. Phys. Chem. C, 2017, 121, 2627–2634 CrossRef CAS.
Footnote |
| † Electronic supplementary information (ESI) available. See DOI: https://doi.org/10.1039/d3ta06367d |
| This journal is © The Royal Society of Chemistry 2024 |

