
A graphene oxide decorated BZT–CNF composite through hybrid microwave processing: an advanced multifunctional material for superior microwave shielding applications†
Chinmay Chandan
Parhi
 a,
Avanish Babu
Thirumalasetty
a,
Ajit Raymond
James
b,
Yogesh Kumar
Choukiker
c and
Madhuri
Wuppulluri
*d
a,
Avanish Babu
Thirumalasetty
a,
Ajit Raymond
James
b,
Yogesh Kumar
Choukiker
c and
Madhuri
Wuppulluri
*d
aDepartment of Physics, School of Advanced Sciences, Vellore Institute of Technology, Vellore, 632014, Tamil Nadu, India
bCeramic Composite Group, Defense Metallurgical Research Laboratory, Hyderabad, 500058, Telengana, India
cSchool of Electronics Engineering, Vellore Institute of Technology, Vellore, 632014, Tamil Nadu, India
dCenter for Functional Materials, Vellore Institute of Technology, Vellore, 632014, Tamil Nadu, India. E-mail: madhuriw12@hotmail.com
First published on 19th December 2023
Abstract
The flourishing electronic industries and advanced technologies have created an emerging issue by escalating the level of electromagnetic radiation in the environment. In the current investigation, a sophisticated, cutting-edge magnetoelectric composite material is designed and developed in contrast to its counterparts, and exhibits excellent electromagnetic interference shielding performance. A novel multiferroic material composed of ferroelectric BaZr0.2Ti0.8O3 (BZT) and ferromagnetic Co0.75Ni0.25Fe2O4 (CNF) with graphene oxide decoration is developed through a novel microwave sintering technique. The relative permittivity, AC conductivity, magnetic coercivity, and polarization of the composites are all found to be enhanced by the incorporation of graphene oxide into the composite. A high relative permittivity of more than 50k at 10 kHz is observed in the magnetoelectric composite along with relaxor behaviour at 1.5 wt% graphene oxide reinforcement. The magnetoelectric composite's energy storage capacity has been found to be improved by the addition of GO reinforcement. Impedance studies revealed the Debye relaxation behavior for the BZT–CNF composite and composite with 0.5 wt% GO. The performance of the shielding against electromagnetic interference is evaluated in the X-band frequency range. Furthermore, the BZT–CNF composite has the lowest reflection loss (RL) of −54.9 dB with a maximum total shielding efficiency of 66.8 dB, whereas the magnetoelectric composite with 1.5 wt% GO exhibits improved microwave attenuation with the highest specific shielding efficiency of 75.03 dB cm2 g−1 and the maximum total shielding efficiency of 95.44 dB. The discovered material has excellent microwave absorption and shielding properties, making it very useful for radar and stealth technologies in the military, as well as in the electronics, medical, and electronic industries.
1 Introduction
The advancement of electromagnetic (EM) wave technology within the gigahertz range has significantly accelerated the development of society. This led to a corresponding rise in the utilization of electronic devices, resulting in an increased level of radiation exposure. Recently, various technologies utilizing electromagnetic waves such as 5G communication and radar detection have revolutionized people's lives.1,2 While the benefits of EM wave technology are evident, some challenges must be overcome. Electromagnetic interference and leakage affect instant messaging and networking.3,4 Moreover, strong electromagnetic radiation has been linked to negative health and environmental outcomes, particularly for the nervous system. Such radiation may overheat cells and disrupt the body's electromagnetic field.5 It is well known that EM wave pollution causes anxiety, headaches, and depression.6,7Several nations are developing high-energy electromagnetic weapons that pose a danger to the planet by immensely effecting communication satellites, computer networks, and electrical power systems. Only EMI shielding can mitigate this new kind of pollution, which is a global issue. Thus, electromagnetic interference (EMI) shielding materials, especially the novel ones that can absorb incoming EM signals, are growing rapidly to meet strategic requirements and prevent electromagnetic leakage to protect electronic communication and the environment.8,9 These materials reflect, absorb, or inhibit EM radiation to protect electronic equipment from EM waves for better functioning and durability.10 The emergence of innovative functional materials with enhanced properties boosted the development of microwave absorption and EMI shielding solutions.11–15 EMI shielding materials are essential to electronic devices and equipment, yet difficulties with performance exist. Conventionally, metal shrouds are used for EM shielding, but their weight and corrosion resistance made them unsuitable for many applications.16 In the past, polymer composites, carbon compounds, ferrites, ceramics, and 2D materials have been researched to achieve high shielding effectiveness (SE).17–20 Since 1950, several microwave shielding materials have been investigated and still search for high performance materials is going on.21
It is known that impedance mismatch between interfaces induced by uniform or simple structures makes electromagnetic wave (EMW) dissipation problematic. The shielding effective (SE) of a material relies on its dielectric strength, magnetic permeability, shield thickness, and radiation frequency.22 Magnetic and dielectric losses are the two main absorption mechanisms of EMW absorbers. Dielectric loss needs strong electrical conductivity so that eddy current heats the conductor to attenuate electromagnetic waves in metals, carbon materials, composites, etc.23,24 Magnetic loss needs excellent magnetism; the abrupt change in electromagnetic wave impedance at the interface attenuates electromagnetic waves, in ferrite and transition metals.23 However, microwave-absorbing ferrite nanoparticles alone have a limited bandwidth, low absorptivity, and low impedance matching. High magnetic loss with poor impedance matching reduces microwave absorption of ceramic soft ferrites alone.25,26 Nevertheless, due to its well-known Snoek limit and weak dielectric loss capacity, ferrite's fundamental restriction is its abrupt microwave absorption characteristic deterioration in the gigahertz-frequency range.27 In addition to exceeding the Snoek limit, efforts have been made to hybridize ferrites with dielectrics such as BaTiO3 ![[thin space (1/6-em)]](https://www.rsc.org/images/entities/char_2009.gif) 28 and SiO2.29 Benefiting from the synergistic effect of magnetic and dielectric losses, the high-frequency microwave absorption and shielding properties can be enhanced. Recent studies have shown that absorption-dominated EMI shielding can be achieved through a reasonable design of magnetic/electric gradient structures owing to enhanced multiple absorption/reflection and interfacial polarization losses.22
28 and SiO2.29 Benefiting from the synergistic effect of magnetic and dielectric losses, the high-frequency microwave absorption and shielding properties can be enhanced. Recent studies have shown that absorption-dominated EMI shielding can be achieved through a reasonable design of magnetic/electric gradient structures owing to enhanced multiple absorption/reflection and interfacial polarization losses.22
Magnetoelectric composites provide excellent microwave absorption and shielding due to structural properties, physical properties, ferroelectricity, ferromagnetism, and magnetoelectric coupling.28 BaTiO3 and its derivatives exhibit high permittivity, microwave absorption, and low toxicity, as reported by Saini et al. and Shi et al.30–32 Furthermore, to improve microwave shielding, it has been reported that constructing a large number of interfaces to enhance the interface polarization effect is more conducive to realizing the optimization of EMI SE. Introducing a carbon filler may effectively strengthen the impedance matching characteristics, enhance the interfacial polarization due to its defects and further improve the EMI shielding performance of composites.17 From previous reports, it is established that graphene-based fillers are most often used for microwave shielding owing to their conductivity, high aspect ratios, and skin effects, which result in a high-frequency bandwidth. EM wave absorbing materials, which can be used as fillers to carbon materials, shield the devices more efficiently by converting the incident EM wave energy into thermal energy with the help of electric and/or magnetic losses and dissipating it through the surface.10,16 Graphene-based fillers are predominantly considered as potential candidates for designing microwave shielding due to their conductivity, high aspect ratios, and skin effects, leading to absorption of high-frequency bandwidths. Graphene oxide (GO) due to its superior mechanical, thermal, electrical, chemical, and optical properties with the presence of defect sites and attached functional groups can serve as a low-density, high mechanical strength, and efficient shielding material.10
In the current investigation, a novel multifunctional magnetoelectric composite comprising Co0.75Ni0.25Fe2O4 (CNF) and BaZr0.2Ti0.8O3 (BZT) is developed through hybrid microwave sintering. For the first time, graphene oxide is reinforced into the magnetoelectric composite and investigated the effect of GO on the properties of the magnetoelectric composite. Here, graphene oxide is reinforced into magnetoelectric composites like 0.5BZT + 0.5CNF + $% GO ($ = 0.5, 1, 1.5) to improve microwave absorption and shielding in the X-band frequency range. This composite exhibit multiple noteworthy findings. The composite with GO reinforcement exhibits reduced band gap energy. The study shows that GO decoration to the composite results in improving electromagnetic interference shielding capabilities. The relative permittivity, impedance and conductivity were found to be improved through graphene oxide reinforcement. The polarizability, magnetic anisotropy and magnetic coercivity of the magnetoelectric composite along with capacity to store energy are found to be enhanced via GO decoration. Overall, it is believed that the current investigation could lead the way for the design and development of multifunctional microwave shielding materials suitable for future defence, medical, and communication applications.
2 Experimental details
2.1 Synthesis procedure
The synthesis technique adopted to synthesize the composite plays a key role in the behaviour of the magneto-electric composite. So during the synthesis process, essential factors such as chemical reactions among the constituent phases, dispersion of the ferrite phase in the ferroelectric matrix, and the presence of pores in the composite are reported. The microwave sintering technique is one of the well-known methods to eradicate the aforementioned difficulties.33 This processing method amalgamates the superior properties of solid-state reactions like enhanced performance with uniform grains and low sintering temperature, low power consumption, enhanced crystallinity, and high relative density. The ferroelectric phase and ferromagnetic counterpart of the magnetoelectric composite were prepared using a solid-state reaction followed by the sintering of samples in a normal atmosphere through the principle of self-heating with the help of microwave waves.2.2 Synthesis of BZT and CNF
To synthesis the ferroelectric BaZr0.2Ti0.8O3 (BZT), high-grade chemicals of BaCO3, ZrO2, and TiO2 are considered as precursors of Ba, Zr, and Ti, respectively. These chemicals are weighed in definite stoichiometric proportions and mixed in an alcohol medium through high-energy ball milling under ambient conditions. The calcination is performed at 800 °C for 20 min using a programmable microwave furnace. The green powder is grinded properly to avoid agglomeration. The single perovskite phase of BZT is achieved at a sintering temperature of 1200 °C for 20 min in a microwave furnace. As a ferromagnetic counterpart in the magneto-electric composite, the single cubic phase of Co0.75Ni0.25Fe2O4 (CNF) is synthesized through a solid state reaction using a microwave furnace. CoCO3, NiCO3, and Fe2O3 are taken as precursors. The precursors are mixed thoroughly in a stoichiometric ratio via a solid-state reaction using a high-energy ball mill. The powders are then pre-sintered at 800 °C for 20 min in a microwave furnace. The obtained powder is grinded and compacted to a disk using a hydraulic press and then sintered in a programmable microwave furnace. Single-phase cubic CNF is achieved at a sintering temperature of 1150 °C for 20 min.2.3 Synthesis of the magnetoelectric composite
The multiferroic composite 0.5BZT–0.5CNF composed of BZT and CNF is synthesized by the solid-state reaction technique. The magneto-electric composite is prepared in a particulate fashion by mixing a pre-sintered/calcined ferroelectric material with the ferromagnetic counterpart. BZT and CNF are mixed in a fixed proportion through a high-energy ball mill in acetone medium under ambient conditions. The obtained powder is dried and compacted to a disc of thickness 1.34 mm with polyvinyl alcohol (PVA) as a binding agent through a uniaxial hydraulic press. The disc is subjected to microwave sintering (evaporation of PVA is performed first) at 1200 °C for 20 min with the help of a microwave furnace to improve the densification of the magnetoelectric composite (Fig. 1).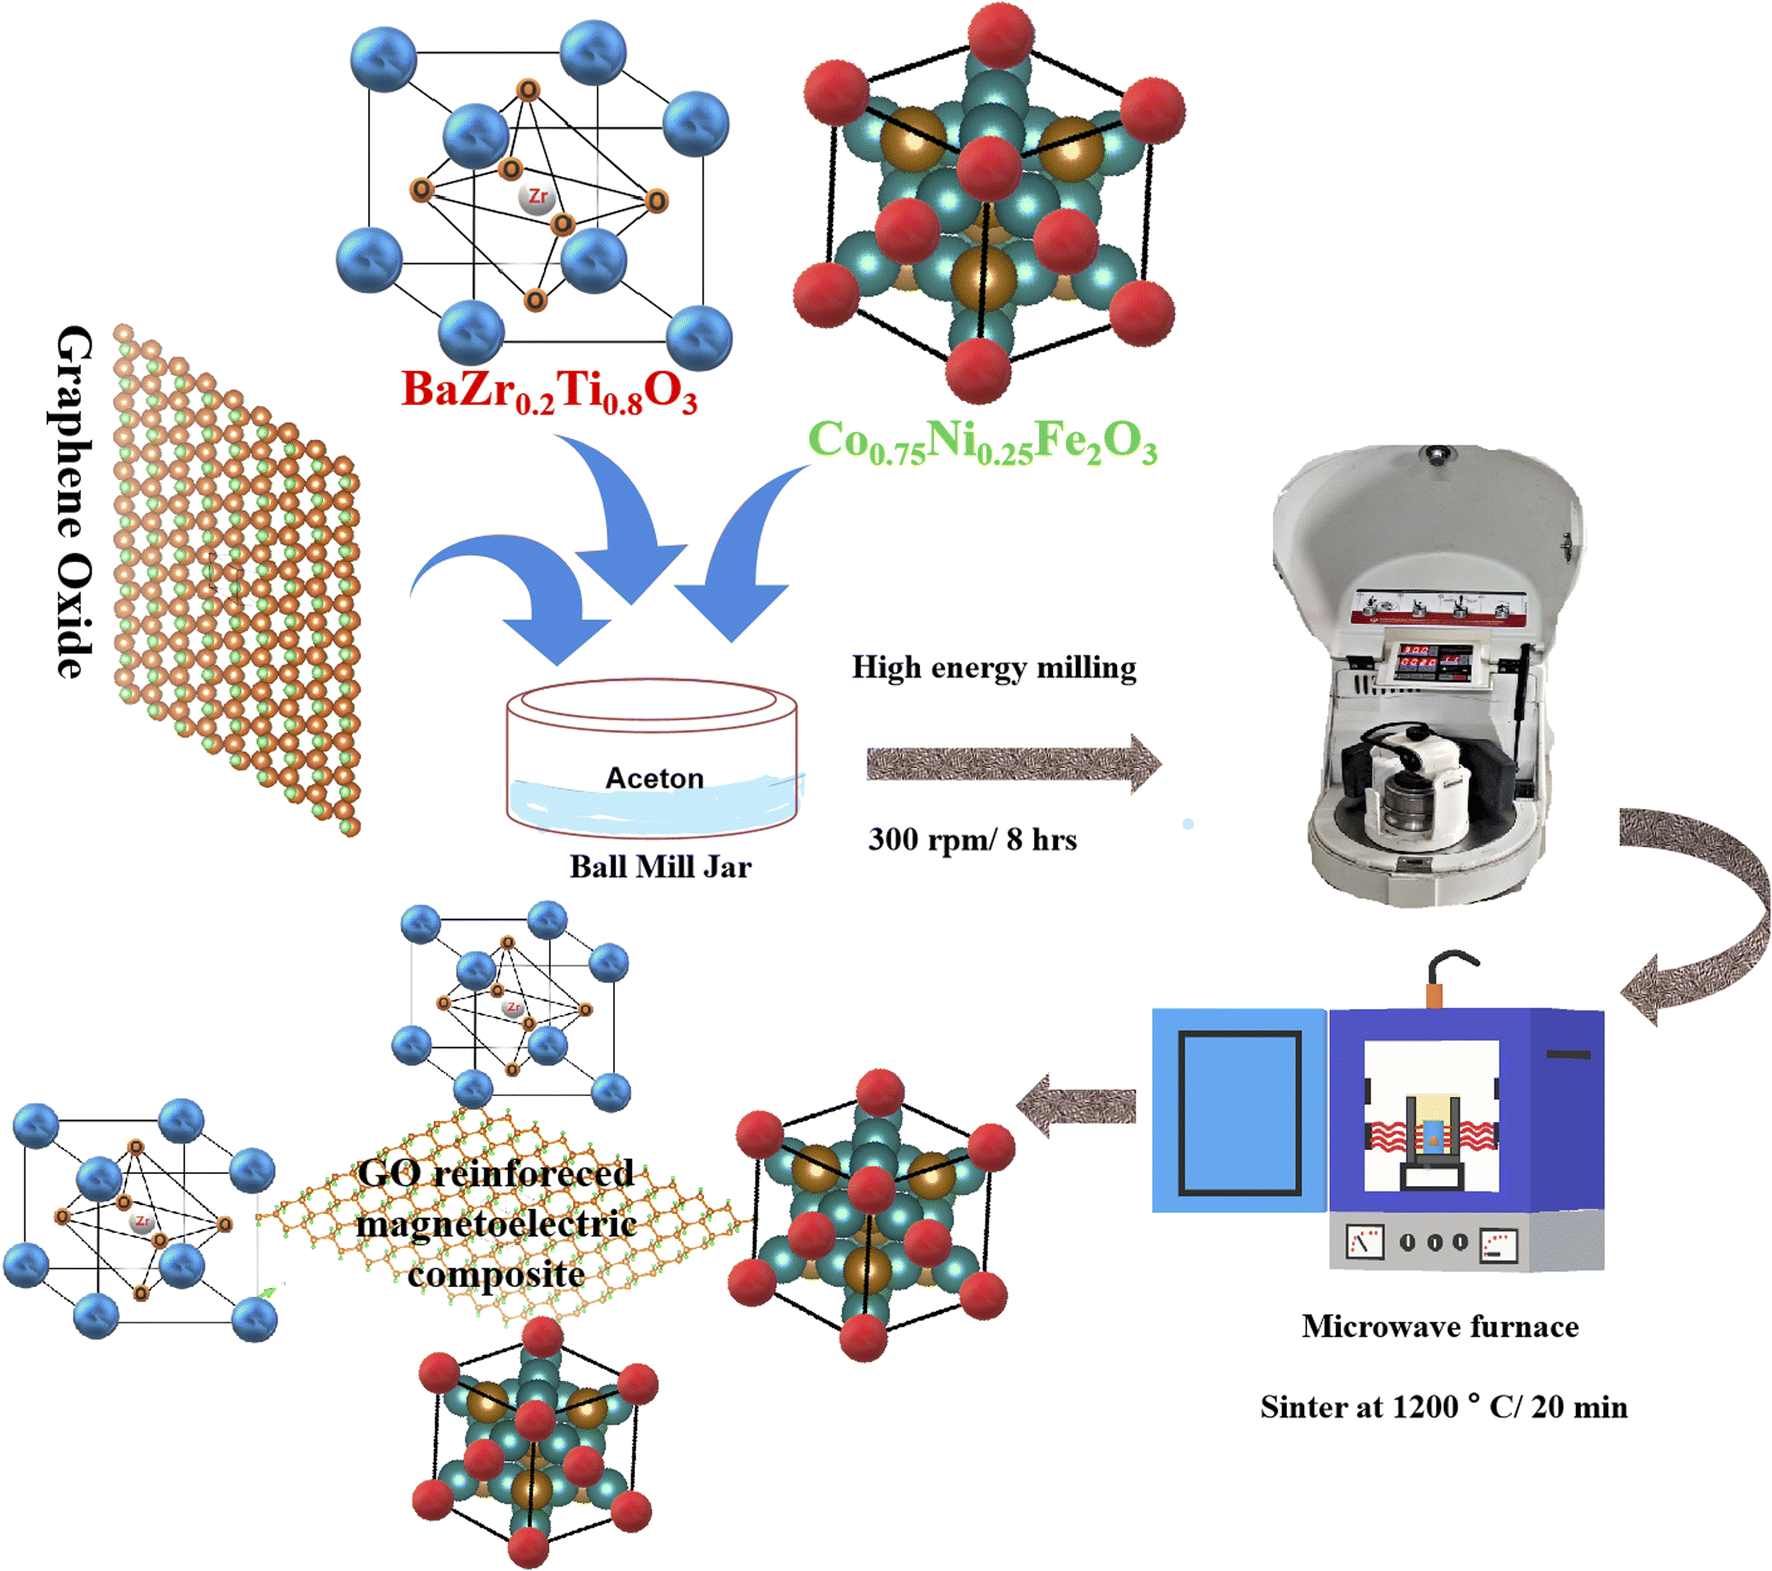 | ||
| Fig. 1 Schematic representation of the synthesis procedure of the GO decorated 0.5CNF–0.5BZT magnetoelectric composite through the novel microwave sintering technique. | ||
2.4 Synthesis of graphene oxide
The synthesis of graphene oxide (GO) is performed via a modified Hummer's method.34 Chemical exfoliation to obtain graphene oxide is accomplished through the application of several chemicals which includes fine graphite powder, concentrated sulphuric acid (H2SO4), sodium nitrate (NaNO3), potassium permanganate (KMnO4), and hydrogen peroxide (H2O2). To prepare GO, 1 g of fine graphite powder is mixed with 1 g of NaNO3 in a beaker filled with 46 ml of concentrated H2SO4 at room temperature. The solution is kept for continuous stirring below 10 °C with the help of a magnetic stirrer. The temperature during stirring is controlled via an ice bath. After 5 h, 6 g of KMnO4 is added slowly to the solution in the beaker while keeping the dispersion below 10 °C, and further stirring is continued at room temperature for the next 3 h. Later the solution is diluted with 96 ml of distilled water at room temperature and the reaction mixture is kept at 98 °C as stirring continues. After 2 hours, 25 ml of H2O2 is added to the solution to cease the oxidation of graphite and eliminate the unreacted KMnO4. The change in the colour of the solution to bright yellow signifies the higher oxidation state of graphite.35 The obtained mixture is washed multiple times with HCl and distilled water. The solution is centrifuged and the centrifuged dark brown mixture is dried up in a hot air oven at 70 °C for 24 hours.2.5 Synthesis of the GO decorated magnetoelectric composite
Now for the synthesis of multiferroic composites of 0.5BZT–0.5CNF–$% GO ($ = 0.5, 1, 1.5), GO is mixed with the ball-milled powder consisting of 50% CNF and 50% BZT in a weight ratio of 0.5%, 1%, and 1.5%. The powder is ground for 3 h using an agate mortar and compacted into a disc via a hydraulic press with PVA as a binding agent. The disc is subjected to sintering at 1200 °C for 20 min in a programmable microwave furnace.3 Characterization techniques
To examine the formation of individual phases and magneto-electric composites, XRD is performed with the help of an X-ray diffractometer of X'Pert, Panalytical, Netherland, with CuKα1 radiation at room temperature. The morphology, grain shape, and grain distribution of ferroelectric, ferromagnetic, and magneto-electric composites are verified using a focused ion beam scanning electron microscope (FEG-SEM) (Carl Zeiss) at room temperature. To examine the presence of metal oxide bonds and the absorption intensity of the magneto-electric composite, FTIR (IR Affinity-1, Shimadzu) and UV-Vis (V. JASCO V-750 PC) spectroscopy are utilized, respectively. The dielectric properties concerning temperature for the synthesized magneto-electric composite are investigated using an LCR bridge set-up (Agilent E4980). For the measurement of electrical properties, a high-performance Alpha A frequency analyzer from Novocontrol Technologies (Germany) is employed. The magnetic hysteresis is measured and studied through a vibrating sample magnetometer (Microsense, EZ11). The change in ferroelectric attributes with the electric field of the microwave sintered composite is examined using a TF Analyzer 2000, manufactured by aixACCT system GmbH at RT using a triangular waveform with 0.1 Hz frequency. The electromagnetic interference shielding effectiveness of the microwave-sintered magneto-electric composite is investigated using a vector network analyzer manufactured by Anritsu (MS2027C) in a frequency range of 8–12 GHz.4 Results and discussion
4.1 Structural properties
The structural properties of 0.5BZT–0.5CNF–$%GO ($ = 0, 0.5, 1, 1.5) are examined through X-ray diffraction. Fig. 2(a) and (b) depict the XRD patterns of magneto-electric composites reinforced with graphene oxide (GO), recorded at room temperature. The XRD pattern of BaZr0.2Ti0.8O3 indicates the formation of a pure perovskite phase with good crystallinity, which is as per previous reports.36 The synthesized BZT has a tetragonal phase with the P4mm space group. The XRD pattern of Co0.75Ni0.25Fe2O4 shows the formation of spinel structured single phase CNF with a high degree of crystallization. The peaks of microwave-sintered CNF are indexed to the lattice plane of the cubic unit cell with the Fd![[3 with combining macron]](https://www.rsc.org/images/entities/char_0033_0304.gif) m space group. The XRD pattern is well-matched with the literature.37 The XRD pattern of the magneto-electric composites clearly shows the presence of both the spinel CNF phase and perovskite BZT phase without any other secondary phases. Hence during the synthesis of the composites, no chemical reaction took place between the individual phases, which confirms the formation of magneto-electric composites with the simultaneous existence of parent BZT and CNF phases using a novel microwave sintering technique. To ensure the formation of both phases in the magneto-electric composite, the final sintering temperature is maintained at 1200 °C inside the microwave furnace. The estimated phase % of each phase through the relation38 is in good agreement with the measured weight content during the synthesis.
m space group. The XRD pattern is well-matched with the literature.37 The XRD pattern of the magneto-electric composites clearly shows the presence of both the spinel CNF phase and perovskite BZT phase without any other secondary phases. Hence during the synthesis of the composites, no chemical reaction took place between the individual phases, which confirms the formation of magneto-electric composites with the simultaneous existence of parent BZT and CNF phases using a novel microwave sintering technique. To ensure the formation of both phases in the magneto-electric composite, the final sintering temperature is maintained at 1200 °C inside the microwave furnace. The estimated phase % of each phase through the relation38 is in good agreement with the measured weight content during the synthesis.
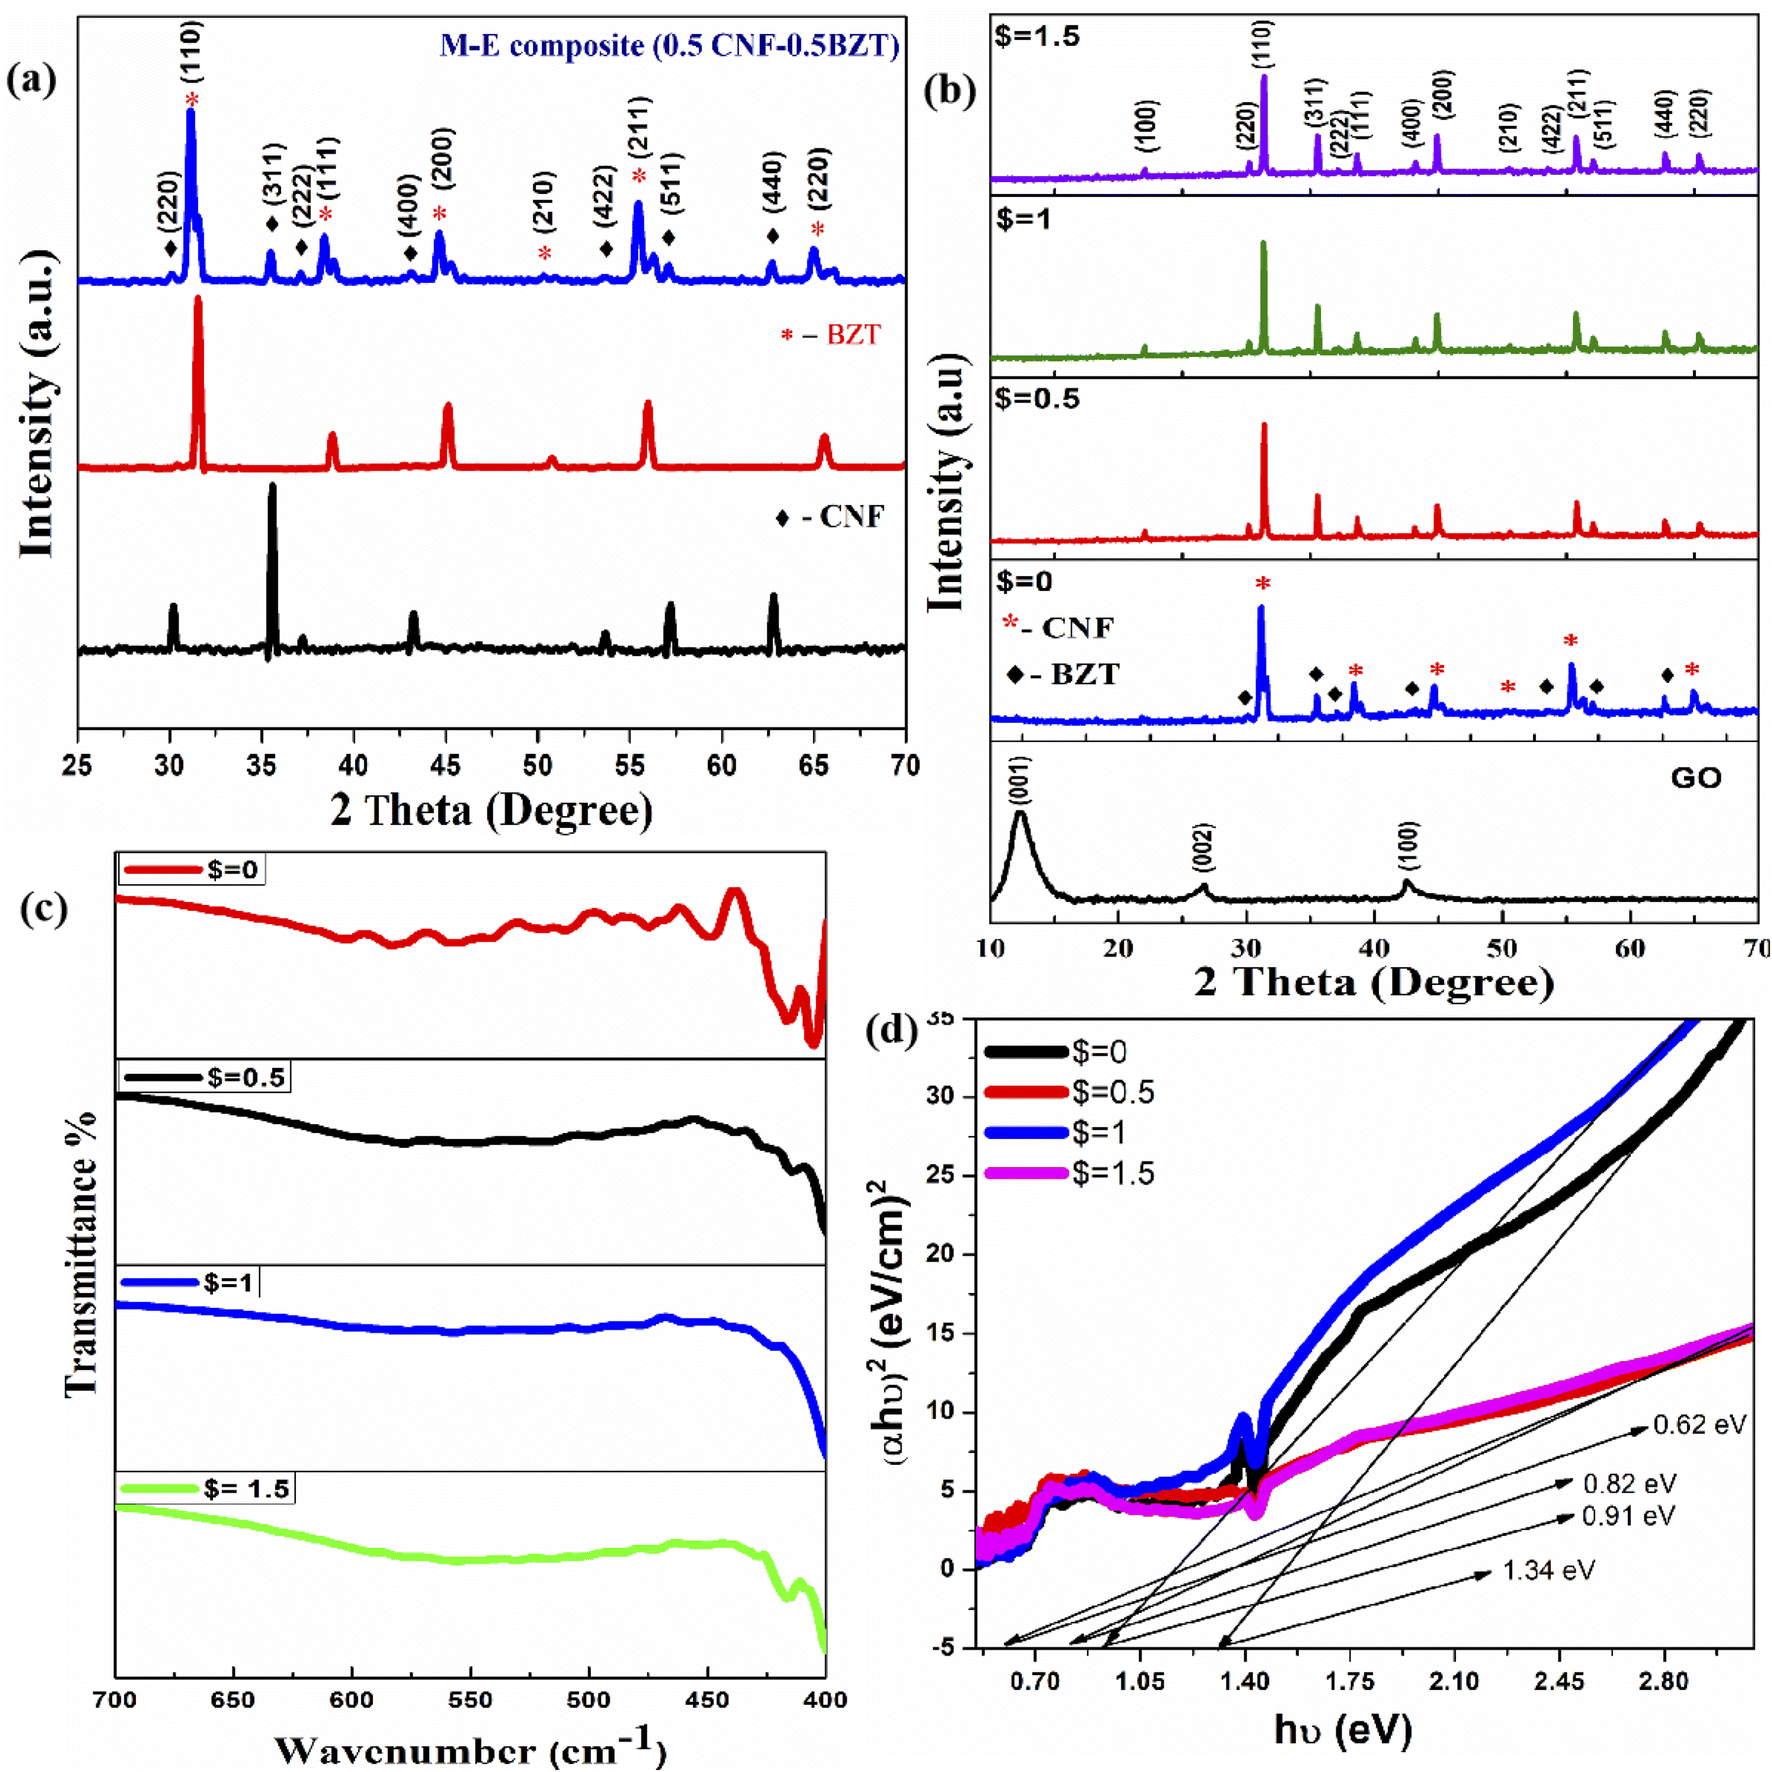 | ||
| Fig. 2 (a) and (b) XRD pattern for BZT (red line), CNF (black line) and 0.5BZT–0.5CNF–$% GO ($ = 0, 0.5, 1, 1.5) composites. (c) FTIR spectra of GO reinforced 0.5CNF–0.5BZT composites. (d) Tauc's plot to evaluate the band gap energy of 0.5BZT–0.5CNF–$% GO ($ = 0, 0.5, 1, 1.5). | ||
Fig. 2(b) shows the low angle XRD pattern of synthesized pristine graphene oxide, which indicates the characteristic graphene oxide peaks of (001), (002), and (100) at 2θ positions of 12.1°, 24.8° and 42.52°.39,40 In order to understand the evolution of the structural nature of the composite with the increase in graphene oxide concentrations, the XRD profile in the Bragg's angle range from 25–70° is illustrated in Fig. 2(b). Although no observable structural transformation has taken place, the intensity of both phases increases with the introduction of GO. It has been observed that with an increase in GO concentration, the peak intensity of the ferroelectric and ferrite phases slightly decreases. It is found that the diffraction peaks of GO-reinforced CNF–BZT become sharp and undergo peak broadening with an increase in GO concentration in the magnetoelectric composite. This is due to the creation of homogeneous particles scattered along the graphene oxide membrane, and the degree of agglomeration reduces as the concentration of GO in the materials increases. The existence of GO content is assumed to have supplied more surface area for the growth of tiny magneto-electric particles, resulting in a broadening of the XRD peaks.39 However, the XRD pattern of the GO-decorated magnetoelectric composite indicates little shifting of peaks with GO concentration due to the effect of the semiconducting 2D graphene oxide layer over crystalline structures.
The density of 0.5BZT–0.5CNF–$% GO ($ = 0, 0.5, 1, 1.5) is calculated through Archimedes' principle in xylene. The porosity in the composites is estimated with the help of the relative density of the composites.41 It is found that the increase of GO content in the magnetoelectric composite enhances the densification and reduces the porosity in the composites. The average crystallite size, dislocation density, and structural features of GO-reinforced BZT–CNF magnetoelectric composites are estimated by applying the Scherer approach. The physical characteristics of the GO-decorated magnetoelectric composite are summarized in Table 1. It has been found that adding GO to the magnetoelectric matrix induces the crystallites to grow in size. The composite with $ = 0.5 has the largest crystallite size, measuring 54.8 nm. A larger crystallite size after GO reinforcement suggests that crystal growth may be stimulated by the incorporation of GO into the composite. It is hypothesized that the GO with a large surface area serves as a crystal nucleus, stimulating the crystallization process.42 The results demonstrated that the lattice characteristics and structure of the samples were not significantly altered by the addition of GO, suggesting that the GO still exists between the grains, serving as a connecting bridge.
| Avg. crystallite size (nm) | Dislocation density (m−2) × 10−9 | Avg. grain size (μm) | Lattice parameters (Å) | Phase (%) | Exp. density (g cm−3) | Relative density (%) | |||
|---|---|---|---|---|---|---|---|---|---|
| Ferromagnetic phase | Ferroelectric phase | BZT | CNF | ||||||
| CNF | 25.5 | 1.53 × 10⁻³ | — | a = 8.35 | — | — | 100 | 5.65 | 93.03 |
| BZT | 32.07 | 9.53 × 10⁻⁴ | — | — | a = b = 3.98, c = 3.99 | 100 | — | 5.48 | 89.7 |
| $ = 0 | 27.51 | 1.32 × 10⁻³ | 5.44 | a = 8.37 | a = b = 4.05, c = 4.06 | 50.7 | 49.5 | 4.87 | 95.52 |
| $ = 0.5 | 54.87 | 3.32 × 10⁻⁴ | 3.45 | a = 8.36 | a = b = 4.03, c = 4.02 | 50.4 | 48.9 | 5.34 | 97.78 |
| $ = 1 | 45.14 | 4.90 × 10⁻⁴ | 1.11 | a = 8.36 | a = b = 4.03, c = 4.02 | 50.8 | 49.6 | 5.22 | 98.46 |
| $ = 1.5 | 42.15 | 5.62 × 10⁻⁴ | 1.26 | a = 8.36 | a = b = 4.03, c = 4.02 | 50.6 | 49.2 | 5.30 | 98.79 |
4.2 Optical properties
It is observed that as the concentration of GO reinforcement increases, the intensity of the peak decreases due to the layer structure of graphene oxide. The IR spectra of GO-modified magneto-electric composites exhibit a redshift with the increase in GO concentration may be because of interface formation between the magnetoelectric particles and graphene oxide sheet.39 FT-IR analysis indicates the formation of metal oxide composites and vibrational bands exhibited by the composites, indicating the presence of both the ferroelectric (FE) BZT phase and ferromagnetic (FM) CNF phase inside the composite, which was also confirmed by XRD analysis.
| (αhν) = B(hν − Eg)n | (1) |
The band gap energy (Eg) for 0.5CNF–0.5BZT is found to be 1.44 eV. It is observed that the band gap energy value of the composite is in between the band gap energies of constituent ferroelectric BZT (3.1 eV) and ferromagnetic CNF (1.2 eV). The reinforcement of GO in the composite results in a decrease in the optical band gap energy value. The reduction in band gap energy is due to the introduction of nano-2D GO into the composite, which has higher excitation energy. This is in good agreement with Kubo's theory.47 With the increase of GO concentration, the band gap energy increases. This is due to the increase in surface charge between the magneto-electric composite and graphene oxide. The band gap value for 0.5CNF–0.5BZT–1% GO is 1.09 eV and then decreases to 0.88 eV for 0.5CNF–0.5BZT–1.5% GO.
4.3 Microstructural properties and morphology
The scanning electron microscope images of pure BZT (illustrated in ESI Fig. S1†) show evenly distributed polygonal structured random-shaped grains throughout the microstructures. The sintering process appears to have completed grain development, and the microstructure is substantially pore-free. The average grain size of BZT is found to be around 700–800 nm and was estimated with the help of Image J software. EDS analysis examines and confirms the presence of all cationic elements in BZT (shown in Fig. S1†). Fig. S2(a)–(d) in the ESI† illustrate the elemental mapping of 0.5BZT–0.5CNF–$% GO ($ = 0, 0.5, 1, 1.5) composites. The existence and distribution of the elements Ba, Zr, Ti, Co, Ni, Fe, and O are shown in Fig. S2† by giving each element a distinct colour. The existence of all desired elements in composites is confirmed by EDS analysis as displayed in Fig. S2.† The weight percentage from EDS indicates that the experimental stoichiometry of the compositions is closely matched with the theoretical stoichiometry of the compositions. The FEG-SEM micrographs of all the composites indicate the formation of highly dense and pore-free grains, which are distinguished through well-defined grain boundaries. It suggests the formation of high-quality magnetoelectric composites reinforced with GO. The existence of two different grains is observed through the microstructural studies of the composites, which are bi-pyramidal polyhedra grains and random-sized grains. The random size grain corresponds to the matrix, whereas the bi-pyramidal polyhedra grains correspond to islands. Through elemental mapping, it is noticed that the matrix has a large content of Ba, Zr, and Ti with the occurrence of characteristic templated grain growth (TGG), thus verifying that the matrix is a magnetoelectric BZT phase. On the other hand, the existence of Co, Ni, and Fe is predominant on the island, which contributed to the CNF phase. From the micrographs of the micro-structure, the embedded CNF bi-pyramidal island in the BZT matrix can be considered as 0–3 type connectivity.Apart from BZT and CNF phases, there is no presence of additional phases due to the absence of diffusion between individual magnetic and electric phases as concluded by the XRD analysis. Here the synthesis and sintering technique of the composite plays an important role in the formation of a highly dense magneto-electric composite. In conventional sintering, it is difficult to get a homogeneous and dense ceramic composite due to the difference in the thermal coefficient and sintering temperature of BZT and CNF.37,48 The grain size of composites is estimated with the help of ImageJ software and represented through histograms illustrated in Fig. 3(a)–(d). The average size of the grains of the composites is found to decrease from 5.4 microns at $ = 0 to 1.11 microns at $ = 1 upon incorporating GO into the magnetoelectric composite. The addition of GO in the composite improves its scattering cross section, which subsequently influences the reduction in grain size.
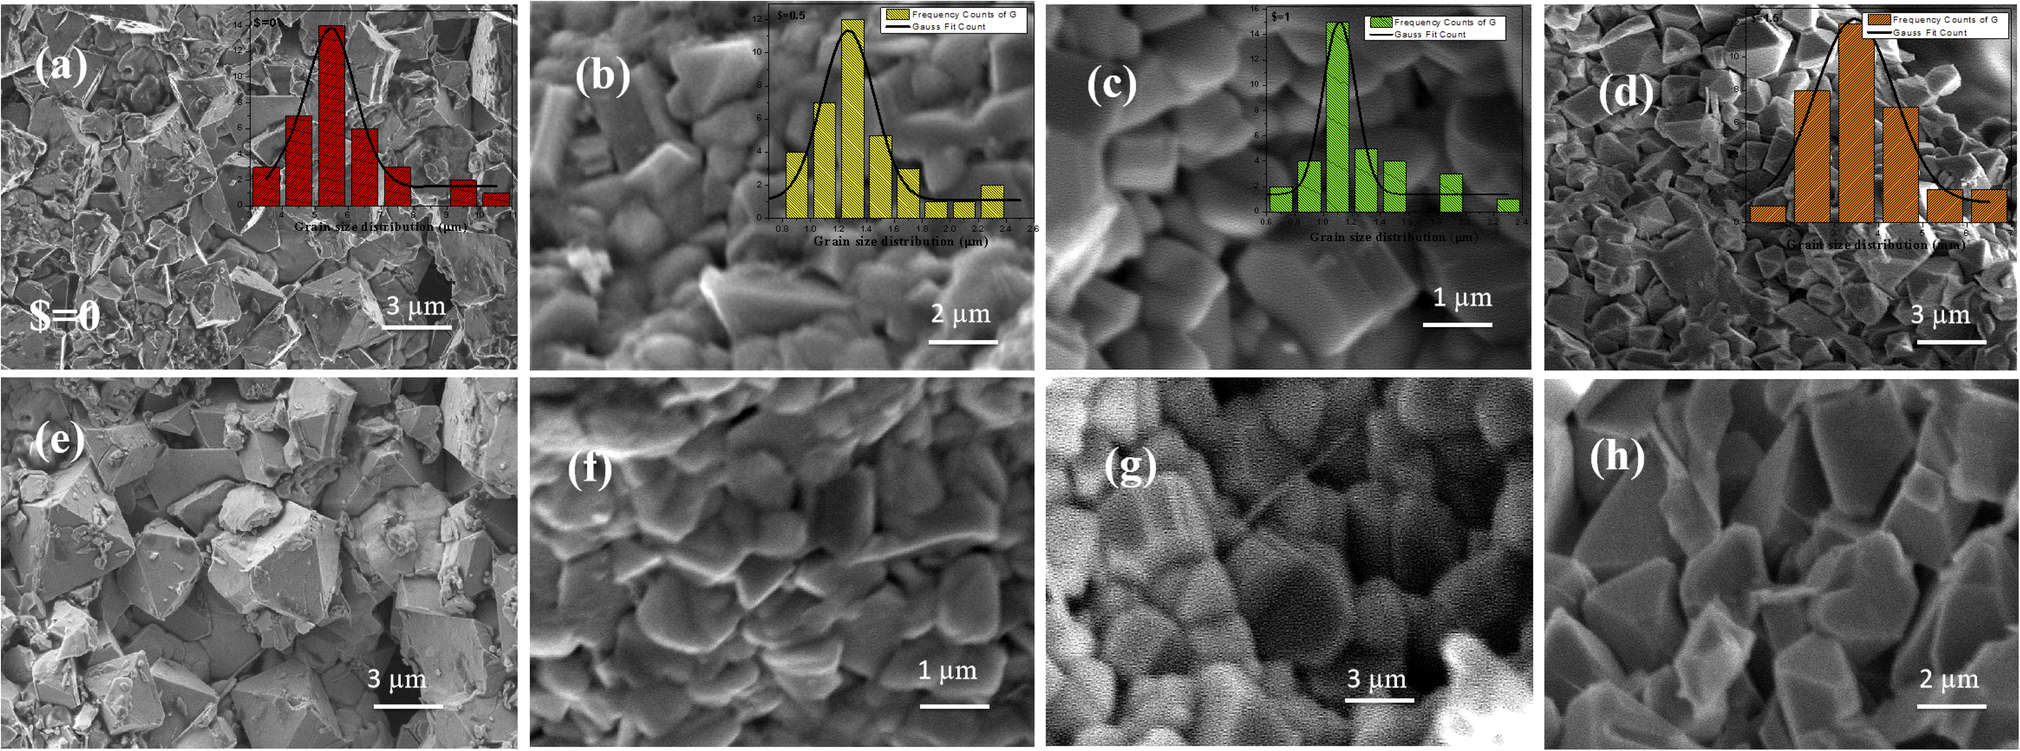 | ||
| Fig. 3 Microstructural study through FEG-SEM images (insets represent the grain size distribution): (a) and (e) 0.5CNF–0.5BZT, (b) and (f) 0.5CNF–0.5BZT–0.5%GO, (c) and (g) 0.5CNF–0.5BZT–1%GO and (d) and (h) 0.5CNF–0.5BZT–1.5%GO. | ||
The hetero-junction interfaces between BZT–CNF and GO might be regarded as a magneto-dielectric junction between magnetoelectric particles and a dielectric GO layer; consequently, it could be considered as a GO membrane coating BZT–CNF particles. The special hetero-junction interfaces, with features including a more extensive array of magneto-dielectric layers, have been considered to be responsible for the wide-band absorption properties and GHz frequency absorption detailed in the following sections.
4.4 Electric properties
δ) of the synthesized composites across a wide range of temperatures (40 °C–675 °C) at different frequencies. The inset represents the dielectric constant as a function of temperature at 1 MHz. A frequency dependence dielectric study of the magnetoelectric composites is carried out to understand the response of different polarization to an applied electric field.
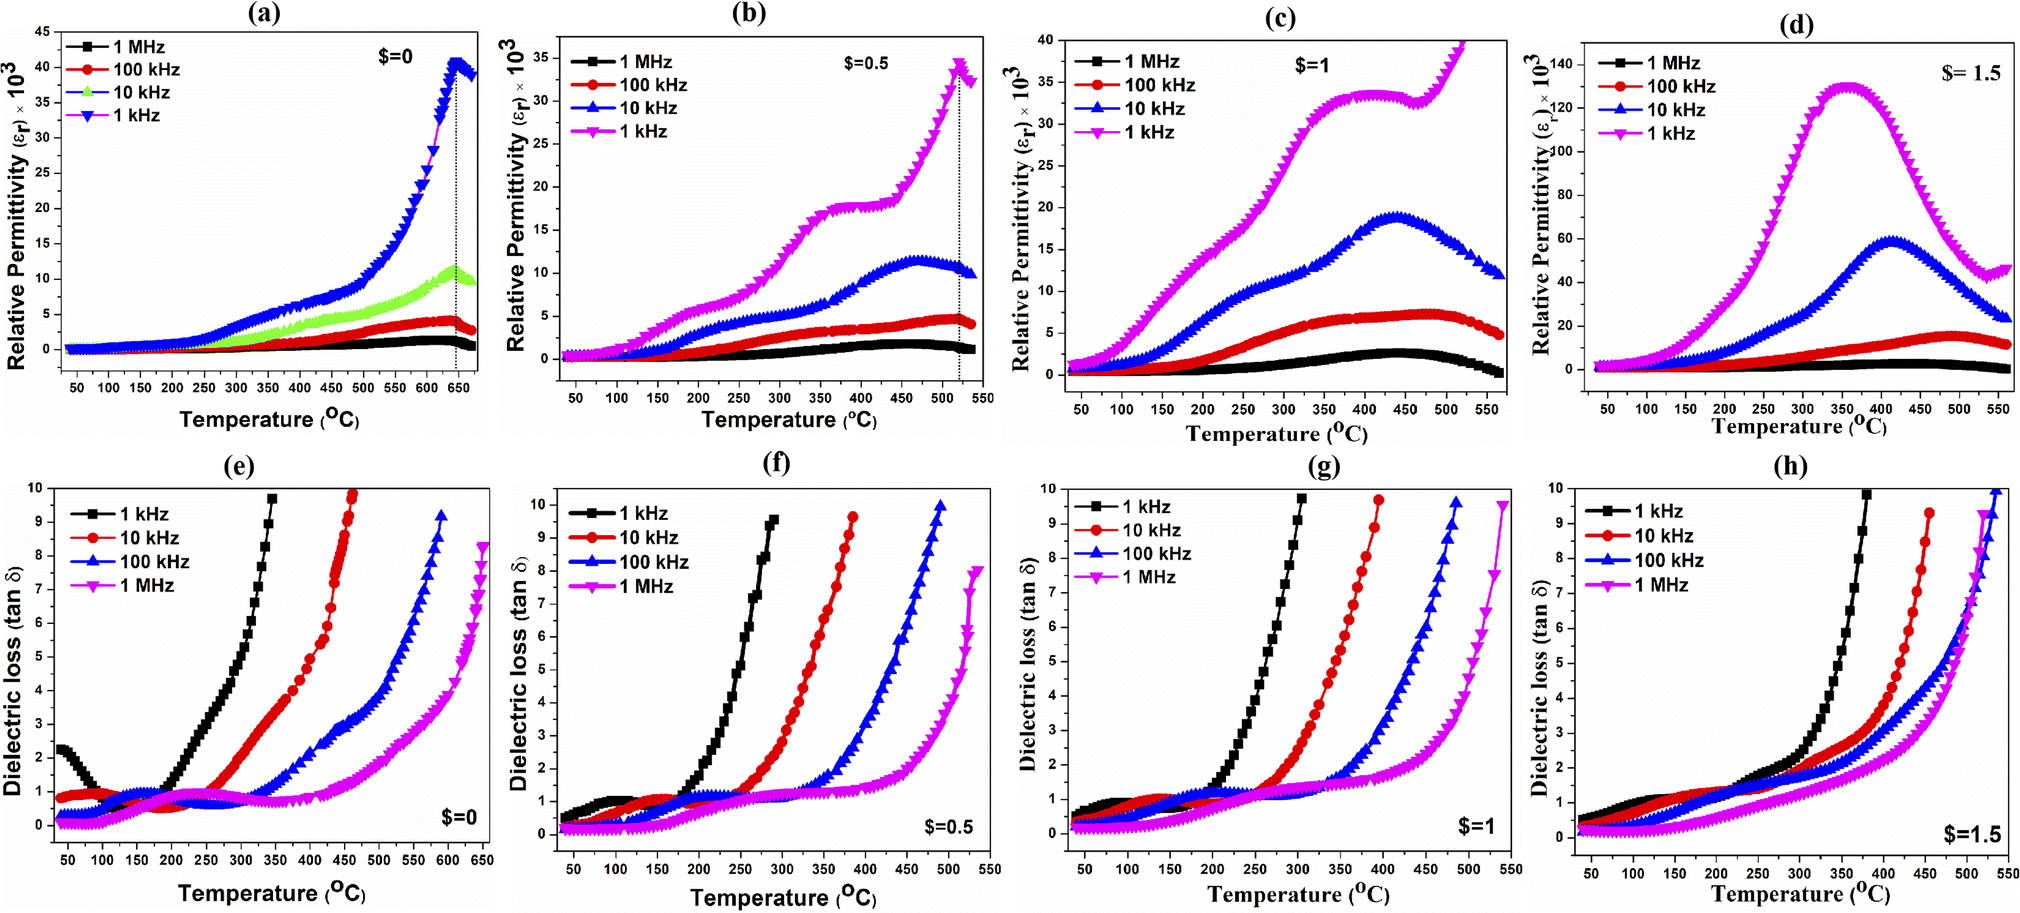 | ||
| Fig. 4 (a–d) The relative permittivity of 0.5BZT–0.5CNF–$% GO ($ = 0, 0.5, 1, 1.5) as a function of temperature at different frequencies (1 kHz, 10 kHz, 100 kHz, and 1 MHz). (e–h) The dielectric loss (tanδ) as a function of temperature for 0.5BZT–0.5CNF–$% GO ($ = 0, 0.5, 1, 1.5). | ||
Temperature and frequency dependant dielectric properties. The variation of dielectric properties is investigated across a range of temperatures in the frequency range of 1 kHz to 1 MHz. The dielectric parameters for the synthesized composites are tabulated in Table 2. It is observed from the ε versus T plot that the dielectric constant/permittivity for 0.5BZT–0.5CNF remained almost constant until 250 °C. This is explained by the charge carriers' weak and consistent response at these temperatures. Beyond 250 °C, the composite exhibited dielectric relaxation between 250 °C and 500 °C. High thermal agitation among the electric dipoles caused the dielectric relaxation to occur.49 As a result, entropy becomes dominating at relaxation temperatures, resulting in a high magnitude of dielectric constant. Beyond 500 °C, the dielectric constant increases rapidly and started decreasing beyond the Curie transition temperature (Tc). 0.5BZT–0.5CNF at higher frequency exhibits a diffused phase transition across the Curie transition temperature range between 570 °C and 640 °C. The magneto-electric composite exhibits a sharp phase transition at 640 °C at 1 kHz with a colossal dielectric constant of 42
000. It is evident from permittivity analysis that the Tc corresponding to the transition of ferroelectric BZT to paraelectric appears to be inhibited for the 0.5BZT–0.5 CNF composite, and the influence of the CNF phase on the dielectric characteristics of the composite is significant.
| Dielectric properties at 1 MHz | Conductivity | Impedance (ohm) | Ferroelectric properties | ||||||||
|---|---|---|---|---|---|---|---|---|---|---|---|
| T m (°C) | ε r | Tanδ |
Tanδ at 1 kHz |
σ ac (S cm−1) × 10−4 at 1 MHz | A | n | |Z| | P max (μC cm−2) at 8.2 kV cm−1 | P r (μC cm−2) at 8.2 kV cm−1 | E c (kV cm−1) | |
| $ = 0 | 621 | 1324 | 0.09 | 2.25 | 0.277 | 4.06 × 10⁻¹² | 1.00 | 6138.35 | 0.96 | 0.81 | 5.86 |
| $ = 0.5 | 460 | 1769 | 0.18 | 0.50 | 0.376 | 4.61 × 10⁻¹² | 1.01 | 4009.79 | 1.29 | 0.97 | 5.18 |
| $ = 1 | 440 | 2633 | 0.19 | 0.51 | 2.42 | 2.12 × 10⁻¹⁰ | 0.88 | 1150.51 | 3.06 | 2.20 | 4.11 |
| $ = 1.5 | 431 | 2751 | 0.23 | 0.51 | 4.51 | 8.5 × 10⁻¹⁰ | 0.83 | 505.41 | 10.46 | 4.45 | 6.46 |
It has been observed at lower frequencies and higher temperatures that improved values of the dielectric constant are obtained. Two different explanations can account for this phenomenon. In the first place, this is due to the space charge polarization effect within the ferroelectric and ferrite phases.50 A charge accumulation at the grain boundaries is caused by the existence of a potential barrier driven by space charge polarization at the grain boundaries, which develops at higher dielectric constant values.51 The ferrite's hopping conduction mechanism is another justification for the enhanced dielectric constant at low frequency and high temperature.52 The mechanism of hopping conduction is triggered by the temperature. Elevated temperatures promote increased electron hopping between Fe3+ and Fe2+. The high value of permittivity is due primarily to the fact that being subjected to an external electric field, the dipoles Fe3+ → Fe2+ align their axes parallel to the electric field. The polarization value is boosted even further by the fact that ferrites have their intrinsic ionic polarization.53 The lower the frequency and the higher the temperature, the greater the effectiveness of these mechanisms. As a result, the dielectric constant steadily rises along with temperature. Once a certain temperature is reached, ε is found to decrease. Higher temperatures cause electrons and ions to vibrate more randomly, which causes the dielectric constant to drop.
The reinforcement of GO in the ceramic composite results in an increment in the permittivity/dielectric constant. However, the Tc or temperature of maximum permittivity (Tm) for composites decreases gradually with an increase in GO concentration. The increase in relative permittivity on the addition of GO to the composite is due to an increase in the average electric field in the ferroelectric matrix and the formation of micro-capacitor structures. The GO sheets operate as conducting electrodes, while the magneto-electric material between two GO sheets acts as an insulator, and the application of a large number of such micro-capacitors results in high capacitance. When an external field is introduced, additional oxygen-containing groups on GO contribute to orientation polarization. This improves interfacial polarization, which increases as GO concentration increases. This leads to an increase in the relative permittivity of the synthesized composites.54 Also, the increase in the density of Fe2+–O dipoles enhances the dipolar polarization in composites and the addition of GO further increases the MWS (Maxwell–Wigner–Sillars polarization). Because the ferroelectric matrix, ferromagnetic materials, and GO have different dielectric constants, a lot of charge carriers build up on these interfaces and strong MWS polarization occurs, which also play a crucial role in the improvement of the relative permittivity of the GO-reinforced magneto-electric composite.55 Introducing GO at 0.5 wt% into the composite influences the composite to exhibit two dielectric relaxations at 1 kHz. For 0.5BZT–0.5CNF–0.5% GO, the degree of dielectric relaxation decreases with an increase in frequency and shows diffused phase transition at a frequency above 1 kHz. The diffused phase transition (Tc) temperature for 0.5BZT–0.5CNF–0.5% GO is in the range of 450 °C to 540 °C. The ε′ vs. T plot of all the composites indicates that the GO concentration in the composites reduces the dielectric relaxation.
It is observed from Fig. 4(a)–(d) that the relaxor behavior exhibited by the magneto-electric ceramics is influenced by increasing graphene oxide (GO) concentration in the composite. The composites CNF–BZT–1% GO and CNF–BZT–1.5% GO have a strong frequency dispersion of the dielectric constant with a peak below and above the maximum temperature (Tm). The Tm for $ = 1 and 1.5 shifts towards higher temperatures across 370 °C to 450 °C and 325 °C to 430 °C respectively with an increasing frequency from 1 kHz to 1 MHz. This suggests that the relaxor dielectric nature of the composite 0.5BZT–0.5CNF–$% GO ($ = 0, 0.5, 1, 1.5) exhibits a large dielectric constant. However, the composite $ = 1.5% exhibits a higher permittivity value in a lower frequency region compared to other composites. This could be due to the presence of excess microcapacitor formation. Hence $ = 1% can be considered as a percolation limit of GO in the 0.5CNF–0.5BZT composite. It has been accepted that the dynamics of the polar nanoregions (PNRs) govern the dielectric features of relaxor ferroelectrics.56 The dynamics of these PNRs are potentially affected by the sample's high concentration of grain boundaries and the related internal stresses. As a result of domain refinement and long-range polar ordering in magnetoelectric composite, the residual crystalline phase and reduction in grain size contribute to improved relaxor behaviour and dielectric characteristics.57
Fig. 4(a)–(d) illustrate the relationship between relative permittivity and temperature at different frequencies. The reduced values with increasing frequency show the polar character of the dielectric materials in all composites. The dielectric constant decreases significantly in the low-frequency region (<10 kHz) and approaches a constant value in the high-frequency region. As a result of the heterogeneity of the CNF–BZT–GO interface in the composites, the permittivity is enhanced in the low-frequency region. Koop's model, based on Maxwell–Wegner interfacial polarization, explains this phenomenon.58 A rise in the dielectric constant is predicted by this model due to the conductivity discrepancy among grains and grain boundaries. Several charge hopping events, in which charges jump from one valence state of the cations found in BZT, CNF, and GO to another, are caused by the conductivity inconsistency between grains and grain boundaries in the composites. Permittivity remains constant over a range of high frequencies because dipoles cannot change their orientation in response to an external electric field.
To understand the nature of the inherent dissipation of electromagnetic energy of the synthesized composites, analysis of dielectric loss/tanδ is performed as a function of temperature at different frequencies. As the frequency increases from 1 kHz to 1 MHz, the tanδ peaks relocate in the direction of greater temperatures, demonstrating that the relaxation mechanism is engaged by heat.59 The composites have a strong frequency dispersion of dielectric loss similar to the dielectric constant. The dielectric loss decreases with an increase in frequency owing to ion mobility and direct current conduction in the composites. At lower frequencies, the space charge effect as well as the frictional force between space charges and the interfaces is attributed to the high dielectric loss.38 It is observed that up to 1 kHz frequency, the dielectric loss decreases with an increase in the percentage of GO in the composite owing to the activity of the Maxwell–Wegner relaxation at a lower frequency. At 1 MHz, the dielectric loss/tanδ increases with an increase in graphene oxide concentration in the magneto-electric composites. This observation can be explained based on the influence of Debye relaxation from the orientation polarization of the dipoles at higher frequencies. In general, dipole relaxation induces dielectric loss; however, in this study, the creation of a conducting network plays a major role in the increase of dielectric loss with relaxation. The high conductivity of GO sheets improves charge mobility inside the composite and allows charge flow through it when an electric field is applied. The flow of charge transforms electrical energy to thermal energy, and as a result of local thermal runaway, composite loss increases.60 This is the cause of the rise in dielectric loss when GO concentration increases in the synthesized composite. The high dielectric constant and enhanced dielectric loss along with relaxor behaviour prove the suitability of the synthesized composites for various applications including EMI shielding.
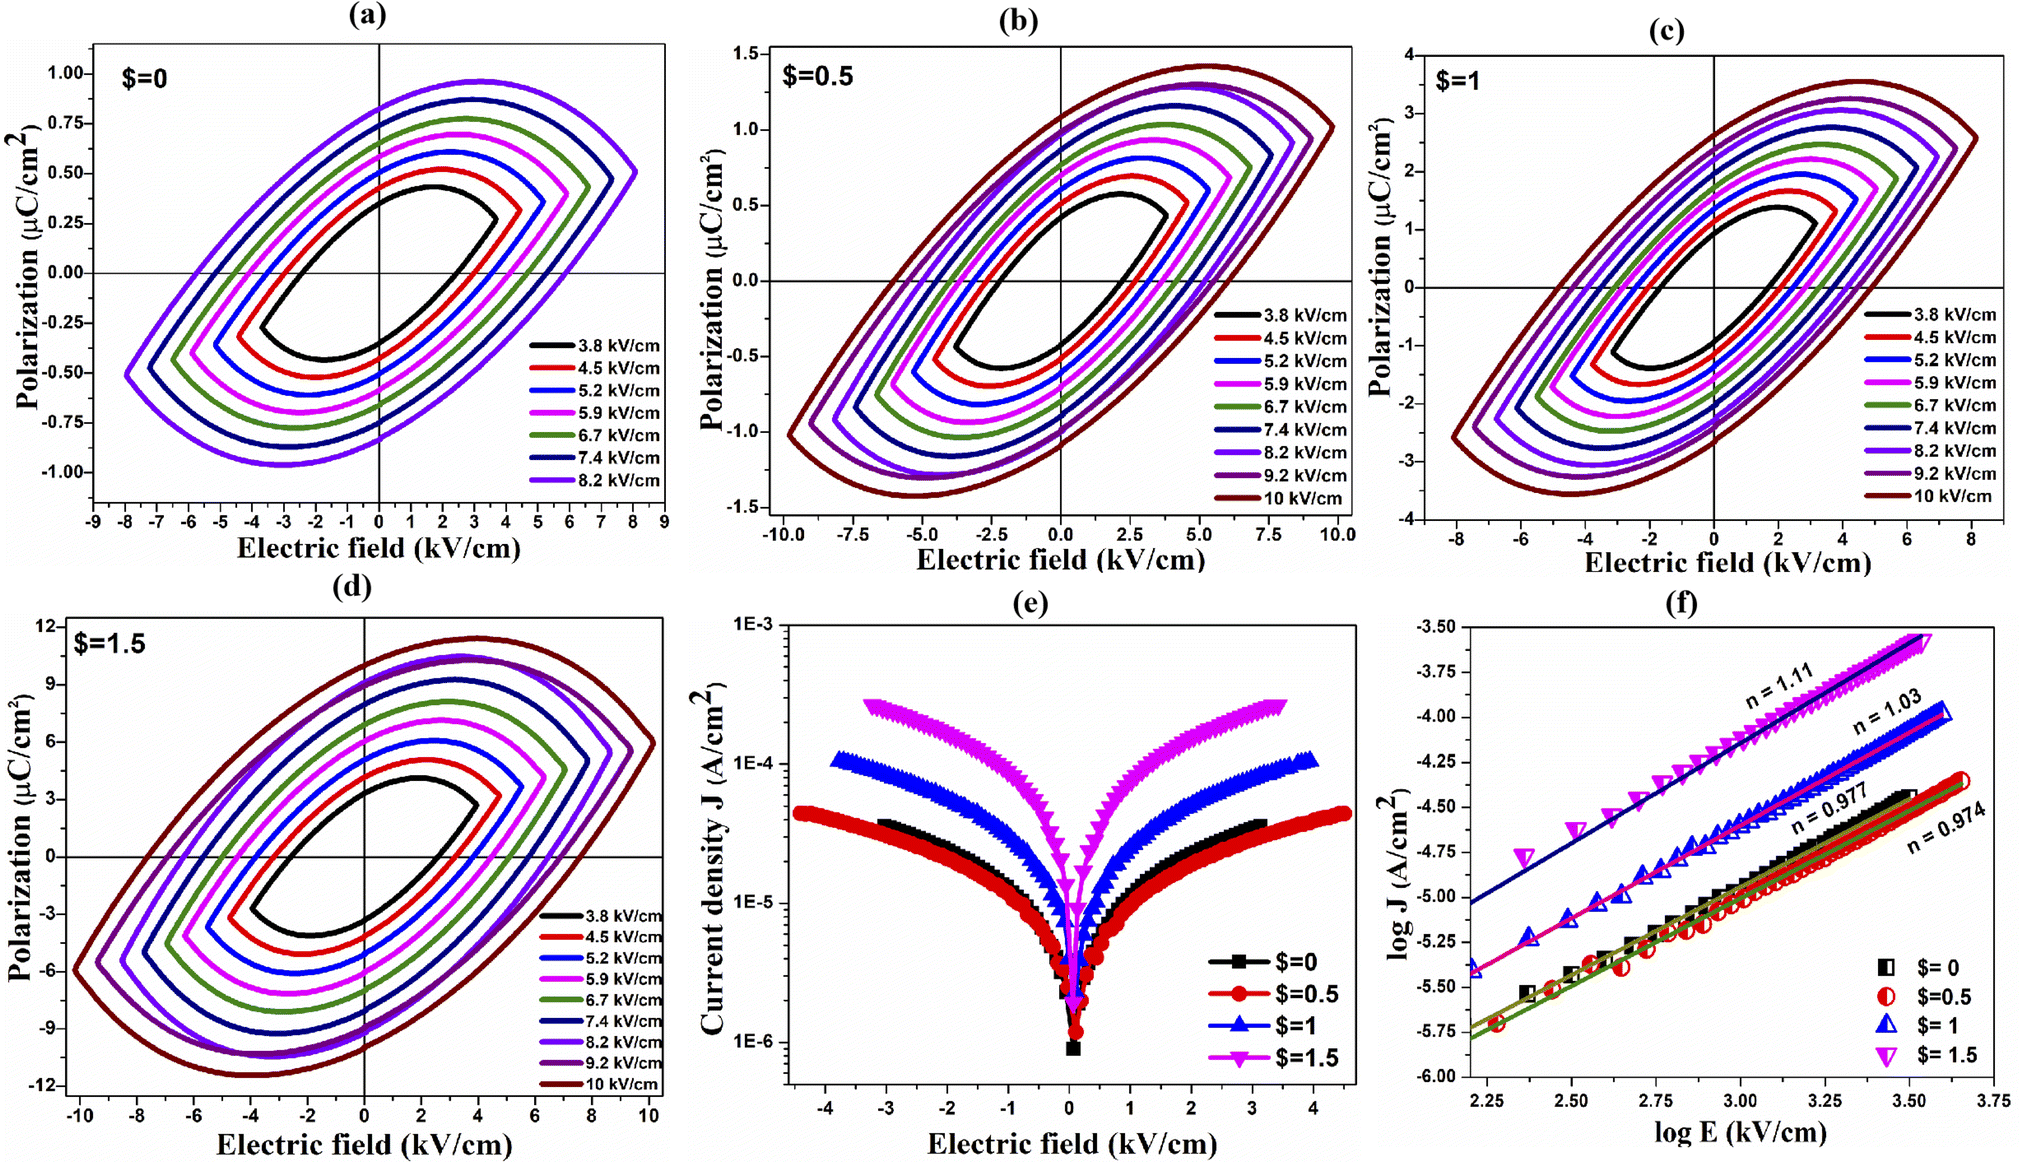 | ||
| Fig. 5 (a)–(d) P–E curves for the 0.5BZT–0.5CNF–$% GO ($ = 0, 0.5, 1, 1.5) composite at varying applied electric fields, (e) current density as a function of electric field for composites and (f) logJ vs. logE graph for 0.5BZT–0.5CNF–$% GO ($ = 0, 0.5, 1, 1.5). | ||
The ferroelectric examination demonstrates that increasing graphene oxide content improves the polarization in magnetoelectric composites. The high polarizability dipoles produced by the GO's numerous defects and surface functional groups may contribute to the composite's enhanced polarization.65 The addition of GO into the magnetoelectric composite results in an enhancement in maximum polarization (Pm) and a decline in the coercive field (Ec). The efficiency of energy dissipation rises in tandem with the fraction of graphene oxide used. Energy dissipation causes the separation of the charge and voltage signals, which results in loops with a substantial area of the curve.66 The charge storage capability of a material is defined by the area of the curve; the greater the area of the curve, the greater the charge storage capability of the material.67 The rise in remnant polarization (Pr) induced by the inclusion of the graphene oxide filler is due to hetero-polarization caused by the interaction of conducting fillers and ceramic composites. The Pr increment with GO content can be due to the larger number of switching dipoles in the composite. As the GO content increases, more charge density accumulates on the surface of GO, resulting in a larger number of switching dipoles. The decrease in the coercive field up to $ = 1% of GO as an additive in the composite is due to the space charge effect at the interface.68 It is observed that at $ = 1.5, the magneto-electric composite exhibit a large jump in maximum polarization and also exhibits improvement in the coercive field (Ec) as compared to other GO decorated magneto-electric composites. This can be attributed to the percolation limit of the 0.5BZT–0.5CNF–$% GO composite; $ = 1 as explained earlier. These results indicate that graphene oxide fillers are effective in enhancing the polarizing properties of the magneto-electric composite.
The energy storage capacity of the magnetoelectric composite is estimated through the polarization as a function of applied electric field curve. Although the composite is designed and developed for high frequency applications such as EMC/EMI shielding, the effect of graphene oxide (GO) reinforcement on energy storage capacity is worth studying. The energy loss (Wloss) in composites is represented through the closed area inside P–E curve where the recoverable energy (Wrec) can be determined through the area between Pmax to Pr and Y-axis. The recoverable energy and its storage efficiency (η) in the magnetoelectric composite are estimated through eqn (2) and (3) (ref. 33) at an applied electric field of 7.4 kV cm−1. The magneto-electric 0.5BZT–0.5CNF composite's recovered energy value is shown to grow with the addition of GO, and its storage efficiency also improves, rising from 5.1 percent for $ = 0 to 9.77 percent for $ = 0.5 and 11.11% for $ = 1. The increase in storage capacity can be attributed to the formation of multiple micro-capacitors and a magneto-dielectric interface upon GO reinforcement. For the composite with GO decoration above $ = 1, the efficiency of energy storage was found to be decrease to 4.84%. This type of disparity may be due to the formation of a conducting percolative pathway across the $ = 1.5 composite. Table S1 in the ESI† lists the energy storage parameters for the GO reinforced magnetoelectric composites. Owing to its ferroelectric attributes, the magnetoelectric composite can be used for harnessing the energy storage capabilities. The efficiency of the energy storage of the composite can be improved by tuning the FM% in the FE matrix of the BZT–CNF composite. The storage efficiency can be enhanced further by GO reinforcement up to $ = 1.
 | (2) |
 | (3) |
The leakage current density characteristics have been measured for CNF–BZT magnetoelectric ceramics incorporated with GO. Fig. 5(e) depicts the measured current density (J) against the electric field (E) for 0.5BZT–0.5CNF–$% GO at room temperature and in a field of 0 to ±5 kV cm−1. The current density attributes of the composites are examined under both forward and reverse bias conditions and found to exhibit symmetry under both positive and negative electric field conditions. The leakage current of 0.5CNF–0.5BZT composites can be significantly influenced by the incorporation of GO. Fig. 5(e) demonstrates that as GO content increases in magnetoelectric composites, the leakage current density rises from 3.59 × 10⁻⁵ A cm−2 at $ = 0 to 2.67 × 10⁻⁴ A cm−2 at $ = 1.5. From the observation, it can be hypothesized that the leakage current density was shown to increase with GO concentration in composites provided that the added amount of GO was greater than or equivalent to 1 wt%. The inclusion of GO as a connecting bridge weakens the insulation between the grains and the dielectric breakdown strength of the magnetoelectric composite, resulting in an increase in leakage current.
The electric conduction mechanism of the ceramic has been represented by plotting the logarithmic relationship between the leakage current J and the electric field E as shown in Fig. 5(f). Previous efforts to explain the conduction mechanism in ceramics have presented two distinct models: the ohmic conduction model and the space charge limited current model.33 It is established that the current density follows a power law distribution i.e., J ∝ En. In the case of n = 1, conduction unfolds through the ohmic conduction mechanism; nevertheless, with a value of n = 2, the mechanism transitions to the space charge limited current.69 Fitted n values are indicated in Fig. 5(f). Slope n with values of 0.97, 0.97, 1.03, and 1.11 for 0.5BZT–0.5CNF–$% GO ($ = 0, 0.5, 1, and 1.5) reveals that ohmic conduction is the only mechanism responsible for transport and leakage in these composites. For the ohmic conduction process, it is well known that current density J = eμNeE, where e is the electron's charge, μ is a free electron's mobility, Ne denotes the density of electrons, and E is the applied electric field.70 Since the leakage current density is proportional to the concentration of free electron–hole pairs (Ne), decreasing the optical band gap energy dramatically increases Ne.71 As was discussed in the prior section, the optical bandgap energy of 0.5CNF–0.5BZT was found to decrease with increasing GO concentration. Thus an increase in GO content leads to an increase in leakage current density. Both intrinsic and extrinsic sources contribute to the overall leakage current density of the composites.72 The increasing GO content in the composite alters the intrinsic properties like the band gap of the composite resulting in an increment in leakage current density. The increasing n value with an increase in GO content is due to extrinsic properties like defects in the composites. High leakage current will influence the improvement of the EMI shielding capabilities of the magnetoelectric composites.
 | (4) |
cosθ is the real part of the impedance and Z′ = Zsinθ is the imaginary part of the impedance. A and t represent the area of the electrode and the thickness of the sample, respectively.
The AC conductivity values are obtained from the relationship, σac = ωε′ε0tanδ, where ω is the angular frequency, ε′ is the real component of the dielectric constant, ε0 is the permittivity of vacuum, and tanδ is the dielectric loss. The frequency-dependent variation for composites with different GO concentrations is depicted in Fig. 6(a). The conductivity of the sample is increased by the incorporation of GO, with the increase being modest up to 0.5% GO in the BZT–CNF composite. Nevertheless, it was discovered that the conductivity of magnetoelectric composites significantly improved at 1.5% GO. The BZT–CNF–GO composite's conductive properties come from a combination of ohmic and tunneling conduction. Enhanced conductivity above 1% can be attributed to the same phenomenon of ohmic conduction occurring owing to direct contact of GO sheets when concentration is above the criterion. Below the threshold, when an external field is applied, charges tunnel from one GO sheet to another across the magneto-electric composites.
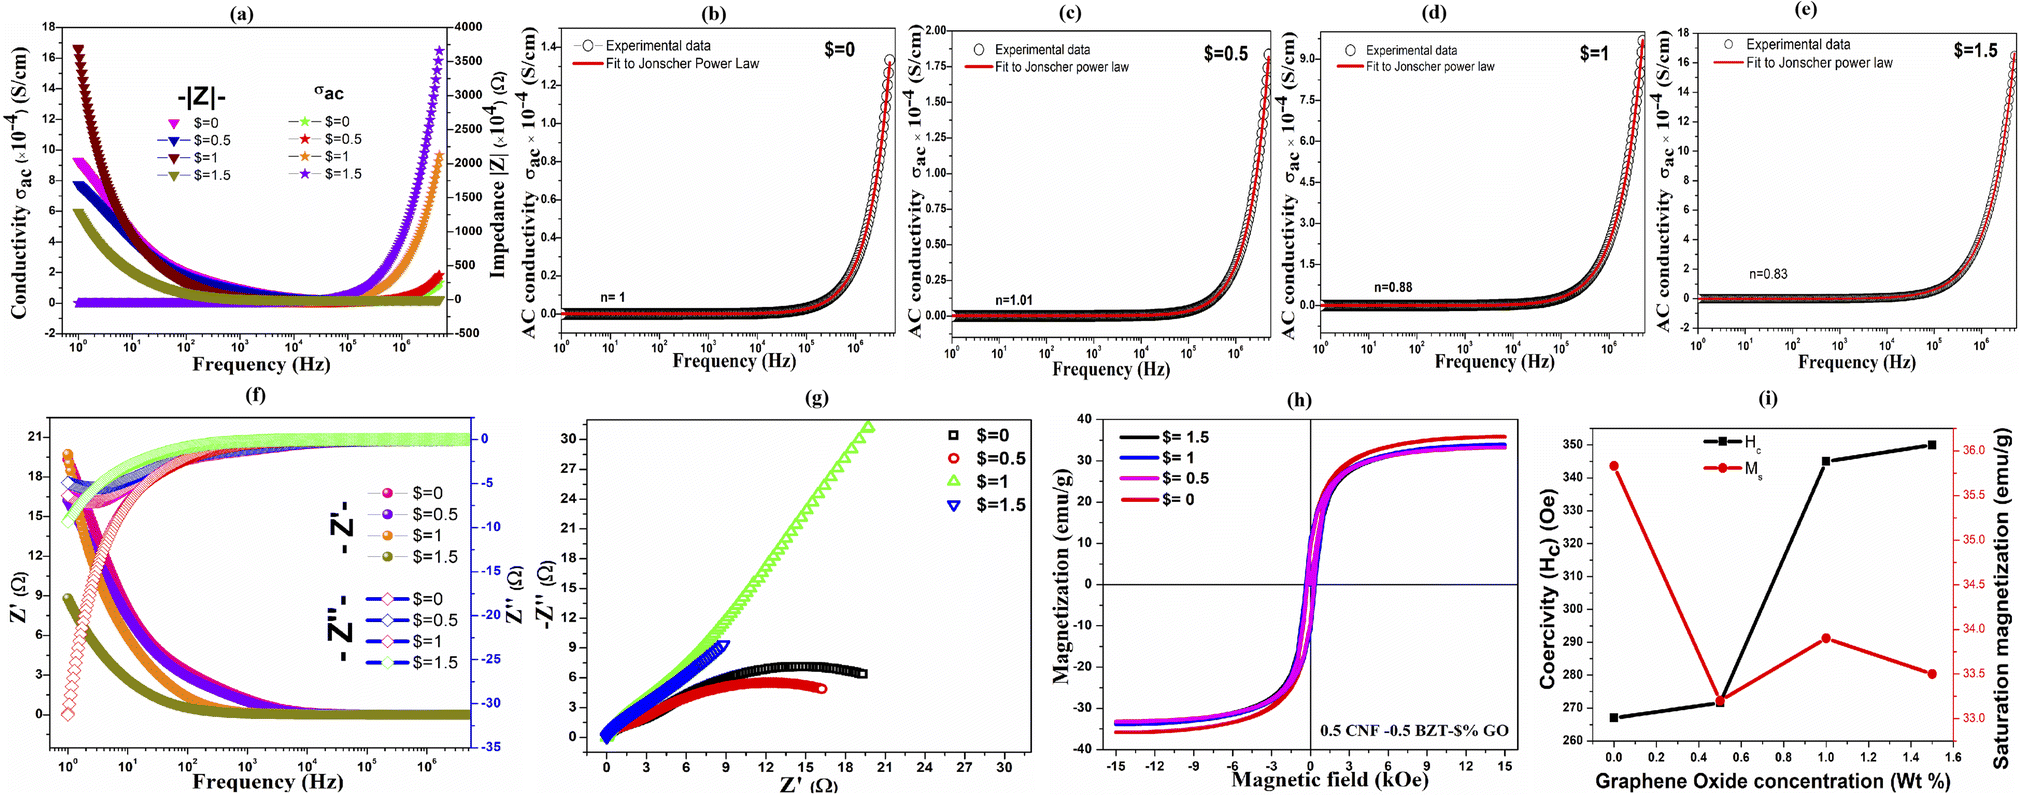 | ||
| Fig. 6 (a) Conductivity and impedance as a function of frequency for GO decorated magnetoelectric composites. (b)–(e) Power law fitting curve for the AC conductivity of 0.5BZT–0.5CNF–$% GO ($ = 0, 0.5, 1, 1.5). (f) Bode plots. (g) Nyquist plot for composites. (h) Composite's magnetization curve as a function of magnetic field. (i) Variation in coercivity and saturation magnetization with GO content in the magnetoelectric composite. | ||
The composite's electrical conductivity is found to increase with frequency at room temperature. Fig. 6(a) depicts two distinct features of AC conductivity: (i) low-frequency upland and (ii) high-frequency diffusion with a gradual slope distribution. The term “hopping frequency” is commonly used to describe the varying frequency slope. Funke uses the jump-relaxation model73 to explain the spread of conductivity with frequency. This model predicts that at low frequencies, electrons engage in a long sequence of successful hopping motions, which ultimately results in DC conductivity that is independent of frequency. As per Funke, backward hopping coexists with successful ones, just as they do in the field; the dissipative conductivity at high frequencies is a function of the ratio of these two types of hopping, as well as the relaxation of adjacent charged particles. Vault charge particles, which are distinct from free-charged particles, and confinement of charge particles in defects can be linked to the frequency-dependent rise in conductivity. At low frequencies, the hopping process is suppressed because fewer conducting grain boundaries are sandwiched between more conducting grains, as predicted using the Maxwell–Wagner bi-layer model. The hopping mechanism is strengthened by the increased activity of grains at higher frequencies. So the conductivity of ac power rises as the frequency rises.74Eqn (5) represents the universal power law, which provides insight into the subservience of conductivity.75
| σtot = Aωn + σ0 | (5) |
A complex impedance study is performed to understand the charge transport properties of 0.5BZT–0.5CNF–$% GO ($ = 0, 0.5, 1 and 1.5) composites. Fig. 6(f) illustrates the Bode plots and real and imaginary parts of impedance as a function of frequency at room temperature. At room temperature, the magnitude of the impedance Z′ is maximum in the low-frequency range and least in the high-frequency range. Due to the reduction in the barrier properties of composites caused by the release of space charge, they combine at higher frequencies. Increases in conductivity due to immobile charges at low frequency and defects at high frequency likely cause a steady drop in the impedance Z′ with increasing frequency. Furthermore, it demonstrates that the impedance Z′ of magnetoelectric composite materials at low frequencies reduces as the concentration of GO increases. Since a smaller Z′ indicates less grain clustering and a smaller potential barrier between grains, less resistance is encountered by charge carriers.68 It can be shown in Fig. 6(b) that at lower frequencies the imaginary impedance Z′′ has different values due to differing compositions, while at higher frequencies it converges, possibly because of a lack of the space-charge effect. It also demonstrates that the impedance Z′′ reaches its maximum value, which contradicts the system's tendency to relax. As relaxation time and vacancies diminish, the frequency at which the impedance Z′′ reaches its maximum value shifts upwards. Increases in frequency cause a decrease in polarization due to the accumulation of space charges in the material, which does not need a longer time to relax at higher frequencies.51 Additionally, the peak in the imaginary part of complex impedance (Bode plots) for the composite $ = 0, 0.5 suggests an activation-mediated conduction mechanism.79
Fig. 6(g) represents the Nyquist plot for the magneto-electric composites at room temperature. The advantage of the Nyquist plot is that it reveals potential mechanisms influencing phenomena by highlighting the distinctive impedance arc and the form of the curve produced by an activation-controlled process with a measurable time constant.80 Graphene oxide's (GO) electrical transport capabilities are largely determined by its oxidation state and chemical composition, both of which can be modified by removing or adding oxygen groups to control the ratio of sp2 to sp3 carbon.81 It is well known that the semiconducting properties of GO are primarily observed in the bulk form, although behaviour may depend on the level of oxidation of GO sheets.82 From the Nyquist plot, it is found that composites with $ = 0 and $ = 0.5 exhibit two semicircles in the impedance plot indicating the semiconducting nature of the grains and the insulating nature of the grain boundary. It is evident that for $ = 0 and $ = 0.5, the grain resistance (Rg) increases and the grain boundary resistance (Rgb) decreases with an increase in GO concentration in the magnetoelectric composite. These composites exhibit Debye relaxation behaviour across the measured frequency range, where two semicircular arcs have been noticed, one smaller at lower frequencies and one larger at higher frequencies, demonstrating the involvement of two distinct relaxation processes in the composite. The magnetoelectric composite $ = 0 and $ = 0.5's Nyquist plot and impedance analysis supported the composite's feasibility for electrochemical applications.
The composite with $ = 1 and $ = 1.5 displayed one arc at a lower frequency, indicating that just one relaxation process is operational. In the composite with $ = 1 and 1.5, the appearance of a semicircle that is both asymmetric and depressed suggests the existence of non-Debye relaxation in the composites, as the relaxation duration are dispersed across the composite. A reduction in resistance as a consequence of increasing GO concentration accounts for the presence of a single semicircular arc in $ = 1 and 1.5. It's believed that the rapid increase in resistance owing to grains observed at $ = 1 is caused by the percolation limit of GO in the 0.5CNF–0.5BZT composite. A possible explanation for the occurrence of non-Debye relaxation at $ = 1 and $ = 1.5 is the large grain size of the composite. This may be linked to the increased electron scattering caused by the incorporation of larger grains into the GO matrix.79 Increased composite resistance points to 0.5BZT–0.5CNF particles embedded between or on the surface of graphene oxide (GO) sheets. As resistance drops and conductivity rises, the semicircle's radius decreases, which is be evident from the Nyquist plot of composites. This further validates the role that grain and grain boundary resistance play in the composites' intrinsic conduction process.
4.5 Magnetic properties
To justify the existence of magnetic ordering in GO-reinforced magneto-electric composites, dc-magnetization measurements have been carried out as a function of a magnetic field in the range of ±1.5 T. The room temperature magnetic field dependence of the magnetization curve of 0.5BZT–0.5CNF–$% GO ($ = 0, 0.5, 1, 1.5) composites is illustrated in Fig. 6(h).For all the composites, the loop is complete and well saturated with a small opening of the hysteresis curve, which signifies the soft magnetic behavior of the synthesized material. The soft magnetic nature of the composites makes them suitable for multiple industrial applications. To understand the magnetic attributes and impact of GO addition to the composites, the magnetic parameters like the anisotropy constant (K), experimental magnetic moment (ηB) value, and squareness value (R) are estimated and tabulated in Table 3. The squareness values (R) of the composites are measured via the relationship83 and the R-value in the 0.5BZT–0.5CNF–$% GO ($ = 0, 0.5, 1, 1.5) composite is less than 0.5, which signifies the presence of multi-phase domains in the composite.84 It is noticed that the K value initially decreases with the decoration of GO at 0.5 wt% in 0.5BZT–0.5CNF. However, a further increase in GO concentration in the composite leads to an increment in the magnetic anisotropy constant and the diamagnetic behaviour of GO reduced the value for experimental magnetic moment per unit formula in the Bohr magnetron of the composite as shown in Table 3.
| Magnetic properties | Electromagnetic shielding (dB) | |||||||||||
|---|---|---|---|---|---|---|---|---|---|---|---|---|
| M s (emu g−1) | M r (emu g−1) | H c (Oe) | M r/Ms | K (emu Oe g−1) × 102 | η B | RLmin | SEmax | SEr max | SEabs max | SEtotal max | SSEmax | |
| $ = 0 | 35.82 | 9.86 | 268.08 | 0.27 | 100.05 | 1.52 | −54.9 | 38.50 | 20.55 | 64.75 | 77.01 | 66.84 |
| $ = 0.5 | 33.19 | 9.45 | 272.81 | 0.28 | 94.32 | 1.41 | −46.9 | 43 | 17.3 | 84.43 | 85.99 | 67.60 |
| $ = 1 | 33.89 | 10.95 | 345.75 | 0.32 | 122.08 | 1.44 | −42.1 | 41.97 | 17.31 | 80.94 | 83.95 | 67.26 |
| $ = 1.5 | 33.46 | 10.70 | 351.26 | 0.31 | 122.44 | 1.42 | −33.2 | 47.72 | 24.54 | 95.09 | 95.44 | 75.03 |
The prepared ceramic composite BZT–CNF is a mixture of the multiferroic FE phase of BZT and the FM phase of CNF. Furthermore, the coupling of two order parameters enables multiferroic composites to demonstrate magnetism well within domain wall ordering when in the FE phase.85 However, the magnetic behaviour of the composites is dominated and mostly contributed by the magnetic ordering of the CNF phase. It is observed that upon the introduction of the FM phase into the FE matrix in a particulate manner, the saturated magnetization decreased whereas the coercive field increased. This resulted due to the pinning of magnetic spins by the ferroelectric domains in the magneto-electric composites. For magnetic spins, the ferroelectric domain boundaries act as pins, and the spin density fluctuates in the area around ferroelectric walls.86 This signifies the magnetic loss in the prepared ceramic composite, which can be exploited for electromagnetic interference shielding applications.
Fig. 6(i) displays the variation of saturation magnetization and the coercive field as a function of GO content in the 0.5BZT–0.5CNF composite. The introduction of GO into the magneto-electric composite results in further decreases in saturation magnetization. The difference in saturation magnetization (Ms) in GO-reinforced composites is due to the paramagnetic nature of GO. Since GO functions as a composite membrane, it is evident that when GO concentration rises, the composite's magnetic moment will also decline.87 The anonymous little increase in Ms for the composite with 1% GO may be due to the effect of critical concentration of GO reinforcement on the composite. The coercivity (Hc) of the composite increases with GO concentration. With 1% GO in the composite, there is a large change in the Hc value, which corresponds to the critical concentration of GO, which is also observed and explained in the previous characterization. However, there are no significant changes in the coercive field for the GO-reinforced magneto-electric composite, thus indicating the soft magnetic nature of microwave-sintered magnetoelectric composites. The GO concentration in the BZT–CNF composite increases the magnetic loss, thus making this prepared ceramic composite a suitable candidate for EMI/EMC applications.
4.6 Microwave absorption and electromagnetic interference shielding properties
Shielding against electromagnetic interference (EMI) is a practice to avoid the propagation of electromagnetic waves from one location to another. Shielding efficiency is an indicator of a shield's efficient implementation. Any electromagnetic (EM) shielding material has a shielding efficiency measured in decibels (dB), which is the logarithmic proportion of the power of incident and transmitted radiation on its surface. The performance of the shield can be established by applying the equations outlined below.10,88| RL = 10log10(R) | (6) |
| SE = 10log10(T) | (7) |
| SER = −10log10(1 − R) | (8) |
 | (9) |
The intrinsic shielding performance of a material can be determined through the specific shielding efficiency (SSE) per unit thickness of the material, which is provided as16
 | (10) |
To evaluate the efficacy of 0.5BZT–0.5CNF–$% GO ($ = 0, 0.5, 1, 1.5) magneto-electric composites to attenuate electromagnetic interference, the S parameters are measured in the X band range (8.2–12.4 GHz) at a sample thickness of 2.4 mm. Fig. 7(a) illustrates the reflection loss and shielding efficiency of GO-reinforced magnetoelectric composites in the X-band range. For $ = 0, two RL peaks are obtained at 9.68 GHz and 11.6 GHz and the lowest value of reflection loss, −54.9 dB, occurs at a frequency of 9.68 GHz. For 0.5BZT–0.5CNF, the maximum total shielding efficiency due to absorption and reflection is found to be 77.01 dB at 8.54 GHz frequency and an SSE value of 66.84 dB cm2 g−1 is achieved. Table 3 depicts the shielding parameter of 0.5BZT–0.5CNF–$% GO ($ = 0, 0.5, 1, 1.5) composites. The microwave absorption capabilities of the ferrite-ferroelectric composite are improved by combining the magnetic properties of CNF with high-permittivity BZT compared to microwave attenuation of individual phases. An apparent dielectric and magnetic interface can generate the magneto-dielectric hetero-junction, which could serve as a focal point for microwave attenuation.89
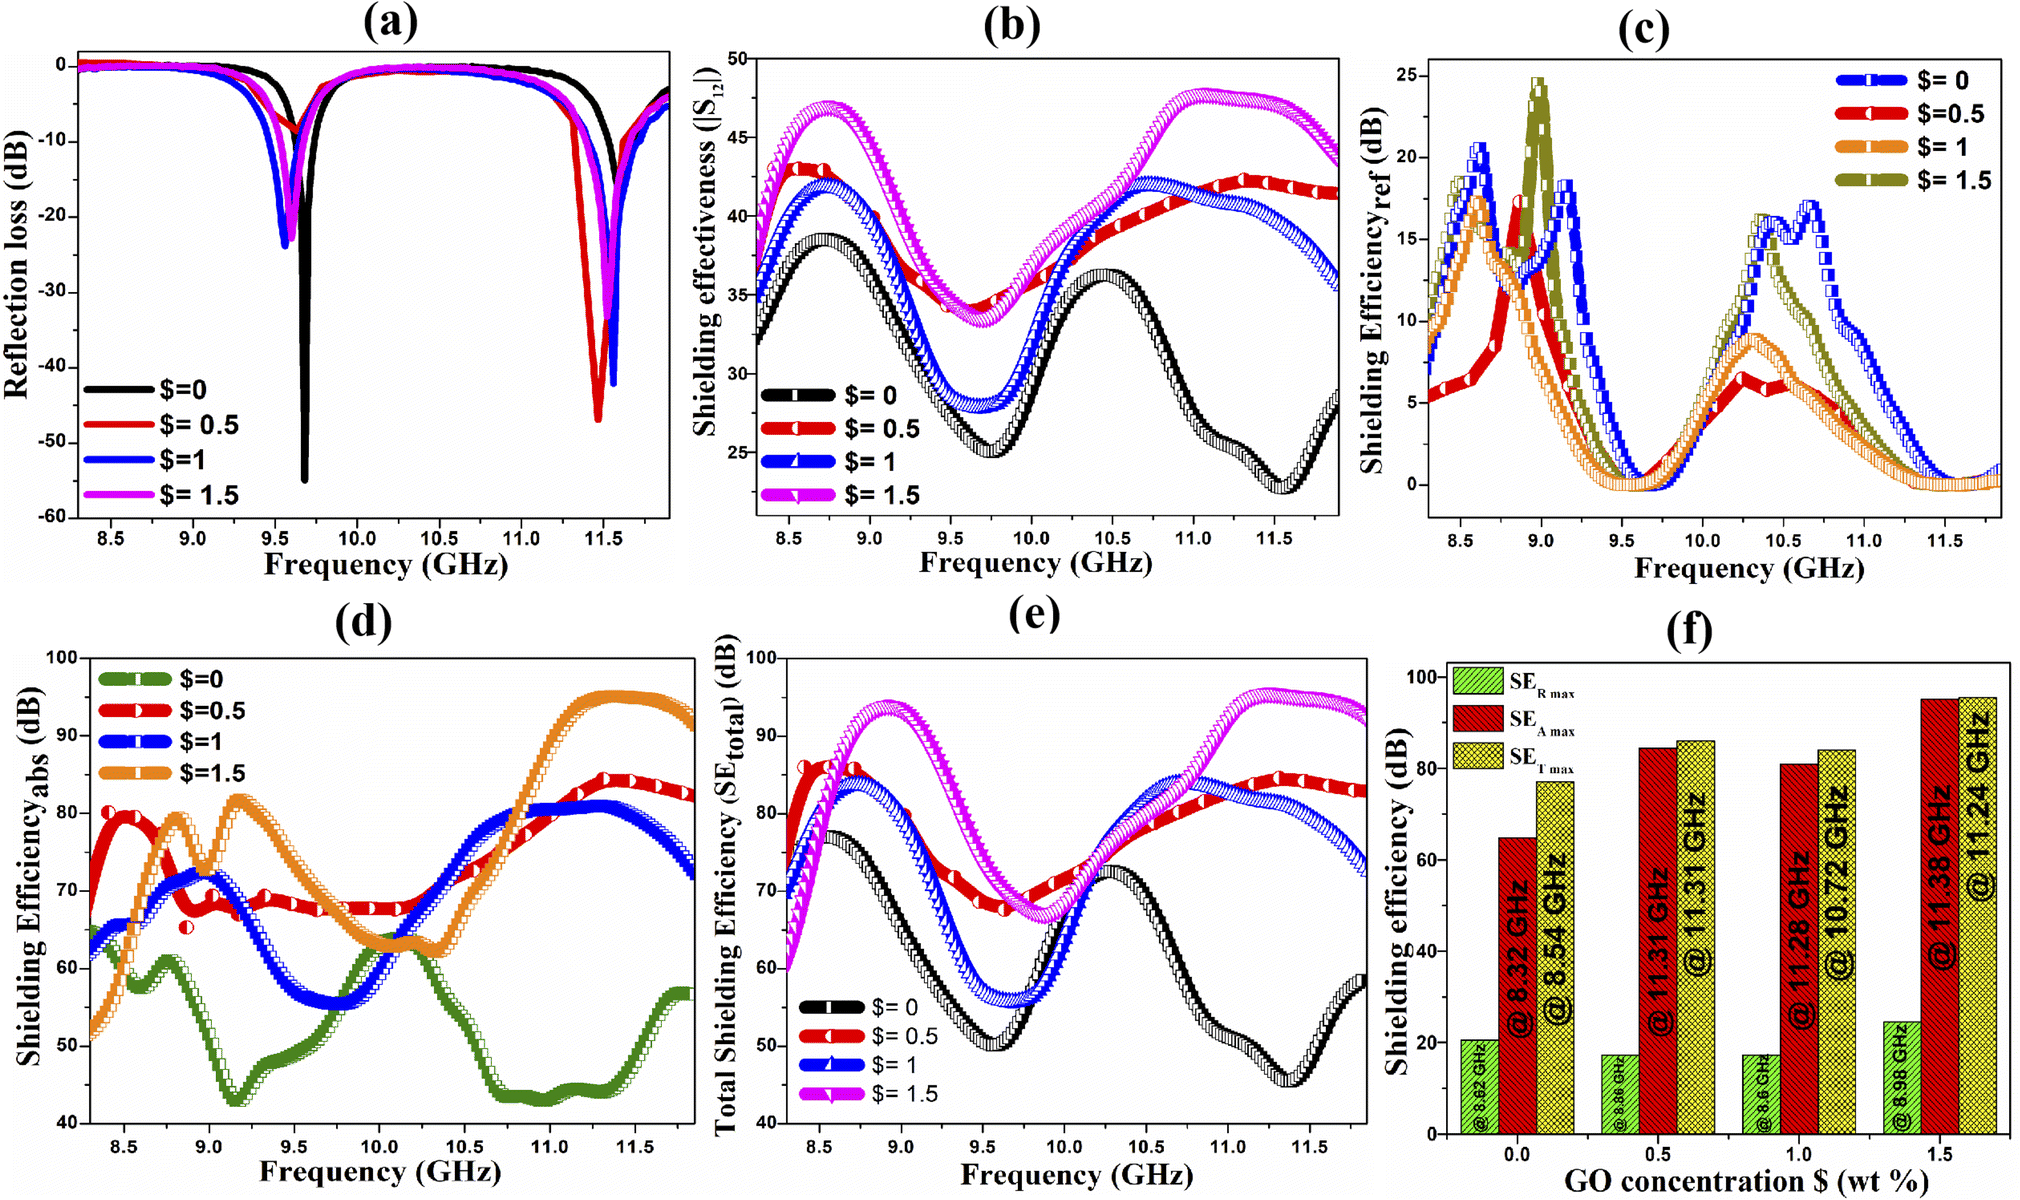 | ||
| Fig. 7 (a) Reflection loss graph for magnetoelectric composites. (b) Shielding efficiency curve. (c) Graph for the efficiency of shielding due to reflection. (d) Shielding efficiency of the composites due to absorption of EM waves. (e) Total shielding efficiency of GO decorated magnetoelectric composites. (f) Graphical representation for the effect of GO content on the shielding efficiency of 0.5BZT–0.5CNF–$% GO ($ = 0.5, 1, 1.5). | ||
To be an effective shielding layer, a material ought to exhibit the impedance matching condition, necessitating that the magnetic permeability value of the shielding material is close to its electric permittivity value. Impedance mismatch can be mitigated and EM radiation absorption can be enhanced by incorporating a suitable filler (graphene oxide for the present investigation) for the ferromagnetic and ferroelectric matrix into the magnetoelectric composites.90Table 3 and Fig. 7(d) and (e) shows that the $ = 1.5 composite exhibited the highest SET, SEabs, and SSE among all the composites. Incorporating GO into the composites enhanced the microwave absorption attributes, evidenced in the table and the figure. Similar observations were reported previously by Sumit et al.16 and Samadi et al.91 The maximum RL for the 0.5CNF–0.5BZT composite moves to a higher frequency range of 11.5 GHz after GO is introduced, from a frequency of 9.68 GHz for the magnetoelectric composite. As discussed in the microstructural study, the composite's dispersibility improves with GO reinforcement, resulting in smaller particle sizes equally dispersed on the GO layers. As a result of this enhanced dispersibility, it is hypothesized that the magneto-dielectric heterostructure interfaces between CNF and BZT, which serve as the microwave absorption center, occur more frequently.39 Microwave absorption and the fractional bandwidth are improved by increasing the surface area and compactness brought about by the creation of hetero-structural connections, which in turn result from an increase in the number of interfaces.
The improvement in shielding efficiency is attributed to the creation of a hybrid conducting network inside the composite materials, which is a necessity for effective EMI shielding. As was previously explained, the AC conductivity of magneto-electric composites was enhanced by the inclusion of graphene oxide. It, therefore, indicates that the hybrid composite's electrical conductivity can be improved by the incorporation of GO. Notably, two-dimensional graphene oxide has interwoven to create a continuous percolated network, which in turn built hierarchical structures to increase the number of channels that electrons can travel through with high conductivity.92 For electromagnetic interference shielding the introduction of GO increases the number of free electrons, functional groups, and defects available to interact with the incident EM radiation, leading to the formation of electric dipoles that dissipate the energy through relaxation losses. Subsequently, the addition of GO generates a rise in interfacial relaxation losses due to an increase in electron hopping across the conductive network of GO, thereby turning more EM energy into heat.
In the magnetoelectric composite, the ferrite particles serve as magnetization centers, while conductive graphene oxide (GO) networks and the ferroelectric BZT matrix serve as polarization centers, allowing the hybrid structure to trap maximum incident electromagnetic radiations within the multiple heterogeneous interfacial regions. The magnetoelectric particles act as electron migration/hoping bridges, causing tiny current networks to form and increasing the conduction losses within the material.93 Micro-currents are generated as a result of the interaction of electromagnetic waves in these network structures, and the resulting heat dissipates the electromagnetic energy. Within the arranged, interconnected network structure of composite with graphene oxide, electromagnetic radiations undergo absorption and multiple internal scattering.
The results reflect that the GO-reinforced composite shield has increased electric and magnetic losses, leading to a high absorption efficiency for incident EM waves. The best total shielding efficiency of 95.44 dB at 11.26 GHz is exhibited in magnetoelectric composites with $ = 1.5, and the highest specific shielding efficiency of 75.03 dB cm2 g−1 is evident in these materials as well. The efficiency of magnetoelectric composite materials as an EW shield is shown in Table 4, together with existing results given in the literature; these results show that the hybrid composite networks defined in this study improve shielding effectiveness. In conclusion, the EMI shielding material suggested by the composite samples proves to be highly effective and chemically stable.
| Synthesis conditions | σ ac (S cm−1) | M s (emu g−1) | Frequency (GHz) | SE (dB) | Ref. | |
|---|---|---|---|---|---|---|
| NiFe2O4–BaTiO3–AP | High energy milling | — | 15.2 | 16.8 | RLmin = −39.8 | 28 |
| BaFe12O19–CQD@BaTiO3 | Sol–gel auto-combustion | — | — | 10.21 | RLmin = −25.3 | 94 |
| BaTiO3–CoFe2O4–LDPE | Co-precipitation and melt mixing | — | — | 9.4 | SEt = 7.9 | 95 |
| NiCoZnFe2O4–BaTiO3 fiber | Electrospinning with sol–gel | — | 34.5 | 8.2 | RLmin = −30.7 | 96 |
| Y–Ag–BiFeO3 | Sol–gel auto-combustion | — | 0.98 | 8.36 | SE = 23.05 | 97 |
| SrFe12O19/CoFe2O4/NiO | Solvothermal | 240 S m−1 at 12 GHz | 24.6 | 10.7 | RLmin = −36 | 98 |
| PVDF–MWCNT | Film casting-compression molding | 75.7 S m−1 | — | 34 | SEt = 99.3 | 99 |
| Ni–MOF–rGO aerogel | Facile solvothermal | — | 36 | 17.52 | RLmin = −51.9 | 100 |
| CFF/Ag/PDMS | Electroless plating | 540.9 | — | 8.2–12.4 | SE = 105 | 101 |
| NiFe2O4–BaTiO3 | Solid state reaction | — | — | 8–12 | SE > 34 | 102 |
| TOCNF/Ti3C2Tx/AgNW | Vacuum assisted filtration | 1.2 × 10⁷ S m−1 | — | 8.2–12.4 | SE = 45.57 | 92 |
| MXene/polyaramid | Hydrogen-bonding induced self-assembly | — | — | 8.2–12.4 | SE = 38.9 | 103 |
| MXene/Co2–Ba hexaferrite/PVDF | Electrospinning-microwave treatment | — | — | 11.9 | RLmin = −32 | 104 |
| Phosphate-bonded CFO–BTO | Phosphate bonded ceramic approach | — | — | 45 | SE = 40 | 105 |
| Nb2O5–N doped CNF | Electrospinning | 1.47 | — | 8.2–26.5 | SE = 67 | 106 |
| ZnO/PVDF/MXene | Hydrothermal-electrospinning | — | — | 8–12 | SE = 61 | 21 |
| CoNiFe2O4–BaZrTiO3–GO | Microwave sintering | 4.51 × 10⁻⁴ at 1 MHz | 35.8–33.46 | 11.24 | $ = 1.5; SEt max = 95.44 | Present work |
5 Conclusion
In summary, an innovative magnetoelectric composite with superior EM wave attenuation properties has been demonstrated for the first time in the present study. The composite is strategically reinforced with home-grown graphene oxide (GO) to improve overall electromagnetic interference shielding performance. Both the ferroelectric BaZr0.2Ti0.8O3 and the ferromagnetic Co0.75Ni0.25Fe2O4 phases can be confirmed by X-ray diffraction, and the presence and influence of GO on the composite can be demonstrated by infrared spectroscopy. Studies of magnetic and ferroelectric properties demonstrate the presence of ferroelectric and magnetic order, as well as the change of this order concerning the contents of GO. The ability of the magnetoelectric composite to store energy has been proven to be enhanced by the addition of GO reinforcement. From the ferroelectric examination, it is evident that the BZT–CNF magnetoelectric composite with GO decoration can be utilized for energy storage application via tailoring the FE–FM composition of the composite. The relative permittivity (εr) and relaxor nature of the composite with the conductivity of the magnetoelectric composite have been determined to increase as GO is incorporated, evidenced by dielectric and electric investigations. Impedance studies reveal the Debye relaxation behavior for the magnetoelectric composite and the composite with 0.5% GO. Based on the findings, modifying composites with graphene oxide improves impedance matching, which in turn enhances the composites' microwave shielding effect. It has been shown that adding GO to a magnetoelectric composite improves the material's ability to absorb microwaves, making it a very promising candidate for use as a microwave-absorbing coating in stealth technology. The minimum reflection loss of −33.2 dB with a SSE of 74.59 dB cm2 g−1 and SEtotal of over 94.8 dB at a bandwidth of 11.5 GHz demonstrates the composites' enormous promise in environmentally friendly EMI shielding technologies.Author contributions
Chinmay Chandan Parhi (1st author): conceptualization, synthesis, experiments, data collection and analysis, and draft preparation. Avanish Babu T. (2nd author): contributed to synthesis. AR James (3rd author): supervised the project and draft preparation. Yogesh Choukiker (4th author): provided the instrumental facility and assisted in the EMW attenuation study. Madhuri W. (corresponding author): conceptualization, final drafting and supervised the overall project.Conflicts of interest
There are no conflicts to declare.Acknowledgements
The authors are grateful to the Ceramic Composite Group, Defence Metallurgical Research Laboratory, Hyderabad for supporting and providing characterization facilities. The authors specially thank Dr M. L. V. Mahesh, Sc ‘D’, DMRL, Hyderabad for his valuable suggestions. The authors are thankful to VIT, Vellore for providing research facilities. CCP acknowledges the Nanotechnology Research Centre (NRC), SRMIST for providing the research facilities.Notes and references
- Z. Cheng, R. Wang, Y. Wang, Y. Cao, Y. Shen, Y. Huang and Y. Chen, Carbon, 2023, 205, 112–137 CrossRef CAS.
- H. Won, Y.-K. Hong, M. Choi, H. Garcia, D. Shin, Y.-S. Yoon, K. Lee, H. Xin and C.-D. Yeo, J. Magn. Magn. Mater., 2022, 560, 169523 CrossRef CAS.
- X. He, J. Zhou, J. Tao, Y. Liu, B. Wei, Z. Yao and X. Tao, J. Colloid Interface Sci., 2022, 626, 123–135 CrossRef CAS PubMed.
- M.-S. Cao, X.-X. Wang, M. Zhang, J.-C. Shu, W.-Q. Cao, H.-J. Yang, X.-Y. Fang and J. Yuan, Adv. Funct. Mater., 2019, 29, 1807398 CrossRef.
- Y. Stein and I. G. Udasin, Environ. Res., 2020, 186, 109445 CrossRef CAS.
- X. Luo, X. Huang, Z. Luo, Z. Wang, G. He, Y. Tan, B. Zhang, H. Zhou, P. Li and T. Shen, et al. , Ecotoxicol. Environ. Saf., 2021, 228, 112980 CrossRef CAS PubMed.
- W. Chongchitpaisan, P. Wiwatanadate, S. Tanprawate, A. Narkpongphan and N. Siripon, Am. J. Public Health, 2019, 7, 161–166 Search PubMed.
- Z. Cheng, R. Wang, Y. Wang, Y. Cao, Y. Shen, Y. Huang and Y. Chen, Carbon, 2023, 205, 112–137 CrossRef CAS.
- Y. Cao, Z. Zeng, D. Huang, Y. Chen, L. Zhang and X. Sheng, Nano Res., 2022, 15, 8524–8535 CrossRef CAS.
- V. Shukla, Nanoscale Adv., 2019, 1, 1640–1671 RSC.
- J. Liu, M.-Y. Yu, Z.-Z. Yu and V. Nicolosi, Mater. Today, 2023, 66, 245–272 CrossRef.
- C. Pavlou, M. G. Pastore Carbone, A. C. Manikas, G. Trakakis, C. Koral, G. Papari, A. Andreone and C. Galiotis, Nat. Commun., 2021, 12, 4655 CrossRef CAS PubMed.
- Q.-W. Wang, H.-B. Zhang, J. Liu, S. Zhao, X. Xie, L. Liu, R. Yang, N. Koratkar and Z.-Z. Yu, Adv. Funct. Mater., 2019, 29, 1806819 CrossRef.
- Q. Song, F. Ye, X. Yin, W. Li, H. Li, Y. Liu, K. Li, K. Xie, X. Li and Q. Fu, et al. , Adv. Mater., 2017, 29, 1701583 CrossRef.
- A. Iqbal, F. Shahzad, K. Hantanasirisakul, M.-K. Kim, J. Kwon, J. Hong, H. Kim, D. Kim, Y. Gogotsi and C. M. Koo, Science, 2020, 369, 446–450 CrossRef CAS PubMed.
- S. Kumar, R. Walia, A. Kumar and V. Verma, RSC Adv., 2021, 11, 9775–9787 RSC.
- P. Sahoo, L. Saini and A. Dixit, Oxford Open Mater. Sci., 2023, 3, itac012 CrossRef.
- L. Wang, Y. Huang, X. Sun, H. Huang, P. Liu, M. Zong and Y. Wang, Nanoscale, 2014, 6, 3157–3164 RSC.
- H. Yu, T. Wang, B. Wen, M. Lu, Z. Xu, C. Zhu, Y. Chen, X. Xue, C. Sun and M. Cao, J. Mater. Chem., 2012, 22, 21679–21685 RSC.
- P. Yin, L. Zhang, P. Sun, J. Wang, X. Feng, Y. Zhang, J. Dai and Y. Tang, Ceram. Int., 2020, 46, 13641–13650 CrossRef CAS.
- S. Lee, M. Kim, V. A. Cao, J. Park, I.-J. Yoon, P. Park and J. Nah, J. Mater. Chem. C, 2023, 11, 1522–1529 RSC.
- Z. Ma, J. Li, J. Zhang, A. He, Y. Dong, G. Tan, M. Ning, Q. Man and X. Liu, J. Mater. Sci. Technol., 2021, 81, 43–50 CrossRef CAS.
- Y. Yao, S. Jin, D. Wang, J. Wang, D. Li, X. Lv and Q. Shu, Compos. Sci. Technol., 2022, 222, 109387 CrossRef CAS.
- M.-S. Cao, W.-L. Song, Z.-L. Hou, B. Wen and J. Yuan, Carbon, 2010, 48, 788–796 CrossRef CAS.
- X. Huang, T. Leng, T. Georgiou, J. Abraham, R. Raveendran Nair, K. S. Novoselov and Z. Hu, Sci. Rep., 2018, 8, 43 CrossRef PubMed.
- P. Liu, Z. Yao, J. Zhou, Z. Yang and L. B. Kong, J. Mater. Chem. C, 2016, 4, 9738–9749 RSC.
- K. Zhang, X. Li, Y. Li, J. Lv, R. Qin, X. Wang, X. Liu and Y. Liu, Chem. Eng. J., 2022, 433, 134455 CrossRef CAS.
- D. S. Lam, N. N. Tung, D. D. Dung, B. X. Khuyen, V. D. Lam and T. D. Thanh, Mater. Res. Express, 2022, 9, 075004 CrossRef.
- X. Liu, Y. Chen, X. Cui, M. Zeng, R. Yu and G.-S. Wang, J. Mater. Chem. A, 2015, 3, 12197–12204 RSC.
- L. Saini, R. K. Jani, Y. Janu, M. Kumar, M. K. Patra and A. Dixit, Ceram. Int., 2021, 47, 22397–22403 CrossRef CAS.
- L. Saini, Y. Janu, M. K. Patra, R. K. Jani, G. K. Gupta, A. Dixit and S. R. Vadera, J. Am. Ceram. Soc., 2016, 99, 3002–3007 CrossRef CAS.
- G.-M. Shi, Y.-F. Li, L. Ai and F.-N. Shi, J. Alloys Compd., 2016, 680, 735–743 CrossRef CAS.
- C. C. Parhi, A. B. Thirumalasetty, A. R. James and M. Wuppulluri, ACS Omega, 2023, 8, 37752–37768 CrossRef CAS PubMed.
- R. Santhosh, S. S. Raman, S. M. Krishna, S. sai Ravuri, V. Sandhya, S. Ghosh, N. K. Sahu, S. Punniyakoti, M. Karthik and P. Kollu, et al. , Electrochim. Acta, 2018, 276, 284–292 CrossRef CAS.
- N. M. Huang, H. Lim, C. H. Chia, M. A. Yarmo and M. Muhamad, Int. J. Nanomed., 2011, 3443–3448 CrossRef CAS PubMed.
- S. Sarangi, T. Badapanda, B. Behera and S. Anwar, J. Mater. Sci.: Mater. Electron., 2013, 24, 4033–4042 CrossRef CAS.
- C. Singh, A. Goyal and S. Singhal, Nanoscale, 2014, 6, 7959–7970 RSC.
- G. H. Rather, N. Nazir, A. Ikram, M. Ikram and B. Want, et al. , J. Alloys Compd., 2021, 887, 161446 CrossRef CAS.
- R. Bhattacharyya, O. Prakash, S. Roy, A. P. Singh, T. K. Bhattacharya, P. Maiti, S. Bhattacharyya and S. Das, Sci. Rep., 2019, 9, 12111 CrossRef PubMed.
- S.-J. Mu, Y.-C. Su, L.-H. Xiao, S.-D. Liu, T. Hu and H.-B. Tang, Chin. Phys. Lett., 2013, 30, 096101 CrossRef.
- C. C. Parhi, Ferroelectrics, 2022, 589, 177–189 CrossRef CAS.
- M. Xiao, N. Li, Z. Ma, H. Song, K. Lu, A. Li, Y. Meng, D. Wang and X. Yan, RSC Adv., 2017, 7, 56602–56610 RSC.
- P. Augustine, Y. Narayana and N. Kalarikkal, Nanoscale Adv., 2021, 3, 4866–4877 RSC.
- M. Ebrahimi Naghani, M. Neghabi, M. Zadsar and H. Abbastabar Ahangar, Sci. Rep., 2023, 13, 1496 CrossRef CAS PubMed.
- M. L. Myrick, M. N. Simcock, M. Baranowski, H. Brooke, S. L. Morgan and J. N. McCutcheon, Appl. Spectrosc. Rev., 2011, 46, 140–165 CrossRef.
- S. Samanta, V. Sankaranarayanan and K. Sethupathi, Vacuum, 2018, 156, 456–462 CrossRef CAS.
- R. Kubo, J. Phys. Soc. Jpn., 1962, 17, 975–986 CrossRef CAS.
- S. Sharma, H. Sharma, S. Kumar, S. Thakur, R. Kotnala and N. Negi, J. Mater. Sci.: Mater. Electron., 2020, 31, 19168–19179 CrossRef.
- D. Baba Basha, N. Suresh Kumar, K. Chandra Babu Naidu and G. Ranjith Kumar, Sci. Rep., 2022, 12, 12723 CrossRef CAS PubMed.
- R. Sharma, P. Pahuja and R. Tandon, Ceram. Int., 2014, 40, 9027–9036 CrossRef CAS.
- A. Bougoffa, E. Benali, A. Benali, M. Bejar, E. Dhahri, M. Graça, M. Valente, G. Otero-Irurueta and B. Costa, RSC Adv., 2022, 12, 6907–6917 RSC.
- Y. Wang, Y. Wang, W. Rao, M. Wang, G. Li, Y. Li, J. Gao, W. Zhou and J. Yu, J. Mater. Sci.: Mater. Electron., 2012, 23, 1064–1071 CrossRef CAS.
- K. Patankar, S. Joshi and B. Chougule, Phys. Lett. A, 2005, 346, 337–341 CrossRef CAS.
- S. P. Muduli, S. Parida, S. Nayak and S. K. Rout, Polym. Compos., 2020, 41, 2855–2865 CrossRef CAS.
- O. Jayakumar, E. H. Abdelhamid, V. Kotari, B. P. Mandal, R. Rao, V. M. Naik, R. Naik and A. Tyagi, et al. , Dalton Trans., 2015, 44, 15872–15881 RSC.
- M. El-Desoky, N. Gazouly, A. E. Hannor and H. A. Yousef, Appl. Phys. A: Mater. Sci. Process., 2022, 128, 1033 CrossRef CAS.
- S. Kumar and K. Varma, Bull. Mater. Sci., 2014, 37, 1233–1241 CrossRef CAS.
- L. K. Pradhan, R. Pandey, S. Kumar, S. Supriya and M. Kar, J. Phys. D: Appl. Phys., 2018, 51, 375301 CrossRef.
- S. Basu, K. R. Babu and R. Choudhary, Mater. Chem. Phys., 2012, 132, 570–580 CrossRef CAS.
- U. O. Uyor, A. P. Popoola, O. Popoola and V. S. Aigbodion, Adv. Polym. Technol., 2018, 37, 2838–2858 CrossRef CAS.
- H. S. Mohanty, A. Kumar, P. K. Kulriya, R. Thomas and D. K. Pradhan, et al. , Mater. Chem. Phys., 2019, 230, 221–230 CrossRef CAS.
- U. Chowdhury, S. Goswami, D. Bhattacharya, A. Midya and P. Mandal, Appl. Phys. Lett., 2016, 109(9), 092902 CrossRef.
- L. Mitoseriu and V. Buscaglia, Phase Transitions, 2006, 79, 1095–1121 CrossRef CAS.
- N. S. Sowmya, A. Srinivas, K. V. G. Reddy, J. P. Praveen, D. Das, S. D. Kumar, V. Subramanian and S. Kamat, Ceram. Int., 2017, 43, 2523–2528 CrossRef.
- M.-S. Cao, X.-X. Wang, M. Zhang, W.-Q. Cao, X.-Y. Fang and J. Yuan, Adv. Mater., 2020, 32, 1907156 CrossRef CAS PubMed.
- S. Ishaq, F. Kanwal, S. Atiq, M. Moussa, U. Azhar, M. Imran and D. Losic, Materials, 2018, 11, 1553 CrossRef PubMed.
- M. A. Rahman and G.-S. Chung, J. Alloys Compd., 2013, 581, 724–730 CrossRef.
- I. Alam, K. Sa, S. Das, B. V. R. S. Subramanyam, J. Raiguru, B. Samanta, P. Kumar and P. Mahanandia, Phys. Status Solidi A, 2019, 216, 1900108 CrossRef CAS.
- J. Liu, M. Niu, L. Wang, C. Peng and D. Xu, J. Magn. Magn. Mater., 2020, 510, 166928 CrossRef CAS.
- M. Rhaman, M. Matin, M. Al Mamun, A. Hussain, M. Hossain, B. Das, M. Hakim and M. Islam, J. Mater. Sci.: Mater. Electron., 2020, 31, 8727–8736 CrossRef CAS.
- M. Grätzel, Nature, 2001, 414(6861), 338–344 CrossRef PubMed.
- T. Kawae, Y. Terauchi, H. Tsuda, M. Kumeda and A. Morimoto, Appl. Phys. Lett., 2009, 94(11), 112904 CrossRef.
- R. Choudhary, K. Perez, P. Bhattacharya and R. Katiyar, Mater. Chem. Phys., 2007, 105, 286–292 CrossRef CAS.
- A. Bhavikatti, S. Kulkarni and A. Lagashetty, Int. J. Eng. Sci. Technol., 2010, 2, 6532–6539 Search PubMed.
- T. Jardiel, A. Caballero and M. Villegas, J. Eur. Ceram. Soc., 2007, 27, 4115–4119 CrossRef CAS.
- A. Kumari, S. Sanghi, A. Agarwal and O. Singh, Ceram. Int., 2021, 47, 23088–23100 CrossRef CAS.
- B. Parida, P. R. Das, R. Padhee and R. Choudhary, Bull. Mater. Sci., 2013, 36, 883–892 CrossRef CAS.
- S. Hajra, M. Sahu, V. Purohit and R. Choudhary, Heliyon, 2019, 5, e01654 CrossRef PubMed.
- G. Khurana, N. Kumar, S. Kooriyattil and R. S. Katiyar, J. Appl. Phys., 2015, 117(17), 17E106 CrossRef.
- E. Barsoukov and J. R. Macdonald, Impedance Spectroscopy: Theory, Experiment, and Applications, John Wiley & Sons, 2018 Search PubMed.
- P. Johari and V. B. Shenoy, ACS Nano, 2011, 5, 7640–7647 CrossRef CAS PubMed.
- G. Venugopal, K. Krishnamoorthy, R. Mohan and S.-J. Kim, Mater. Chem. Phys., 2012, 132, 29–33 CrossRef CAS.
- C. Aziz and B. Azhdar, J. Magn. Magn. Mater., 2022, 542, 168577 CrossRef CAS.
- S. Sharma, H. Sharma, S. Thakur, J. Shah, R. Kotnala and N. Negi, J. Magn. Magn. Mater., 2021, 538, 168243 CrossRef CAS.
- M. Daraktchiev, G. Catalan and J. F. Scott, Phys. Rev. B: Condens. Matter Mater. Phys., 2010, 81, 224118 CrossRef.
- Z. Gareeva and A. Zvezdin, Europhys. Lett., 2010, 91, 47006 CrossRef.
- S. Sarkar, K. Raul, S. Pradhan, S. Basu and A. Nayak, Phys. E, 2014, 64, 78–82 CrossRef CAS.
- S. Sharma, V. Gupta, R. Tandon and V. Sachdev, RSC Adv., 2016, 6, 18257–18265 RSC.
- Y. Liu, Z. Chen, Y. Zhang, R. Feng, X. Chen, C. Xiong and L. Dong, ACS Appl. Mater. Interfaces, 2018, 10, 13860–13868 CrossRef CAS PubMed.
- A. M. Gama, M. C. Rezende and C. C. Dantas, J. Magn. Magn. Mater., 2011, 323, 2782–2785 CrossRef CAS.
- A. Samadi, S. M. Hosseini and M. Mohseni, Org. Electron., 2018, 59, 149–155 CrossRef CAS.
- B. Wang, W. Zhang, J. Sun, C. Lai, S. Ge, H. Guo, Y. Liu and D. Zhang, J. Mater. Chem. A, 2023, 11, 8656–8669 RSC.
- B. Zhao, L. Liang, J. Deng, Z. Bai, J. Liu, X. Guo, K. Gao, W. Guo and R. Zhang, CrystEngComm, 2017, 19, 6579–6587 RSC.
- S. Goel, A. Tyagi, A. Garg, S. Kumar, H. B. Baskey, R. K. Gupta and S. Tyagi, J. Alloys Compd., 2021, 855, 157411 CrossRef CAS.
- K. Vaid, A. Chaurasia, D. Rathore, R. Singhal and U. K. Dwivedi, Polym. Compos., 2021, 42, 819–827 CrossRef CAS.
- J. Xiang, Z. Hou, X. Zhang, L. Gong, Z. Wu and J. Mi, J. Alloys Compd., 2018, 737, 412–420 CrossRef CAS.
- P. Harshapriya, D. Basandrai and P. Kaur, Appl. Phys. A: Mater. Sci. Process., 2023, 129, 316 CrossRef CAS.
- M. Jafarian, S. F. K. Bozorg, A. A. Amadeh and Y. Atassi, Ceram. Int., 2021, 47, 20595–20609 CrossRef CAS.
- B. Zhao, R. Wang, Y. Li, Y. Ren, X. Li, X. Guo, R. Zhang and C. B. Park, J. Mater. Chem. C, 2020, 8, 7401–7410 RSC.
- K. Cao, X. Yang, R. Zhao and W. Xue, ACS Appl. Mater. Interfaces, 2023, 15, 9685–9696 CrossRef CAS PubMed.
- S. Ning, M. Wang, S. Luo, G. Yang, Y. Feng, F. Su, Y. Ji and C. Liu, J. Alloys Compd., 2023, 958, 170510 CrossRef CAS.
- Y. Qing, L. Ma, X. Hu, F. Luo and W. Zhou, Ceram. Int., 2018, 44, 8706–8709 CrossRef CAS.
- Z. Cheng, Y. Cao, R. Wang, X. Liu, F. Fan and Y. Huang, J. Mater. Chem. A, 2023, 11, 5593–5605 RSC.
- K. K. Sawant, S. Saxena, S. S. Shindalkar, R. P. Ramasamy, A. A. B. Raj and B. Kandasubramanian, J. Electron. Mater., 2023, 1–13 Search PubMed.
- D. Meisak, A. Plyushch, J. Macutkevič, R. Grigalaitis, A. Sokal, K. Lapko, A. Selskis, P. Kuzhir and J. Banys, J. Mater. Res. Technol., 2023, 24, 1939–1948 CrossRef CAS.
- G. K. Sharma, P. G. Harel and N. R. James, Carbon, 2023, 214, 118367 CrossRef CAS.
Footnote |
| † Electronic supplementary information (ESI) available. See DOI: https://doi.org/10.1039/d3ta06292a |
| This journal is © The Royal Society of Chemistry 2024 |