Exploring finite-temperature electronic transport in CoSi alloys with transition metals (Cr, Mn, Fe, and Ni) using the KKR-CPA method†
Received
14th October 2023
, Accepted 24th November 2023
First published on 24th November 2023
Abstract
The finite-temperature electronic transport properties of the CoSi compound and its alloys with 3d transition metals including Fe, Cr, Mn, and Ni are elucidated by using the Korringa–Kohn–Rostoker Green's function method combined with the coherent potential approximation. On the basis of the linear response theory, the electrical resistivity of the CoSi compound observed in the experiments could be quantitatively reproduced by taking into account both local phonon displacements and antisite disorder effects. Our calculations reveal the formation of Co–Si disorders with a very small concentration and their dominant effect on resistivity in a low-temperature range. Moreover, alloying transition metals with CoSi also led to significant changes in the states of conduction electrons, which is interesting as a typical example of a rigid band scheme. Notably, we found that alloying with Ni could reduce the system's resistivity by more than 25%, suggesting its potential for enhancing the power factor of the CoSi compound for thermoelectric applications.
1 Introduction
In recent decades, electrification has grown in popularity worldwide as a solution to reduce emissions from fossil fuels.1 This inevitable trend was being driven by the soaring demand for energy-efficient solutions in a variety of industries, including the automotive, manufacturing, and power generation sectors.2 Among credible solutions, thermoelectric (TE) technology has garnered substantial interest due to its potential to convert waste heat into usable electricity,3–5 offering a sustainable approach for enhancing energy efficiency and minimizing environmental impact.6 Nevertheless, several challenges to this technology persist, primarily stemming from the need for high TE efficiency materials, which can be quantified by using the dimensionless figure of merit (i.e.,  , where S is the Seebeck coefficient, T is the absolute temperature, ρ is the electrical resistivity, and κ = κe + κl is the total thermal conductivity from electronic and phononic parts). Most of the current state-of-the-art TE materials are semiconductors, while metallic materials have received less attention.3 This is due to the fact that metallic materials typically have low S and high κ values, making optimizing TE performance difficult.
Transition metal monosilicides B20-type XSi (X = Co, Fe, Cr, Mn, and Ni) have attracted much recent interest owing to their fascinating electronic properties.7–12 In particular, the similarities in the crystalline and electronic structure of these materials make them ideal for research into the electron number-dependent behavior of transport properties (the rigid band scheme).13 Besides, XSi was also found to have good stability and resistance to oxidation, bolstering their suitability for energy harvesting applications.7 Among them, CoSi emerges as a promising metallic TE candidate with a maximal ZT value of 0.2.14–16 CoSi was found to have a chiral structure but does not exhibit any kind of magnetic order.17 Compared to other metallic systems, CoSi has a large power factor (i.e., PF = S2/ρ = 3.5 W m−1 K−1 at room temperature), which is even comparable to that of Bi2Te3 or PbTe, owing to its considerable S value (e.g., −83 μV K−1) and relatively low ρ value.18–21 It is also found that nanostructuring CoSi via mechanical milling and spark plasma sintering could efficiently reduce thermal conductivity by 35% owing to the enhancement of phonon scattering in systems.22,23 As a result, improving CoSi's performance could be accomplished through optimization of the S or ρ value using band structure engineering. However, there have not been many theoretical studies that shed light on the electronic transport of both pristine CoSi and its alloys with transition metals. In previous studies, for example, transport properties of CoSi were estimated using Boltzmann transport theory within relaxation time approximations such as constant relaxation time (CRTA),24,25 electron-phonon average (EPA),26 or the full electron-phonon interaction (EPW).25 In the same manner, an earlier study27 that employed the EPW method also observed similar transport properties of CoSi. Their calculations are even expanded to alloying CoSi with Fe and Ni but are limited by small concentrations along with rigid band approximation and independent scattering approximation.27 Nevertheless, there are still deviations in the electrical resistivity of CoSi between these calculated values and experimental observations, especially at high temperatures.26 Several drawbacks in Boltzmann's approach might contribute to this issue. Accordingly, instead of explicitly accounting for variations in electron density with temperature, only the band structure information at 0 K and temperature-dependent scattering lifetime are used. Consequently, a flawed treatment of scattering lifetime could result in observed deviations in the resistivity value.28,29 Also, the lack of vertex correction in the Boltzmann approach could also cause appreciable errors in the estimation of transport properties.30,31 Furthermore, examining the impact of impurity scattering on the system's resistivity (e.g., in the presence of defects or dopants) is challenging due to the numerous possible configurations and expensive computational costs of the conventional supercell approach. Therefore, to gain insight into the electronic transport properties of CoSi, a superior approach is needed to handle these issues.
In this work, the temperature-dependent electronic and transport properties of CoSi will be clarified using the Korringa–Kohn–Rostoker Green's function method32,33 combined with the coherent potential approximation34,35 (KKR-CPA). First, the CPA method enables us to readily handle random displacements of local phonons and antisite disorder contribution without using the common supercell method. Thus, significant changes in the electronic structure at certain finite temperatures without and with defects could be acquired. In addition, using the Kubo–Greenwood formula with vertex correction allows us to reproduce the electrical resistivity of CoSi consistently with previous experiments. The formation of very small concentrations of antisite disorders that affect the system's resistivity is also discussed. Lastly, the effect of alloying 3d transition metals on the electronic transport of CoSi was investigated at different concentrations, revealing their potential to enhance the power factor of CoSi for thermoelectric applications.
2 Computational methods
The electronic and transport properties are theoretically investigated using first-principles calculations. First, the crystal structure of all systems is fully optimized using a generalized gradient approximation (GGA) in the form of Perdew–Burke–Ernzerhof36 (PBE) based on the projector augmented wave (PAW) method37,38 as implemented in the Vienna ab initio simulation package (VASP),39,40 in which the energy tolerance is set to 4 × 10⁻⁴ eV Å−1 with a cut-off energy of 520 eV and a Γ-centered k-mesh of 5 × 5 × 5. The calculated lattice constant of CoSi is 4.443 Å, which is in good agreement with the observed experimental data (i.e., 4.447 Å).41 To account for the local phonon displacements caused by finite-temperature excitation, we used the density functional perturbation theory (DFPT) in the phonopy code42 to estimate force constants from a 2 × 2 × 2 supercell with 64 atoms. The probabilities of atomic displacements at a certain temperature were then extracted from the phonon density of states (DOS) using the relation proposed by Ebert et al. as follows:43| |  | (1) |
where mi is the mass of atomic species i, ω is the phonon frequency, E(ω) is the average energy of the harmonic oscillator (i.e.,  ), and gi(ω) is the partial phonon DOS. In Table 1, we show 〈ui2〉 values of Co and Si atoms at different temperatures, which are extracted from their phonon DOSs in the CoSi compound [Fig. 1(c)] for calculations. It should be noted that the atomic displacement of elements such as Fe, Cr, Ni, and Mn in their alloys with CoSi is determined by using their partial phonon DOS in compounds FeSi, CrSi, NiSi, and MnSi, respectively. Using the fitting method, the variation of lattice constants in alloy samples depending on impurity concentrations was taken into account. Additional information can be found in the supplementary part (Fig. S1 and S2†).
Table 1 The calculated atomic displacement 〈ui2〉 values of Co and Si atoms in the CoSi compound at finite temperatures. The unit of 〈ui2〉 is normalized by using the lattice constant
| Temperature (K) |
〈ui2〉 |
| Co |
Si |
| 100 |
0.0063 |
0.0083 |
| 200 |
0.0096 |
0.0112 |
| 300 |
0.0135 |
0.0149 |
| 400 |
0.0175 |
0.0189 |
| 500 |
0.0216 |
0.0230 |
| 600 |
0.0258 |
0.0273 |
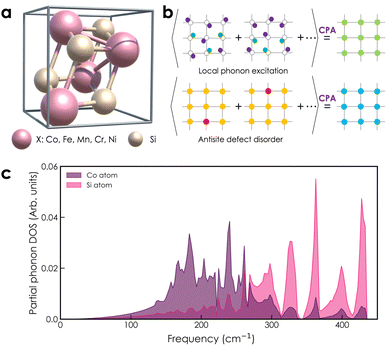 |
| | Fig. 1 (a) Crystal structure of transition metal monosilicides XSi (X = Co, Fe, Mn, Cr, Ni) in cubic form, with space group P213 (#198). (b) Configurational average is treated by the CPA method as a periodic effective medium for random atomic displacements due to thermal excitations and chemical disorder in antisite disordered structures. (c) The partial phonon DOS of the CoSi compound (purple: Co atom and pink: Si atom) is used for the calculation of local phonon excitation. | |
With the atomic displacement distribution obtained as above, the electronic structures and transport properties at finite temperatures are investigated via the KKR-CPA method32–35 using the AkaiKKR code.44 The KKR-CPA method, where multiple scattering effects are replaced by an effective medium potential, is known to be a powerful theoretical framework for the treatment of disordered systems with randomly distributed atomic positions. All information about the scatterings for single-site potentials can be given by atomic t-matrices in KKR Green's function approach.43,45 An atomic t-matrix is a set of coefficients of partial wave expansion at each atomic position. In the case where an atom is displaced, a new centre of partial wave expansion naturally arises.31,46 Therefore, it is necessary to self-consistently determine atomic t-matrix changes corresponding to the atomic displacements. Hereinafter, the local phonon excitation and antisite defects are treated as the configuration average with respect to the local phonon displacements and defect states, respectively [Fig. 1(b)]. Note that for alloy systems, only the phonon and random potential contributions to transport properties are considered. Specifically, a total of six directions of atomic displacement (D) are considered for the local phonon excitation as follows:
| | 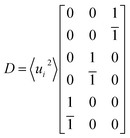 | (2) |
In addition, the atomic sphere approximation is used and the local density approximation (LDA) with Moruzzi–Janak–Williams parametrization47,48 is also employed for the exchange-correlation functional. The first irreducible Brillouin zone is sampled on k-sampling points of 451 and 23001 for self-consistent calculations and transport calculations, respectively. To consider relativistic effects, the scalar relativistic approximation is included in all calculations. The maximum angular momentum up to lmax = 3 is taken into account in the present calculations. To eliminate the unphysical contributions to the transport calculations, an imaginary part iη with η = 10−5 Ry was attached to the energy. Besides, we also estimate the formation energy of antisite disorders by using the definition:
| | | Eform = Etotaldefect − Etotalbulk | (3) |
where
Etotaldefect and
Etotalbulk are the total energy of defect and pure systems, respectively. Finally, the electrical resistivity determined using the Kubo–Greenwood formula, which includes vertex correction using the ladder-like approximation,
30 is calculated as follows:
| |  | (4) |
where
ε is energy,
iη is an infinitesimal imaginary part, and the conductivity part

is defined as
| |  | (5) |
where
N is the number of atoms, Ω is the volume of a unit cell, and
jμ,ν is the current operator. The angle brackets 〈〉
CPA represent a configuration average over random atomic displacement of disordered systems determined by the CPA method.
30,49
3 Results and discussion
3.1 Electronic and transport properties of CoSi
The calculated electronic DOSs of a pure CoSi compound under different temperature conditions are illustrated in Fig. 2(a). Both the upper and lower energy regions of the Fermi level show variations in electron density with increasing temperature. Specifically, we found that the electron density is slightly increased as T increases from 0 K to 600 K at the Fermi level. To get a better look at the electron transport behavior under the influence of temperature, we also calculated the Bloch spectral function along the high symmetry k-path, as shown in Fig. 3(a)–(c). At 0 K, when the contribution from the phonon displacement is zero, the electron states of the pure CoSi system are very thin lines [see Fig. 3(a)], which is in good agreement with the band structure calculations at 0 K shown in the previous theoretical studies.18,25,26 But as the temperature goes up, the phonon oscillations gradually make these electron states more spread out and blurred [Fig. 3(b) and (c)]. This is reasonable given that in such a perfectly ordered crystalline system, electrons could be described by well-defined energy levels associated with specific wave vectors. Consequently, the allowed levels of energy would be sharply defined and well-separated as thin lines in the band structure at 0 K. In addition, conduction electrons in this scenario would not encounter any lattice imperfections or scattering centers that could disrupt their motion, so their lifetime would be infinite. In contrast, any excitations at finite temperatures could result in deviations from this idealized scenario. Specifically, the increased temperature-induced spatial fluctuation of atomic positions causes electron-phonon scatterings, resulting in the electron conduction lifetime being finite and broadening the energy bands as observed in Fig. 3(b) and (c).
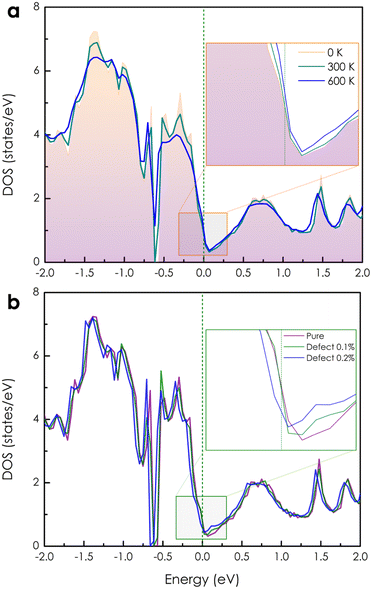 |
| | Fig. 2 (a) The temperature-dependent electronic DOS of a pure CoSi compound. (b) The change in DOS of a CoSi system without and with very small concentrations of Co–Si antisite disorders at 0 K. | |
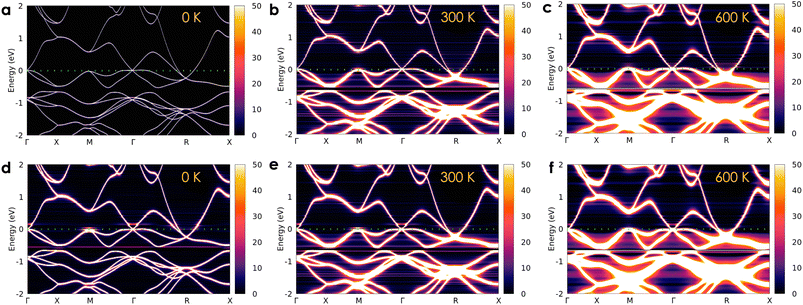 |
| | Fig. 3 The temperature-dependent Bloch spectral function of electrons in the pure CoSi system (a–c) and in the case of a small concentration of 0.1% antisite defects present in the system (d–f). The imaginary part iη (η = 10−5 Ry) is attached to the energy for the calculation. | |
Based on the obtained electronic structure information of pure CoSi, we calculated the electrical resistivity using the Kubo–Greenwood formula, as illustrated in Fig. 4(a). The resistivity estimated from this work (the purple line) confirms that CoSi has a low ρ value, an advantage for possessing a large TE power factor. When compared to the calculation results from other highly accurate theoretical methods using Boltzmann's approach, such as the EPA or EPW method,25–27 our KKR-CPA calculations combined with the Kubo-Greenwood formula yielded a reasonably consistent estimation. However, at around 300–600 K, the EPA method26 (the dashed grey line) provided a saturated tendency of resistivity of only around 1 μΩm, which is underestimated compared to experimental observations. A similar tendency was also observed in the case of the EPW method previously.25,27 Accordingly, several limitations in Boltzmann's approach could be the reason, such as the lack of vertex correction or the efficiency in the treatment of phonon scatterings. Notably, the results from our work with vertex correction and local phonon displacement attached show a better prediction with a large increase in resistivity at high temperatures, which is compatible with the experimental tendency. To examine the vertex correction's contribution in this case, we calculated the system's resistivity difference between switching on and off the correction (see Fig. S4†). We found that its effect on the electrical resistivity of CoSi is weaker at low temperatures (e.g., 0.17 μΩ cm at 100 K) and becomes more significant at higher temperatures (e.g., 2.7 μΩ cm at 600 K). The results indicated that the influence of vertex correction is quite small in this case. Consequently, the reasonable treatment of scattering by local phonon displacements could be the main reason for enhanced prediction at high temperatures. Nevertheless, there are still discrepancies between the theoretical results and experimental data, particularly at temperatures below 300 K. At low temperatures, it is known that the contribution of defects to electronic transport properties could become significant. Moreover, based on experimental data measured in previous studies, we observed that there is a difference in values of electrical resistivity among these studies.16,50–52 The discrepancy in measured values in these studies might come from differences in homogeneity and defect concentration in the samples. Therefore, taking into account the effect of defects could be essential for improving the prediction quantitatively. For example, in the previous studies of Heusler compounds,31,53 the presence of antisite defects was believed to be the main source of finite resistivity at low temperatures. Or in a related experimental work, the formation of antisite defects with a small concentration has also been confirmed in the MnSi compound,54 which has similarity in crystal and electronic structures to CoSi. So, a very small amount of antisite defects of 0.1% and 0.2% was assumed in our calculations as an attempt to reproduce the experimental data of CoSi. In terms of the electronic structure, the presence of a small concentration of antisite disorders causes the electron density to decrease slightly at the Fermi level compared with that of the pure system [Fig. 2(b)]. In addition, its Bloch spectral function indicated that conduction electrons are slightly expanded and smeared at Fermi energy. This effect was found to be stronger at low temperatures and gradually becomes insignificant across high temperatures as compared to that of the pure system [Fig. 3(d)–(f)]. As a result, the resistivity of the defect case increases significantly compared to that of the pure one in a low-temperature range, as depicted in Fig. 4(a) (the dark cyan and blue lines). Specifically, the calculated resistivity of the pure system at 100 K increased from 0.13 μΩm to 0.57 μΩm in the presence of 0.1% antisite disorders and increased to 1.5 μΩm at a concentration of 0.2%. Consequently, the electrical resistivity is quantitatively well reproduced compared with the observed results from different experimental samples. To clarify the effect of antisite disorders on a system's resistivity, we have decomposed the value of ρ under the contribution of various factors, as shown in Fig. 4(b). First, if we completely ignore thermal excitation and only the effect of 0.1% antisite disorders is considered, the calculated residual resistivity of the system is 0.5 μΩm (the dashed dark yellow line). However, when both the defect and the local phonon displacement are considered (the dark cyan line), the effect of antisite disorders is only significant at low temperatures and diminishes at higher temperatures. This is due to the fact that at low temperatures, thermal fluctuations are at their minimum, and then electrons will more easily be trapped or scattered by localized states of defects. At higher temperatures, electrons gain sufficient thermal energy to be released from these localized states, resulting in a smaller effect of antisite disorders on resistivity. It should be noted that only a very small concentration of antisite defects is considered here. In cases where the defect concentration becomes significant, its influence on high-temperature resistivity would become larger, equivalent to that at low temperatures (see Fig. S3†).
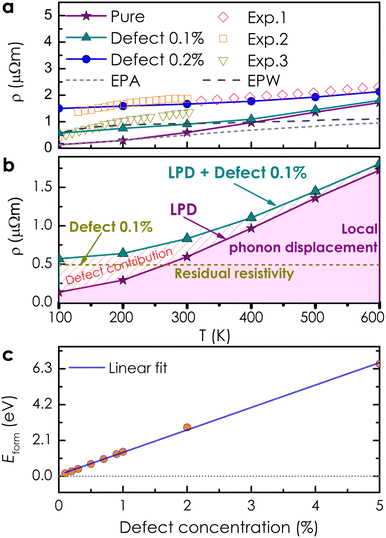 |
| | Fig. 4 (a) The electrical resistivity of CoSi without and with small concentrations of antisite defects is calculated using the Kubo–Greenwood formula. Previous experimental observations16,50–52 (color symbols) and theoretical data from the EPA and EPW methods25–27 (the dashed grey and black lines) are included for comparison. (b) Decomposition of contributions to the electrical resistivity of CoSi, including only 0.1% antisite defects (dark yellow line), only local phonon displacement (LPD, purple line), and both LPD + 0.1% antisite defects (dark cyan line). (c) The formation energy of antisite disorders as a function of defect concentration. | |
Finally, the formation energy of antisite defects as a function of concentrations is calculated to consider their viability in the compound [see Fig. 4(c)]. Accordingly, the formation energy increases linearly with the defect concentration, indicating the difficulty of formation of this type of defect with a large concentration in the system. We also found that with amounts of 0.1–0.3%, their formation energies are very small, meaning that small amounts of antisite defects could be easily formed in the system, which might affect the electrical resistivity of CoSi as we assumed before. Therefore, to accurately reproduce the electronic transport of the CoSi compound compared to that in the experiments, local phonon displacements and Co–Si antisite disorder effects should be considered. After confirming the validity of our method for the CoSi compound, we investigated the effect of alloying transition metals on the electrical resistivity of CoSi.
3.2 Alloys of CoSi with transition metals (Fe, Cr, Mn, and Ni)
To investigate the effects of transition metals on the electronic transport of the CoSi compound, we alloyed CoSi with its adjacent 3d transition metals (i.e., Co1 − xMxSi, where M = Cr, Mn, Ni, and Fe) at different concentrations ranging from very small to very large, including x = 0.01 (1 at%), x = 0.05 (5 at%), x = 0.1 (10 at%), x = 0.3 (30 at%), x = 0.5 (50 at%), x = 0.7 (70 at%), and x = 0.9 (90 at%). For alloying 3d transition metals, spin-polarized calculations are taken into account in these cases. However, our results revealed the absence of magnetic moments induced by dopant atoms in alloy systems. In Fig. 5 and 6, we show the change in the electronic states of alloyed systems by calculating their Bloch spectral functions and DOSs at room temperature.
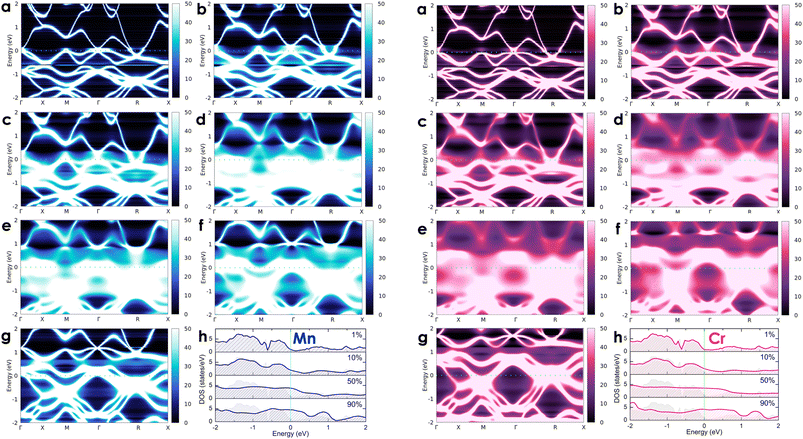 |
| | Fig. 5 The calculated room-temperature Bloch spectral function of electrons in Co1 − xMnxSi (left-hand side: blue color) and Co1 − xCrxSi alloys (right-hand site: magenta color) corresponds to different concentrations of (a) x = 0.01, (b) x = 0.05, (c) x = 0.1, (d) x = 0.3, (e) x = 0.5, (f) x = 0.7, and (g) x = 0.9 and (h) their electronic DOSs. The imaginary part iη (η = 10−5 Ry) is attached to the energy to calculate the Bloch spectral function. | |
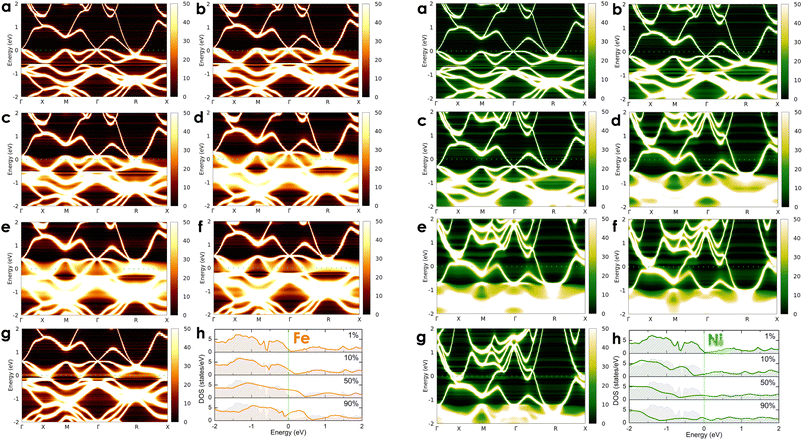 |
| | Fig. 6 The calculated room-temperature Bloch spectral function of electrons in Co1 − xFexSi (left-hand side: orange color) and Co1 − xNixSi alloys (right-hand site: green color) corresponds to different concentrations of (a) x = 0.01, (b) x = 0.05, (c) x = 0.1, (d) x = 0.3, (e) x = 0.5, (f) x = 0.7, and (g) x = 0.9 and (h) their electronic DOSs. The imaginary part iη (η = 10−5 Ry) is attached to the energy to calculate the Bloch spectral function. | |
At a small concentration of 1%, the band structure of alloy systems is not much different from that of the pure system. We found that states of conduction electrons at the Γ-point near the Fermi level of the Cr- and Mn-alloyed systems are more smeared and spread out compared to those of Ni or Fe dopants. Besides, the electron density is also quite similar in the cases of Fe, Cr, and Mn dopants, except in the case of Ni, where it is slightly decreasing. When the alloying concentration in a system exceeds 5%, significant changes in the states of conduction electrons could easily be observed. Specifically, the lines representing the electron states are broadened and faded as the alloy concentration increases, especially at around 30–70%. The presence of transition metals in high concentrations disrupted the crystal order of the system. This changed the properties of the wave vector, making it no longer a good quantum number for describing the system, while the electronic relaxation time also became finite due to the strong scattering of impurities. Therefore, energy bands were getting blurred and spreading with energy uncertainty predicted by the uncertainty relationship between energy and time (i.e., ΔE·Δt ≥ ℏ/2, where ΔE is the uncertainty in energy measurement, Δt is the electron lifetime, and ℏ is the Dirac constant).55 For the Mn dopant, its substitution for Co causes the Fermi level to progressively shift down to the valence band. At the same time, the electron density at the Fermi level is greater than that of a pure system. However, the introduction of Mn into the system induces very strong impurity scatterings in the valence band [see Fig. 5(d)–(f), left-hand side], which can significantly reduce the electron relaxation time and adversely impact the system's electrical resistivity. Similarly, alloying with Cr shows an increase in electron density at the Fermi level. However, it also shifts the Fermi level into the valence band, where strong scatterings occur due to the influence of impurities [see Fig. 5(d)–(f), right-hand side]. For the Fe dopant, although it also lowers the Fermi energy down to the valence region, the scattering effect caused by Fe seems slightly weaker than that of Cr and Mn, especially at around 5–30% [see Fig. 6(b)–(d), left-hand side]. Notably, the Fermi level of the system gets closer to the small band gap position at 90% concentration [Fig. 6(g)–(h), left-hand side], which is possibly useful to enhance the S coefficient of the system. In contrast, alloying with Ni shows a different tendency in electronic states [Fig. 6(a)–(g), right-hand side]. Since Ni has more electrons in d orbitals, the Fermi level of the alloy system thereby shifts above the conduction band. The states of conduction electrons here are more distinct and thinner than those of electrons in the valence band below, which are expanded and very blurred. This means that the relaxation time of electrons in the conduction band will be longer than in the valence band, where scatterings by impurities are more intense. Therefore, its effect on the change in the system's resistivity might be favorable. Interestingly, the observed electronic structure of CoSi alloys with Fe, Cr, Mn, or Ni is quite similar; only the Fermi energy is shifting up or down depending on the impurity concentration and type of metal. This is also a typical example of a rigid band scheme where the electronic structure of alloys remains nearly unchanged, and intentional doping allows for control of the Fermi level and system's conductivity, as stated previously.13 Therefore, it is possible to adjust the transport properties of the alloy by manipulating the Fermi level to desirable positions. In Fig. 7, the position change of the Fermi level corresponding to different concentrations of transition metal alloying has been mapped to the electronic DOS positions of the CoSi system for reference.
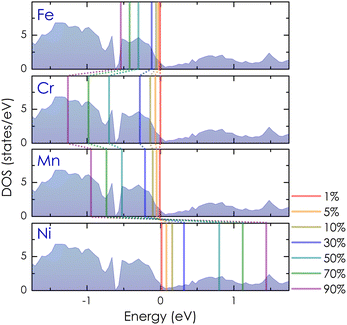 |
| | Fig. 7 The Fermi energy map represents the shifting positions of Fermi levels on the DOS of CoSi as different concentrations of Cr, Mn, Fe, and Ni dopants are introduced into the system. | |
Finally, the electrical resistivity of alloy systems was calculated, as shown in Fig. 8. As analyzed above, alloying with Cr and Mn led to a significant increase in electrical resistivity compared to that of the pure system, reaching a maximum in the range of 1–10% (i.e., 5.14 μΩm for Cr alloying and 4.68 μΩm for Mn alloying at 300 K) and then gradually decreasing as concentrations exceeded 30%. In the case of Fe, the resistivity of the system increases significantly at 5–10% and then approaches saturation at 30–70% (i.e., around 2.5 μΩm). Notably, when the concentration is above 90%, the resistivity value suddenly increases to a high value (i.e., 4.72 μΩm at 300 K) due to the shift of the Fermi level to a narrow energy gap. As compared to the available experimental data on compositional alloys, our theoretical result shows good agreement in estimation.8 However, it is noted that resistivities observed in the experiments are slightly higher than the calculated values. This is understandable because alloying processes with metals, in reality, could raise some defects affecting the system's resistivity, which is omitted in our calculations due to its complexity. Among the candidates, we found that alloying with Ni could reduce the resistivity of the system sharply. In particular, the resistivity of these alloys remains lower than 1 μΩm at concentrations of 1–30%. The highest estimated resistivity at 300 K is only 1.13 μΩm within the concentration range of 50–70%, and its value continues to decrease at higher concentrations. Therefore, with smaller values of electrical resistivity obtained, alloying with Ni could potentially enhance the power factor of CoSi for better thermoelectric performance. Lastly, it should also be mentioned that additional discussion regarding the effects of Seebeck coefficients is necessary for further conclusions on the thermoelectric performance of these systems, which could be considered in future work.
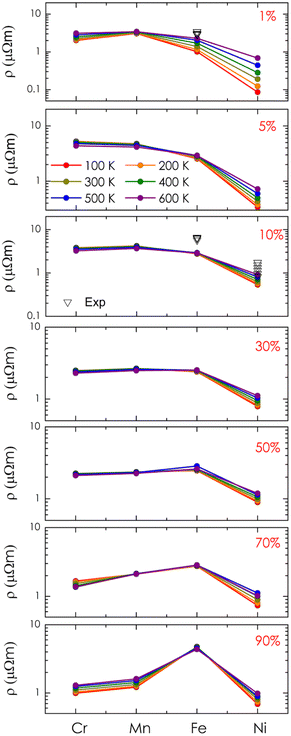 |
| | Fig. 8 The calculated electrical resistivity of alloys Co1−xMxSi as a function of transition metal elements (M = Cr, Mn, Fe, Ni) at different alloying concentrations and temperatures. Experimental data (black symbol) are also included for comparison.8 | |
4 Conclusions
In summary, we performed first-principles calculations using KKR-CPA Green's function method combined with the Kubo–Greenwood formula to unveil the finite temperature-dependent electronic transport of the CoSi compound and its alloys with various transition metals. By incorporating both the local phonon displacement effect and localized states of defects, we found that the electrical resistivity of the CoSi system could be well reproduced quantitatively compared to experimental observations. In addition, our results revealed that there is a formation of Co–Si antisite disordered atoms with very small concentrations, which significantly affects the resistivity of the system in the low-temperature range. Moreover, by alloying the CoSi compound with Fe, Cr, Mn, and Ni at various concentrations from very small to very large, we have shown the effects of transition metals on the states of conduction electrons in the systems, thereby reasonably predicting the change in resistivity of these alloy systems. Accordingly, alloying Cr, Mn, or Fe largely increased impurity scattering in the system, leading to an increase in the resistivity of alloys. Meanwhile, by relocating the Fermi level to the conduction band where scattering is weaker, alloying with Ni can reduce the electrical resistivity of alloys by more than 25% in comparison to that of the pure system, indicating its potential for enhancing the power factor of CoSi.
Conflicts of interest
There are no conflicts to declare.
Acknowledgements
This research was supported by the Japan Science and Technology Corporation Centers of Research Excellence in Science and Technology (JST-CREST) (Grant No. JPMJCR1777, No. JPMJCR18I2, and No. JPMJCR17J5), the Ministry of Education, Culture, Sports, Science and Technology (MEXT) KAKENHI program (Grants No. 22K14285 and No. 23H03805), the “Program for Promoting Researches on the Supercomputer Fugaku” (Grant No. JPMXP1020230325), and the “Data Creation and Utilization-Type Material Research and Development Project (Digital Transformation Initiative Center for Magnetic Materials)” (Grant No. JPMXP1122715503). The calculations were performed using the supercomputer systems from the Institute for Solid State Physics, the University of Tokyo.
Notes and references
- F. Chen, N. Taylor and N. Kringos, Appl. Energy, 2015, 150, 109–119 CrossRef.
- D. Gielen, F. Boshell, D. Saygin, M. D. Bazilian, N. Wagner and R. Gorini, Energy Strategy Rev., 2019, 24, 38–50 CrossRef.
-
D. Rowe, CRC Handbook of Thermoelectrics, CRC Press, New York, 1995 Search PubMed.
- H. N. Nam, Q. M. Phung, K. Suzuki, A. Masago, H. Shinya, T. Fukushima and K. Sato, ACS Appl. Mater. Interfaces, 2023, 15, 43871–43879 CrossRef CAS PubMed.
- H. N. Nam, R. Yamada, H. Okumura, T. Q. Nguyen, K. Suzuki, H. Shinya, A. Masago, T. Fukushima and K. Sato, Phys. Chem. Chem. Phys., 2021, 23, 9773–9784 RSC.
- X. Zhang and L.-D. Zhao, J Mater, 2015, 1, 92–105 Search PubMed.
- A. T. Burkov, Phys. Status Solidi A, 2018, 215, 1800105 CrossRef.
- A. Antonov, Y. Ivanov, P. Konstantinov, V. Kuznetsova, S. Novikov, A. Ovchinnikov, D. Pshenay-Severin and A. Burkov, J. Appl. Phys., 2019, 126, 245103 CrossRef.
- Z. Li, Y. Yuan, R. Hübner, L. Rebohle, Y. Zhou, M. Helm, K. Nielsch, S. Prucnal and S. Zhou, ACS Appl. Mater. Interfaces, 2023, 15, 30517–30523 CrossRef CAS PubMed.
- A. Molinari, F. Balduini, L. Rocchino, R. Wawrzyńczak, M. Sousa, H. Bui, C. Lavoie, V. Stanic, J. Jordan-Sweet and M. Hopstaken,
et al.
, ACS Appl. Electron. Mater., 2023, 5, 2624–2637 CrossRef CAS PubMed.
- Q.-Q. Yuan, L. Zhou, Z.-C. Rao, S. Tian, W.-M. Zhao, C.-L. Xue, Y. Liu, T. Zhang, C.-Y. Tang and Z.-Q. Shi,
et al.
, Sci. Adv., 2019, 5, eaaw9485 CrossRef CAS PubMed.
- D. A. Pshenay-Severin and A. T. Burkov, Materials, 2019, 12, 2710 CrossRef CAS PubMed.
- A. Sakai, F. Ishii, Y. Onose, Y. Tomioka, S. Yotsuhashi, H. Adachi, N. Nagaosa and Y. Tokura, J. Phys. Soc. Japan, 2007, 76, 093601 CrossRef.
- M. Longhin, M. Rizza, R. Viennois and P. Papet, Intermetallics, 2017, 88, 46–54 CrossRef CAS.
- S. Banik and P. P. Kumar, Solid State Commun., 2020, 307, 113807 CrossRef CAS.
- H. Sun, X. Lu and D. T. Morelli, J. Electron. Mater., 2013, 42, 1352–1357 CrossRef CAS.
- B. Balasubramanian, P. Manchanda, R. Pahari, Z. Chen, W. Zhang, S. R. Valloppilly, X. Li, A. Sarella, L. Yue, A. Ullah, P. Dev, D. A. Muller, R. Skomski, G. C. Hadjipanayis and D. J. Sellmyer, Phys. Rev. Lett., 2020, 124, 057201 CrossRef CAS PubMed.
- Z. J. Pan, L. T. Zhang and J. S. Wu, J. Appl. Phys., 2007, 101, 033715 CrossRef.
- L. Di, R.-r. Sun and X.-y. Qin, Prog. Nat. Sci.: Mater. Int., 2011, 21, 336–340 CrossRef.
- J. R. Sootsman, H. Kong, C. Uher, J. J. D'Angelo, C.-I. Wu, T. P. Hogan, T. Caillat and M. G. Kanatzidis, Angew. Chem., Int. Ed., 2008, 120, 8746–8750 CrossRef.
- J. Yu, J. Kuang, J. Long, X. Ke, X. Duan and Z. Liu, J. Mater. Sci.: Mater. Electron., 2020, 31, 2139–2144 CrossRef CAS.
- M. Longhin, R. Viennois, D. Ravot, J.-J. Robin, B. Villeroy, J.-B. Vaney, C. Candolfi, B. Lenoir and P. Papet, J. Electron. Mater., 2015, 44, 1963–1966 CrossRef CAS.
- M. Longhin, R. Viennois, D. Ravot, J.-J. Robin and P. Papet, Solid State Sci., 2014, 38, 129–137 CrossRef CAS.
- P. Dutta and S. K. Pandey, Comput. Condens. Matter, 2022, 31, e00686 CrossRef.
- Y. Xia, J. Park, F. Zhou and V. Ozoliņš, Phys. Rev. Appl., 2019, 11, 024017 CrossRef CAS.
- H. N. Nam, K. Suzuki, A. Masago, H. Shinya, T. Fukushima and K. Sato, Jpn. J. Appl. Phys., 2023, 62, 020904 CrossRef.
- D. Pshenay-Severin, Y. Ivanov and A. Burkov, J. Condens. Matter Phys., 2018, 30, 475501 CrossRef CAS PubMed.
- H. N. Nam, K. Suzuki, A. Masago, T. Q. Nguyen, H. Shinya, T. Fukushima and K. Sato, Appl. Phys. Lett., 2022, 120, 143903 CrossRef CAS.
- H. N. Nam, K. Suzuki, T. Q. Nguyen, A. Masago, H. Shinya, T. Fukushima and K. Sato, Phys. Rev. B, 2022, 105, 075205 CrossRef CAS.
- W. H. Butler, Phys. Rev. B, 1985, 31, 3260 CrossRef CAS PubMed.
- H. Shinya, S. Kou, T. Fukushima, A. Masago, K. Sato, H. Katayama-Yoshida and H. Akai, Appl. Phys. Lett., 2020, 117, 042402 CrossRef CAS.
- J. Korringa, Physica, 1947, 13, 392–400 CrossRef.
- W. Kohn and N. Rostoker, Phys. Rev., 1954, 94, 1111 CrossRef CAS.
- P. Soven, Phys. Rev. B, 1970, 2, 4715 CrossRef.
- H. Shiba, Prog. Theor. Phys., 1971, 46, 77–94 CrossRef CAS.
- J. P. Perdew, K. Burke and M. Ernzerhof, Phys. Rev. Lett., 1996, 77, 3865 CrossRef CAS PubMed.
- P. E. Blöchl, Phys. Rev. B, 1994, 50, 17953 CrossRef PubMed.
- G. Kresse and D. Joubert, Phys. Rev. B, 1999, 59, 1758 CrossRef CAS.
- G. Kresse and J. Hafner, Phys. Rev. B, 1993, 47, 558 CrossRef CAS PubMed.
- G. Kresse and J. Furthmüller, Comput. Mater. Sci., 1996, 6, 15–50 CrossRef CAS.
- D. Van der Marel, A. Damascelli, K. Schulte and A. Menovsky, Phys. B, 1998, 244, 138–147 CrossRef CAS.
- A. Togo and I. Tanaka, Scr. Mater., 2015, 108, 1–5 CrossRef CAS.
- H. Ebert, D. Koedderitzsch and J. Minar, Rep. Prog. Phys., 2011, 74, 096501 CrossRef.
- H. Akai, J. Phys.: Condens.Matter, 1989, 1, 8045 CrossRef.
- H. Ebert, S. Mankovsky, K. Chadova, S. Polesya, J. Minar and D. Koedderitzsch, Phys. Rev. B, 2015, 91, 165132 CrossRef.
- S. Kou and H. Akai, Solid State Commun., 2018, 276, 1–4 CrossRef CAS.
- T. Fukushima, H. Shinya, A. Masago, K. Sato and H. Katayama-Yoshida, Appl. Phys. Express, 2019, 12, 063006 CrossRef CAS.
-
J. Janak, A. Williams and V. Moruzzi, Calculated Electronic Properties of Metals, 1978 Search PubMed.
- N. H. Long, M. Ogura and H. Akai, Phys. Rev. B, 2012, 85, 224437 CrossRef.
- W. Ren, C. Li, L. Zhang, K. Ito and J. Wu, J. Alloys Compd., 2005, 392, 50–54 CrossRef CAS.
-
A. Sakai, S. Yotsuhashi, H. Adachi, F. Ishii, Y. Onose, Y. Tomioka, N. Nagaosa and Y. Tokura, 2007 26th International Conference on Thermoelectrics, 2007, pp. 256–259 Search PubMed.
- E. Skoug, C. Zhou, Y. Pei and D. T. Morelli, Appl. Phys. Lett., 2009, 94, 022115 CrossRef.
- S. Picozzi, A. Continenza and A. Freeman, Phys. Rev. B, 2004, 69, 094423 CrossRef.
- M. Reiner, A. Bauer, M. Leitner, T. Gigl, W. Anwand, M. Butterling, A. Wagner, P. Kudejova, C. Pfleiderer and C. Hugenschmidt, Sci. Rep., 2016, 6, 29109 CrossRef PubMed.
- H. Gomi, K. Hirose, H. Akai and Y. Fei, Earth Planet. Sci. Lett., 2016, 451, 51–61 CrossRef CAS.
|
| This journal is © The Royal Society of Chemistry 2024 |
Click here to see how this site uses Cookies. View our privacy policy here.  *a,
Quan Manh
Phung
 bc,
Katsuhiro
Suzuki
d,
Hikari
Shinya
efghi,
Akira
Masago
ij,
Tetsuya
Fukushima
ik and
Kazunori
Sato
*ilm
 , where S is the Seebeck coefficient, T is the absolute temperature, ρ is the electrical resistivity, and κ = κe + κl is the total thermal conductivity from electronic and phononic parts). Most of the current state-of-the-art TE materials are semiconductors, while metallic materials have received less attention.3 This is due to the fact that metallic materials typically have low S and high κ values, making optimizing TE performance difficult.

 ), and gi(ω) is the partial phonon DOS. In Table 1, we show 〈ui2〉 values of Co and Si atoms at different temperatures, which are extracted from their phonon DOSs in the CoSi compound [Fig. 1(c)] for calculations. It should be noted that the atomic displacement of elements such as Fe, Cr, Ni, and Mn in their alloys with CoSi is determined by using their partial phonon DOS in compounds FeSi, CrSi, NiSi, and MnSi, respectively. Using the fitting method, the variation of lattice constants in alloy samples depending on impurity concentrations was taken into account. Additional information can be found in the supplementary part (Fig. S1 and S2†).


 is defined as


