
 Open Access Article
 This Open Access Article is licensed under a
 Creative Commons Attribution 3.0 Unported Licence
Visualization and evaluation of lithium diffusion at grain boundaries in Li0.29La0.57TiO3 solid electrolytes using secondary ion mass spectrometry†
Gen
Hasegawa
 ,
Naoaki
Kuwata
*,
Tsuyoshi
Ohnishi
and
Kazunori
Takada
,
Naoaki
Kuwata
*,
Tsuyoshi
Ohnishi
and
Kazunori
Takada
Research Center for Energy and Environmental Materials (GREEN), National Institute for Materials Science (NIMS), 1-1 Namiki, Tsukuba, Ibaraki 305-0044, Japan. E-mail: KUAWATA.Naoaki@nims.go.jp
First published on 18th December 2023
Abstract
Understanding Li diffusion at interfaces in solid-state Li batteries is essential to improving their performance (e.g., rate capabilities and energy densities). However, the visualization of Li diffusion at grain boundaries has been impossible due to the lack of experimental techniques. In this study, we visualize Li-ion diffusion at grain boundaries via secondary ion mass spectrometry at low temperatures (≈−110 °C) using an isotope exchange technique for perovskite-type Li0.29La0.57TiO3 as a model solid electrolyte. The grain boundary diffusion coefficient obtained in this study is 1.4 × 10⁻¹³ cm2 s−1 at 25 °C, which is much smaller than the bulk diffusion coefficient of 2.6 × 10⁻⁸ cm2 s−1. The long-range effective diffusion coefficients can be explained well by a 1D model based on a series of bulk and grain boundaries. The Haven ratio of grain boundary diffusion suggests that correlation between the Li+ ions is crucial for grain boundary diffusion.
Introduction
Solid-state Li batteries are expected to serve as next-generation energy storage systems due to their safety, reliability, and high energy densities.1 However, a significant challenge lies in the ion dynamics at the grain boundaries and the interfaces between the active materials and electrolytes.2–4 High resistance at the cathode/electrolyte interface leads to poor power density of solid-state batteries with sulfide-based solid electrolytes, and it has been successfully lowered by interposition of thin films at the interface.5 Now, sulfide-based solid-state batteries show practical performance, and they are under development aiming at application to electric vehicles.6 One of the disadvantages of sulfide-based solid-state batteries is the instability of the solid electrolytes. Sulfide electrolytes are easily decomposed in a humid atmosphere and release harmful hydrogen sulfide upon the decomposition.7 This concern has brought about a lot of efforts to replace the sulfide electrolytes with oxides. However, oxide-based solid electrolyte batteries also show high interfacial resistance at grain boundaries.2,8 Therefore, although oxide-based solid electrolytes have achieved ionic conductivities of the order of 10−3 S cm−1, the internal resistance of oxide-based solid-state batteries is still high, resulting in poor battery performance. In order to achieve practical battery performance, it is necessary to elucidate the origin of grain boundary resistance and find a way to reduce it, for which techniques to evaluate the interfacial ion dynamics are essential.The analysis of ion dynamics in solid-state Li battery materials has focused mainly on the average ionic conductivity obtained using impedance spectroscopy (IS), the bulk diffusion coefficient obtained using pulsed-field gradient nuclear magnetic resonance (PFG-NMR) spectroscopy, and relaxation time measurements using NMR spectroscopy (Fig. 1). The interfaces of solid-state Li batteries are observed using scanning transmission electron and scanning electron microscopy (SEM).The chemical diffusion of Li+ ions at the grain boundaries of LiNi0.8Co0.15Al0.05O2 cathode materials has been analyzed using electron energy-loss spectroscopy.9 Additionally, Kimura et al. used computed tomography combined with X-ray absorption near-edge structure spectroscopy to visualize the distribution of the chemical diffusion in LiCoO2 particles.10 However, these methods observe chemical diffusion with Li concentration change and cannot measure ion dynamics in solid electrolytes or at the interface between the electrolyte and active material without Li concentration change. Electrochemical strain microscopy is a technique for visualizing the bulk and grain boundary conductivities of solid electrolytes, although several assumptions are required.11
 | ||
| Fig. 1 Multiscale ion dynamics in solid-state batteries and their measurement techniques. The average ionic conductivity can be measured by IS. PFG-NMR spectroscopy measures ion diffusion on the micrometer scale, and secondary ion mass spectrometry (SIMS) can determine the ion diffusion coefficients over a wide spatial range from millimeters to tens of nanometers. | ||
Tracer diffusion analysis based on secondary ion mass spectrometry (SIMS) is an effective tool for quantitatively analyzing ion diffusion in solid electrolytes and active materials.12–23 Additionally, SIMS enables a wide range of ionic diffusion measurements from the nanometer to the millimeter scale, but it is limited in analyzing fast ionic conductors because the primary ion beam disrupts the ion distributions in solid electrolytes.24 Téllez et al. suggested that the Li distribution is maintained via analysis at low temperatures, even in fast ionic conductors, such as perovskite-type solid electrolytes.24 SIMS at low temperatures is known as cryo-SIMS, because it suppresses sample damage.25,26
In this study, perovskite-type solid electrolytes are analyzed using SIMS. We have established high-resolution SIMS techniques for imaging the isotope distributions in polycrystalline solid electrolytes and succeeded in quantitatively evaluating the tracer diffusion coefficients of bulk and grain boundaries. Furthermore, we quantify the grain boundary diffusion coefficient, which indicated that the grain boundaries are the rate-limiting factors in the total conductivity. We use Li0.29La0.57TiO3 (LLTO), which is a fast Li-ion conductor with an ionic conductivity of 10−3 S cm−1 at 27 °C,27–30 as the model material.
Experimental
Sample preparation
LLTO polycrystals sintered at 1450 °C were purchased from Toho Titanium (Yokohama, Japan). The samples were cut into 5 × 10 × 0.5 mm3 pieces using a pen-type diamond glass cutter and ground using 800, 1200, and 2500 grit sandpaper, followed by 2 and 0.5 μm diamond lapping films. The specimens were polished using Baikalox 0.1CR agglomerate-free alumina and colloidal silica in deionized water. The polished sample surfaces were etched at 1100 °C for 1 h in air to visualize the grain boundaries. Surface observations were performed using laser microscopy (VK-9710, Keyence, Osaka, Japan). A 6LiNO3 solution (5 mol L−1) was used in the isotope exchange studies. 6LiNO3 was prepared by mixing 6Li2CO3 (95% 6Li, 5% 7Li, Cambridge Isotope Laboratories, Tewksbury, MA, USA) and HNO3 (65 wt%, FUJIFILM Wako Pure Chemical, Osaka, Japan) in a 1![[thin space (1/6-em)]](https://www.rsc.org/images/entities/char_2009.gif) :2 molar ratio. Fig. 2 shows the process of 6Li exchange and SIMS measurement. The edge of the LLTO was immersed in the aqueous 6LiNO3 solution for 6Li isotope exchange for 59–110 h, and the sample was then cooled to −110 °C in a SIMS system and the surface 6Li isotope ratio was observed via SIMS. After SIMS, diffusion was further enhanced by annealing at 22–400 °C. The sample was again cooled to −110 °C and analyzed using SIMS. This procedure enabled the measurement of the temperature dependence of the diffusion coefficient.
:2 molar ratio. Fig. 2 shows the process of 6Li exchange and SIMS measurement. The edge of the LLTO was immersed in the aqueous 6LiNO3 solution for 6Li isotope exchange for 59–110 h, and the sample was then cooled to −110 °C in a SIMS system and the surface 6Li isotope ratio was observed via SIMS. After SIMS, diffusion was further enhanced by annealing at 22–400 °C. The sample was again cooled to −110 °C and analyzed using SIMS. This procedure enabled the measurement of the temperature dependence of the diffusion coefficient.
 | ||
| Fig. 2 Schematic diagram of the 6Li isotope exchange study using LLTO. The edge of the LLTO is immersed in the aqueous 6LiNO3 solution for exchange. The sample is immediately cooled to −110 °C and SIMS is performed to observe the 6Li isotope ratio. The sample is then annealed at 22–400 °C for further diffusion. The sample is again cooled to −110 °C, and the 6Li isotope ratio is measured. Repeating this procedure enables the determination of the temperature dependence of the diffusion coefficient. | ||
To prevent the potential effects of thermal etching on grain boundaries, the sample preparations and measurements were proceeded in the following sequence: (i) polishing, (ii) isotope exchange, (iii) SIMS, (iv) further diffusion (22–400 °C), (v) SIMS, (vi) thermal etching (1100 °C), and (vii) optical microscopy.
SIMS measurement
Time-of-flight SIMS (TOF.SIMS 5, IONTOF, Münster, Germany) was used to measure the 6Li isotope distribution. During SIMS, the samples were cooled to −110 °C with liquid N2 to quench the 6Li diffusion. The primary ion source was a single charge of Bi+ with an acceleration voltage of 30 kV. An electron flood gun was used for charge compensation. The surface impurities were removed using an Ar gas cluster ion beam with a raster size of 700 × 700 μm2 and an acceleration voltage of 10 kV. The raster size of the primary ion beam used in mapping measurements was 500 × 200 μm2. The pixel resolution in SIMS imaging was 512 × 206, and the spatial resolution was 1 × 1 μm2. The primary ion current was 0.5 pA and the signal was integrated for 5 h to obtain one image. Line measurements were performed using a Cs sputter gun (acceleration voltage of 2 kV) with a depth analysis of approximately 500 nm to confirm uniformity in the depth direction. The respective raster sizes of the sputter and primary ion guns were set to 100 × 100 and 50 × 50 μm2.Results and discussion
Visualization of the isotope distributions in solid electrolytes
Fig. 3a illustrates the results of 6Li isotope imaging using cryo-SIMS. LLTO was prepared via isotope exchange at 22 °C for 59 h and introduced into the SIMS system immediately after 6Li exchange. During cryo-SIMS, the temperature was maintained at −110 °C to quench the Li diffusion. The relative 6Li fraction C changes from the bottom to the top of the LLTO owing to the diffusion of the 6Li isotope. C (=6Li/(6Li + 7Li)) is obtained based on SIMS as follows: | (1) |
 | ||
| Fig. 3 (a) Imaging of the relative 6Li fraction of LLTO immediately after 6Li isotope exchange for 59 h and (b) after 16 d of storage in an Ar atmosphere at 22 °C. (c) Laser microscope image of LLTO in the same position as that used in SIMS. Thermal etching for grain boundary observation was performed after SIMS imaging. (d) 6Li isotopic profiles of the black and red lines shown in the SIMS images. The black and red open circles respectively represent the profiles of the sample after 59 h and 16 d of isotope exchange. (e) Gradient of the 6Li fraction ∂C/∂y and concentration difference ΔCgb at the grain boundary. | ||
Fig. 3d compares the profiles of the C values along the black and red lines shown in the SIMS images, which indicates that C changes abruptly at the grain boundary. The continuity of the diffusion flux across the interface between the bulk and grain boundaries is expressed as
 | (2) |
 and
and  are the respective bulk and grain boundary diffusion coefficients, ∂C/∂y|bulk is the 6Li concentration gradient in the bulk nearby the boundary, and ∂C/∂y|gb is the 6Li concentration gradient at the grain boundary. If the grain boundary thickness δ is sufficiently thin, eqn (2) can be written as
 | (3) |
 is much lower than
  ΔCgb/δ must be larger than ∂C/∂y|bulk to satisfy eqn (3). Therefore, when the diffusion is rate-limiting at the grain boundaries, C varies stepwise at the grain boundaries. Based on Fig. 3e, the derivative coefficient ∂C/∂y|bulk is determined to be 1.1 cm−1 using a quadratic function, and ΔCgb is 0.02. We assume that
  is consistent with the diffusion coefficient DNMR,bulk determined via PFG-NMR spectroscopy,33 with DNMR,bulk representing the average diffusion coefficient of randomly oriented LLTO crystals with 2D diffusion pathways. LLTO is known to have a 90° domain boundary microstructure,34,35 which is a 90° rotation of the alignment of La-rich and La-poor layers in the perovskite structure. This domain boundary may affect the diffusion behavior because LLTO has a two-dimensional diffusion pathway. The LLTO sample used in this study also contains 90° domains with a size of several hundreds of nanometers.33 Despite the presence of such 90° domains, the SIMS image shown in Fig. 3a reveals uniform isotope concentrations within the grains and therefore uniform diffusion coefficients. This the bulk diffusion coefficient will be the value averaged through multiple domain boundaries. If a DNMR,bulk of 2.6 × 10⁻⁸ cm2 s−1 at 22 °C33 is used, then
 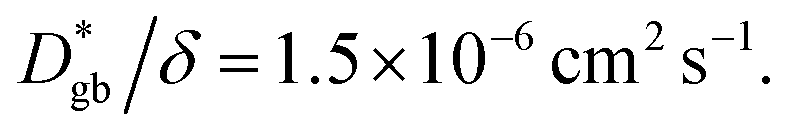 Assuming that the typical thickness δ = 0.5 nm,36,37 then
 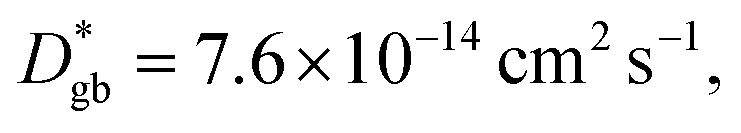 and the calculated
  is five orders of magnitude lower than DNMR,bulk. Similarly, the SIMS profile after 16 d, as indicated by the red line shown in Fig. 3d, is analyzed, and ∂C/∂y|bulk and ΔCgb are 0.65 cm−1 and 0.009, respectively.
  which is consistent with the
  determined immediately after 6Li exchange. Similar line analyses are performed at other grain boundaries. The results are shown in the ESI (Fig. S3 and Table S2†). The
  values for each grain boundary are in the range of 2.6 × 10⁻¹⁴ to 1.5 × 10⁻¹³ cm2 s−1. The average value is 6.8 × 10⁻¹⁴ cm2 s−1, which agrees with the
  value obtained from Fig. 3e. The above analysis reveals that
  values are low at most grain boundaries in LLTO.
Measurements of the long-range (effective) diffusion coefficients
The long-range diffusion coefficients are then measured using SIMS line analysis. Long-range diffusion in polycrystals comprising bulks and grain boundaries exhibits a single effective diffusion coefficient on the macroscopic scale.38–40Fig. 4a shows the time evolution of the C of LLTO, as measured via SIMS line analysis. The black circles shown in Fig. 4a represent the 6Li profile after 110 h of isotope exchange in contact with a 6LiNO3 solution. C is constant in the region immersed in the solution (−1 to 0 mm, as shown in Fig. 4a), whereas above the liquid level (0–6 mm, as shown in Fig. 4a), a 6Li concentration distribution is observed due to diffusion. When the origin of position x is the liquid surface, the 6Li concentration C(x,t) at x = 0 is regarded as constant, regardless of time t. The solution of the 1D diffusion equation is then expressed as41,42
 | (4) |
 is the effective tracer diffusion coefficient. By fitting eqn (4) to the experimental data, as indicated by the solid black line shown in Fig. 4a,
  is determined to be 8.0 × 10⁻⁹ cm2 s−1. The red and blue circles shown in Fig. 4a indicate the 6Li profiles of LLTO after storage in an Ar atmosphere for 2 and 6 weeks at 22 °C, respectively. During storage, the sample did not come into contact with the 6LiNO3 solution, and the total amount of 6Li should be maintained.
  is obtained based on the time evolution of the 6Li profile using a 1D numerical simulation of the diffusion equation. The initial conditions are indicated by the solid black line shown in Fig. 4a. The simulated results after storage for 2 and 6 weeks are shown as the red and blue solid lines, respectively, with a
 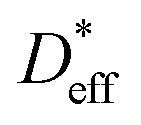 of 3.0 × 10⁻⁹ cm2 s−1 at 22 °C. The
  determined immediately after 6Li exchange is slightly larger than the
  of the stored sample. The
  immediately after ion exchange is likely overestimated due to the rise in the level of the upper surface of the liquid caused by the meniscus and the slight fluctuation in the liquid level. The
  determined using the time evolution of the 6Li distribution is thus more accurate. Fig. 4b shows the effect of annealing at 200 °C for 3.8 h after 6Li exchange. The numerical simulations show that
  at 200 °C and the other
  values at different temperatures from 22 to 400 °C were determined in a similar manner and used in the following discussion.
 | ||
| Fig. 4 (a) Time evolution of the relative 6Li fraction of LLTO at 22 °C. The black circles represent the SIMS profile immediately after 110 h of 6Li isotope exchange, and the red and blue circles represent the respective SIMS profiles after 2 and 6 weeks of storage in an Ar atmosphere. (b) Variation in the relative 6Li fraction of LLTO after annealing at 200 °C. The black circles represent the SIMS profile immediately after 6Li isotope exchange for 63 h, and the red circles represent the profile after annealing at 200 °C. | ||
Relationship between  and
and 
We analyze the relationship between 

 and
and  based on a simple model. The Fisher model,43 which is a well-known model of grain boundary diffusion, is suitable when grain boundary diffusion is faster than bulk diffusion, e.g., in metals. However, in LLTO, Dbulk » Dgb, and the Fisher model is inappropriate. The brick layer39 and Maxwell–Garnett models,38 as shown in Fig. 5a, are generally used in modeling ion diffusion in polycrystalline materials. These models include two types of diffusion pathways: along and across grain boundaries. In LLTO, Dbulk » Dgb, and thus, diffusion along the grain boundaries is ignored. Therefore, the series model of the bulk and grain boundaries provides a good approximation. If the diffusion length is sufficiently large relative to the grain diameter l
 can be expressed as44
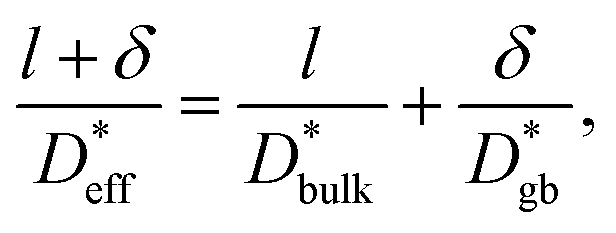 | (5) |
 is given by
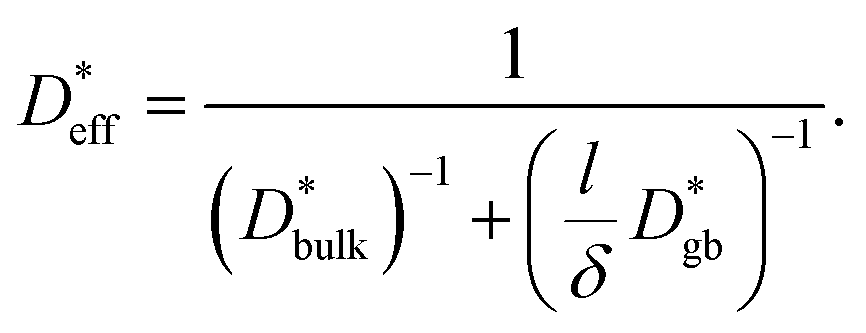 | (6) |
 | ||
Fig. 5 (a) Ion diffusion modeling in polycrystals. The brick layer39 and Maxwell–Garnett models38 are generally used to model ion diffusion in polycrystalline materials. These models include two types of diffusion pathways: along and across the grain boundaries. When Dbulk » Dgb, diffusion along the grain boundaries may be ignored. Therefore, the series model of bulk and grain boundaries provides a good approximation. (b) Temperature dependences of the diffusion coefficients determined using the bulk33 (Dσ,bulk, filled squares) and total conductivities (Dσ,total, open squares), PFG-NMR33 (DNMR,bulk, open circles), and SIMS line analysis ( open triangles). The open triangles). The  calculated using the 1D model is also shown as a filled triangle. (c) Temperature dependences of (l/δ)Dgb, as calculated using the grain boundary conductivity (open squares) and (l/δ)Dgb, as determined via SIMS line and mapping analyses (open and filled triangles, respectively). calculated using the 1D model is also shown as a filled triangle. (c) Temperature dependences of (l/δ)Dgb, as calculated using the grain boundary conductivity (open squares) and (l/δ)Dgb, as determined via SIMS line and mapping analyses (open and filled triangles, respectively). | ||
We use  as determined by SIMS imaging, and we again assume that
  is equal to DNMR,bulk = 2.8 × 10⁻⁸ cm2 s−1.33 The average particle size l = 16 ± 11 μm is determined via electron backscatter diffraction,33 and the results are shown in Supplementary Fig. S1 in the ESI.† When these values are substituted into eqn (6), the effective diffusion coefficient of the 1D model may be calculated as
  This value is consistent with
  for long-range diffusion determined experimentally based on the time evolution of the SIMS line analysis, as compared in the Arrhenius plot in Fig. 5b. Although it is a coarse approximation, the 1D series model explains the long-range Li diffusion in LLTO polycrystals very well. Extrapolating the Arrhenius plot, the
  value at −110 °C is calculated to be 1 × 10⁻¹⁴ cm2 s−1. Assuming the time of the SIMS imaging to be t = 5 h, the diffusion length
  is 0.2 μm, which is smaller than the spatial resolution of SIMS imaging. The Li diffusion during the measurement is negligible. We confirm that −110 °C is a suitable temperature for SIMS imaging measurements.
Fig. 5b also demonstrates the temperature dependence of DNMR,bulk33 and the conductivity diffusion coefficients of the bulk and total (Dσ,bulk and Dσ,total) obtained using IS.33 Here, Dσ,bulk and Dσ,total are calculated based on the Nernst–Einstein equation using the bulk and total ionic conductivities, respectively, and the number density of Li (5.0 × 10⁻²¹ cm−3) in LLTO.45–47 The details of IS are provided in the ESI.† As we reported previously, DNMR,bulk is consistent with Dσ,bulk over the entire temperature range, and both display non-Arrhenius behaviors at >177 °C.33 On the other hand,  represents the long-range diffusion including grain boundaries in LLTO, and thus it is comparable to Dσ,total; however, Fig. 5b shows slightly smaller values of
  than those of Dσ,total. In order to clarify the temperature dependence of
  and Dσ,total, let us separate the bulk and grain boundary contributions according to eqn (6).
Fig. 5c compares the Arrhenius plot of  as calculated using eqn (6), assuming that
 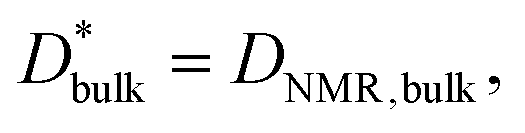 with (l/δ)Dσ,gb calculated from the grain boundary conductivity obtained via IS.48 The activation energies of
  and (l/δ)Dσ,gb show almost the same value of 0.43 eV. Molecular dynamics (MD) simulations have been used to calculate the activation energies of grain boundary diffusion in Li0.16La0.62TiO3.49 The activation energy of the Σ5 grain boundary is predicted to be 0.36 eV, whereas that of
  in the experiment is 0.43 eV. The larger activation energy can be attributed to the random nature of the grain boundaries, with a low experimental consistency (Supplementary Fig. S1†). The relationship between the
  value and the type of grain boundary has been investigated only for small Σ values. Sasano et al. reported that the ionic conductivity does not decrease at special grain boundaries, such as Σ2 grain boundaries in LLTO thin films and Σ5 grain boundaries in polycrystalline LLTO.52,53 MD calculations also suggest a relationship between the type of grain boundary and the diffusion coefficients.49 The polycrystalline LLTO used in this study consists mostly of random grain boundaries (Fig. S1f†). Therefore, most grain boundaries had low
  values. A more detailed analysis will be performed in future studies.
The respective pre-exponential factors of  and (l/δ)Dσ,gb are 0.048 and 0.20 cm2 s−1. The Haven ratio (HR ≡ D*/Dσ) determined using the ratio of the pre-exponential factors is 0.24, which is smaller than the bulk (HR ≈ 1). Hence, we find that the separation of
  and Dσ,total at low temperatures is due to the smaller HR in the grain boundaries. There are two possible reasons for the smaller HR of Dgb compared to that of Dbulk: the number of carriers at the grain boundary or the correlation effect is large.50,51 The grain boundaries of LLTO using transmission electron microscopy and Li depletion at the grain boundary were reported based on electron energy-loss spectra.36,52 Therefore, the possibility of increased carrier concentration should be eliminated, and thus, the correlation between the Li+ ions is significant at the grain boundaries. Understanding the correlation effect will be the key to future breakthroughs in reducing grain boundary resistance.
Conclusions
We visualized and quantified the bulk and grain boundary diffusion of Li+ ions in LLTO solid electrolytes using cryo-SIMS. The visualized image has revealed that the grain boundary impedes the ionic diffusion because of the much lower relative to
  The grain boundary diffusion coefficient,
  has been determined to be 1.4 × 10⁻¹³ cm2 s−1 at 22 °C. The effective diffusion coefficient
  is explainable by
 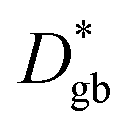 and
and  by using a simple 1D model of bulk and grain boundaries. The activation energy of
  of 0.43 eV was consistent with the grain boundary conductivity. HR was small at the grain boundaries, suggesting enhanced correlation between the Li+ ions at the grain boundaries. The SIMS method developed in this study effectively elucidates the bottleneck of ion transfer at the solid–solid interface, which limits the performance of charge/discharge rates and may contribute to improving the performance of solid-state lithium batteries.
Author contributions
G. H. and N. K. conceived the work. G. H. prepared and analyzed the samples. T. O. and K. T. helped with experimental design and interpretation of data. G. H. drafted the original manuscript. N. K., T. O. and K. T. revised the manuscript drafts.Conflicts of interest
There are no conflicts to declare.Acknowledgements
This study was supported by the Japan Science and Technology Agency ALCA-Specially Promoted Research for Innovative Next Generation Batteries project (grant number JPMJAL1301). This study was also supported by the Japan Society for the Promotion of Science KAKENHI Grant Numbers JP19H05814 (Grant-in-Aid for Scientific Research on Innovative Areas “Interface IONICS”) and JP21H02033 (Grant-in-Aid for Scientific Research (B)). We thank Dr Atsuko Nagataki, Mr Kyosuke Matsushita, and Ms. Makiko Oshida for their assistance with SIMS and SEM at the NIMS Battery Research Platform (Tsukuba, Japan).References
- T. Famprikis, P. Canepa, J. A. Dawson, M. S. Islam and C. Masquelier, Nat. Mater., 2019, 18, 1278–1291 CrossRef CAS.
- K. Takada, J. Power Sources, 2018, 394, 74–85 CrossRef CAS.
- L. Xu, S. Tang, Y. Cheng, K. Wang, J. Liang, C. Liu, Y.-C. Cao, F. Wei and L. Mai, Joule, 2018, 2, 1991–2015 CrossRef.
- M. Pasta, D. Armstrong, Z. L. Brown, J. Bu, M. R. Castell, P. Chen, A. Cocks, S. A. Corr, E. J. Cussen, E. Darnbrough, V. Deshpande, C. Doerrer, M. S. Dyer, H. El-Shinawi, N. Fleck, P. Grant, G. L. Gregory, C. Grovenor, L. J. Hardwick, J. T. S. Irvine, H. J. Lee, G. Li, E. Liberti, I. Mcclelland, C. Monroe, P. D. Nellist, P. R. Shearing, E. Shoko, W. Song, D. S. Jolly, C. I. Thomas, S. J. Turrell, M. Vestli, C. K. Williams, Y. Zhou and P. G. Bruce, J. Phys. Energy, 2020, 2, 32008 CrossRef.
- N. Ohta, K. Takada, L. Zhang, R. Ma, M. Osada and T. Sasaki, Adv. Mater., 2006, 18, 2226–2229 CrossRef.
- A. L. Robinson and J. Janek, MRS Bull., 2014, 39, 1046–1047 CrossRef.
- Y. Morino, H. Sano, T. Takahashi, N. Miyashita, A. Sakuda and A. Hayashi, J. Phys. Chem. C, 2023, 127, 13616–13622 CrossRef.
- J. F. Wu and X. Guo, Phys. Chem. Chem. Phys., 2017, 19, 5880–5887 RSC.
- Y. Nomura, K. Yamamoto, Y. Yamagishi and E. Igaki, ACS Nano, 2021, 15, 19806–19814 CrossRef CAS PubMed.
- Y. Kimura, A. Tomura, M. Fakkao, T. Nakamura, N. Ishiguro, O. Sekizawa, K. Nitta, T. Uruga, T. Okumura, M. Tada, Y. Uchimoto and K. Amezawa, J. Phys. Chem. Lett., 2020, 11, 3629–3636 CrossRef CAS PubMed.
- N. Schön, D. C. Gunduz, S. Yu, H. Tempel, R. Schierholz and F. Hausen, Beilstein J. Nanotechnol., 2018, 9, 1564–1572 CrossRef PubMed.
- B. Steele, J. Kilner, P. Dennis, A. Mchale, M. Van Hemert and A. Buggraaf, Solid State Ionics, 1986, 18–19, 1038–1044 CrossRef CAS.
- M. Sase, K. Yashiro, K. Sato, J. Mizusaki, T. Kawada, N. Sakai, K. Yamaji, T. Horita and H. Yokokawa, Solid State Ionics, 2008, 178, 1843–1852 CrossRef CAS.
- D. Uxa, H. J. Holmes, K. Meyer, L. Dörrer and H. Schmidt, Phys. Chem. Chem. Phys., 2021, 23, 5992–5998 RSC.
- G. Hasegawa, N. Kuwata, Y. Tanaka, T. Miyazaki, N. Ishigaki, K. Takada and J. Kawamura, Phys. Chem. Chem. Phys., 2021, 23, 2438–2448 RSC.
- K. Watanabe, I. Sakaguchi, S. Hishita, N. Ohashi and H. Haneda, Appl. Phys. Express, 2011, 4, 055801 CrossRef.
- J. Rahn, E. Hüger, L. Dörrer, B. Ruprecht, P. Heitjans and H. Schmidt, Z. Phys. Chem., 2012, 226, 439–448 CrossRef CAS.
- N. Kuwata, X. Lu, T. Miyazaki, Y. Iwai, T. Tanabe and J. Kawamura, Solid State Ionics, 2016, 294, 59–66 CrossRef CAS.
- E. Navickas, Y. Chen, Q. Lu, W. Wallisch, T. M. Huber, J. Bernardi, M. Stöger-Pollach, G. Friedbacher, H. Hutter, B. Yildiz and J. Fleig, ACS Nano, 2017, 11, 11475–11487 CrossRef CAS PubMed.
- N. Kuwata, M. Nakane, T. Miyazaki, K. Mitsuishi and J. Kawamura, Solid State Ionics, 2018, 320, 266–271 CrossRef CAS.
- C. Schwab, A. Höweling, A. Windmüller, J. Gonzalez-Julian, S. Möller, J. R. Binder, S. Uhlenbruck, O. Guillon and M. Martin, Phys. Chem. Chem. Phys., 2019, 21, 26066–26076 RSC.
- N. Kuwata, G. Hasegawa, D. Maeda, N. Ishigaki, T. Miyazaki and J. Kawamura, J. Phys. Chem. C, 2020, 124, 22981–22992 CrossRef CAS.
- R. H. Brugge, R. J. Chater, J. A. Kilner and A. Aguadero, J. Phys. Energy, 2021, 3, 034001 CrossRef CAS.
- H. Téllez, A. Aguadero, J. Druce, M. Burriel, S. Fearn, T. Ishihara, D. S. McPhail and J. A. Kilner, J. Anal. At. Spectrom., 2014, 29, 1361–1370 RSC.
- R. Metzner, M. R. Thorpe, U. Breuer, P. Blümler, U. Schurr, H. U. Schneider and W. H. Schroeder, Plant. Cell Environ., 2010, 33, 1393–1407 CrossRef CAS.
- J. Zhang, J. Brown, D. J. Scurr, A. Bullen, K. MacLellan-Gibson, P. Williams, M. R. Alexander, K. R. Hardie, I. S. Gilmore and P. D. Rakowska, Anal. Chem., 2020, 92, 9008–9015 CrossRef CAS.
- Y. Inaguma, C. Liquan, M. Itoh, T. Nakamura, T. Uchida, H. Ikuta and M. Wakihara, Solid State Commun., 1993, 86, 689–693 CrossRef CAS.
- S. Stramare, V. Thangadurai and W. Weppner, Chem. Mater., 2003, 15, 3974–3990 CrossRef CAS.
- M. J. Wang, J. B. Wolfenstine and J. Sakamoto, Adv. Funct. Mater., 2020, 30, 1909140 CrossRef CAS.
- L. Zhang, X. Zhang, G. Tian, Q. Zhang, M. Knapp, H. Ehrenberg, G. Chen, Z. Shen, G. Yang, L. Gu and F. Du, Nat. Commun., 2020, 11, 3490 CrossRef.
- Y. Mishin and C. Herzig, Mater. Sci. Eng. A, 1999, 260, 55–71 CrossRef.
- P. Heitjans and S. Indris, J. Phys.: Condens. Matter, 2003, 15, R1257–R1289 CrossRef.
- G. Hasegawa, N. Kuwata, K. Hashi, Y. Tanaka and K. Takada, Chem. Mater., 2023, 35, 3815–3824 CrossRef.
- Y. Inaguma, J. Ceram. Soc. Jpn, 2006, 114, 1103–1110 CrossRef.
- X. Gao, C. A. J. Fisher, T. Kimura, Y. H. Ikuhara, A. Kuwabara, H. Moriwake, H. Oki, T. Tojigamori, K. Kohama and Y. Ikuhara, J. Mater. Chem. A, 2014, 2, 843–852 RSC.
- C. Ma, K. Chen, C. Liang, C.-W. Nan, R. Ishikawa, K. More and M. Chi, Energy Environ. Sci., 2014, 7, 1638–1642 RSC.
- H. Mehrer, Diffusion in Solids: Fundamentals, Methods, Materials, Diffusion-Controlled Processes, Springer Science & Business Media, 2007, ch. 32 Search PubMed.
- J. R. Kalnin, E. A. Kotomin and J. Maier, J. Phys. Chem. Solids, 2002, 63, 449–456 CrossRef CAS.
- I. V. Belova and G. E. Murch, J. Phys. Chem. Solids, 2003, 64, 873–878 CrossRef CAS.
- H. Mehrer, Diffusion in Solids: Fundamentals, Methods, Materials, Diffusion-Controlled Processes, Springer Science & Business Media, 2007, ch. 34 Search PubMed.
- J. Crank, The Mathematics of Diffusion, Clarendon Press, 1975, ch. 3 Search PubMed.
- H. Mehrer, Diffusion in Solids: Fundamentals, Methods, Materials, Diffusion-Controlled Processes, Springer Science & Business Media, 2007, ch. 3 Search PubMed.
- J. C. Fisher, J. Appl. Phys., 1951, 22, 74–77 CrossRef CAS.
- J. Crank, The Mathematics of Diffusion, Clarendon Press, 1975, ch. 12 Search PubMed.
- T. Zinkevich, B. Schwarz, P. Braun, A. Weber, H. Ehrenberg and S. Indris, Solid State Ionics, 2020, 357, 115486 CrossRef CAS.
- Y. Q. Cheng, Z. H. Bi, A. Huq, M. Feygenson, C. A. Bridges, M. P. Paranthaman and B. G. Sumpter, J. Mater. Chem. A, 2014, 2, 2418–2426 RSC.
- A. Varez, M. T. Fernández-Díaz, J. A. Alonso and J. Sanz, Chem. Mater., 2005, 17, 2404–2412 CrossRef CAS.
- T. van Dijk and A. J. Burggraaf, Phys. Status Solidi, 1981, 63, 229–240 CrossRef CAS.
- A. R. Symington, M. Molinari, J. A. Dawson, J. M. Statham, J. Purton, P. Canepa and S. C. Parker, J. Mater. Chem. A, 2021, 9, 6487–6498 RSC.
- G. E. Murch, Solid State Ionics, 1982, 7, 177–198 CrossRef CAS.
- A. Van der Ven, Z. Deng, S. Banerjee and S. P. Ong, Chem. Rev., 2020, 120, 6977–7019 CrossRef CAS.
- S. Sasano, R. Ishikawa, G. Sánchez-Santolino, H. Ohta, N. Shibata and Y. Ikuhara, Nano Lett., 2021, 21, 6282–6288 CrossRef CAS.
- S. Sasano, R. Ishikawa, K. Kawahara, T. Kimura, Y. H. Ikuhara, N. Shibata and Y. Ikuhara, Appl. Phys. Lett., 2020, 116, 043901 CrossRef CAS.
Footnote |
| † Electronic supplementary information (ESI) available. See DOI: https://doi.org/10.1039/d3ta05012b |
| This journal is © The Royal Society of Chemistry 2024 |