 Open Access Article
Creative Commons Attribution 3.0 Unported Licence
Activated carbon with composite pore structures made from peanut shell and areca nut fibers as sustainable adsorbent material for the efficient removal of active pharmaceuticals from aqueous media†
Sujata
Mandal‡
 *a,
Dayana
Stephen
ab and
Sreeram Kalarical
Janardhanan
 a
a
aCLRI Center for Analysis, Testing, Evaluation and Reporting Services (CATERS), CSIR – Central Leather Research Institute, Chennai-600020, India. E-mail: sujata@clri.res.in; sujatamandal@rediffmail.com; Tel: +91 44 24437299
bDepartment of Chemistry, St. Joseph's College, Trichy-620002, India
First published on 11th September 2024
Abstract
The massive growth in the human population, along with an improved healthcare system, resulted in the discharge of a large variety of active pharmaceuticals, including antibiotics, into the water stream leading to genotoxic, mutagenic, and ecotoxicological effects on plants, animals, and human. In this study, cost-effective and environmentally sustainable activated carbon adsorbents with composite pore structures have been prepared from agricultural waste materials, peanut shells and areca nut fibers, through a facile method. Phosphoric acid (H3PO4) of two different concentrations (20% and 40%) was used for preparing the activated carbons. All the activated carbon samples showed reasonably high specific surface area (SSA) ranging between 580–780 m2 g−1. The SSA of the activated carbon obtained from peanut shells was higher than those obtained from the areca nut fibers. The adsorption characteristics of the prepared activated carbons were assessed for the common active pharmaceuticals, paracetamol, amoxicillin, and aspirin, in an aqueous medium. The rate of adsorption of the activated carbon was very high, and about 90% of the paracetamol was adsorbed within 5 min of contact. The adsorption kinetics followed a pseudo-second-order kinetic model. The paracetamol adsorption capacity of the activated carbons obtained from the Langmuir adsorption isotherm (monolayer) model was 67 mg g−1. Regeneration and reuse of the adsorbent for the removal of paracetamol were also studied for up to 5 cycles. The present research work ensures the “3 Rs” principle [reduce (waste), reuse and recycle] of environmental sustainability.
Sustainability spotlightPeanut shells and areca nut fibers are wastes of the crops, peanut and areca nut. Since India is the largest and 2nd largest producer of areca nut and peanut, respectively, we used these agricultural wastes for making activated carbon adsorbents through a facile method and applied for the removal of active pharmaceuticals, paracetamol, amoxicillin, and aspirin from water as an efficient, cost-effective and sustainable water treatment strategy. The high adsorption capacity and the ability to regenerate and reuse the adsorbent make the present research meet the UN sustainable development goals for clean water and sanitation (SDG 6) and affordable clean energy (SDG 7), and it ensures the “3 Rs” principle [reduce (waste), reuse (as adsorbent) and recycle] of environmental sustainability. |
1 Introduction
Extensive use of pharmaceuticals in healthcare has injected a considerable amount of these compounds into the water environment, in unutilized or in metabolized/partially metabolized forms.1,2 In recent years, pharmaceutical residues have been discovered in all water sources at all levels including groundwater, surface water, and wastewater, from all over the world and have been classified as one of the emerging pollutants.1,3 Because of the widespread occurrence of pharmaceuticals in the aquatic environment and sometimes also in the raw water of waterworks, a few cases surfaced where pharmaceuticals were detected in drinking water.2,4,5 Though the detected level of individual pharmaceutical compounds in the drinking water is within the permissible level, the effects of short/long-term intake of drinking water containing a complex mixture of these compounds are not well explored. Moreover, the detection of a very high level of antibiotics in the wastewater treatment plant effluent imposes potential risks to aquatic and human life in the form of ecotoxicological and pharmacological effects and also leads to the development of antibiotic-resistant micro-organisms.1,6 Moreover, the fact that antibiotics are manufactured with the intention to cause biological effects has raised concerns about the impacts of unintentional exposure to pharmaceuticals on the health of human and ecological communities.Pharmaceutical compounds are a structurally diverse class of emerging contaminants. The primary and secondary wastewater treatment plants are usually incapable of removing these pollutants, leading to their migration into surface water, groundwater, and drinking water supplies. The inability of conventional water treatment systems to remove pharmaceutical pollutants from water necessitates advanced and tertiary treatment processes. Advanced tertiary treatment options that are typically considered for the removal of emerging contaminants from water include adsorption, advanced oxidation processes, nanofiltration, reverse osmosis, and biological processes.7–11
However, the shortcomings of most of these methods are high investment/maintenance costs, secondary pollution generation, and complicated procedures. Conversely, the process of adsorption has been found to be superior to other techniques1,12 specifically when the concentration of pollutants is below the micro/nanogram level.13 Moreover, the process of adsorption is also attractive in terms of its simplicity and cost-effectiveness. Adsorbents like carbonaceous materials,14,15 natural/synthetic clays,16 silica-based materials,17 nanomaterials,18,19 and polymeric resins have been investigated for the removal of pharmaceuticals from aqueous solutions.20 Among all, carbon-based materials, being well known for their capacity to adsorb organic molecules, have been explored largely for the removal of pharmaceuticals from water by adsorption.21 Different forms of carbonaceous materials-based adsorbents like activated carbon, granular carbon, carbon nanotubes (SWCNT/MWCNT), and biochar have been investigated for the removal of pharmaceuticals from aqueous medium.14,15,22–28 However, the preparation of activated carbon adsorbents from areca nut fibers and peanut shells, and their application to remove pharmaceuticals from water is the least explored among various agricultural wastes. Since India is the largest and 2nd largest producer of areca nut and peanut (groundnut), respectively, the waste produced from these crops needs reasonable attention in terms of reuse/recycling/disposal for environmental sustainability.29,30
The objective of the present research is to develop a low-cost environment-friendly sustainable adsorbent for the removal of active pharmaceuticals from water/wastewater. The article presents a systematic investigation of the preparation of activated carbon from agricultural waste materials, peanut shells and areca nut fibers, their characterization, application for the removal of common active pharmaceuticals from aqueous solutions, and regeneration potential of the adsorbents for reuse.
2 Materials and methods
2.1. Materials
Peanut shell and Areca nut fiber were collected from Chennai and Salem (local area) districts of Tamil Nadu, India. Phosphoric acid was from Sigma-Aldrich. N-Acetyl-para-aminophenol (APAP), common name paracetamol or acetaminophen, was from Sigma-Aldrich, Amoxycillin trihydrate (IP 500 mg), and Aspirin [Acetysalicylic acid, IP 350 mg], were obtained from Cipla Limited. A closed stainless-steel (grade SS 316) vessel was used for the preparation of activated carbon. Double distilled water was used in the adsorption experiments, and to prepare the standard solutions.2.2. Preparation of activated carbon
Activated carbons were prepared by phosphoric acid activation, which is the most effective chemical for activation of lignocellulosic biomass.31 The raw materials, peanut shell (PS) and areca nut fibre (AF) were washed thoroughly with water to remove unwanted matter and dried in the oven at 100 °C for 12 h. The dried raw materials were crushed in a mixer grinder to reduce the size and were sieved through mesh no. 10 (ASTM). The powdered raw material was taken in a glass beaker, mixed with phosphoric acid in a 1![[thin space (1/6-em)]](https://www.rsc.org/images/entities/char_2009.gif) :
:![[thin space (1/6-em)]](https://www.rsc.org/images/entities/char_2009.gif) 2 ratio (w/v), and kept for 18–20 h with intermittent stirring/mixing followed by drying at 100 °C in an air oven. After drying, the phosphoric acid-treated raw material was filled in a stainless-steel container, the lid closed tightly, and kept in a muffle furnace at 500 °C (heating rate of 5 °C min−1) for 2 h, followed by cooling down to 30 °C temperature. The carbon thus obtained was washed thoroughly with distilled water, till the pH of the washing was between 6 and 7, followed by drying at 100 °C in an air oven. The dried carbon thus obtained was finely powdered. Two different activated carbon samples were prepared from each raw material using two different concentrations (20% and 40%) of phosphoric acid. The activated carbon samples thus obtained from peanut shell and areca nut fibre using 20% phosphoric are named PSPA-20 and AFPA-20, respectively, and those obtained using 40% phosphoric are named PSPA-40, and AFPA-40, respectively.
2 ratio (w/v), and kept for 18–20 h with intermittent stirring/mixing followed by drying at 100 °C in an air oven. After drying, the phosphoric acid-treated raw material was filled in a stainless-steel container, the lid closed tightly, and kept in a muffle furnace at 500 °C (heating rate of 5 °C min−1) for 2 h, followed by cooling down to 30 °C temperature. The carbon thus obtained was washed thoroughly with distilled water, till the pH of the washing was between 6 and 7, followed by drying at 100 °C in an air oven. The dried carbon thus obtained was finely powdered. Two different activated carbon samples were prepared from each raw material using two different concentrations (20% and 40%) of phosphoric acid. The activated carbon samples thus obtained from peanut shell and areca nut fibre using 20% phosphoric are named PSPA-20 and AFPA-20, respectively, and those obtained using 40% phosphoric are named PSPA-40, and AFPA-40, respectively.
2.3. Characterisation techniques
The morphology and elemental composition of the activated carbon samples were studied using a scanning electron microscope (SEM) coupled with EDX from FEI Quanta 200 SEM. Zeta potential and particle size analyses were performed by using Zetasizer NanoZS from Malvern Instruments, UK. The mineralogical phase was determined by taking an X-ray diffractogram (XRD) in a Rigaku Miniflex Desktop X-ray diffractometer using CuKα radiation. Fourier transform infrared spectroscopy (FTIR) spectroscopic analyses were performed by the KBr pellet method and the spectra were recorded in an FTIR spectrometer, model 4700, from JASCO, Japan. The specific surface area (SAA) and porosity of the adsorbents were measured by the Brunauer–Emmett–Teller (BET) technique by nitrogen adsorption–desorption at 77 K using a surface area analyzer (model: Mini II, BEL instruments, Japan). The Raman spectroscopic analyses were performed in a LabRAM FT-RAMAN spectrometer model: HR Evolution, using a laser source of 532 nm wavelength. The solid-state 13C Nuclear Magnetic Resonance (NMR) spectroscopic measurements were performed by cross-polarization magic angle spinning (CPMAS) technique using Bruker 400 MHz NMR spectrometer (Avance-III HD WB) operating at 400.07 MHz for 1H and 100.61 MHz for 13C frequencies. Analysis of pharmaceuticals in the water was performed using UV-visible Spectrophotometer model Cary 100, Agilent Technologies, USA. The pH at a zero-point charge (pHZPC) of the adsorbents was determined using the pH drift technique following the methodology described by Xie et al.322.4. Adsorption experiments
Adsorption experiments were performed in batches. In a typical batch adsorption experiment, 100 ml of the prepared adsorbate (pharmaceutical) solution was taken in a 250 ml stoppered conical flask, a fixed amount of the activated carbon adsorbent was added to the solution and placed in a thermostatic water bath shaker at 28 °C. After a fixed time, the solution was filtered using a Whatman qualitative filter paper (Grade 1) and the residual adsorbate concentration in the solution was measured using a UV-visible spectrophotometer at the characteristic wavelength of maximum absorption (λmax) (Table 1).The adsorption capacity (qe, mg g−1) of the adsorbent was calculated by using the following equation:
 | (1) |
The percentage adsorption was calculated by using the equation given below:
 | (2) |
To optimize the adsorbent dose, adsorption experiments were performed with various adsorbent doses, 0.02, 0.05, 0.08, 0.1, 0.2, 0.5 and 1 g, keeping all other parameters constant (Adsorbate vol. 100 ml and temp. 28 °C).
To optimize the contact time, adsorption experiments were performed by varying the contact time between 5 and 360 min, keeping all other parameters constant.
Adsorption equilibrium experiments were performed by varying the initial APAP concentration between 5 and 500 mg l−1 with the optimized adsorbent dose and contact time.
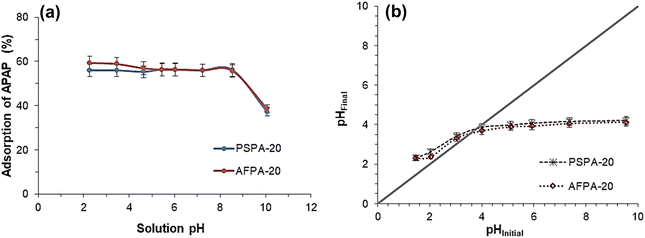
To study the influence of solution pH on the APAP adsorption, the pH of the APAP solution was varied between 2 and 10 with an initial APAP concentration of 50 mg l−1, and with an adsorbent dose of 1 g l−1 and 30 min contact time.
To study the regeneration and reuse of the adsorbents, 100 ml of 50 mg l−1 APAP solution was contacted with 0.4 g of the adsorbent for 30 min followed by filtration, and the solution was analysed for residual APAP concentration. The adsorbent was washed 4–5 times with double distilled water having pH 6.8 ± 0.5 and at 28 °C. The washed adsorbent was kept in an air oven at 50 °C for 16 h and reused for APAP adsorption. The total volume of water used for washing the adsorbent after each adsorption cycle was 100 ml.
3 Results and discussions
3.1. Characterization of the adsorbents
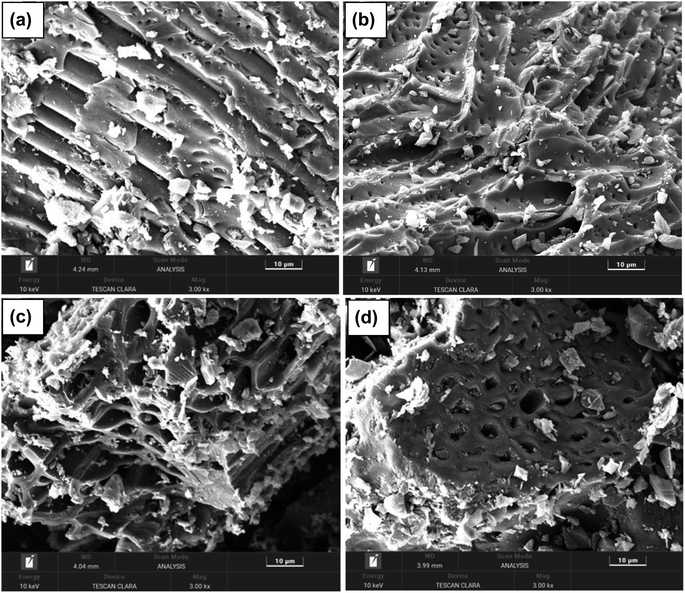
The SEM images of the activated carbons PSPA-20, PSPA-40, AFPA-20 and AFPA-40 are presented in Fig. 1(a–d). The SEM images show the highly porous nature of the activated carbon samples. The particle size in PSPA-40 and AFPA-40 are less than PSPA-20 and AFPA-20, respectively, which indicates that an increase in phosphoric acid concentration, decreased the particle size of the activated carbon samples. The morphology (structural pattern) of peanut shell carbon (PSPA-20 and PSPA-40) is visibly different from that of the areca nut shell fibre carbon (AFPA-20 and AFPA-40).The concentration of phosphorous, silicon and calcium obtained from SEM-EDX analyses of the activated carbon samples is presented in Table 2. The phosphorous is due to the phosphoric acid treatment, while silicon and calcium are originated from the starting materials, peanut shell and areca nut shell fibre.33,34 Moreover, the amount of calcium is more in peanut shells than in areca nut shell fibre, which is also in-line with the literature reports.33,34 Since PSPA-40 and AFPA-40 are obtained from the source that is treated with a higher concentration of phosphoric acid (40%), the concentration of P in PSPA-40 and AFPA-40 is more than that in PSPA-20 and AFPA-20. Similarly, the concentrations of silicon and calcium are higher in PSPA-40 and AFPA-40 than in PSPA-20 and AFPA-20.
| Concentration (%) | PSPA-20 | PSPA-40 | AFPA-20 | AFPA-40 |
|---|---|---|---|---|
| Phosphorous | 1.37 | 3.88 | 0.64 | 4.58 |
| Silicon | 0.44 | 0.79 | 0.43 | 0.88 |
| Calcium | n.d. | 0.28 | n.d. | 0.02 |
The zeta potential values of the activated carbon samples PSPA-20, AFPA-20, PSPA-40, and AFPA-40 are −6.8, −9.5, −0.3, and −0.7 mV, respectively. While the negative zeta potential of PSPA-20 and AFPA-20 indicates their negative surface charge, the zeta potential values of PSPA-40 and AFPA-40 are very close to zero, indicating their non-ionic nature. The average particle size of the activated carbon samples PSPA-20, AFPA-20, PSPA-40, and AFPA-40 are 942.7, 470, 933.6, and 1074 nm, respectively. The particle size distribution of the samples is presented in Fig. S1.†
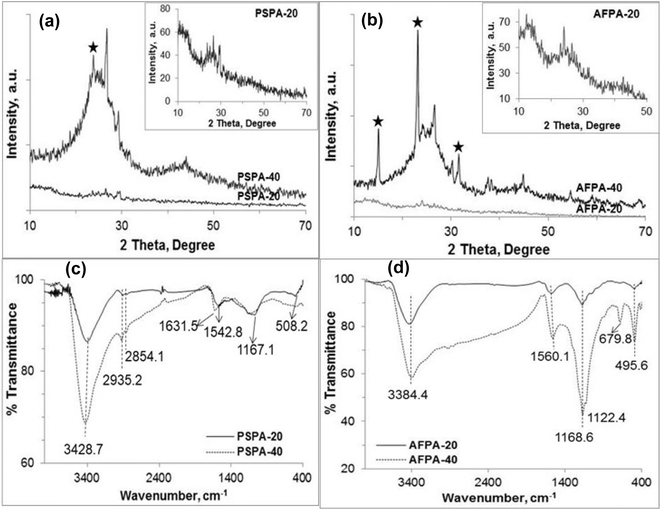
The XRD patterns presented in Fig. 2(a and b) shows poor crystallinity of all the activated carbon samples. However, the crystallinity of PSPA-40 and AFPA-40 is more than that of PSPA-20 and AFPA-20. The XRD patterns of all the activated carbons show two broad peaks at 2θ positions 24.2° and 42.8°, which are due to 002 and 100 diffraction planes of hexagonal graphitic carbon (JCPDS index, no. 75-1621).35 The broadness of these peaks indicates the formation of turbostratic carbon crystallites due to carbonization of the peanut shell and areca net shell fibers.36 The spike-like diffraction peaks observed in the XRD spectra of PSPA-40 and AFPA-40 (* marked) are due to the silica-phosphate compound formed due to the higher concentration of phosphoric acid used for activation. AFPA-40 shows more diffraction peaks due to silica-phosphate compound than PSPA-40, indicating a higher concentration of silica in areca nut fiber than in peanut shell.37
The FTIR spectra of the activated carbon samples are presented in Fig. 2(c and d). The absorption band between 3500–3100 cm−1 is characteristic of the –OH stretching vibration of the hydroxyl functional groups due to cellulose and lignin in both peanut shells and areca nut fibers.38 All the spectra show an absorption band at 1570–1630 cm−1 due to combined stretching vibrations of conjugated C![[double bond, length as m-dash]](https://www.rsc.org/images/entities/char_e001.gif) O groups and aromatic rings.38,39 The absorption bands between 1160 and 1180 cm−1 attributed to phosphorus and phosphor-carbonaceous compounds.40,41 The peak between 1160–1180 cm−1 can be assigned to the stretching vibration of hydrogen-bonded P
O groups and aromatic rings.38,39 The absorption bands between 1160 and 1180 cm−1 attributed to phosphorus and phosphor-carbonaceous compounds.40,41 The peak between 1160–1180 cm−1 can be assigned to the stretching vibration of hydrogen-bonded P![[double bond, length as m-dash]](https://www.rsc.org/images/entities/char_e001.gif) O groups of phosphates.42 The sharp peak near 500 cm−1 is attributed to the bending vibration of the O–Si–O linkage. The prominent bands between 800–400 cm−1 in the AFPA-40, the activated carbon obtained from areca nut fibers (Fig. 2(d)), indicate a reasonably higher concentration of silica than the carbon obtained from the peanut shell. This result corroborates the XRD results where more peaks for silica-phosphate compounds are observed for AFPA-40.
O groups of phosphates.42 The sharp peak near 500 cm−1 is attributed to the bending vibration of the O–Si–O linkage. The prominent bands between 800–400 cm−1 in the AFPA-40, the activated carbon obtained from areca nut fibers (Fig. 2(d)), indicate a reasonably higher concentration of silica than the carbon obtained from the peanut shell. This result corroborates the XRD results where more peaks for silica-phosphate compounds are observed for AFPA-40.
Fig. 3(a and b) shows the N2 adsorption–desorption isotherms of the activated carbon samples. According to the IUPAC classification, these isotherms are mixed of Type I and Type IV isotherms with H4-type hysteresis loop. A mixed Type I and Type IV isotherm is typical of activated carbon indicating a composite pore structure having both microporous and mesoporous pores. The initial region of reversible micropore filling (up to P/P0 = 0.1) is followed by multilayer physisorption and capillary condensation.43 The H4-type hysteresis loop is often associated with slit-like narrow pores; however, in this case, Type I isotherm is indicative of microporosity.44 The specific surface area, total pore volume and the average pore diameters of the adsorbents obtained by BET analyses are presented in Table 3. The BET surface area of the adsorbents lies between 586–778 m2 g−1 and the value increased with an increase in phosphoric acid concentration. The specific surface area values of the activated carbons follow the order PSPA-40 > PSPA-20 > AFPA-40 > AFPA-20. Among the two, the lower surface area of the areca nut fiber-generated activated carbons (AFPA samples) might be due to the presence of a higher concentration of silica as compared to the peanut shell carbons (PSPA). The total pore volume of all the activated carbon adsorbents lies in the range between 0.36 and 0.56 cc g−1, and the average pore diameter lies between 2.47 and 3.27 nm.
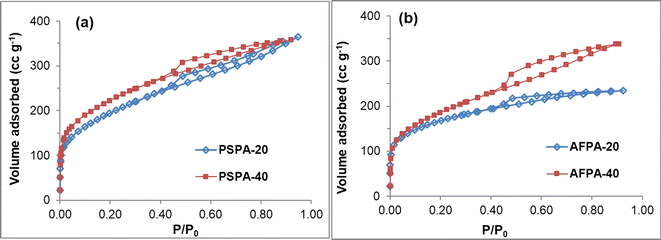 | ||
| Fig. 3 Nitrogen adsorption–desorption isotherms, surface area and porosity values of the activated carbon adsorbents obtained from (a) peanut shells and (b) areca nut fibers. | ||
| Adsorbent | Specific surface area (m2 g−1) | Total pore volume (cc g−1) | Average pore diameter (nm) |
|---|---|---|---|
| PSPA-20 | 689 | 0.56 | 3.27 |
| PSPA-40 | 778 | 0.55 | 2.85 |
| AFPA-20 | 586 | 0.36 | 2.47 |
| AFPA-40 | 653 | 0.52 | 3.21 |
The specific surface area of the activated carbon primarily depends on the concentration of the activating agent, and on the carbonization temperature. An increase in the specific surface area of activated carbon with an increase in phosphoric acid concentration has also been reported in the literature.45–47
3.2. Adsorption of paracetamol (APAP)
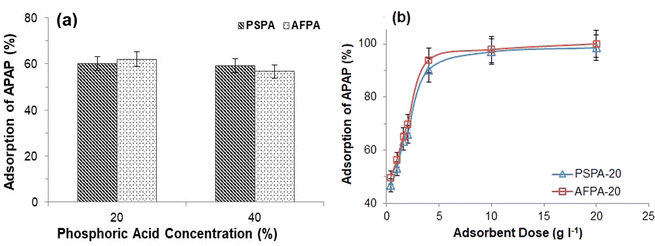
Therefore, based on the above observations, the adsorbent dose was optimized as 4 g l−1, and hereafter, all the adsorption experiments (unless otherwise stated) were performed using the optimum adsorbent dose.
ln(qe − qt) = ln![[thin space (1/6-em)]](https://www.rsc.org/images/entities/char_2009.gif) qe − k1t qe − k1t | (3) |
 | (4) |
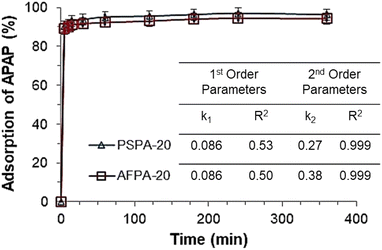
The values of pseudo first- and second-order rate constants and the respective correlation coefficients are presented in the inset of Fig. 5. The excellent fitting of the pseudo-second-order kinetic model is confirmed by the value of correlation coefficient (R2 = 1) while the same for the pseudo-first-order kinetic model is relatively low (R2 between 0.6–0.7). This implies that the pseudo-second-order kinetic model is the appropriate model to describe the kinetic behaviour of paracetamol (APAP) adsorption on the activated carbon adsorbents. The suitability of a pseudo-second-order kinetic model for the adsorption of organic pollutants, including pharmaceutical molecules, on activated carbon adsorbents, has also been reported in the literature.51,52
Based on the kinetic studies, the contact time was optimized as 30 min and followed in all further experiments.
 | (5) |
 | (6) |
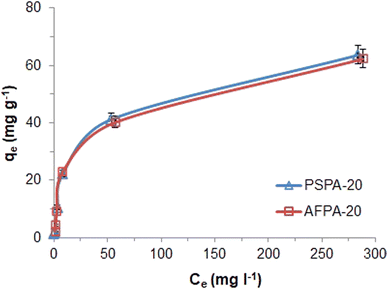 | ||
| Fig. 6 Adsorption isotherms of APAP on the activated carbon adsorbents (initial concentration: 5–500 mg l−1, contact time: 30 min, adsorbent dose: 4g l−1, temp: 28 °C). | ||
| Adsorbent | Freundlich isotherm parameters | Langmuir isotherm parameters | ||||
|---|---|---|---|---|---|---|
| n | k F | R 2 | b | V m | R 2 | |
| PSPA-20 | 1.80 | 4.05 | 0.927 | 0.05 | 67.57 | 0.993 |
| AFPA-20 | 1.80 | 4.05 | 0.880 | 0.04 | 67.11 | 0.993 |
The correlation coefficient values indicate a reasonably good fitting of the adsorption data to both the isotherm models. However, the correlation coefficient values obtained for the Langmuir isotherm model are very close to unity (R2 = 1) for both the adsorbents, while those for the Freundlich isotherm model are relatively less. Therefore, based on the correlation coefficient value, the Langmuir isotherm model can be considered the most suitable model (among the two) to explain the adsorption of paracetamol (APAP) on the activated carbon adsorbents. Moreover, the maximum adsorption capacity obtained from the Langmuir isotherm constant (Vm) 67.57 and 67.11 mg g−1 for PSPA-20 and AFPA-20, respectively, are very close to the respective experimental adsorption capacity of the adsorbents (63.65 and 62.38). The low values of the Langmuir isotherm constant ‘b’, which represents adsorption bond energy, indicate there is physical interaction between the activated carbon adsorbents and the paracetamol (APAP) molecule (adsorbate).
A similar observation about the better fitting of the Langmuir isotherm models in terms of correlation coefficient and the maximum adsorption capacity has been reported by Baccar et al., for the adsorption ketoprofen on activated carbon prepared from olive-waste cake.52 While González-Hourcade et al. reported that Liu's model, a hybrid adsorption mechanism (a combination of the Langmuir and Freundlich isotherm models), is the most suitable isotherm model for the adsorption of paracetamol on nitrogen-doped biochar made from microalgae biomass.27
The APAP adsorption performance of the PSPA-20 and AFPA-20 are compared with other activated carbon adsorbents reported in the literature. Table 5 shows the specific surface area, porosity and APAP adsorption capacity of activated carbon adsorbents obtained from various plant-based materials by different activation methods/chemicals. Generally, the surface area and porosity of the activated carbon play a significant role in the adsorption. Therefore, activated carbon with high surface area and porosity exhibited high APAP adsorption. The specific surface area, porosity and APAP adsorption capacities of the PSPA-20 and AFPA-20 are at par with those presented in Table 5 (except in two cases). The high APAP adsorption capacities of those obtained from orange peel and olive stone can be correlated with their very high surface area and porosity.
| Source material | Activation chemical, calcination temperature, and time | Surface area (m2 g−1) | Total pore vol. (cc g−1) | Adsorption capacity and the APAP conc. (range) | Reference |
|---|---|---|---|---|---|
| Orange peel | ZnCl2 | 1069 | 1.29 | 118 mg g−1 | 56 |
| 500 °C | 20–150 mg l−1 | ||||
| 120 min | |||||
| Residual pods of Erythrina speciose plant | ZnCl2 | 795.11 | 0.422 | 65 mg g−1 | 57 |
| 800 °C | 175 mg l−1 | ||||
| 120 min | |||||
| Cannabis Sativum Hemp | H3PO4 | — | — | 16.18 mg g−1 | 58 |
| 450 °C | 5–25 mg l−1 | ||||
| 240 min | |||||
| Banana peel | No chemical, pyrolysis at 750 °C for 30 min under N2 atm | 524 | 0.249 | 57.3 mg g−1 | 59 |
| 0.5–200 mg l−1 | |||||
| Tea leaves | H3PO4 | — | — | 59.2 mg g−1 | 60 |
| — | |||||
| Olive stone | H3PO4 | 990 | 0.91 | 98.4 mg g−1 | 61 |
| 500 °C | 0–20 mg l−1 | ||||
| 120 min | |||||
| Peanut shell | H3PO4 | 689 | 0.56 | 67.57 mg g−1 | Present study |
| 500 °C | 5–500 mg l−1 | ||||
| 120 min | |||||
| Arecanut fiber | H3PO4 | 586 | 0.36 | 67.11 mg g−1 | |
| 500 °C | 5–500 mg l−1 | ||||
| 120 min |
The pHPZC and pKa of the adsorbate are critical factors while investigating the influence of solution pH on the adsorption. The point of zero charge of PSPA-20 and AFPA-20 are 3.8 and 3.6, respectively [Fig. 7(b)], while the pKa of APAP is 9.38.1 This means at a pH below 3.6/3.8, the adsorbent surface is positive, and the adsorbent surface charge becomes negative at a pH > 3.6/3.8. On the other hand, APAP remains an un-dissociated molecule at a solution pH below 9.38 and becomes anionic as the solution pH goes higher than 9.38. In the present study, the APAP adsorption remains unaffected throughout the solution pH between 2 and 9, which implies the non-electrostatic nature of the adsorption process, as APAP molecules are neutral in this pH range. A similar observation has been mentioned by Saied et al. (2024) for the adsorption of paracetamol on orange peel-derived activated carbon.56 However, at a pH above 9.38 (pKa of APAP), the electrostatic repulsion between the anionic APAP and the negative surface charge of the adsorbents resulted in a decrease in APAP adsorption.
The influence of regeneration and reuse of the adsorbents on the APAP adsorption capacity of the adsorbents was studied up to 5 regeneration cycles (Fig. 8). Fig. 8 shows that the adsorption of APAP (>90%) is not affected up to the 2nd regeneration cycle. However, from the 3rd cycle, both the adsorbents show a slow but steady decrease in adsorption. After the 5th cycle, the APAP adsorption by the regenerated PSPA-20 and AFPA-20 were 73.17% and 69.35%, respectively. The decrease in adsorption capacity on repeated regeneration and reuse might be due to the fact that the facile regeneration methodology used in the present study (washing with water and drying at 50 °C) is not capable of removing the APAP molecules from the adsorbent completely.
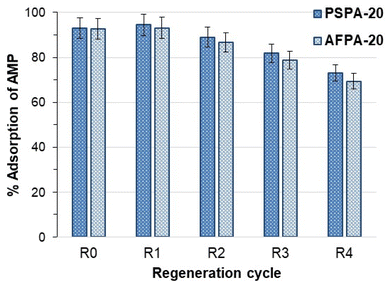 | ||
| Fig. 8 Adsorption (%) of APAP by the fresh (R0) and the regenerated activated carbons (initial APAP concentration: 50 mg l−1, contact time: 30 min, adsorbent dose: 4 g l−1, temp: 28 °C). | ||
Regeneration of phenolic compounds adsorbed activated carbons by simple water wash had also been reported by Mourão et al. (2008).62 Mourão et al.62 also reported an increase in adsorption in the 2nd cycle followed by a decrease in the subsequent cycles, as observed in the present study (Fig. 8). The non-electrostatic nature of the adsorption and the very short adsorbent–adsorbate contact time (30 min) are the two key points for water-based regeneration up to four cycles, after which the adsorption decreases reasonably due to the fact mentioned above.
3.3. Adsorption mechanism
To understand the adsorption mechanism of paracetamol (APAP) on the activated carbon adsorbents, the APAP-loaded adsorbents are separated from the solution by filtration, washed (2 times) with distilled water, and characterized by solid-state 13C NMR spectroscopy and Raman spectroscopy. The adsorbents PSPA-20 and AFPA-20, thus obtained after adsorption, are named PSPA-20AA and AFPA-20AA, respectively.The CPMAS solid-state 13C NMR spectra of all the activated carbon adsorbents before and after adsorption are shown in Fig. 9(a and b). The NMR spectra are entirely dominated by a single broad peak centered at ∼128 ppm, which is characteristic of sp2-hybridized carbon in condensed aromatic rings.63 Peaks in the range of 100–135 ppm are for the bridgehead carbons. Peaks in the range of 135–150 ppm are for the alkylated aromatic carbons.64 The intensity of the peak is increased after the adsorption of APAP for both the adsorbents, which is due to the aromatic carbons of the adsorbed n-acetyl-para-aminophenol (paracetamol, APAP) molecules on the adsorbent.
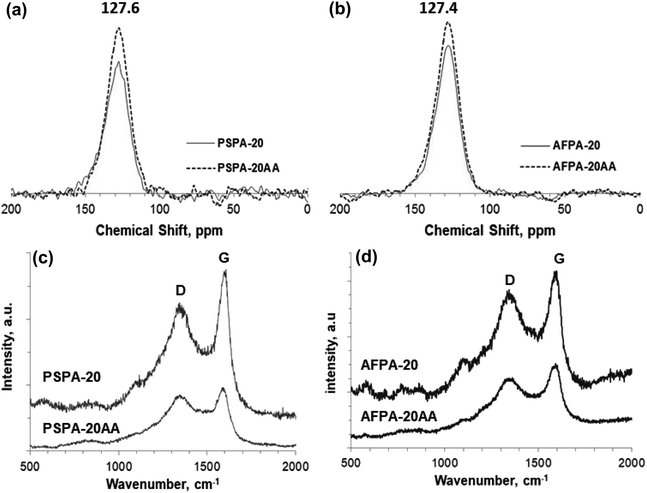 | ||
| Fig. 9 (a and b) CPMAS SS 13C NMR spectra, and (c and d) Raman spectra of the PSPA-20 and AFPA-20, before and after adsorption of paracetamol (APAP). | ||
The micro-Raman spectra of the adsorbents before and after adsorption of paracetamol, presented in Fig. 9(c and d), show the characteristic sharp bands typical of graphitic carbon at 1602 cm−1 and 1352 cm−1, also called G band and D band respectively.65 The G band, the first-order Raman band, is a result of in-plane vibrations of the sp2 hybridized carbon representing ordered graphitic structure, while the D band is due to out-of-plane vibrations attributed to the structural defects in the graphitic lattice. The D/G intensity ratio (ID/IG) is an important parameter that represents the degree of graphitization of carbon samples, and the lower the ID/IG ratio, the higher the degree of graphitization.27 The ID/IG value of both the adsorbents before adsorption is 0.98, indicating a more ordered chemical structure of the activated carbon adsorbents than the defects.66,67 After the adsorption of APAP, the ID/IG ratio of both the adsorbents is slightly reduced (0.95 and 0.89). The relative decrease in the ID/IG value after adsorption indicates increased graphitization due to the adsorbed paracetamol molecules present on the surface of the adsorbents that promote graphitization of the carbon.68 González-Hourcade et al., also reported that nitrogen doping decreased the ID/IG value of biochar from 2.19 to 1.79.27
The adsorption of paracetamol (APAP) on the activated carbon samples primarily takes place through surface adsorption (non-electrostatic) with monolayer formation, which is confirmed by the excellent fitting of adsorption equilibrium data to the Langmuir isotherm model. The uptake of paracetamol by the activated carbons is also through the pore-filling mechanism, as indicated by the CPMAS SS 13C NMR and Raman spectra (Fig. 9).
3.4. Adsorption of other pharmaceuticals
The adsorption capacities of the activated carbons are tested for two other pharmaceuticals namely, amoxicillin and aspirin (Fig. 10). Adsorbents PSPA-20 and AFPA-20 show similar adsorption capacity for amoxicillin while for aspirin, AFPA-20 shows remarkably higher adsorption as compared to the PSPA-20. The amoxicillin adsorption capacities of the PSPA-20 and AFPA-20 were 18.51 and 18.21 mg g−1 with percentage adsorption of 44.39 and 43.68, respectively. The aspirin adsorption capacities of the PSPA-20 and AFPA-20 were 32.60 and 41.58 mg g−1 with percentage adsorption of 62.54 and 79.88, respectively. The higher adsorption of aspirin on both the activated carbons compared to amoxicillin is due to the smaller molecular size of aspirin compared to amoxicillin,69 which again establishes the pore-filling mechanism as one of the adsorption pathways of these activated carbons. | ||
| Fig. 10 The adsorption of amoxicillin and aspirin by the activated carbon adsorbents (initial conc.: 100 mg l−1, adsorbent dose: 2 g l−1, contact time: 2 h, temp.: 28 °C). | ||
This study establishes the efficacy of the developed activated carbon adsorbents for the adsorption of pharmaceutical molecules in an aqueous medium.
4 Conclusions
The study showed that phosphoric acid-activated carbons prepared from agricultural waste materials by a facile method can effectively be used to remove a number of pharmaceuticals from water. The outcomes of this work advance the knowledge in the areas of the structural characteristics of the activated carbon materials obtained from peanut shells and areca nut fibers, the physico–chemical interactions between the activated carbon and pharmaceutical molecules, and the regeneration potential of the adsorbents for reuse for real-life application in large-scale water treatment systems. All the activated carbons showed high adsorption for all the studied pharmaceuticals, paracetamol, amoxicillin, and aspirin, in an aqueous medium. The adsorption of paracetamol was very fast, and the equilibrium was achieved within 30 min of contact. The adsorption kinetics followed a pseudo-second-order kinetic model. The adsorption isotherm followed the Langmuir monolayer model. The adsorption of paracetamol on the activated carbon adsorbents was not affected by the solution pH between 2 and 9. The adsorption of pharmaceutical molecules on the activated carbons is attributed primarily to the surface area and porosity of the adsorbent and to the chemical structure of the pharmaceutical molecule.The present study strongly established that phosphoric acid-activated carbon prepared by a facile method can be effectively used for the removal of a number of pharmaceuticals from water. A complete removal of the pharmaceutical molecules can be achieved by using an appropriate adsorbent dose, based on the initial concentration of the pharmaceutical compound in the water. The developed activated carbon adsorbents from agricultural waste materials could be perceived as a promising low-cost, eco-friendly adsorbent for the removal of active pharmaceuticals from water in advanced/tertiary water treatment systems, ensuring the “3 Rs” principle [reduce (waste), reuse and recycle] of environmental sustainability.
Consent for publication
All authors consented to the publication of this research article.Data availability
The data supporting this article have been included as part of the ESI.†Author contributions
Conceptualization, methodology, formal analysis, supervision, writing – review & editing (Sujata Mandal), investigation, data curation (Dayana Stephen), funding acquisition, project administration, review (Sreeram Kalarical Janardhanan).Conflicts of interest
The authors declare no conflict of interest.Acknowledgements
The authors wish to acknowledge the financial support received from CSIR – Central Leather Research Institute. The authors wish to thank Dr A. Sivasamy, CSIR-CLRI, for the BET measurements and Dr N. P. Lobo, CSIR-CLRI for the 13C solid-state NMR analyses. CSIR-CLRI communication no. 1904.References
- M. Patel, R. Kumar, K. Kishor, T. Mlsna, C. U. Pittman and D. Mohan, Pharmaceuticals of Emerging Concern in Aquatic Systems: Chemistry, Occurrence, Effects, and Removal Methods, Chem. Rev., 2019, 119(6), 3510–3673, DOI:10.1021/acs.chemrev.8b00299.
- M. Hejna, D. Kapuścińska and A. Aksmann, Pharmaceuticals in the Aquatic Environment: A Review on Eco-Toxicology and the Remediation Potential of Algae, Int. J. Environ. Res. Public Health, 2022, 19(13), 7717 CrossRef CAS PubMed . Available from: https://www.mdpi.com/1660-4601/19/13/7717.
- WHO, Pharmaceuticals in Drinking-Water, World Health Organization, 20 Avenue Appia, 1211 Geneva 27, Switzerland, 2012 Search PubMed.
- S. Webb, T. Ternes, M. Gibert and K. Olejniczak, Indirect human exposure to pharmaceuticals via drinking water, Toxicol. Lett., 2003, 142(3), 157–167 CrossRef CAS PubMed . Available from: https://linkinghub.elsevier.com/retrieve/pii/S0378427403000717.
- F. Pomati, Pharmaceuticals in drinking water: is the cure worse than the disease?, Environ. Sci. Technol., 2007, 41(24), 8204, DOI:10.1021/es072659b.
- A. Joss, S. Zabczynski, A. Göbel, B. Hoffmann, D. Löffler and C. S. McArdell, et al., Biological degradation of pharmaceuticals in municipal wastewater treatment: Proposing a classification scheme, Water Res., 2006, 40(8), 1686–1696 CrossRef CAS PubMed . Available from: https://linkinghub.elsevier.com/retrieve/pii/S0043135406001126.
- K. Samal, S. Mahapatra and M. Hibzur Ali, Pharmaceutical wastewater as Emerging Contaminants (EC): Treatment technologies, impact on environment and human health, Energy Nexus, 2022, 6, 100076 CrossRef CAS . Available from: https://linkinghub.elsevier.com/retrieve/pii/S2772427122000390.
- V. Homem and L. Santos, Degradation and removal methods of antibiotics from aqueous matrices – A review, J. Environ. Manage., 2011, 92(10), 2304–2347 CrossRef CAS . Available from: https://linkinghub.elsevier.com/retrieve/pii/S0301479711001782.
- C. Adams, Y. Wang, K. Loftin and M. Meyer, Removal of Antibiotics from Surface and Distilled Water in Conventional Water Treatment Processes, J. Environ. Eng., 2002, 128(3), 253–260, DOI:10.1061/(ASCE)0733-9372(2002)128:3(253).
- J. K. Challis, M. L. Hanson, K. J. Friesen and C. S. Wong, A critical assessment of the photodegradation of pharmaceuticals in aquatic environments: defining our current understanding and identifying knowledge gaps, Environ. Sci.: Processes Impacts, 2014, 16(4), 672, 10.1039/C3EM00615H.
- H. Ghazal, E. Koumaki, J. Hoslett, S. Malamis, E. Katsou and D. Barcelo, et al., Insights into current physical, chemical and hybrid technologies used for the treatment of wastewater contaminated with pharmaceuticals, J. Cleaner Prod., 2022, 361, 132079 CrossRef CAS . Available from: https://linkinghub.elsevier.com/retrieve/pii/S0959652622016869.
- A. Tahar, J.-M. Choubert and M. Coquery, Xenobiotics removal by adsorption in the context of tertiary treatment: a mini review, Environ. Sci. Pollut. Res., 2013, 20(8), 5085–5095, DOI:10.1007/s11356-013-1754-2.
- S. Mandal and S. Mayadevi, Defluoridation of water using as-synthesized Zn/Al/Cl anionic clay adsorbent: Equilibrium and regeneration studies, J. Hazard. Mater., 2009, 167(1–3), 873–878 CrossRef CAS PubMed.
- A. S. Mestre, J. Pires, J. M. F. Nogueira and A. P. Carvalho, Activated carbons for the adsorption of ibuprofen, Carbon, 2007, 45(10), 1979–1988 CrossRef CAS . Available from: https://linkinghub.elsevier.com/retrieve/pii/S0008622307002485.
- L. F. Delgado, P. Charles, K. Glucina and C. Morlay, The removal of endocrine disrupting compounds, pharmaceutically activated compounds and cyanobacterial toxins during drinking water preparation using activated carbon—A review, Sci. Total Environ., 2012, 435–436, 509–525 CrossRef CAS PubMed . Available from: https://linkinghub.elsevier.com/retrieve/pii/S0048969712009916.
- E. K. Putra, R. Pranowo, J. Sunarso, N. Indraswati and S. Ismadji, Performance of activated carbon and bentonite for adsorption of amoxicillin from wastewater: Mechanisms, isotherms and kinetics, Water Res., 2009, 43(9), 2419–2430 CrossRef CAS PubMed . Available from: https://linkinghub.elsevier.com/retrieve/pii/S0043135409001468.
- K. W. Goyne, J. Chorover, J. D. Kubicki, A. R. Zimmerman and S. L. Brantley, Sorption of the antibiotic ofloxacin to mesoporous and nonporous alumina and silica, J. Colloid Interface Sci., 2005, 283(1), 160–170 CrossRef CAS PubMed . Available from: https://linkinghub.elsevier.com/retrieve/pii/S002197970400877X.
- E. Al-Hetlani, B. D'Cruz, M. O. Amin and M. Madkour, An effective magnetic nanoadsorbent based on a carbonaceous/spinel ferrite nanocomposite for the removal of pharmaceutical pollutants from wastewater, Environ. Sci.: Water Res. Technol., 2022, 8(5), 998–1010, 10.1039/D1EW00495F.
- A. Masud, N. G. Chavez Soria, D. S. Aga and N. Aich, Adsorption and advanced oxidation of diverse pharmaceuticals and personal care products (PPCPs) from water using highly efficient rGO–nZVI nanohybrids, Environ. Sci.: Water Res. Technol., 2020, 6(8), 2223–2238, 10.1039/D0EW00140F.
- A. K. Mohammed and D. Shetty, Macroscopic covalent organic framework architectures for water remediation, Environ. Sci.: Water Res. Technol., 2021, 7(11), 1895–1927, 10.1039/D1EW00408E.
- O. A. Ajala, S. O. Akinnawo, A. Bamisaye, D. T. Adedipe, M. O. Adesine and O. A. Okon-Akan, et al., Adsorptive removal of antibiotic pollutants from wastewater using biomass/biochar-based adsorbents, RSC Adv., 2023, 13(7), 4678–4712, 10.1039/D2RA06436G.
- P. Darvishi, S. A. Mousavi, A. Mahmoudi and D. Nayeri, A comprehensive review on the removal of antibiotics from water and wastewater using carbon nanotubes: synthesis, performance, and future challenges, Environ. Sci.: Water Res. Technol., 2023, 9(1), 11–37, 10.1039/D1EW00912E.
- A. Solanki and T. H. Boyer, Pharmaceutical removal in synthetic human urine using biochar, Environ. Sci.: Water Res. Technol., 2017, 3(3), 553–565, 10.1039/C6EW00224B.
- M. Ullberg, E. Lavonen, S. J. Köhler, O. Golovko and K. Wiberg, Pilot-scale removal of organic micropollutants and natural organic matter from drinking water using ozonation followed by granular activated carbon, Environ. Sci.: Water Res. Technol., 2021, 7(3), 535–548, 10.1039/D0EW00933D.
- S. U. R. Beig, U. A. Dar, S. A. Sheergugri and S. A. Shah, Remediation of hexavalent chromium and pharmaceuticals from aquatic environments by employing an oxygen-doped porous carbon adsorbent and its antifungal activity, New J. Chem., 2023, 47(18), 8693–8713, 10.1039/D2NJ05841C.
- M. J. Luján-Facundo, M. I. Iborra-Clar, J. A. Mendoza-Roca and M. I. Alcaina-Miranda, Pharmaceutical compounds removal by adsorption with commercial and reused carbon coming from a drinking water treatment plant, J. Cleaner Prod., 2019, 238, 117866 CrossRef . Available from: https://linkinghub.elsevier.com/retrieve/pii/S0959652619327362.
- M. González-Hourcade, G. Simões dos Reis, A. Grimm, V. M. Dinh, E. C. Lima and S. H. Larsson, et al., Microalgae biomass as a sustainable precursor to produce nitrogen-doped biochar for efficient removal of emerging pollutants from aqueous media, J. Cleaner Prod., 2022, 348, 131280 CrossRef . Available from: https://linkinghub.elsevier.com/retrieve/pii/S0959652622009106.
- K. Huang, S. Yang, X. Liu, C. Zhu, F. Qi and K. Wang, et al., Adsorption of antibiotics from wastewater by cabbage-based N, P co-doped mesoporous carbon materials, J. Cleaner Prod., 2023, 391, 136174 CrossRef CAS . Available from: https://linkinghub.elsevier.com/retrieve/pii/S0959652623003323.
- S. K. Mitra and H. Devi, Arecanut in India – present situation and future prospects, Acta Hortic., 2018, 1205, 789–794 CrossRef . Available from: https://www.actahort.org/books/1205/<?pdb_no 1205?>1205<?pdb END?>_99.htm.
- Market Trends: Groundnut Exports, available from: https://pmfme.mofpi.gov.in/pmfme/newsletters/enewsgroundnut7.html.
- I. Neme, G. Gonfa and C. Masi, Activated carbon from biomass precursors using phosphoric acid: A review, Heliyon, 2022, 8(12), e11940 CrossRef CAS . Available from: https://linkinghub.elsevier.com/retrieve/pii/S2405844022032285.
- A. Xie, J. Dai, X. Chen, J. He, Z. Chang and Y. Yan, et al., Hierarchical porous carbon materials derived from a waste paper towel with ultrafast and ultrahigh performance for adsorption of tetracycline, RSC Adv., 2016, 6(77), 72985–72998, 10.1039/C6RA17286E.
- D. Panoth, K. Brijesh, K. V. Baiju, H. Nagaraja, N. Ponpandian and A. Paravannoor, An eco-friendly approach of designing arecanut husk ash into high performance Li ion battery anodes, Mater. Lett., 2023, 349, 134878 CrossRef CAS . Available from: https://linkinghub.elsevier.com/retrieve/pii/S0167577X23010637.
- S. I. Y. Samsunan and R. Rosiana, Influence of groundnut shell ash on compressive and tensile strengths of concrete, IOP Conf. Ser.: Mater. Sci. Eng., 2021, 1173(1), 012020, DOI:10.1088/1757-899X/1173/1/012020.
- J. Hu, F. Yang, C. Lai, H. Wang, J. Sun and H. Zhou, et al., Researches on a conductive polyaniline-acetylene black composite to suppress the hydrogen evolution reaction in lead-acid batteries, J. Solid State Electrochem., 2022, 26(5), 1153–1161, DOI:10.1007/s10008-022-05148-4.
- P. Kim, A. Johnson, C. W. Edmunds, M. Radosevich, F. Vogt and T. G. Rials, et al., Surface functionality and carbon structures in lignocellulosic-derived biochars produced by fast pyrolysis, Energy Fuels, 2011, 25(10), 4693–4703 CrossRef CAS.
- A. Styskalik, D. Skoda, Z. Moravec, J. G. Abbott, C. E. Barnes and J. Pinkas, Synthesis of homogeneous silicophosphate xerogels by non-hydrolytic condensation reactions, Microporous Mesoporous Mater., 2014, 197, 204–212, DOI:10.1016/j.micromeso.2014.06.019.
- Y. Huang, S. Li, J. Chen, X. Zhang and Y. Chen, Adsorption of Pb(II) on mesoporous activated carbons fabricated from water hyacinth using H3PO4 activation: Adsorption capacity, kinetic and isotherm studies, Appl. Surf. Sci., 2014, 293, 160–168 CrossRef CAS . Available from: https://linkinghub.elsevier.com/retrieve/pii/S0169433213024124.
- J. Coates, Interpretation of infrared spectra, a practical approach, in Encycl Anal Chem, ed. R. A. Meyers, John Wiley & Sons Ltd, Chichester, 2000, pp. 10815–10837 Search PubMed.
- M. S. Solum, R. J. Pugmire, M. Jagtoyen and F. Derbyshire, Evolution of carbon structure in chemically activated wood, Carbon, 1995, 33(9), 1247–1254 CrossRef CAS.
- M. Jagtoyen, M. Thwaites, J. Stencel, B. McEnaney and F. Derbyshire, Adsorbent carbon synthesis from coals by phosphoric acid activation, Carbon, 1992, 30(7), 1089–1096 CrossRef CAS.
- D. E. C. Corbrjdge, Infra-red analysis of phosphorus compounds, J. Appl. Chem., 2007, 6(10), 456–465 CrossRef.
- K. S. W. Sing and R. T. Williams, Physisorption hysteresis loops and the characterization of nanoporous materials, Adsorpt. Sci. Technol., 2004, 22(10), 773–782 CrossRef CAS.
- K. S. W. Sing, D. H. Everett, R. A. W. Haul, L. Moscou, R. A. Pierotti and J. Rouquerol, et al., Reporting physisorption data for gas/solid systems — with special reference to the determination of surface area and porosity, Pure Appl. Chem., 1985, 57(4), 603–619 CrossRef CAS . Available from: http://publications.iupac.org/pac/pdf/1985/pdf/5704x0603.pdf.
- D. Pathania, A. Araballi, F. Fernandes, J. M. Shivanna, G. Sriram and M. Kurkuri, et al., Cost effective porous areca nut carbon nanospheres for adsorptive removal of dyes and their binary mixtures, Environ. Res., 2023, 224, 115521 CrossRef CAS . Available from: https://linkinghub.elsevier.com/retrieve/pii/S0013935123003134.
- Z.-Y. Zhong, Q. Yang, X.-M. Li, K. Luo, Y. Liu and G.-M. Zeng, Preparation of peanut hull-based activated carbon by microwave-induced phosphoric acid activation and its application in Remazol Brilliant Blue R adsorption, Ind. Crops Prod., 2012, 37(1), 178–185 CrossRef CAS . Available from: https://linkinghub.elsevier.com/retrieve/pii/S092666901100478X.
- S. M. Yakout and G. Sharaf El-Deen, Characterization of activated carbon prepared by phosphoric acid activation of olive stones, Arabian J. Chem., 2016, 9, S1155–S1162 CrossRef CAS . Available from: https://linkinghub.elsevier.com/retrieve/pii/S1878535211003030.
- D. T. Nguyen, H. N. Tran, R. S. Juang, N. D. Dat, F. Tomul and A. Ivanets, et al., Adsorption process and mechanism of acetaminophen onto commercial activated carbon, J. Environ. Chem. Eng., 2020, 8(6), 104408, DOI:10.1016/j.jece.2020.104408.
- S. Lagergren, About the theory of so-called adsorption of soluble substance, Handlingar, 1989, 24, 1–39 Search PubMed.
- Y. Ho and G. Mckay, The kinetics of sorption of divalent metal ions onto sphagnum moss peat, Water Res., 2000, 34(3), 735–742 CrossRef CAS.
- M. S. Islam, B. C. Ang, S. Gharehkhani and A. B. M. Afifi, Adsorption capability of activated carbon synthesized from coconut shell, Carbon Lett., 2016, 20(1), 1–9 Search PubMed.
- R. Baccar, M. Sarrà, J. Bouzid, M. Feki and P. Blánquez, Removal of pharmaceutical compounds by activated carbon prepared from agricultural by-product, Chem. Eng. J., 2012, 211–212, 310–317, DOI:10.1016/j.cej.2012.09.099.
- C. H. Giles, T. H. MacEwan, S. N. Nakhwa and D. Smith, Studies in adsorption. Part XI. A system of classification of solution adsorption isotherms, and its use in diagnosis of adsorption mechanisms and in measurement of specific surface areas of solids, J. Chem. Soc., 1960, 3973–3993 RSC.
- H. M. F. Freundlich, Over the adsorption in solution. 1906, 57, 385, J. Phys. Chem., 1906, 57, 385 CAS.
- I. Langmuir, The adsorption of gases on pane surfaces of glass, mica and platinum, J. Am. Chem. Soc., 1918, 40(9), 1361–1403, DOI:10.1021/ja02242a004.
- M. E. Saied, S. A. Shaban, M. S. Mostafa and A. O. A. E. Naga, Efficient adsorption of acetaminophen from the aqueous phase using low-cost and renewable adsorbent derived from orange peels, Biomass Convers. Biorefin., 2024, 14, 2155–2172 CrossRef CAS.
- J. Georgin, D. S. P. Franco, M. S. Netto, M. S. Manzar, M. Zubair and L. Meili, et al., Adsorption of the First-Line Covid Treatment Analgesic onto Activated Carbon from Residual Pods of Erythrina Speciosa, Environ. Manage., 2023, 71(4), 795–808, DOI:10.1007/s00267-022-01716-6.
- M. Sajid, S. Bari, M. S. U. Rehman, M. Ashfaq, Y. Guoliang and G. Mustafa, Adsorption characteristics of paracetamol removal onto activated carbon prepared from Cannabis sativum Hemp, Alexandria Eng. J., 2022, 61(9), 7203–7212 CrossRef.
- M. Patel, R. Kumar, C. U. Pittman Jr and D. Mohan, Ciprofloxacin and acetaminophen sorption onto banana peel biochars: Environmental and process parameter influences, Environ. Res., 2021, 201, 111218 CrossRef CAS PubMed.
- S. Wong, Y. Lim, N. Ngadi, R. Mat, O. Hassan and I. M. Inuwa, et al., Removal of acetaminophen by activated carbon synthesized from spent tea leaves: equilibrium, kinetics and thermodynamics studies, Powder Technol., 2018, 338, 878–886 CrossRef CAS.
- F. J. García-Mateos, R. Ruiz-Rosas, M. D. Marqués, L. M. Cotoruelo, J. Rodríguez-Mirasol and T. Cordero, Removal of paracetamol on biomass-derived activated carbon: Modeling the fixed bed breakthrough curves using batch adsorption experiments, Chem. Eng. J., 2015, 279, 18–30 CrossRef . Available from: https://linkinghub.elsevier.com/retrieve/pii/S1385894715006348.
- P. A. M. Mourão, P. J. M. Carrott, M. M. L. R. Carrott and L. Marques, Different Ways to Regenerate an Activated Carbon: Comparison between an Activated Carbon from Cork and a Commercial Carbon, Mater. Sci. Forum, 2008, 587–588, 844–848 Search PubMed.
- A. Lazzarini, A. Piovano, R. Pellegrini, G. Leofanti, G. Agostini and S. Rudić, et al., A comprehensive approach to investigate the structural and surface properties of activated carbons and related Pd-based catalysts, Catal. Sci. Technol., 2016, 6(13), 4910–4922 RSC.
- H. N. Cheng, L. H. Wartelle, K. T. Klasson and J. C. Edwards, Solid-state NMR and ESR studies of activated carbons produced from pecan shells, Carbon, 2010, 48(9), 2455–2469, DOI:10.1016/j.carbon.2010.03.016.
- S. Bai, T. Wang, Z. Tian, K. Cao and J. Li, Facile preparation of porous biomass charcoal from peanut shell as adsorbent, Sci. Rep., 2020, 10(1), 1–9, DOI:10.1038/s41598-020-72721-0.
- A. C. Ferrari and D. M. Basko, Raman spectroscopy as a versatile tool for studying the properties of graphene, Nat. Nanotechnol., 2013, 8(4), 235–246 CrossRef CAS PubMed.
- A. Ariharan and B. Viswanathan, Porous activated carbon material derived from sustainable bio-resource of peanut shell for H2 and CO2 storage applications, Indian J. Chem. Technol., 2018, 25(2), 140–149 CAS.
- D. V. De Sousa, L. M. Guimarães, J. F. Félix, J. C. Ker, C. E. R. G. Schaefer and M. J. Rodet, Dynamic of the structural alteration of biochar in ancient Anthrosol over a long timescale by Raman spectroscopy, PLoS One, 2020, 15(3), 1–19 CrossRef PubMed.
- V. Bernal, L. Giraldo and J. Moreno-Piraján, Physicochemical Properties of Activated Carbon: Their Effect on the Adsorption of Pharmaceutical Compounds and Adsorbate–Adsorbent Interactions, C, 2018, 4(4), 62 CAS.
Footnotes |
| † Electronic supplementary information (ESI) available. See DOI: https://doi.org/10.1039/d4su00262h |
| ‡ Present address: Advanced Materials Laboratory, CSIR – Central Leather Research Institute, Chennai-600020, India. |
| This journal is © The Royal Society of Chemistry 2024 |


