 Open Access Article
A natural fibre based sustainable and high-performance platform for electrochemical sensors†
Nachiket Aashish
Gokhale
 abc,
Chiranjeevi Srinivasa
Rao Vusa
 ab and
Siddhartha
Panda
 *abc
*abc
aSamtel Centre for Display Technologies, Indian Institute of Technology Kanpur, Kanpur, 208016, India. E-mail: spanda@iitk.ac.in
bNational Centre for Flexible Electronics, Indian Institute of Technology Kanpur, Kanpur, 208016, India
cDepartment of Chemical Engineering, Indian Institute of Technology Kanpur, Kanpur, 208016, India
First published on 10th May 2024
Abstract
Climate change, environmental pollution, micro-plastics, and increased carbon footprints are pushing the world towards sustainable alternatives to existing and future technologies. A sustainable alternative to ceramics, metals and polymeric fibres is natural fibres. In this study, we established a novel sensing platform addressing sustainability concerns by utilizing the natural fibres of sugarcane skin. This platform, termed SugarcaneSens, is created by depositing gold onto the sugarcane skin as the substrate. The sugarcane skin plays a distinct role as both a sustainable substrate and a nano-roughened support for creating a highly electrochemically active surface over the working electrode. As test cases for SugarcaneSens, electrochemical detection of glucose in synthetic human sweat at pH 13 and Cd2+ in acetate buffer was conducted using these chips. Glucose could be detected without the use of enzymes in the range of 1–2000 μM. SugarcaneSens also exhibited a linear response to Cd2+ over a broad concentration range (1–1000 nM). To evaluate the environmental impact of SugarcaneSens, life cycle assessment (LCA) was performed. On comparing the LCA of these chips with similarly prepared ceramic and polyethylene terephthalate (PET) chips, SugarcaneSens showed the least environmental impact. This makes them the most sustainable choice for electrochemical sensing. This methodology to fabricate natural fibre based electrodes can pave the way for sustainable practices in the upcoming electrochemical sensor industry.
Sustainability spotlightThe usage of electrochemical sensors is widely growing. These high-performance devices are developed using toxic and non-biodegradable materials. Utilizing natural fibers as substrates for these sensors will not only valorize the fibers and make the electrochemical devices sustainable but the rough textures of these fibers will also contribute to the high performance of the devices. The work described in this article addresses United Nations Sustainability Development Goal 12 (ensuring sustainable consumption and production patterns), because using natural fibers will solve the disposal problem of these sensors as these fibers are biodegradable and non-toxic. Also, developing sensors using these fibers ensures 100 times less impact on the environment during sensor development. |
1. Introduction
Environmental pollution, microplastics, rising carbon footprints, and climate change are forcing global research to explore viable sustainable alternatives for existing and emerging technologies.1 The need for chemical sensors is rapidly expanding due to digitization and database-based approaches. These sensors are widely used in food, health and environmental monitoring and in agricultural industries.2,3 These devices are fabricated with several environmentally unsustainable materials like ceramics, composites, silicon, and high density polymers, which are non-biodegradable and require highly polluting activities like mining.2,4–6 The compound annual growth rate of the chemical sensor industry is projected to be 11%;2,7 hence a small sustainable shift can grossly impact the environment.Electrochemical transduction is one of the most versatile and adaptable sensing technologies for chemical sensors as it is rapid, accurate, selective and simple to use.8 In electrochemical sensing, an electrode serves as a transduction element in the presence of the electrolyte and is an integral part of the device. An electrochemical sensor consists of electrodes (working, counter and reference electrodes or working and quasi reference electrodes) constructed over a substrate.9 Ceramics, high-density polyethylene, polyethylene terephthalate glass, paper, and cloth are widely used as substrates for electrochemical sensors.5,6,10,11 Most of these devices are single use devices and the electrodes are disposed of immediately after use. Considering the growing demands of the market, this will lead to the formation of more waste and have a negative impact on the environment. Hence the sustainability of the devices needs to be considered. The substrate of the sensor has a significant contribution to the overall environmental impact of the electrochemical sensor.6 A common strategy to address this is to use biodegradable materials that will have a lower impact on the environment.12 Studies on use of paper, textile materials and biodegradable polymers like cellulose acetate, polylactic acid, polyethylene glycol and poly (butylene adipate co-terephthalate) as substrates were reported.13–16 Although these materials possess biodegradability, their production requires use of various chemicals and processes, which are polluting and energy consuming.17 Hence, there is a need to develop better environmentally friendly alternatives.
Apart from sustainability, there is a drive to develop portable devices with higher signals and better selectivity. The signal from the device is directly linked to the electrochemically active surface area. To make devices portable, miniaturisation of the devices is essential, which implies a decrease in the footprint of the electrochemical cell and this would reduce the ECSA of the working electrode (WE). Creating micro-nano-roughness on the electrode surface and depositing nano-materials on the WE are some of the common strategies to enhance the ECSA of the WE.18,19 Hsu et al. roughened the Si substrate by etching silicon nanowires, which were then coated with gold for enzymatic glucose sensing.20 Using this approach, the ECSA was 6.12 times higher as compared to planar gold electrodes.
Biomass skins otherwise used as a fuel for chemical processes can be valorised by deploying them as substrates for electrochemical sensors.21,22 Peels or outer shells of bamboo, sugarcane, palm, etc. can be used as substrates for manufacturing electrochemical sensing chips. The water-resistant properties of biomass skin fibres can be leveraged to engineer sustainable and biodegradable substrates for electrochemical sensing.23 The natural alignment and rough texture of these fibres can be harnessed to create a higher surface area, resulting in a high-performance and environmentally friendly sensing platform.
Sugarcane peels or skin is abundantly available from the agricultural and food processing industries.21 These skins are removed from sugarcane before processing it for sugar and ethanol production.22 Then these skins along with the solid remains from ethanol production are then converted into briquettes for fuelling the plant.22 Use of sugarcane skins as substrates for electrochemical sensing chips could aid in earning carbon credits and generate additional revenue.1
In this work, a sugarcane skin-based platform hereby named SugarcaneSens is developed. The key performance parameters like stability, shelf life, and biofouling resistance of SugarcaneSens are evaluated. The ECSA of the SugarcaneSens chip is compared to that of conventional chips. To demonstrate the potential applications of SugarcaneSens in electrochemical sensing, electrochemical detection of glucose in synthetic human sweat at pH 13 and Cd2+ in acetate buffer is performed. The concentration of glucose in sweat is in the range of 10–1000 μM and the maximum permissible level for cadmium in drinking water is 5 ppb (∼100 nM).24–26
2. Materials and methods
2.1 Chemicals and reagents
Analytical grade (purity > 99%) potassium chloride (KCl), potassium hydroxide (KOH), and D-lactic acid from Merck, sodium chloride (NaCl) from Loba, India, Na2HPO4, H2SO4 and KH2PO4 (Fischer), acetic acid (glacial, 100%), glucose, sodium acetate and urea (Sigma-Aldrich) were purchased. Deionized (DI) water from a Millipore Milli-Q purification system was used in all the experiments.2.2 Chip preparation
Shells of fresh sugarcane were procured locally. These barks were washed with water and residual flesh on the bark was removed with the help of a scrapper. The barks were cut into pieces of 1 cm × 4 cm, and sun dried until all the water was removed.The WE was fabricated on these dried sugarcane skins by depositing gold of 50 nm thickness using a DC sputter coater (M/s Hind High Vacuum, India). The diameter of the WE was 3 mm. Similarly, gold WEs were deposited on polyethylene terephthalate sheets and ceramic strips, which were procured from a local market. A vinyl mask with a circular cut-out was applied over the strip to maintain the geometrical footprint. The backside of the electrode is also masked with the same vinyl mask to reduce water absorption by the sugarcane fibres. These processed chips of sugarcane, ceramic and polyethylene terephthalate are referred to by the acronyms SugarcaneSens, CER and PET chips, respectively. To evaluate the surface roughness and facets of gold on the WE of the SugarcaneSens chips, atomic force microscopy (AFM) and X-ray diffraction (XRD) were performed using an MFP3D Origin (Oxford instruments) and PANalytical X'Pert3 respectively.
2.3 Electrochemical experiments
For all the electrochemical experiments, a three-electrode cell at room temperature with SugarcaneSens/CER/PET chips as WEs, a platinum spring as a counter electrode, and Ag/AgCl (Sat. KCl, E0 = 0.197 V vs. RHE (reference hydrogen electrode)) as a reference electrode were used.The ECSA of the gold working electrode for each chip was evaluated by performing CV on these chips in 50 and 500 mM H2SO4 with a scan rate of 500 mV s−1.
The duration for electrochemical sensing of various analytes varies from a few seconds to 10 minutes.27–30 In the case of biosensing, the time scale is in the range of 1–3 minutes, and it is about 10 minutes for metal ion detection.27–30 Hence, in the case of single use sensors, 10 minutes can be safely chosen as the maximum time of exposure for testing the antifouling capacity.
2.4 Life cycle assessment (LCA)
LCA is a robust tool for analysing the individual parts that go into making a product. It is a complete tool for estimating the environmental impact of the product throughout its lifetime (from “cradle to grave”). This includes getting the raw materials, processing them, making the product, using it, and its disposal.LCA was performed as per the ISO 14040 standard using OPENLCA v1.11.0 open-source software. The ISO 14040 standard describes the framework for performing the LCA study, which is divided into 4 parts: (a) defining its goal and scope, (b) defining the inventory, (c) evaluation of environmental impacts and (d) interpretation from the study.
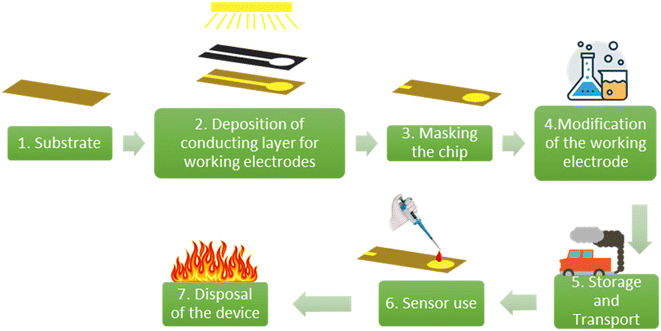
The scope of this study includes only comparing the environmental impact of (i) sugarcane skin, (ii) PET and (iii) ceramics as substrates for electrochemical sensing. This includes the steps for fabricating the strips and disposal of the strips. The steps 2–6 as shown in Fig. 1 are common to all three choices and hence are eliminated from the scope of study in the case of lateral comparison between the substrates.
2.5 Data analysis
OriginPro™ (Ver. 2021b) was used for the plots and statistical analyses. The presented data are the statistical mean of three independent experiments (except the repeatability, reproducibility, and time stability data). The experiments were repeated independently using freshly fabricated electrodes produced under identical conditions. The error bars represent the standard deviations (SDs). The detection limit was calculated as 3 × SD from the slope of the calibration plot. The variation in the text refers to the variation between the maximum and minimum values for the experiment.3. Results and discussion
3.1 Fabrication of chips
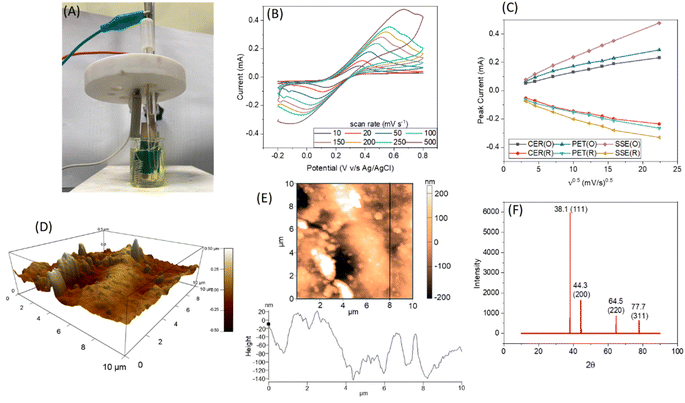
The thickness of gold deposition on the sugarcane skin is optimised and an optimum value of 50 nm was obtained (refer to S3, ESI† for more details). The gold deposition had strongly adhered on the sugarcane skin with a 4 rating according to ASTMD3359 standards (please refer to S3 of the ESI†). To verify the reversibility and transport properties of SugarcaneSens, CVs were recorded in 10 mM K4[Fe(CN)6] and K3[Fe(CN)6] in 100 mM KCl by varying the scan rate from 10 to 500 mV s−1 (experimental setup shown in Fig. 2A). Fig. 2B depicts the CV recorded at various scan rates for the WE of the SugarcaneSens chip. The oxidation and reduction peak currents increase as the scan rate increases and are directly proportional to the square root of the scan rate (Fig. 2C) and thus the redox process is diffusion controlled. According to the Randles–Sevcik equation, the slope of peak current vs. ν1/2 in the scan rate study is directly proportional to the total number of active sites. Fig. 2C shows that the slopes for both oxidation and reduction peaks of SugarcaneSens are greater than those for CER and PET. Hence, the SugarcaneSens chip has more electrochemically active sites than CER and PET. This is due to the nano-micro-roughness of the sugarcane skin, which can be seen in the AFM image (Fig. 2D and E) (for AFM of CER and PET, please refer to Section S4, ESI†). XRD shown in Fig. 2F revealed that the (111), (200), (220) and (311) facets of Au were present on the WE of SugarcaneSens.3.2 Electrochemical characterization of the sugarcane skin chips
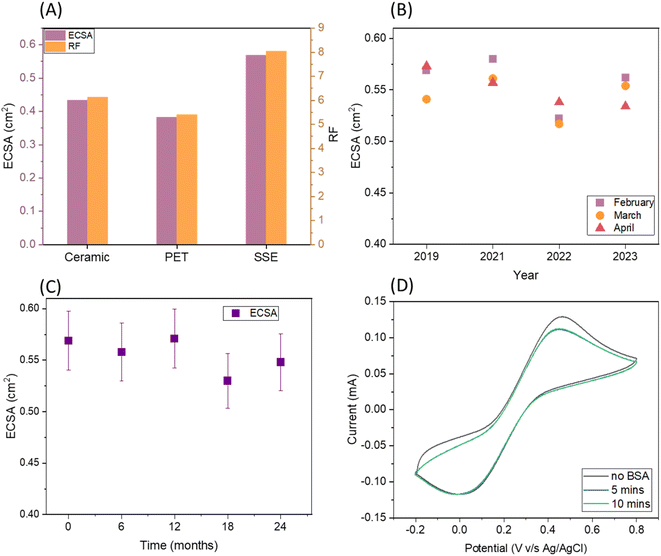
The roughness factor (RF) of SugarcaneSens is ∼8, which is comparable to the RF reported by several gold nano-particles deposited over planar gold, glassy carbon and other commercially available electrodes as seen in Table 1. Hence SugarcaneSens can act as a better support for nano-material deposition.
3.3 Anti-fouling characteristics
One of the common solutions for anti-fouling is making the surface slightly hydrophobic. Gold is a commonly used material for the working electrode and the contact angle for planar gold with water is 45°.34,35 The fibres of biomass skins have a natural ability to resist water. The contact angle for sugarcane skin with water is ∼78° and the contact angle of water droplets on the WE of SugarcaneSens is ∼80° (Fig. S6†). Hence SugarcaneSens is expected to have anti-fouling capacity.Biofouling in real samples is primarily due to human serum albumin (HSA), which is abundantly present in body fluids like blood, sweat and saliva. To simulate the extent of biofouling, the electrode surface was exposed to a solution of BSA, which is a homologue of HSA. The extent of biofouling was evaluated by comparing the oxidation and reduction peaks of Fe(II) and Fe(III) in the presence and absence of BSA. When a SugarcaneSens chip was exposed to 50 g L−1 of BSA, the oxidation peak current dropped by ∼10% in 5 minutes and ∼13% in 10 minutes (Fig. 3D). As the peak current drop is minimal, SugarcaneSens can be used as a substrate for single use biosensors involving clinical samples.36 This antifouling properties of SugarcaneSens can be attributed to the nano-surface roughness of the sugarcane skin as seen in Fig. 2D, which prevents protein adsorption and makes room for the smaller redox probe to access the WE (for more explanation, please refer to S6, ESI†).36
3.4 Glucose sensing
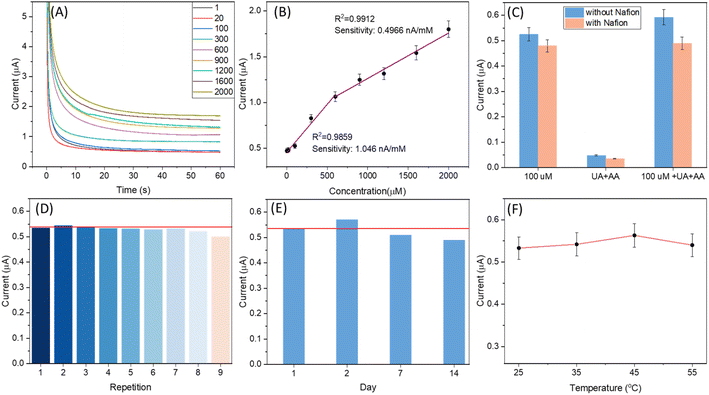
The ability of the SugarcaneSens chip WE to oxidise glucose was first studied by performing CV in different concentrations of glucose added to 0.1 M KOH sweat as can be seen in Fig. S8 (ESI).† The electrooxidation of glucose on gold surfaces is dominated by the formation of adsorbed gold hydroxide (Au(OH)ads).11 Hence 0.1 M KOH as a background electrolyte was used and the results are shown in Fig. 4. Sugarcane fibres are rich in glucose, and it can interfere in the glucose measurements. The extent of glucose diffusion from the fibres of SugarcaneSens was examined and the effect of glucose diffusion varied from 10% at a lower concentration (1 μM) to 0.005% at the highest concentration detected (2000 μM) (S9, ESI†).The amperometric response for the WE of SugarcaneSens in 0.1 M KOH-sweat at 0.5 V for different concentrations of glucose ranging from 1 to 2000 μM is shown in Fig. 4A. The current response of the electrode increases with the increase in glucose concentration. The current response with the change in the concentration of glucose is plotted, and two linear ranges are observed for glucose in the concentration range of 1–900 μM and 900–2000 μM with correlation coefficients of 0.9859 and 0.9912, respectively (Fig. 4B). The limit of detection (LOD) is calculated to be 500 nM (using the first linear correlation, 1–900 μM). As seen in Fig. 4C, the amperometry response of glucose in the presence and absence of UA and AA was compared. UA and AA have significant interference in glucose measurement. This can be eliminated by drop-casting Nafion over the working electrode. As can be seen in Fig. 4C, the signals with the Nafion coated electrode had a negligible effect of AA and UA interference. Reusability tests shown in Fig. 4D revealed that SugarcaneSens can be reused up to 8 times for glucose sensing. The shelf-life study of SugarcaneSens using Fe(II)/Fe(III) as the probe element is discussed in 3.2.3. For a better understanding of the shelf-life in real applications, time stability studies were also performed using glucose as the probe element. As seen in Fig. 4E, SugarcaneSens showed a stable response for 14 days. As the temperature is increased, the onset potential for glucose oxidation will reduce, and hence the potential applied for CA will result in an increased signal and later mass transfer will be rate limiting and the current will saturate and decrease with further increase in temperature.37 As seen in Fig. 4F, there was a slight variation in the signal, which increased with increase in temperature and the response peaked at 45 °C (amperometry responses for Fig. 4C–F are provided in S10 of the ESI†).
3.5 Heavy metal sensing
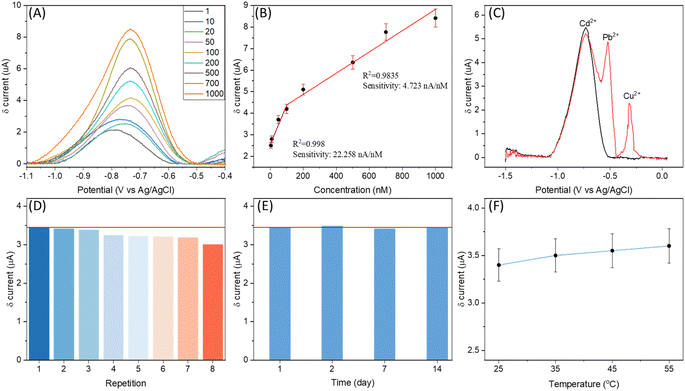
Heavy metal detection and quantification is another attractive application of electrochemical sensing technology. The high ECSA for the WE of SugarcaneSens and its antifouling characteristics make the SugarcaneSens chips suitable for real-world water samples for heavy metal sensing. Adsorption spectroscopy methods are expensive, time-consuming, and require complex sample pre-treatment. In contrast, electrochemical detection methods are cheaper and simpler.38 The most common method is the deposition of target metal ions, followed by anodic stripping voltammetry (ASV). Gold-plated SugarcaneSens was tested for ASV cadmium quantification. Heavy metals present in the fibres of sugarcane can interfere in the analytical measurements. The extent of cadmium diffusion from SugarcaneSens was evaluated and found negligible (S11, ESI†).The potential and time for deposition were optimised and Cd2+ was deposited at an optimised potential and time of −1.5 V and 30 seconds respectively (S12, ESI†). ASV was then done by linear sweep voltammetry. A peak corresponding to stripping of Cd2+ was observed at ∼−0.8 V. For better resolution, a moving average baseline correction was performed on the data and the peaks for various concentrations of Cd2+ in solution are plotted in Fig. 5A. As seen in Fig. 5A and B, the peak current increases proportionally with cadmium concentration, with two linear ranges from 1 nM to 100 nM and 100 nM to 1000 nM, respectively, with sensitivities of 22.258 nA nM−1 and 4.723 nA nM−1 respectively. Human sweat has a pH range of 4 to 6.8, and it contains 10–200 nM Cd2+.38 The results of the interference study are shown in Fig. 5C, in which the black line refers to the signal from 200 nM Cd2+ and the red line refers to the signal from 200 nM Cd2+ along with 200 nM Pb2+ and Cu2+. The unresolved peaks of Cd2+ and Pb2+ as seen in Fig. 5C show the effect of Pb2+ in cadmium sensing. The red line in Fig. 5D and E refers to the mean value of the signal for 200 nM Cd2+. As seen in Fig. 5D, the signal sharp decrease after the third repetition indicates that the electrode is reusable until 3 times. The time stability of SugarcaneSens was also examined using Cd2+ as the probe element. As seen in Fig. 5E, SugarcaneSens showed a stable response for 14 days. The electrochemical response of the sensor increased with increase in temperature as can be seen in Fig. 5F (ASV curves for Fig. 5D–F are provided in S13 of the ESI†). A selective sweat cadmium sensor and its testing in real samples using SugarcaneSens will be investigated in further studies.
3.6 Interpretations from life cycle assessment
The substrate material, steps for depositing the conducting layer for the WE, CE and RE and WE modification/functionalization steps are the main components in the fabrication of the electrochemical sensor chip. A study by Ahamed et al. showed that the substrate of the chip had a major contribution to the environmental impact of the device.39 In this study, the substrate material was varied, and the remaining components were kept constant. The environmental impacts of the substrate materials are evaluated using 11 midpoint indicators as shown in Fig. 6.40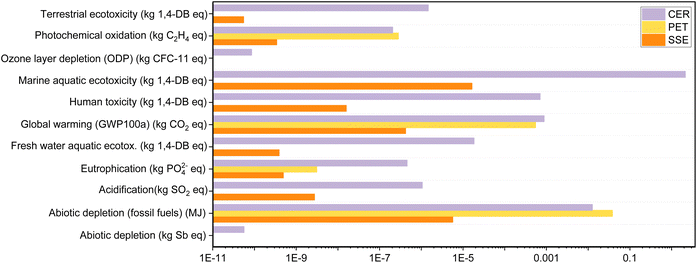 | ||
| Fig. 6 The impact assessment results of the major impact categories for the production process of the substrate materials for electrochemical sensors. | ||
SugarcaneSens had the lowest environmental implications across all impact categories when compared to ceramic and PET. When compared to LCA data from Ahamed et al., SugarcaneSens had a lower overall impact than cotton textile, HDPE plastic, and glass electrodes.39 During the disposal step, SugarcaneSens and PET would combust to produce CO and CO2, as well as a very small amount of particulate matter. Ceramic, on the other hand, would produce a large amount of particulate matter. As a result, ceramic has the highest global warming potential (GWP). Terrestrial ecotoxicity is primarily caused by heavy metal emissions into the atmosphere, which account for ∼85% of the GWP score in the case of ceramics but are negligible in the case of PET manufacturing. No toxic and dangerous reagents are used while developing SugarcaneSens from sugarcane fibres. However, the human and marine toxicity as seen in Fig. 6 is primarily due to the use of pesticides in agricultural activities for sugarcane cultivation. The fossil fuel depletion indicator is dominated by the consumption of non-renewable energy resources in the fabrication of all substrate materials. This factor can be eliminated by enhancing the use of renewable energy resources in upstream processes. Emissions to fresh water during the ceramics manufacturing process account for the high value of marine aquatic ecotoxicity and human toxicity. Because of the use of fossil fuels in material extraction and manufacturing processes, PET had the greatest implications for abiotic depletion.
When compared to CER and PET, SugarcaneSens had a significantly lower contribution in all 11 parameters. PET came in second and shared several parameters with CER. According to this evaluation, the order of preference is SugarcaneSens > PET > CER. In commercial screen-printed chips, SugarcaneSens can be a sustainable alternative to the commonly used substrates like ceramics.
4. Conclusions
SugarcaneSens was developed using the natural fibres of sugarcane shell as a sustainable substrate for developing electrochemical sensors. SugarcaneSens was thoroughly examined and benchmarked for various technical parameters. An adhesion test revealed that the WE strongly adhered to the surface of SugarcaneSens. The SugarcaneSens chips had a batch-to-batch variation of ∼15%, a shelf life of 1 year and can work in the temperature range of 25–55 °C, making it suitable for real world applications. The SugarcaneSens chip had a decent antifouling capacity making it a suitable candidate for biosensing. The sensing abilities of SugarcaneSens were demonstrated using electrochemical detection of glucose in synthetic human sweat at pH 13 and Cd2+ in acetate buffer. Glucose could be detected without the use of enzymes in the range of 1–2000 μM and Cd2+ in the range 1–1000 nM. The effects of interferents, repeatability, and stability for glucose and cadmium were examined for both glucose and cadmium. SugarcaneSens can be reused up to 8 times for glucose and 7 times for cadmium detection. It had a negligible effect of interferents and showed stable response up to 14 days for both glucose and cadmium. However, the detection in real samples using SugarcaneSens will be performed in further studies. The LCA comparison of the SugarcaneSens, CER and PET chips revealed that the SugarcaneSens chips have a substantially low GWP as compared to the others making it the most sustainable candidate for substrates. Several electrochemical sensors ranging from heavy metal sensing to sensing of biomolecules can be developed using SugarcaneSens.Author contributions
Nachiket Aashish Gokhale – conceptualization, methodology, software modelling, investigation, formal analysis, validation, writing – original draft, and writing – review & editing. Chiranjeevi Srinivasa Rao Vusa – validation and writing – review & editing. Siddhartha Panda – supervision, conceptualization, project administration, funding acquisition, resources, and writing – review & editing.Conflicts of interest
There are no conflicts of interest to declare.Acknowledgements
Financial support from the Ministry of Electronics and Information Technology, Government of India (grant number W-49/3/2019-IPHW-MeitY) is acknowledged. The authors thank Dr Anirban Paul for his inputs in the initial stage of this work. The authors also acknowledge the Centre for Nanoscience, IIT Kanpur for AFM facility.References
- Z. Wang, W. Huang, H. Wang, J. Gao, R. Zhang, G. Xu and Z. Wang, Research on the Improvement of Carbon Neutrality by Utilizing Agricultural Waste: Based on a Life Cycle Assessment of Biomass Briquette Fuel Heating System, J. Cleaner Prod., 2024, 434, 140365, DOI:10.1016/j.jclepro.2023.140365.
- T. M. Swager and K. A. Mirica, Introduction: Chemical Sensors, Chem. Rev., 2019, 119(1), 1–2, DOI:10.1021/acs.chemrev.8b00764.
- T. Qin, B. Yao, Y. Zhou, C. Wu, C. Li, Z. Ye, D. Zhi and S. S. Lam, The Three-Dimensional Electrochemical Processes for Water and Wastewater Remediations: Mechanisms, Affecting Parameters, and Applications, J. Cleaner Prod., 2023, 408, 137105, DOI:10.1016/j.jclepro.2023.137105.
- F. Sun, X. Wang, Z. You, H. Xia, S. Wang, C. Jia, Y. Zhou and J. Zhang, Sandwich Structure Confined Gold as Highly Sensitive and Stable Electrochemical Non-Enzymatic Glucose Sensor with Low Oxidation Potential, J. Mater. Sci. Technol., 2022, 123, 113–122, DOI:10.1016/j.jmst.2022.01.014.
- B. R. Eggins, Chemical Sensors and Biosensors, J. Wiley, 2002 Search PubMed.
- E. Surra, Á. Torrinha, C. Delerue-Matos and S. Morais, Analysis of Ketoprofen in Fish: Life Cycle Assessment Using Sensors vs. Conventional Methodology, Sustainability, 2023, 15(8), 6775, DOI:10.3390/su15086775.
- Mordor Intelligence, Global electrochemical sensor market size & share analysis - growth trends & forecasts (2023–2028), https://www.mordorintelligence.com/industry-reports/global-electrochemical-sensors-market-industry, accessed 2023-08-27.
- J. Baranwal, B. Barse, G. Gatto, G. Broncova and A. Kumar, Electrochemical Sensors and Their Applications: A Review, Chemosensors, 2022, 10(9), 363, DOI:10.3390/chemosensors10090363.
- J. N. Y. Costa, G. J. C. Pimentel, J. A. Poker, L. Merces, W. J. Paschoalino, L. C. S. Vieira, A. C. H. Castro, W. A. Alves, L. B. Ayres, L. T. Kubota, M. Santhiago, C. D. Garcia, M. H. O. Piazzetta, A. L. Gobbi, F. M. Shimizu and R. S. Lima, Single-Response Duplexing of Electrochemical Label-Free Biosensor from the Same Tag, Adv. Healthcare Mater., 2024, 13(2303509) DOI:10.1002/adhm.202303509.
- E. Witkowska Nery, M. Kundys, P. S. Jeleń and M. Jönsson-Niedziółka, Electrochemical Glucose Sensing: Is There Still Room for Improvement?, Anal. Chem., 2016, 88(23), 11271–11282, DOI:10.1021/acs.analchem.6b03151.
- E. González-Martínez, S. Saem, N. E. Beganovic and J. M. Moran-Mirabal, Electrochemical Nano-Roughening of Gold Microstructured Electrodes for Enhanced Sensing in Biofluids**, Angew. Chem., Int. Ed., 2023, 62(19) DOI:10.1002/anie.202218080.
- F. Martins, Á. Torrinha, C. Delerue-Matos and S. Morais, Life Cycle Assessment and Life Cycle Cost of an Innovative Carbon Paper Sensor for 17α-Ethinylestradiol and Comparison with the Classical Chromatographic Method, Sustainability, 2022, 14(14), 8896, DOI:10.3390/su14148896.
- N. O. Gomes, R. T. Paschoalin, S. Bilatto, A. R. Sorigotti, C. S. Farinas, L. H. C. Mattoso, S. A. S. Machado, O. N. Oliveira and P. A. Raymundo-Pereira, Flexible, Bifunctional Sensing Platform Made with Biodegradable Mats for Detecting Glucose in Urine, ACS Sustain. Chem. Eng., 2023, 11(6), 2209–2218, DOI:10.1021/acssuschemeng.2c05438.
- R. T. Paschoalin, N. O. Gomes, G. F. Almeida, S. Bilatto, C. S. Farinas, S. A. S. Machado, L. H. C. Mattoso, O. N. Oliveira and P. A. Raymundo-Pereira, Wearable Sensors Made with Solution-Blow Spinning Poly(Lactic Acid) for Non-Enzymatic Pesticide Detection in Agriculture and Food Safety, Biosens. Bioelectron., 2022, 199, 113875, DOI:10.1016/j.bios.2021.113875.
- N. O. Gomes, S. C. Teixeira, M. L. Calegaro, S. A. S. Machado, N. de Fátima Ferreira Soares, T. V. de Oliveira and P. A. Raymundo-Pereira, Flexible and Sustainable Printed Sensor Strips for On-Site, Fast Decentralized Self-Testing of Urinary Biomarkers Integrated with a Portable Wireless Analyzer, Chem. Eng. J., 2023, 472, 144775, DOI:10.1016/j.cej.2023.144775.
- S. C. Teixeira, N. O. Gomes, M. L. Calegaro, S. A. S. Machado, T. V. de Oliveira, N. de Fátima Ferreira Soares and P. A. Raymundo-Pereira, Sustainable Plant-Wearable Sensors for on-Site, Rapid Decentralized Detection of Pesticides toward Precision Agriculture and Food Safety, Biomater. Adv., 2023, 155, 213676, DOI:10.1016/j.bioadv.2023.213676.
- F. V. Ferreira, I. F. Pinheiro, R. F. Gouveia, G. P. Thim and L. M. F. Lona, Functionalized Cellulose Nanocrystals as Reinforcement in Biodegradable Polymer Nanocomposites, Polym. Compos., 2018, 39(S1) DOI:10.1002/pc.24583.
- K. M. Shrestha, C. M. Sorensen and K. J. Klabunde, Synthesis of CuO Nanorods, Reduction of CuO into Cu Nanorods, and Diffuse Reflectance Measurements of CuO and Cu Nanomaterials in the Near Infrared Region, J. Phys. Chem. C, 2010, 114(34), 14368–14376, DOI:10.1021/jp103761h.
- E. Mazzotta, A. Caroli, A. Pennetta, G. E. De Benedetto, E. Primiceri, A. G. Monteduro, G. Maruccio and C. Malitesta, Facile Synthesis of 3D Flower-like Pt Nanostructures on Polypyrrole Nanowire Matrix for Enhanced Methanol Oxidation, RSC Adv., 2018, 8(19), 10367–10375, 10.1039/C7RA13269G.
- C.-W. Hsu, W.-C. Feng, F.-C. Su and G.-J. Wang, An Electrochemical Glucose Biosensor with a Silicon Nanowire Array Electrode, J. Electrochem. Soc., 2015, 162(10), B264–B268, DOI:10.1149/2.0821510jes.
- R. Katakojwala, A. Naresh Kumar, D. Chakraborty and S. V. Mohan, Valorization of Sugarcane Waste: Prospects of a Biorefinery, in Industrial and Municipal Sludge, Elsevier, 2019, pp. 47–60, DOI:10.1016/B978-0-12-815907-1.00003-9.
- S. N. Joglekar, A. P. Tandulje, S. A. Mandavgane and B. D. Kulkarni, Environmental Impact Study of Bagasse Valorization Routes, Waste Biomass Valorization, 2019, 10(7), 2067–2078, DOI:10.1007/s12649-018-0198-9.
- M. Asim, N. Saba, M. Jawaid and M. Nasir, Potential of Natural Fiber/Biomass Filler-Reinforced Polymer Composites in Aerospace Applications, in Sustainable Composites for Aerospace Applications, Elsevier, 2018, pp. 253–268, DOI:10.1016/B978-0-08-102131-6.00012-8.
- L. B. Baker, Physiology of Sweat Gland Function: The Roles of Sweating and Sweat Composition in Human Health, Temperature, 2019, 6(3), 211–259, DOI:10.1080/23328940.2019.1632145.
- US Environmental Protection Agency, Ambient Water Quality Value for Protection of Sources of Potable Water, 1998, https://19january2021snapshot.epa.gov/sites/static/files/2015-06/ny_hh_303_w_03121998.pdf, accessed 2024-03-15.
- P. A. Raymundo-Pereira, F. M. Shimizu, D. Coelho, M. H. O. Piazzeta, A. L. Gobbi, S. A. S. Machado and O. N. Oliveira, A Nanostructured Bifunctional Platform for Sensing of Glucose Biomarker in Artificial Saliva: Synergy in Hybrid Pt/Au Surfaces, Biosens. Bioelectron., 2016, 86, 369–376, DOI:10.1016/j.bios.2016.06.053.
- H. Zafar, A. Channa, V. Jeoti and G. M. Stojanović, Comprehensive Review on Wearable Sweat-Glucose Sensors for Continuous Glucose Monitoring, Sensors, 2022, 22(2), 638, DOI:10.3390/s22020638.
- F. Vasiliou, A. K. Plessas, A. Economou, N. Thomaidis, G. S. Papaefstathiou and C. Kokkinos, Graphite Paste Sensor Modified with a Cu(II)-Complex for the Enzyme-Free Simultaneous Voltammetric Determination of Glucose and Uric Acid in Sweat, J. Electroanal. Chem., 2022, 917, 116393, DOI:10.1016/j.jelechem.2022.116393.
- X. Mei, J. Yang, X. Yu, Z. Peng, G. Zhang and Y. Li, Wearable Molecularly Imprinted Electrochemical Sensor with Integrated Nanofiber-Based Microfluidic Chip for in Situ Monitoring of Cortisol in Sweat, Sens. Actuators, B, 2023, 381, 133451, DOI:10.1016/j.snb.2023.133451.
- G. Aragay and A. Merkoçi, Nanomaterials Application in Electrochemical Detection of Heavy Metals, Electrochim. Acta, 2012, 84, 49–61, DOI:10.1016/j.electacta.2012.04.044.
- S. Alam, S. Augustine, T. Narayan, J. H. T. Luong, B. D. Malhotra and S. K. Khare, A Chemosensor Based on Gold Nanoparticles and Dithiothreitol (DTT) for Acrylamide Electroanalysis, Nanomaterials, 2021, 11(10), 2610, DOI:10.3390/nano11102610.
- V. P. Hitaishi, I. Mazurenko, A. Vengasseril Murali, A. de Poulpiquet, G. Coustillier, P. Delaporte and E. Lojou, Nanosecond Laser–Fabricated Monolayer of Gold Nanoparticles on ITO for Bioelectrocatalysis, Front. Chem., 2020, 8 DOI:10.3389/fchem.2020.00431.
- J. T. Steven, V. B. Golovko, B. Johannessen and A. T. Marshall, Electrochemical Stability of Carbon-Supported Gold Nanoparticles in Acidic Electrolyte during Cyclic Voltammetry, Electrochim. Acta, 2016, 187, 593–604, DOI:10.1016/j.electacta.2015.11.096.
- V. S. Raghuwanshi, B. Yu, C. Browne and G. Garnier, Reversible PH Responsive Bovine Serum Albumin Hydrogel Sponge Nanolayer, Front. Bioeng. Biotechnol., 2020, 8 DOI:10.3389/fbioe.2020.00573.
- A. Q. Fenwick, A. J. Welch, X. Li, I. Sullivan, J. S. DuChene, C. Xiang and H. A. Atwater, Probing the Catalytically Active Region in a Nanoporous Gold Gas Diffusion Electrode for Highly Selective Carbon Dioxide Reduction, ACS Energy Lett., 2022, 7(2), 871–879, DOI:10.1021/acsenergylett.1c02267.
- S. Saraf, C. J. Neal, S. Park, S. Das, S. Barkam, H. J. Cho and S. Seal, Electrochemical Study of Nanoporous Gold Revealing Anti-Biofouling Properties, RSC Adv., 2015, 5(58), 46501–46508, 10.1039/C5RA05043J.
- Y. Yoshida and M. Morimitsu, Effects of Temperature on Electrochemical Sensing of HPO42- with Amorphous RuO2-Ta2O5 Catalyst, ECS Meeting Abstracts, 2016, MA2016-02(53), 4008, DOI:10.1149/MA2016-02/53/4008.
- A. M. de Campos, R. R. Silva, M. L. Calegaro and P. A. Raymundo-Pereira, Design and Fabrication of Flexible Copper Sensor Decorated with Bismuth Micro/Nanodentrites to Detect Lead and Cadmium in Noninvasive Samples of Sweat, Chemosensors, 2022, 10(11), 446, DOI:10.3390/chemosensors10110446.
- A. Ahamed, L. Ge, K. Zhao, A. Veksha, J. Bobacka and G. Lisak, Environmental Footprint of Voltammetric Sensors Based on Screen-Printed Electrodes: An Assessment towards “Green” Sensor Manufacturing, Chemosphere, 2021, 278, 130462, DOI:10.1016/j.chemosphere.2021.130462.
- European Platform on LCA, E. ELCD Database Search PubMed.
Footnote |
| † Electronic supplementary information (ESI) available. See DOI: https://doi.org/10.1039/d4su00059e |
| This journal is © The Royal Society of Chemistry 2024 |

