 Open Access Article
Creative Commons Attribution 3.0 Unported Licence
Correction: Flow and clogging of capillary droplets
Yuxuan
Cheng
*a,
Benjamin F.
Lonial
b,
Shivnag
Sista
a,
David J.
Meer
b,
Anisa
Hofert
b,
Eric R.
Weeks
b,
Mark D.
Shattuck
c and
Corey S.
O’Hern
adef
aDepartment of Physics, Yale University, New Haven, Connecticut 06520, USA. E-mail: yuxuan.cheng@yale.edu
bDepartment of Physics, Emory University, Atlanta, GA 30322, USA
cBenjamin Levich Institute and Physics Department, The City College of New York, New York, New York 10031, USA
dDepartment of Mechanical Engineering and Materials Science, Yale University, New Haven, Connecticut 06520, USA
eProgram in Computational Biology and Bioinformatics, Yale University, New Haven, Connecticut 06520, USA
fDepartment of Applied Physics, Yale University, New Haven, Connecticut 06520, USA. E-mail: Corey.ohern@yale.edu
First published on 3rd October 2024
Abstract
Correction for ‘Flow and clogging of capillary droplets’ by Yuxuan Cheng et al., Soft Matter, 2024, https://doi.org/10.1039/D4SM00752B.
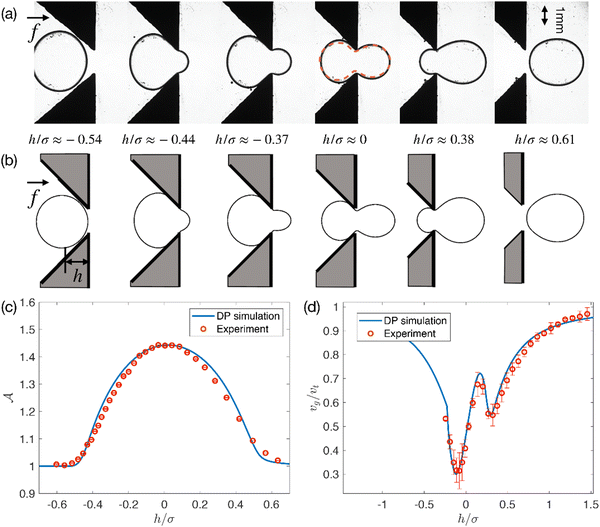
The authors regret that an incorrect version of Fig. 2 was included in the original article. The correct version of Fig. 2 is presented below.
The Royal Society of Chemistry apologises for these errors and any consequent inconvenience to authors and readers.
| This journal is © The Royal Society of Chemistry 2024 |


![[scr A, script letter A]](https://www.rsc.org/images/entities/char_e520.gif) ≈ 0.01. In panel (a), we overlay the shape of the droplet from the DP simulations at
≈ 0.01. In panel (a), we overlay the shape of the droplet from the DP simulations at