
 Open Access Article
 This Open Access Article is licensed under a
 Creative Commons Attribution 3.0 Unported Licence
Dry and lubricated sliding friction for rubber on concrete: the role of surface energies
N.
Miyashita
a and
B. N. J.
Persson
 *bcd
*bcd
aThe Yokohama Rubber Company, 2-1 Oiwake, Hiratsuka, Kanagawa 254-8601, Japan
bPeter Grünberg Institute (PGI-1), Forschungszentrum Jülich, 52425, Jülich, Germany. E-mail: b.persson@fz-juelich.de
cState Key Laboratory of Solid Lubrication, Lanzhou Institute of Chemical Physics, Chinese Academy of Sciences, 730000 Lanzhou, China
dMultiscale Consulting, Wolfshovener str. 2, 52428 Jülich, Germany
First published on 6th September 2024
Abstract
We study the influence of lubricant fluids (water–glycerol mixtures) on rubber sliding friction for two different rubber tread compounds on a concrete surface. We find that for the lubricated contacts the sliding friction below a critical velocity vc is similar to that of the dry contact, but for v > vc the friction drops fast with increasing sliding speed. We discuss the origin of this effect and show that it is not a “normal” mixed lubrication effect but depends on surface (or interfacial) energies.
1 Introduction
Sliding friction involving elastically soft materials like rubber on dry and lubricated counter surfaces has many important applications, e.g., for tires, wiper blades or conveyor belts.1–7 Despite the huge number of practical applications, the role of viscoelasticity in contact mechanics of lubricated solids has not been studied theoretically to the same extent as for dry contact.8 Very interesting pioneering works on viscoelasticity and lubrication have been presented by Hooke and Huang,9 and by Elsharkawy.10 These authors consider the influence of rubber hysteresis on lubricated contacts in the hydrodynamic regime. For steady sliding contacts, they highlight the role of the viscoelasticity retardation process in the generation of a peculiar asymmetric fluid pressure field. Other similar studies have been presented by Wu, Hui, and Jagota,11,12 and by Scaraggi and Persson.13Many experimental model studies of viscoelastic lubrication in soft tribological contacts have been presented,14,15 including studies of the friction for windscreen wiper/glass contacts,16 friction and lubrication of human skin,17 lubricity of hydrogel layers,18 and articular cartilage lubrication.19
Many studies have shown that the friction between rubber and a countersurface in sliding contact cannot always be fully understood based on elastohydrodynamics calculations, but depends on interfacial energies.20–33 Thus a fluid film between two stationary surfaces can be spontaneously removed (dewetting process) if this results in the lowering of free energy. However, for sliding contacts if the speed is high enough, forced wetting can occur where a thin fluid film separates the surfaces. Forced wetting results from a competition between liquid invasion induced by shear and spontaneous (surface energy driven) dewetting. Several experimental studies on forced wetting have been presented, but always for (silicone) rubber spheres sliding on smooth glass surfaces. In this paper, we show that forced wetting may also be important for surfaces with large roughness but in these cases, the high contact pressure in the asperity contact regions may have a large influence on the dewetting process.
In this paper, we study the influence of fluids (and the fluid viscosity) on rubber friction on a concrete surface. We have performed low speed rubber friction measurements on the concrete surfaces in mixtures of water and glycerol with different viscosities. Low speed sliding dynamics on surfaces lubricated with high viscosity fluids is, from a hydrodynamic point of view, equivalent to sliding at high speed on surfaces with low viscosity fluids (such as water), but without fluid inertia and frictional heating effects. We find that for the high viscosity fluids, the sliding friction drops much faster with increasing sliding speed than expected from elastohydrodynamic calculations. We attribute this to forced wetting which is affected by the high contact pressure in the rubber–concrete asperity contact regions.
In the study, we use 2 different styrene–butadiene tread rubber compounds, one with silica filler (compound C) and the other with a carbon black filler (compound D). Both compounds have very low glass transition temperatures Tg ≈ − 50 °C.
2 Viscoelastic modulus
Using a DMA instrument, we have measured the viscoelastic modulus in elongation mode for the strain amplitude 4 × 10⁻⁴ (or 0.04% strain). At this small strain, we probe the linear response properties of rubber. We have performed measurements for different frequencies and different temperatures and shifted the frequency segments for Re![[thin space (1/6-em)]](https://www.rsc.org/images/entities/char_2009.gif) E(ω) to form a smooth mastercurve.34 The same shift factor was used to obtain the mastercurve for ImE(ω). Fig. 1(a) shows the real part ReE of the viscoelastic modulus as a function of frequency (log–log scale) and Fig. 1(b) the ratio ImE/ReE = tanδ. The shift factor aT is shown in Fig. 5. As a test of the accuracy of the construction of the master curves we showed that ReE(ω) and ImE(ω) satisfy the Kramers–Kronig relation, as must be the case for any linear (causal) response function.34
E(ω) to form a smooth mastercurve.34 The same shift factor was used to obtain the mastercurve for ImE(ω). Fig. 1(a) shows the real part ReE of the viscoelastic modulus as a function of frequency (log–log scale) and Fig. 1(b) the ratio ImE/ReE = tanδ. The shift factor aT is shown in Fig. 5. As a test of the accuracy of the construction of the master curves we showed that ReE(ω) and ImE(ω) satisfy the Kramers–Kronig relation, as must be the case for any linear (causal) response function.34
 | ||
Fig. 1 (a) The real part ReE of the viscoelastic modulus for the compounds C and D as a function of the frequency (log–log scale). (b) The ratio ImE/ReE = tanδ for compounds C and D as a function of frequency (log–log scale). For the reference temperature Tref = 20 °C and strain  . . | ||
In numerical simulations of mixed lubrication for viscoelastic solids12,13 enter the (time-dependent) creep-function [usually denoted as C(t)] which describes the relaxation in the strain due to a step-like change in the stress.35 This differs from analytical theories which usually depend on the frequency dependent viscoelastic modulus E(ω). In Fig. 2 we show C(t) for compounds C and D as obtained from E(ω) using the Monte Carlo method as described in ref. 34.
 | ||
| Fig. 2 The creep-function as a function of time (log–log scale) for the rubber compounds C and D. | ||
For sliding (and rolling) friction involving rubber compounds with filler it is important to take into account the non-linear viscoelastic properties of the rubber.35–38 We have studied the large strain dependency of the effective Young's modulus Eeff. The measurements were performed at frequency f = 1 Hz for several different temperatures. As in earlier studies, the effective modulus for the strain expected in the asperity contact regions (say  ) is strongly reduced from the small-strain value shown in Fig. 1 by factors of ∼0.3 and 0.6 for the real and the imaginary part of Eeff. In the rubber friction calculations we take into account this strain-softening effect like in earlier studies by scaling the small-strain master curve in Fig. 1.
In Table 1 we give a summary of the glass transition temperatures of the compounds C and D. We define the glass transition temperature as the maximum of tanδ as a function of temperature for frequency ω0 = 0.01 s−1.
δ as a function of temperature for the frequency ω0 = 0.01 s−1
| Compound | T g (°C) | Maximum of tanδ |
|---|---|---|
| C (20% silica) | −48.6 | 0.74 |
| D (23% carbon) | −49.8 | 0.69 |
3 Surface roughness power spectrum
The most important quantity of a rough surface is the surface roughness power spectrum. The two-dimensional (2D) surface roughness power spectrum C2D(q), which enters the Persson contact mechanics theory, can be obtained from the height profile z = h(x,y) measured over a square surface unit.39–44 However, for surfaces with roughness having isotropic statistical properties, the 2D power spectrum can be calculated from the 1D power spectrum obtained from a line-scan z = h(x).We have measured the 2D surface roughness power spectrum of the concrete surface used in the present study. The red line in Fig. 3 shows the measured curve and the blue line shows the linearly extrapolated power spectrum. The linear extrapolated region corresponds to the Hurst exponent H ≈ 1. The height probability distribution Ph (not shown) is approximately Gaussian as expected for a randomly rough surface.
 | ||
| Fig. 3 The measured 2D surface roughness power spectrum of the concrete surface (red line) and the linearly extrapolated power spectrum (blue line). The linear extrapolated region corresponds to the Hurst exponent H ≈ 1. | ||
4 Low temperature friction tester
In order to measure the friction coefficient at different temperatures we use an experimental set-up where the temperature can be changed from room temperature down to −40 °C; see Fig. 4. A rectangular rubber block of length 3 cm in the sliding direction and 7 cm in the other direction is glued into the milling grove of the sample holder which gets attached to the force cell (red box in the figure). The rubber specimen can move with the carriage in the vertical direction to adapt to the substrate profile. The normal load can be changed by adding additional steel weights on top of the force cell. The substrate sample gets attached to the machine table which is moved by a servo drive via a gearbox in a translational manner. Here, we control the relative velocity between the rubber specimen and the substrate sample while the force cell acquires information about normal force as well as friction force. The normal force (load) is FN ≈ 250 N giving the nominal contact pressure p ≈ 0.12 MPa. To change the temperature the whole set-up is placed inside a deep freezer capable of cooling down the experiment to −40 °C. Then we slide the rubber sample over the road surface with different velocities to gain information about the velocity dependency of the friction coefficient. | ||
| Fig. 4 Schematic picture of the low-temperature friction instrument allowing for linear reciprocal motion. | ||
5 Sliding friction on dry and lubricated concrete
We have performed friction studies using the (low-temperature) linear friction tester. As substrate we used the same concrete block (with the power spectrum shown in Fig. 3), both in the dry state and lubricated by water–glycerol mixtures. For all the compounds we have measured the friction for velocities between 1 μm s−1 and 1 cm s−1 and for several temperatures between −40 °C and 20 °C. From the measured data in the dry state we have constructed friction master curves by shifting the velocity segments along the velocity axis to obtain smooth mastercurves.The solid lines in Fig. 6 and 7 show the sliding friction master curves for compounds C and D, sliding on the dry concrete surface, obtained by shifting the velocity segments obtained for the indicated temperatures. The green squares in Fig. 5 shows the shift factor  used and the solid lines are the corresponding bulk viscoelastic shift factor aT. Note that the a shift factor
  , is nearly the same as the bulk viscoelastic shift factor aT. This shifting is possible (or meaningful) only if the sliding speeds are so low that frictional heating can be neglected. This is a reasonable approximation in the present case but some influence of frictional heating might occur for sliding speeds v > 1 mm s−1.
 | ||
Fig. 5 The red and blue solid lines are the bulk viscoelastic shift factors obtained when constructing the master curves in Fig. 1. Green squares: The shift factor  used when constructing the friction master curves shown in Fig. 6 and 7. used when constructing the friction master curves shown in Fig. 6 and 7. | ||
Fig. 6 shows the friction mastercurve for compound C (on dry concrete) together with the measured friction coefficient (at room temperature) on the concrete surface lubricated by glycerol–water mixtures. In the hydrodynamic lubrication regime one expects the friction curves to shift to lower sliding speeds as the fluid viscosity increases.45–47 In the present case this would correspond to a shift of the glycerol lubricated surface, compared to the water lubricated surface, by a factor given by the ratio between the viscosity of glycerol and of water. In the present case we are not in the hydrodynamic region and for low sliding speed the friction for all the lubricated surfaces is nearly the same as for the dry concrete surface, indicating that in all cases the fluid is expelled from the rubber–concrete contact region giving dry sliding friction. However, for sliding speeds above ∼0.1 mm s−1 the friction is lower in the fluids than in the dry state, and for the glycerol lubricated surfaces the friction drops rapidly with increasing sliding speed. This is expected in the mixed lubrication case where hydrodynamic effects start to be important and increase the surface separation. However, the calculations presented below and in Appendix A indicate a different explanation for the drop in friction.
 | ||
Fig. 6 The sliding friction master curve for compound C, sliding on a dry concrete surface, obtained by shifting (with the shift factor  given in Fig. 5) the velocity segments obtained for the indicated temperatures. Also shown are the friction coefficients at room temperature for the concrete surface lubricated by glycerol–water mixtures. given in Fig. 5) the velocity segments obtained for the indicated temperatures. Also shown are the friction coefficients at room temperature for the concrete surface lubricated by glycerol–water mixtures. | ||
While the friction coefficient for the surfaces lubricated by glycerol decreases for sliding speeds v > 0.1 mm s−1, for water no such decrease in the friction coefficient occur in the studied velocity range. If the drop in the friction for the glycerol lubricated surfaces would be a hydrodynamic effect, for water one would expect a decrease in the friction for sliding speeds v > 0.1 m s−1 but with the present experimental set-up we cannot study such high sliding speeds.
Fig. 7 shows similar results as in Fig. 6 but for compound D. Qualitatively, the results are very similar for compounds C and D on both the dry and lubricated concrete surfaces.
 | ||
Fig. 7 The sliding friction master curve for compound D, sliding on a dry concrete surface, obtained by shifting (with the shift factor  given in Fig. 5) the velocity segments obtained at the indicated temperatures. Also shown are the friction coefficients at room temperature for the concrete surface lubricated by glycerol–water mixtures. given in Fig. 5) the velocity segments obtained at the indicated temperatures. Also shown are the friction coefficients at room temperature for the concrete surface lubricated by glycerol–water mixtures. | ||
6 Theory and discussion
The rubber compounds C and D give similar friction on both the dry and the lubricated concrete surfaces and here we focus mainly on compound C. Fig. 8 shows the calculated viscoelastic contribution to the friction coefficient (red curve) and the measured (smoothed data) friction for compound C on the dry concrete surface (from Fig. 6). In the calculations we have used the the Persson rubber friction theory48–51 with surface roughness power spectrum shown in Fig. 3. Rubber friction depends strongly on the temperature but the experiments was performed at low sliding speeds where frictional heating is not important; consequently the calculated result in Fig. 8 is without the flash temperature.49 | ||
| Fig. 8 The measured total friction coefficient (green line) and the calculated viscoelastic contribution to the sliding friction for compound C sliding on a dry concrete surface. In the calculation we have used the surface roughness power spectrum shown in Fig. 3. | ||
Fig. 8 shows that for large sliding speed the viscoelastic contribution to the friction dominates, but for a low sliding speed the two curves differ a lot which we attribute to the (adhesive) contribution from the area of real contact, which is not included in the theory curve. This is in accordance with our earlier studies which showed that the adhesive contribution dominates in the low velocity part of the friction master curve.52–55
Fig. 9 shows the the calculated (normalized) area of real contact A/A0 (where A0 is the nominal contact area) for compounds C and D sliding on a dry concrete surface. In the velocity interval we studied, 1 μm s−1–1 cm s−1, the contact area for compound C drops from A/A0 ≈ 0.012 to ≈ 0.004. This is the result expected for elastic contact if the elastic modulus would increase from E ≈ 14 MPa to ≈ 42 MPa in the same velocity interval.
 | ||
| Fig. 9 The calculated area of real contact as a function of the sliding speed for compounds C and D sliding on a dry concrete surface. In the calculation we have used the surface roughness power spectrum shown in Fig. 3. | ||
We write the total friction force as
| Ff = Fvisc + τA |
 | (1) |
Since μ is known from the experiments and μvisc and A/A0 from theory, from (1) we can derive the frictional shear stress τ which turns out to be a Gaussian-like function of lnv as also found in earlier studies.52–55 This is the expected form of the adhesive shear stress if it would originate from bonding–stretching–debonding processes [see Fig. 10(a)–(c)] (see ref. 56).
 | ||
| Fig. 10 (a)–(c) Illustrates the bonding–stretching–debonding origin of the frictional shear stress in the area of contact. When the bonds break in the stretched state (b) the elastic energy in the stretched chain get dissipated into heat. (d) Illustrate dewetting for a soft solid (rubber) initially separated from the substrate by a thin fluid film. During dewetting the fluid accumulates in a rim at the front of the expanding dry surface area. | ||
There are several several ways adhesion can affect the sliding friction force.
(a) The adhesion increases the area of real contact57 which will enhance both the viscoelastic contribution to the friction and the area of real contact contribution.
(b) Opening (and closing) cracks occur at the edges of the area of real contact, which result in viscoelastic energy dissipation and contribute to the friction force.58–67 However, some experimental studies indicate that this may not be an important contribution to the friction force.54
We note that there is an adhesive contribution to the friction from the area of real contact e.g., from the process illustrated in Fig. 10(a)–(c), even if there is a negligible adhesion induced increase in the contact area and a negligible crack-opening contribution. Indeed, there are experimental observations that indicates that the adhesive contributions (a) and (b) in many cases may be unimportant for rubber friction on very rough surfaces.54 Thus, in an earlier study we found nearly the same friction force in the dry state as in water while the pull-off force (determined by adhesion) for smooth surfaces of the same materials vanished in water while it was strong in the dry state. In the present study we observe a similar effect for v < 0.1 mm s−1 where the friction force is nearly the same in the fluids as in the dry state.
Next consider the sliding friction in the water–glycerol mixtures. For low sliding speeds, v < 0.1 mm s−1, the friction in the fluids is very similar to in the dry state. This indicate that for low sliding speeds the fluids are expelled from the contact regions between the rubber and the concrete surface. We note that both water and glycerol are likely to wet the rubber–concrete interface because the fluid contact angle on the hydrophilic concrete is rather small, at least for clean surfaces. Nevertheless, if the squeezing pressure is high enough almost all the fluid will get squeezed out from the contact regions. In this case, in the area of real contact the rubber molecules can perform bonding–stretching–debonding cycles just like in the dry condition, resulting in the same or similar friction as on the dry concrete surface.
For sliding speeds, 0.1 mm s−1 < v < 10 mm s−1 the friction in the fluids is smaller than in the dry state. In water it becomes nearly velocity independent while in the water–glycerol mixtures it drops with increasing sliding speed. Note that the higher the fluid viscosity the faster the drop in the friction coefficients. However, a very thin fluid film is enough to explain the drop in the friction coefficient. Thus if the fluid film would be ∼3 nm thick then for pure glycerol (η ≈ 1.4 Pas without considering shear thinning) at the sliding speed v = 1 cm s−1 we expect the shear stress τf ≈ ηv/d ≈ 5 MPa giving the friction coefficient τfA/p0A0 ≈ 0.2 which would be consistent with what is observed. There are two effects that could explain the transition from dry contact to lubricated contact with increasing sliding speed:
(a) Mixed lubrication: hydrodynamic effect where the average separation between the surfaces at the interface increases with increasing sliding speed due to the build up of fluid pressure carrying part of the normal load. In this case the dry contact area decreases with increasing sliding speed.
(b) Sliding induced (forced) wetting as discussed below. This depends on the interfacial energies for the (dry) rubber–concrete, rubber–fluid and concrete–fluid interfaces.
In Appendix A, we have used the theory of ref. 45 to estimate the load acting on the area of contact and found it to be nearly the full (external) load for v < 1 cm s−1. This implies that the area of contact is nearly unchanged for v < 1 cm s−1. What we denote as the contact area here is the contact area observed at the highest magnification. Continuum mechanics theories cannot predict if the area of contact is dry or contains a molecular thin fluid film. The reason is that in continuum mechanics there will always be a fluid film between the surfaces independent of the sliding speed, but if the fluid film gets thinner than a few atomic distances the continuum description will fail. If a thin fluid film prevails in the contact regions depends on surface (or interfacial) energies which are not included in the standard fluid dynamics approach based on the Reynolds thin-film fluid flow equation. We now discuss the role of interfacial energies for the wetting of the area of contact.
We first review the standard picture of interfacial dewetting for smooth surfaces.25,27,29,68,69 Interfacial dewetting in water is observed for surfaces of hydrophobic solids. A fluid film between two solids with flat surfaces is unstable and will be removed by dewetting if this results in a reduction in the free energy. If the interfacial energies (per unit surface area) between the solids and the fluid are denoted by γ01 (fluid 0, solid 1) and γ02 (fluid 0, solid 2) and the interfacial energy for the dry solid–solid contact with γ12, then the condition for dewetting is that the interfacial (1D or line) spreading pressure
| S = γ12 − γ01 − γ02 | (2) |
| γ1 = γ01 + γ0cosθ1, γ2 = γ02 + γ0cosθ2 |
| S = γ12 − γ1 − γ2 + γ0(cosθ1 + cosθ2) | (3) |
The term
| w = γ1 + γ2 − γ12 |
| S = −w + γ0(cosθ1 + cosθ2) | (4) |
If θ1 and θ2 are larger than 90° then S will be negative independent of the work of adhesion (which is always positive for neutral solids).
There are several ways to estimate S for smooth surfaces. The work of adhesion w can be measured using the JKR method (sphere against flat) but for real rubber materials large contact hysteresis often occurs making it hard to obtain the thermal equilibrium value for w. The surface energies γ1 and γ2 can be estimated using fluid contact angle measurements and γ12 can be estimated from γ1 and γ2 using different proposed equations. However, these methods will not work for surfaces as rough as our concrete surface and it is not clear how to produce a very smooth concrete surface.
If S is positive, in the absence of external (squeezing) force a thin fluid film will separate the surfaces of the solids. This is the case even with an applied squeezing pressure p0 if it is not too high. However, if S is small or the squeezing pressure is high enough the fluid film may be removed by what we denote as forced interfacial dewetting. In this case the work per unit surface area by the applied force to remove the fluid equals S. To squeeze-out the fluid completely we must have Seff = S − pd* < 0 where d* is an atomic length of order the thickness of a monolayer of adsorbed fluid molecules and p the pressure in an asperity contact region. Thus if p* denotes the (minimum) pressure needed to squeeze-out the fluid film then p*d* = S, where d* ≈ 1 nm. The surface tension of water (and of glycerol) is ≈ 0.07 J m−2 so if S is positive we expect it to be at most a few times 0.01 J m−2. Using S = 0.01 J m−2 and d* = 1 nm gives p* = 10 MPa which is also the typical pressure in the rubber–concrete area of real contact, e.g. using A/A0 = 0.01 (see Fig. 9) and p0 = 0.12 MPa gives p = 12 MPa.
In the past we have studied cases where no adhesion occurred between a glass ball and a flat smooth rubber surface in water while strong adhesion occurred in the dry state. In this case S must have been larger than zero and a thin water film separated the surfaces in water (note: the contact pressure in these experiments was very low). However, in sliding friction experiments (at low sliding speed) with the same rubber compound against a sandblasted glass surface nearly the same friction was observed in the dry state as in water.54 We attribute this to forced dewetting where the large stress in the asperity contact regions resulted in p > p* so the contact regions was dry even if the fluid wet the interface in the absence of a squeezing pressure.
For a system with S < 0 there is an energetic driving force to expel the fluid from the contact region between two solids. In this case during sliding a higher sliding speed is needed for fluid to enter the contact region than for the case of a system where S = 0 (or S > 0). For S > 0 a thin fluid film at the interface is energetically favorable, but if the local pressure p > p* the contact regions will be dry for low sliding speed.
For smooth surfaces the way a confined fluid film is removed depends on the elastic properties of the confining walls.69 For soft materials for S < 0 dewetting occurs by the spreading of a dry area with the fluid piling up in a rim surrounding the dry area of real contact [see Fig. 10(d)]. In this case the squeeze-out time is proportional to the fluid viscosity assuming most of the dissipation of energy occur in the fluid film and not in the confining solids. Here we are interested in a sliding contact and for this case it has been shown that at a low sliding speed the fluid is expelled and the contact is dry, but above some critical velocity vc becomes partly wet and at high enough speed completely wet. The forced wetting transition results from a competition between liquid invasion induced by shear and spontaneous (surface energy driven) dewetting.
In a fundamental paper Martin et al.29 have studied sliding induced (forced) wetting of a contact which is initially dry. For a smooth spherical lens (radius R) sliding on a smooth rubber substrate surface the critical velocity vc is found to scale with the parameter

7 Summary and conclusion
We have measured the friction coefficient for two rubber tread compounds sliding on dry and lubricated concrete surfaces. On the dry surface, the friction force was measured for temperatures between −40 and 20 °C and smooth friction mastercurves could be constructed using the bulk viscoelastic shift factors. We have studied the influence of water–glycerol mixtures on rubber sliding friction and found that for a low sliding speed, the friction in the fluids is similar to that in the dry state but for v > 0.1 mm s−1 it drops rapidly in the high viscosity water–glycerol mixtures. We propose that this is due to forced wetting, which results in a thin fluid film at the interface at a high enough sliding speed. Forced wetting results from a competition between liquid invasion induced by shear and spontaneous (surface energy driven) or forced dewetting, but a theory for forced wetting for solids with random roughness still remains to be developed. In addition, for the system we have studied, the spreading pressure S may be larger than zero and the reason the fluid may still be expelled from the contact regions for a low sliding speed may be due to the high contact pressure making Seff = S − pd* < 0.Data availability
The authors confirm that the data supporting the findings of this study are available within the article.Conflicts of interest
There are no conflicts of declare.Appendix
Appendix A
The rubber blocks used in our studies have nominally flat bottom surfaces (but with the edges rounded off). For a block with a flat surface sliding on a flat lubricated substrate surface (no roughness) there can be no hydrodynamic lift-off. In reality there will always be a small tilting of the rubber block surface relative to the substrate surface which would result in a hydrodynamic lift-off when sliding in one direction and a suction (pulling-together) effect when sliding in the opposite direction. In the present experiment we do not observe a big difference in the friction depending on the sliding direction so this tilting-effect is not very important.We have performed a lubricated sliding friction calculation assuming the bottom surface of the rubber block has a small curvature (radius of curvature 0.6 m) giving a Hertz contact pressure with the same width in the sliding direction as the rubber block (w = 2.8 cm) and the same average nominal contact pressure (p = 0.12 MPa). In Fig. 11, the blue and green (below the blue) lines show the normal force acting on the area of contact as a function of the sliding speed, calculated using the theory presented in ref. 45 (for other theories of mixed lubrication, see ref. 11 and 70). The green line is the prediction for glycerol (viscosity η = 1.4 Pas) assuming no shear thinning and the blue line including shear thinning using measured (high shear-rate) viscosity data for glycerol. In the calculation, we have used the surface roughness power spectrum shown in Fig. 3 and the rubber Young's modulus E = 10 MPa and Poisson ratio ν = 0.5. Fig. 11 shows that there is negligible change in the load acting on the area of real contact for v < 1 cm s−1.
 | ||
| Fig. 11 The normal force acting on the area of contact as a function of the sliding speed is calculated using the theory presented in ref. 45. The blue and green lines are obtained assuming that the rubber block has a slightly curved surface (radius of curvature 0.6 m) giving a Hertz contact pressure with the same width in the sliding direction as the rubber blocks (w = 2.8 cm) and the same average nominal contact pressure (p = 0.12 MPa). The green line is the prediction for glycerol (viscosity η = 1.41 Pas) assuming no shear thinning and the blue line including shear thinning.71 The red line is a model involving the lubricated contact between the road macroasperities (with surface roughness) and the rubber block (see the text for details). In the calculation we have used the surface roughness power spectrum shown in Fig. 3 and the rubber Young's modulus E = 10 MPa and Poisson ratio ν = 0.5. | ||
Even if the rubber block surface is perfectly flat and parallel to the concrete surface there will be a hydrodynamic lift-off from the interaction between the road macroasperities and the rubber block (see Fig. 12). That is, each such contact is similar to the sliding of a rigid sphere, with the radius of curvature given by the radius of curvature of the macroasperity, on the lubricated rubber surface. To model this situation we need to determine the number N of macroasperity contact regions and the effective radius R of curvature of the macroasperities. This is done as follows: We first estimate the size of the macroasperity contact regions by studying the distance dependency of the stress–stress correlation function G(r) = 〈σ(x)σ(x′)〉 − 〈σ(x)〉2 as obtained from the Persson contact mechanics theory.72 For surfaces with isotropic roughness G(r) is only a function of the distance r = |x − x′|. Note that for large |x − x′|, σ(x) and δ(x′) are uncorrelated so that G(r) → 0 as r → ∞. We use the criteria G(r0) = αG(0) with α = 0.25 to define the effective radius r0 of a macroasperity contact region.73–75 When calculating G(r) we only include the long wavelength part of the surface roughness (we use the long wavelength region determined by the magnification where the contact area percolate). The number α = 0.25 was deduced by comparing the size of the macroasperity contact regions as obtained by G(r0) = 0.25 G(0) with the average size from exact numerical results (obtained using molecular dynamics for the contact between two solids with random roughness76). We note that since G(r) typically decays with a power-law with increasing r there is no characteristic length scale involved in the stress–stress correlation which could be used to define the size of the average contact regions. Still, the definition we use gives a useful estimation of the (average) contact patch size (for an alternative definition, see Müser and Wang74).
 | ||
| Fig. 12 Even for a nominally flat interface there will be a hydrodynamic effect (lift-off) from the sliding motion against the substrate (concrete) macro asperities. At high sliding speed a thin fluid film will separate the surfaces and the area of real contact will vanish. | ||
From the radius r0 of the contact regions we calculate the number of contacts using N = A/πr02 where A is the contact area obtained using the Persson contact mechanics theory. At the percolation threshold A ≈ 0.42 Ao, which we use here. The radius of curvature of the macroasperities was obtained from the surface roughness power spectrum including only the same long wavelength roughness components as used to determine G(r). Using this procedure we get the width of the macroasperity contact regions 2r0 ≈ 3.6 mm, the radius of curvature R ≈ 26 mm and N ≈ 80. Note that R > r0 which is necessary for this picture to be valid. Each macroasperity contact region carries the normal force ≈3.2 N. The red line in Fig. 11 shows the normal force exerted on the area of real contact using this model. Fig. 11 shows that both models of mixed lubrication studied above gives a reduction in the load acting on the area of real contact only for sliding speeds higher than those used in the experiments. Hence process (b) cannot explain the drop in the friction observed for v > 0.1 mm s−1 for the surfaces lubricated by glycerol.
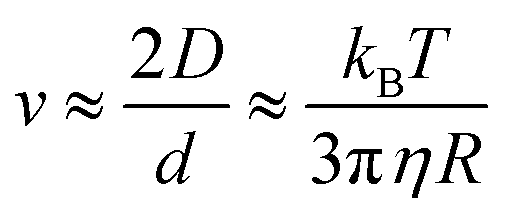
There is another way in which an increase in the viscosity could reduce the sliding friction force. The frictional shear stress within the area of contact between rubber and another solids is usually considered as resulting from bonding–stretching–debonding processes as described first by Schallamach77 and by Cherniak and Leonov78 and more accurately by Persson and Volokitin.56 If there is a thin fluid film at the interface polymer chain segments could still attach to the substrate and undergoes bonding–stretching–debonding processes. However, if the polymer segments are surrounded by a high viscosity fluid they may move slower and need more time to find a good binding position on the substrate. This effect can be illustrated using the theory of Brownian motion. The diffusivity of a spherical particle (radius R) in a fluid with the viscosity η is given by the Einstein equation

The diffusion distance x(t) for 1D motion is
| 〈x2(t)〉 = 2Dt |
During sliding at the speed v a molecular segment (bead unit) has a time of order τ = d/v to find a good binding position where d is an atomic or molecular distance. During this time the bed can probe binding positions in a surface area of order ∼2Dτ which must be of order d2 in order to find a good binding site. Thus if the sliding speed is above
Acknowledgements
The authors thank M. H. Müser for discussions about how to define the size of asperity contact regions. This work is supported by the Strategic Priority Research Program of the Chinese Academy of Sciences, Grant No. XDB0470200.References
- M. Selig, B. Lorenz, D. Heinrichmöller, K. Schmidt, A. Ball and B. N. J. Persson, Rubber Friction and Tire Dynamics: A Comparison of Theory with Experimental Data, Tire Science and Technology, 2014, vol. 42, p. 216 Search PubMed.
- B. N. J. Persson, Conveyor belt drive physics, Tribol. Lett., 2020, 68, 1 CrossRef.
- A. Tiwari, N. Miyashita and B. N. J. Persson, Rolling friction of elastomers: role of strain softening, Soft Matter, 2019, 15, 9233 RSC.
- G. Bodai and T. J. Goda, Sliding friction of wiper blade: Measurement, FE modeling and mixed friction simulation, Tribol. Int., 2014, 70, 63 CrossRef.
- A. Koenen and A. Sanon, Tribological and vibroacoustic behavior of a contact between rubber and glass (application to wiper blade), Tribol. Int., 2007, 40, 1484 CrossRef CAS.
- F. Kaiser, D. Savio and R. Bactavatchalou, Modelling of Static and Dynamic Elastomer Friction in Dry Conditions, Lubricants, 2024, 12, 250 CrossRef.
- H. Dong, N. Moyle, H. Wu, C. Y. Khripin, C.-Y. Hui and A. Jagota, The transition from Elasto-Hydrodynamic to Mixed Regimes in Lubricated Friction of Soft Solid Surfaces, Adv. Mater., 2023, 35, 2211044 CrossRef CAS PubMed.
- D. Wang, G. de Boer, A. Neville and A. Ghanbarzadeh, A Review on Modelling of Viscoelastic Contact Problems, Lubricants, 2022, 10, 358 CrossRef.
- C. J. Hooke and P. Huang, Elastohydrodynamic lubrication of soft viscoelastic materials in line contact, Proc. Inst. Mech. Eng., Part J, 1997, 211, 185 CrossRef.
- A. A. Elsharkawy, Visco-elastohydrodynamic lubrication of line contacts, Wear, 1996, 199, 45 CrossRef CAS.
- H. Wu, C.-Y. Hui and A. Jagota, Solving transient problems in soft Elasto-Hydrodynamic lubrication, J. Mech. Phys. Solids, 2023, 170, 105104 CrossRef.
- H. Wu, A. Jagota and C.-Y. Hui, Lubricated Sliding of a Rigid Cylinder on a Viscoelastic Half Space, Tribol. Lett., 2022, 70, 1 CrossRef.
- M. Scaraggi and B. N. J. Persson, Theory of viscoelastic lubrication, Tribol. Int., 2014, 72, 118 CrossRef.
- N. Selway, V. Chan and J. R. Stokes, Influence of fluid viscosity and wetting on multiscale viscoelastic lubrication in soft tribological contacts, Soft Matter, 2017, 13, 1715 RSC.
- B. Cartwright, Y. Xu and J. R. Stokes, Substrate and fluid film mechanics in rolling-sliding soft contact tribology, Tribol. Int., 2024, 192, 109271 CrossRef.
- G. Bodai and T. J. Goda, Friction force measurement at windscreen wiper/glass contact, Tribol. Lett., 2012, 45, 515 CrossRef.
- M. J. Adams, B. J. Briscoe and S. A. Johnson, Friction and lubrication of human skin, Tribol. Lett., 2007, 26, 239 CrossRef CAS.
- A. C. Dunn, J. M. Uruena, Y. Huo, S. S. Perry, T. E. Angelini and W. G. Sawyer, Lubricity of surface hydrogel layers, Tribol. Lett., 2013, 49, 371 CrossRef CAS.
- G. A. Ateshian, The role of interstitial fluid pressurization in articular cartilage lubrication, J. Biomech., 2009, 42, 1163–1176 CrossRef PubMed.
- S. Kawasaki, T. Tada and B. N. J. Persson, Adhesion and friction between glass and rubber in the dry state and in water: role of contact hydrophobicity, Soft Matter, 2018, 14, 5428 RSC.
- T. Nishi, T. Yamaguchi, K. Shibata and K. Hokkirigawa, Influence of unforced dewetting and enforced wetting on real contact formation and friction behavior between rubber hemisphere and glass plate during contacting and sliding processes, Tribol. Int., 2020, 141, 105921 CrossRef CAS.
- T. Nishi, K. Moriyasu, K. Harano and T. Nishiwaki, Influence of dewettability on rubber friction properties with different surface roughness under water/ethanol/glycerol lubricated conditions, Tribol Online, 2016, 11, 601 CrossRef.
- A. D. Roberts, Squeeze films between rubber and glass, J. Phys. D: Appl. Phys., 1971, 4, 423 CrossRef.
- A. D. Roberts and D. Tabor, The extrusion of liquids between highly elastic solids, Proc. R. Soc. London, Ser. A, 1971, 325, 323 CAS.
- F. Brochard-Wyart and P. G. De Gennes, Dewetting of a water film between a solid and a rubber, J. Phys.: Condens. Matter, 1994, 6, A9 CrossRef CAS.
- P. Martin, P. Silberzan and F. Brochard-Wyart, Sessile droplets at a solid/elastomer interface, Langmuir, 1977, 13, 4910 CrossRef.
- P. Martin and F. Brochard-Wyart, Dewetting at soft interfaces, Phys. Rev. Lett., 1998, 80, 3296 CrossRef CAS.
- A. Martin, A. Buguin and F. Brochard-Wyart, Dewetting nucleation centers at soft interfaces, Langmuir, 2001, 17, 6553 CrossRef CAS.
- A. Martin, J. Clain, A. Buguin and F. Brochard-Wyart, Wetting transitions at soft, sliding interfaces, Phys. Rev. E: Stat., Nonlinear, Soft Matter Phys., 2002, 65, 031605 CrossRef CAS PubMed.
- A. Martin, A. Buguin and F. Brochard-Wyart, Cerenkov dewetting at soft interfaces, Europhys. Lett., 2002, 57, 604 CrossRef CAS.
- T. Nishi, K. Moriyasu, K. Harano and T. Nishiwaki, Influence of surface free energy on rubber friction properties under water/ethanol lubrilated conditions, J. Jpn. Soc. Tribol., 2014, 59, 717 Search PubMed.
- T. Nishi, Influence of lubricant properties and contacting velocity on real contact formation between rubber and glass in a contact process, Tribol. Int., 2018, 127, 240 CrossRef.
- T. Nishi, Influence of curvature radius, elastic modulus, and contact velocity on real contact formation between rubber hemisphere and glass plate during contact process under a water-lubricated condition, Tribol. Int., 2018, 130, 284 CrossRef.
- B. Lorenz, W. Pyckhout-Hintzen and B. N. J. Persson, Master curve of viscoelastic solid: Using causality to determine the optimal shifting procedure, and to test the accuracy of measured data, Polymer, 2014, 55, 565 CrossRef CAS.
- See, e.g., and references therein: T. V. Tolpekina, W. Pyckhout-Hintzen and B. N. J. Persson, Linear and Nonlinear Viscoelastic Modulus of Rubber, Lubricants, 2019, 7, 22 CrossRef.
- G. Heinrich and M. Klüppel, Recent Advances in the Theory of Filler Networking in Elastomers, Advances in Polymer Science, 2002, vol. 160 Search PubMed.
- Modeling of Non-Linear Viscoelastic Behavior of Filled Rubbers, in Advances in Polymer Science, ed. D. Ponnamma and S. Thomas, 2014, vol. 264 Search PubMed.
- G. Heinrich and M. Klüppel, Recent Advances in the Theory of Filler Networking in Elastomers, in Advances in Polymer Science, ed. K.-S. Lee, Springer-Verlag Berlin Heidelberg, 2002, vol. 160, pp. 1–44 Search PubMed.
- B. N. J. Persson, On the fractal dimension of rough surfaces, Tribol. Lett., 2014, 54, 99 CrossRef.
- P. R. Nayak, Random process model of rough surfaces, J. Lubr. Technol., 1971, 93, 398 CrossRef.
- T. D. B. Jacobs and L. Pastewka, Surface topography as a material parameter, MRS Bull., 2022, 47, 1205 CrossRef PubMed.
- T. D. B. Jacobs, T. Junge and L. Pastewka, Quantitative characterization of surface topography using spectral analysis, Surf. Topogr.: Metrol. Prop., 2017, 5, 013001 CrossRef.
- B. N. J. Persson, Contact mechanics for randomly rough surfaces, Surf. Sci. Rep., 2006, 61, 201 CrossRef CAS.
- B. N. J. Persson, O. Albohr, U. Tartaglino, A. I. Volokitin and E. Tosatti, On the nature of surface roughness with application to contact mechanics, sealing, rubber friction and adhesion, J. Phys.: Condens. Matter, 2005, 17, R1 CrossRef CAS PubMed.
- B. N. J. Persson and M. Scaraggi, Lubricated sliding dynamics: Flow factors and Stribeck curve, Eur. Phys. J. E: Soft Matter Biol. Phys., 2011, 34, 113 CrossRef CAS PubMed.
- B. N. J. Persson and M. Scaraggi, On the transition from boundary lubrication to hydrodynamic lubrication in soft contacts, J. Phys.: Condens. Matter, 2009, 21, 185002 CrossRef CAS PubMed.
- J. de Vicente, J. R. Stokes and H. A. Spikes, The Frictional Properties of Newtonian Fluids in Rolling–Sliding soft-EHL Contact, Tribol. Lett., 2005, 20, 273 CrossRef.
- B. N. J. Persson, Theory of rubber friction and contact mechanics, J. Chem. Phys., 2001, 115, 3840 CrossRef CAS.
- B. N. J. Persson, Rubber friction: role of the flash temperature, J. Phys.: Condens. Matter, 2006, 18, 7789 CrossRef CAS PubMed.
- M. Scaraggi and B. N. J. Persson, Friction and universal contact area law for randomly rough viscoelastic contacts, J. Phys.: Condens. Matter, 2015, 27, 105102 CrossRef CAS PubMed.
- G. Carbone, B. Lorenz, B. N. J. Persson and A. Wohlers, Contact mechanics and rubber friction for randomly rough surfaces with anisotropic statistical properties, Eur. Phys. J. E: Soft Matter Biol. Phys., 2009, 29, 275 CrossRef CAS PubMed.
- A. Tiwari, N. Miyashita, N. Espallargas and B. N. J. Persson, Rubber friction: The contribution from the area of real contact, The, J. Chem. Phys., 2018, 148, 224701 CrossRef CAS PubMed.
- B. Lorenz, B. A. Krick, N. Mulakaluri, M. Smolyakova, S. Dieluweit, W. G. Sawyer and B. N. J. Persson, Adhesion: role of bulk viscoelasticity and surface roughness, J. Phys.: Condens. Matter, 2013, 25, 225004 CrossRef CAS PubMed.
- A. Tiwari, L. Dorogin, M. Tahir, K. W. Stöckelhuber, G. Heinrich, N. Espallargas and B. N. J. Persson, Rubber contact mechanics: adhesion, friction and leakage of seals, Soft Matter, 2017, 13, 9103 RSC.
- B. Lorenz, Y. R. Oh, S. K. Nam, S. H. Jeon and B. N. J. Persson, Rubber friction on road surfaces: Experiment and theory for low sliding speeds, The, J. Chem. Phys., 2015, 142, 194701 CrossRef CAS PubMed.
- B. N. J. Persson and A. I. Volokitin, Rubber friction on smooth surfaces, Eur. Phys. J. E: Soft Matter Biol. Phys., 2006, 21, 69 CrossRef CAS PubMed.
- J. Plagge and R. Hentschke, Numerical solution of the adhesive rubber-solid contact problem and friction coefficients using a scale-splitting approach, Tribol. Int., 2022, 173, 107622 CrossRef.
- B. N. J. Persson, O. Albohr, G. Heinrich and H. Ueba, J. Phys.: Condens. Matter, 2005, 17, R1071 CrossRef CAS.
- G. Carbone, C. Mandriota and N. Menga, Theory of viscoelastic adhesion and friction, Extreme Mech. Lett., 2022, 56, 101877 CrossRef.
- See, and references therein, C. Y. Hui, B. Zhu and R. Long, Steady state crack growth in viscoelastic solids: A comparative study, J. Mech. Phys. Solids, 2022, 159, 104748 CrossRef.
- M. H. Müser and B. N. J. Persson, Crack and pull-off dynamics of adhesive, viscoelastic solids, Europhys. Lett., 2022, 137, 36004 CrossRef.
- A. Tiwari, L. Dorogin, A. I. Bennett, K. D. Schulze, W. G. Sawyer, M. Tahir, G. Heinrich and B. N. J. Persson, The effect of surface roughness and viscoelasticity on rubber adhesion, Soft Matter, 2017, 13, 3602 RSC.
- A. Lang and M. Klüppel, Influences of temperature and load on the dry friction behaviour of tire tread compounds in contact with rough granite, Wear, 2017, 15, 380 Search PubMed.
- A. Le Gal and M. Klüppel, Investigation and modelling of rubber stationary friction on rough surfaces, J. Phys.: Condens. Matter, 2008, 20, 015007 CrossRef.
- C. Mandriota, N. Menga and G. Carbone, Adhesive contact mechanics of viscoelastic materials, Int. J. Solids Struct., 2024, 290, 112685 CrossRef.
- A. D. Roberts and S. A. Jackson, Sliding friction of rubber, Nature, 1975, 257, 118 CrossRef CAS.
- T. Yamaguchi, S. Ohmata and M. Doi, Regular to chaotic transition of stick-slip motion in sliding friction of an adhesive gel-sheet, J. Phys.: Condens. Matter, 2009, 21, 205105 CrossRef PubMed.
- B. N. J. Persson, A. I. Volokitin and E. Tosatti, Role of the external pressure on the dewetting of soft interfaces, Eur. Phys. J. E: Soft Matter Biol. Phys., 2003, 11, 409 CrossRef CAS PubMed.
- B. N. J. Persson and F. Mugele, Squeeze-out and wear: fundamental principles and applications, J. Phys.: Condens. Matter, 2004, 16, R295 CrossRef CAS.
- F. Sahlin, R. Larsson, P. Marklund, A. Almqvist and P. M. Lugt, A mixed lubrication model incorporating measured surface topography. Part 2: roughness treatment, model validation, and simulation, Proc. Inst. Mech. Eng., Part J, 2010, 224, 353 CrossRef.
- V. F. Naeini, M. Björling, J. A. Larsson and R. Larsson, Unraveling the pressure-viscosity behavior and shear thinning in glycerol using atomic scale molecular dynamics simulations, J. Mol. Liq., 2023, 390, 122990 CrossRef.
- B. N. J. Persson, On the elastic energy and stress correlation in the contact between elastic solids with randomly rough surfaces, J. Phys.: Condens. Matter, 2008, 20, 312001 CrossRef.
- We thank Martin Müser for suggesting to use the stress correlation function in real space to define the average contact spot radius via G(r) = αG(0). An alternative definition was presented in ref. 73 but we prefer using G(r) = αG(0) as it gives resonable results even at the percolation threshold. (At the percolation threshold a contact cluster extend throughout the whole system but it consist of many weakly connected contact regions and the average size of these units appears to be well described using G(r) = αG(0) as tested with the MD simulation results of ref. 75.).
- M. H. Müser and A. Wang, Contact-Patch-Size Distribution and Limits of Self-Affinity in Contacts between Randomly Rough Surfaces, Lubricants, 2008, 6, 85 CrossRef.
- A. Wang and M. H. Müser, On the usefulness of the height-difference-autocorrelation function for contact mechanics, Tribol. Int., 2018, 123, 224 CrossRef.
- B. N. J. Persson and C. Yang, Theory of the leak-rate of seals, J. Phys.: Condens. Matter, 2008, 20, 315011 CrossRef.
- A. Schallamach, Wear, 1963, 6, 375 CrossRef.
- Y. B. Cherniak and A. I. Leonov, On the theory of the adhesive friction of elastomers, Wear, 1986, 108, 105 CrossRef.
| This journal is © The Royal Society of Chemistry 2024 |