DOI:
10.1039/D4SM00749B
(Paper)
Soft Matter, 2024,
20, 7914-7925
Generalized vs. fractional: a comparative analysis of Maxwell models applied to entangled polymer solutions†
Received
19th June 2024
, Accepted 19th September 2024
First published on 21st September 2024
Abstract
Fractional viscoelastic models provide an excellent description of rheological data for polymer systems with power-law behaviour. However, the physical interpretation of their model parameters, which carry fractional units of time, often remains elusive. We show that for poly(ethylene oxide) (PEO) solutions, the fractional Maxwell model (FMM) requires much fewer model parameters than the classical generalized Maxwell model for a good description of the data and that it can be applied consistently to solutions with varying degrees of viscoelasticity. Despite their fractional units, the parameters exhibit scaling laws similar to classical parameters as a function of polymer concentration.
1 Introduction
Polymer solutions are ubiquitous as rheological modifiers in paints, coatings, cosmetics and drug delivery systems.1–5 Poly(ethylene oxide) (PEO) is of particular importance and is widely used in biomedical applications due to its exceptional biocompatibility.6–8 Obtaining a thorough understanding of the viscoelastic properties of polymer solutions, which stem from polymer chain entanglements,9–12 is imperative to evaluate their performance in various applications.
To obtain a better understanding of a material's viscoelastic properties, mathematical models based on characteristic parameters are fitted to the data. The extracted parameters can be related to microstructural relaxation processes and can be compared across samples to reveal differences. Obtaining a model description also allows to make predictions for a material's behaviour. Classical viscoelastic models comprise arrangements of elastic springs and viscous dashpots.13 They predict exponential behaviour for the relaxation modulus G(t) with discrete relaxation times, a situation that is typically well obeyed by wormlike micellar solutions that may just exhibit one characteristic relaxation time.14
Many real materials with a broad range of relevant microstructural length and time scales, e.g. entangled polymer solutions, often exhibit distinctive power-law behaviour in relaxation and oscillation tests.15,16 Examples include cells,17,18 tissue,19 biopolymer networks,20 gluten gels,21 or food products.22
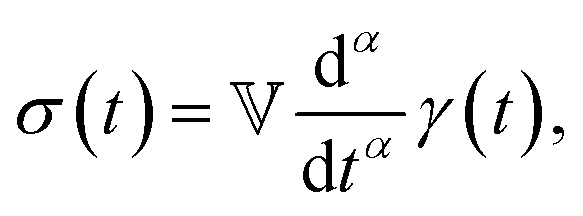
Modelling such power-law behaviour with sums of exponentials, as predicted by traditional spring-dashpot models, is an ill-posed problem, especially when using a very large number of springs and dashpots.23–25 Instead, empirical mathematical models can be fitted to the data, but their parameters may lack physical meaning since they are not derived from constitutive equations. An alternative approach is the use of fractional viscoelastic models, which incorporate fractional derivatives into their constitutive equations. The corresponding model element is known as a spring-pot, referencing its ability to interpolate between a spring and a dashpot.26,27 Its constitutive equation is given by
| | 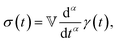 | (1) |
where
σ(
t) is the stress and
γ(
t) is the strain, d
α/d
tα is the Caputo fractional derivative,
28 and 0 ≤
α ≤ 1 is the fractional exponent. The spring-pot produces a response consisting of a single power law, which corresponds to the behaviour of critical gels.
29 It can be shown that the behaviour of the spring-pot can be realised by an infinite ladder arrangement of classical springs and dashpots.
26,30
has units of Pa s
α and lies somewhere between a viscosity (units Pa s) and a modulus (units Pa). Since its physical interpretation is not straightforward, it is referred to as a quasi-property. It is descriptive of the magnitude of the spring-pot's resistance against deformation and can be associated with the material's firmness.
31–35
Bagley and Torvik showed that Rouse's theory of dilute polymer solutions in the transition region can be related to a fractional constitutive equation with a power of 1/2.36,37 They thus provided a theoretical basis for the hitherto empirical fractional viscoelastic models. Later, they developed parameter constraints under which fractional derivative viscoelastic models yield a nonnegative rate of energy dissipation and nonnegative internal work, providing further thermodynamic justification for the application of fractional viscoelastic models.38 Wharmby and Bagley later showed that any fractional exponent between 0 and 1 can be rationalized by demonstrating that the order of the fractional derivative is directly related to the scaling of the underlying spectrum of relaxation times.39 A marked difference between the fractional derivative formalism and classical models such as the Rouse model is that the latter provide a discrete spectrum anchored by a rigidly defined slowest relaxation mode. Fractional models, on the other hand, have inherently continuous spectra. Thus, fractional models cannot strictly reproduce the predictions of classical models in a mathematical sense.
Spring-pots can be combined with classical springs and dashpots as well as with other spring-pots to form viscoelastic models that can describe complex rheological behaviour with a minimal number of parameters. Introducing fractional derivative operators into rheological constitutive equations automatically leads to power-law predictions for material functions.40 Fractional viscoelastic models have been demonstrated to accurately describe a wide range of real materials, including Xanthan gum,41,42 starch gels,43 starch/polypropylene blends,44 various liquid foods,45 and polyacrylamide gels.46 Using fractional models can greatly reduce the number of parameters needed for an accurate description of experimental data.47–52 The recent review articles by Bonfanti et al.15 and Song et al.53 provide a good overview of various fractional models and their applications.
In the present article, we demonstrate the advantages of describing entangled PEO solutions, as an example for viscoelastic polymer solutions with variable degree of entanglement, using the fractional Maxwell model (FMM) as opposed to the classical generalized Maxwell model (GMM). We proceed to study the behaviour of the fractional model parameters as a function of polymer concentration and molecular weight (Mw), thereby systematically varying the viscoelastic properties.
2 Viscoelastic models
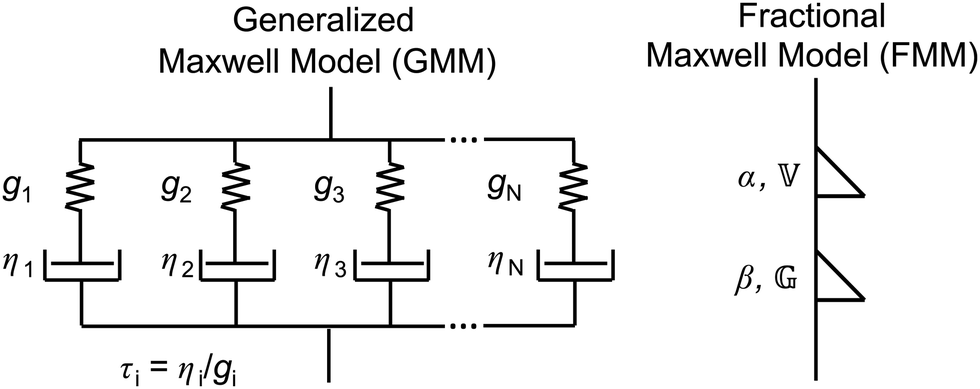
2.1 The generalized Maxwell model
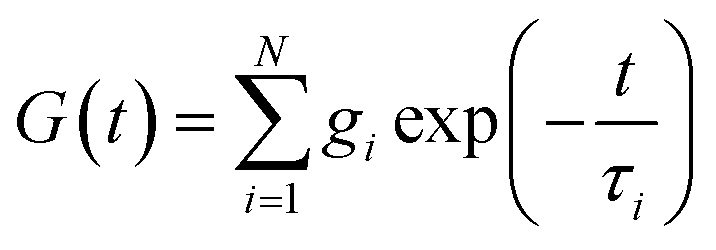
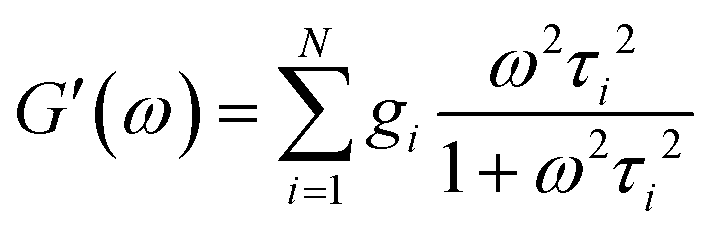
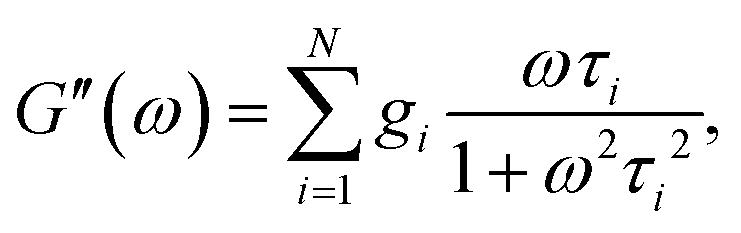
The classical Maxwell model is one of the simplest viscoelastic models, consisting of a spring and a dashpot connected in series. In the generalized Maxwell model (GMM), N Maxwell elements are connected in parallel.13,54 Each Maxwell element is associated with an exponential relaxation process with a characteristic relaxation time. A schematic representation of the GMM is shown Fig. 1. The relaxation modulus G(t) and storage/loss moduli G′, G′′ of the GMM with N modes are given by| |  | (2) |
and| | 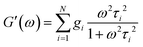 | (3) |
| | 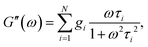 | (4) |
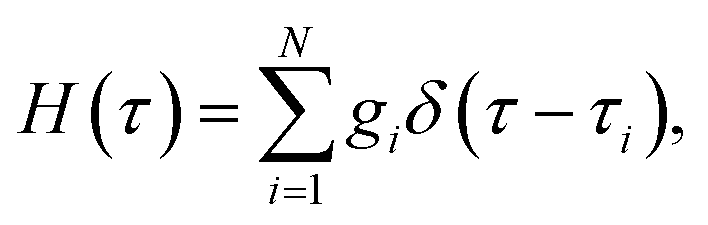
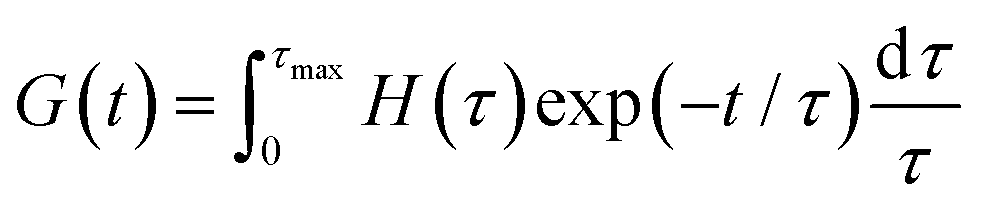
where τi and gi are the relaxation time and strength of the i-th mode, respectively. The set of relaxation times and strengths motivates the representation of viscoelasticity as a relaxation spectrum H(τ).13,55–57 The GMM yields a set of discrete relaxation times and strengths, which can be written in a continuous form as| |  | (5) |
where δ is the delta function. H(τ) is the kernel of several rheological functions, including| | 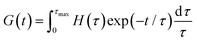 | (6) |
| |  | (7) |
| |  | (8) |
where τmax is the longest relaxation time. As a consequence, if H(τ) is known, all linear viscoelastic material functions can be calculated. However, inferring H(τ) from G′ and G′′ is a mathematically ill-posed problem. There have been numerous publications in the past concerning approaches for determining H(τ) from oscillatory shear data.25,58–68 These approaches differ in terms of the employed algorithms, and all have strengths and weaknesses.58
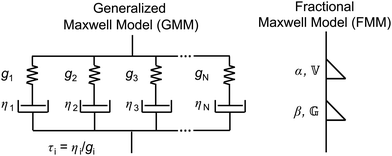 |
| | Fig. 1 Sketches of the generalized Maxwell model (GMM), and the fractional Maxwell model (FMM). | |
One particular example is the parsimonious modelling approach. Here, H(τ) is determined from fitting G′, G′′ with the GMM of the least possible number of relaxation modes.25 The resulting discrete relaxation spectrum can then be numerically converted into a continuous spectrum.55
2.2 The fractional Maxwell model
In analogy to the classical Maxwell model, the fractional Maxwell model (FMM) connects two spring-pots in series. A schematic representation of the FMM is shown in Fig. 1. The FMM is governed by two fractional exponents, 0 ≤ β < α ≤ 1. Note that by definition, α > β. If both exponents were equal, the FMM would reduce to a single spring-pot. The more elastic spring-pot with the lower exponent β determines the short-time/high-frequency behaviour, G(t → 0) ∼ t−β, G′(ω → ∞) ∼ ωβ and the more viscous spring-pot with the higher exponent α determines the long-time/low-frequency behaviour, G(t → ∞) ∼ t−α, G′(ω → 0) ∼ ωα.15 For β = 0 and α = 1, the classical Maxwell model is retrieved. The constitutive equation is given by| |  | (9) |
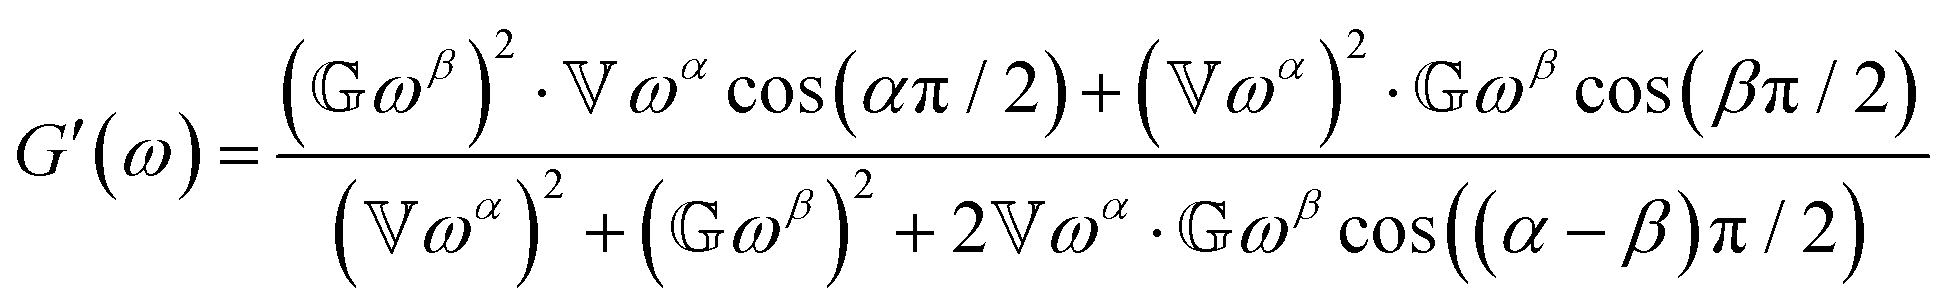
The relaxation modulus and storage/loss moduli are given by:15| | 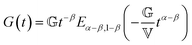 | (10) |
and| |  | (11) |
| |  | (12) |
respectively. Ea,b(z) is the two-parameter Mittag–Leffler function (MLF). The MLF, which is capable of interpolating between exponential and power-law behaviour, appears frequently in fractional calculus and is given by| |  | (13) |
More details about the MLF and its limiting behaviour can be found in ref. 69–71. In this paper, the MLF was evaluated numerically in MATLAB.72,73
In contrast to the GMM, the FMM intrinsically predicts a continuous relaxation spectrum, meaning it implies an infinite number of relaxation modes. The relaxation time spectrum of the FMM is given by:74
| |  | (14) |
for
τ → 0 and
τ → ∞, it is straightforward to verify that
| | 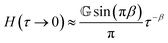 | (15) |
and
| |  | (16) |
respectively, as long as 0 <
β <
α < 1. All FMM material functions, as well as their limiting behaviour are summarized in Table S1 in the ESI.
†
As seen from eqn (16), H(τ) does not decay to zero, but a small yet finite relaxation contribution remains, even at very large times. Real materials with finite length scales have a longest and a shortest relaxation time. At times larger than the longest relaxation time, exponential relaxation is expected. The FMM can therefore only describe real materials in a finite time range. The long-time limiting behaviour of the FMM also leads to a diverging zero-shear viscosity (see ESI†), which does not correspond to the behaviour expected and observed for entangled polymer solutions. The FMM can nonetheless be useful for the description of such materials in a finite experimental time/frequency window, as we will demonstrate in this paper. A continuous increase of viscosity towards very low shear rates, without reaching a zero-shear viscosity plateau, has been reported for other materials, such as Xanthan gum solutions42 and liquid crystalline polymers.75
We can distinguish two sub-variants of the FMM. In the case that β = 0 and 0 < α < 1, one spring-pot becomes a regular spring. This variant is known as the fractional Maxwell solid (FMS).53 The FMS is useful for describing viscoelastic solids with a plateau modulus. It is therefore not applicable to the polymer solutions studied in this paper. In the FMS, the quasi-property  becomes a regular modulus G and the low-τ limiting behaviour of H(τ) changes to
| |  | (17) |
conversely, in the case that 0 <
β < 1 and
α = 1, one spring-pot becomes a regular dashpot. This variant is known as the fractional Maxwell liquid (FML), which is useful for describing viscoelastic liquids. In the FML,

becomes a regular viscosity
η and the high-
τ limiting behaviour of
H(
τ) changes to
| |  | (18) |
The FML has a finite zero-shear viscosity, corresponding to the parameter
η.
76,77
The behaviour of the FMM for α = 0.75 and β = 0.25 is shown in Fig. 2 for different values of  and
and  . In Fig. 2A and B, we see that
  only influences the low frequency behaviour, which is governed by the α-spring pot. The opposite is true for
  . Looking at eqn (15) and (16) and at Fig. 2B and D sheds light on the physical interpretation of the quasi-properties. With increasing
  , a whole section of the relaxation spectrum is shifted upwards, as indicated by the black arrows. This means that in contrast to normal viscosities and moduli,
  acts on a large range of relaxation times simultaneously.
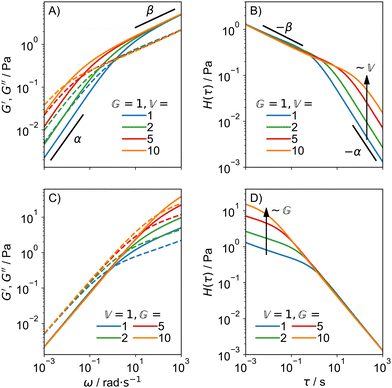 |
| | Fig. 2 Behaviour of the FMM for α = 0.75 and β = 0.25: G′ and G′′ (A) and H(τ) (B) for varying  and constant and constant  . G′ and G′′ (C) and H(τ) (D) for varying . G′ and G′′ (C) and H(τ) (D) for varying  and constant and constant  . .  is in units of Pa s0.75 and is in units of Pa s0.75 and  in units of Pa s0.25. in units of Pa s0.25. | |
Without reference to fractional viscoelasticity, expressions equivalent to (15) and (16) have been used previously in literature to describe relaxation spectra. An example is the empirical ‘dual asymptote model’ or ‘dual power law model’ by Winter and Mours,78 who proposed it as a continuous approximation of GMM spectra for some polymeric fluids. It was chosen, for instance, to describe the spectra of sulfonic acid ionomer dispersions.79 It is given by:
| | 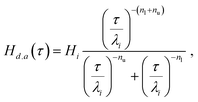 | (19) |
where
Hi and
λi are the values of
Hd.a(
τ) and
τ at the intersection point of the two power-laws and
nl and
nu are the two power-law exponents, with
nl <
nu equivalent to
β and
α. The relaxation spectrum of the FMM differs from the dual asymptote model in that it predicts a peak around the intersection of the two power laws, which gets more pronounced as
β approaches 0 and as the difference
α −
β increases (
Fig. 3). The peak derives from the fact that for
α → 1 and
β → 0, the FMM transitions into the regular Maxwell model, whose relaxation time spectrum consists of an infinitely narrow peak at
τ =
η/
G with a height of
G, where
η and
G are the viscosity of the dashpot and the modulus of the spring, respectively. While the presence of the peak makes sense conceptually, the question remains whether there are real materials that show two power law regions, as well as a peak in their relaxation spectra. The dual asymptote model was developed empirically out of necessity to describe GMM relaxation time spectra that showed two power law regions, a low exponent region at short times and a high exponent region at longer relaxation times. The FMM goes one step further in that it connects the same behaviour to a constitutive equation and encompasses a continuous transition to the classical Maxwell model.
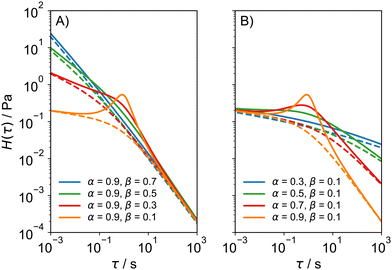 |
| | Fig. 3 Relaxation time spectra of the FMM (full lines) and the dual asymptote model (broken lines) for (A) constant α and decreasing β and (B) constant β and increasing α. In all cases,  and and  . . | |
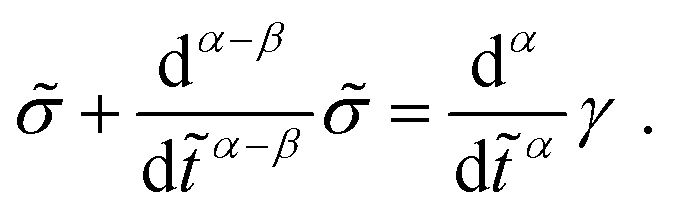
2.3 Non-dimensional FMM
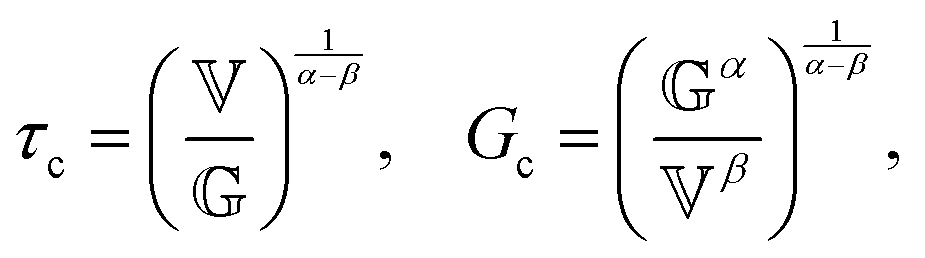
The constitutive equation of the FMM, eqn (9), can be made dimensionless by introducing ![[t with combining tilde]](https://www.rsc.org/images/entities/i_char_0074_0303.gif) = t/τc and
= t/τc and ![[small sigma, Greek, tilde]](https://www.rsc.org/images/entities/i_char_e10d.gif) = σ/Gc. Here, τc and Gc are a characteristic time and characteristic modulus, respectively. By setting26
= σ/Gc. Here, τc and Gc are a characteristic time and characteristic modulus, respectively. By setting26| |  | (20) |
the dimensionless constitutive equation becomes| |  | (21) |
it is easy to verify, that (τc, Gc) corresponds to the intersection point of the limiting power laws of |G*(ω)|, as demonstrated by the black cross in Fig. S1 in the ESI.† Note that eqn (20) and (21) are only defined if α > β. All FMM material functions can be written either in terms of  and
and  or in terms of τc and Gc. Both formulations are mathematically equivalent, but the latter circumvents the need for parameters with units containing fractional dimensions of time. However, despite their elusive dimensions, the original parameters
  and
and  are more readily comparable to the traditional model parameters, viscosity and modulus, since they also describe the magnitude of the corresponding spring-pot's response.
3 Experimental
3.1 Sample preparation
Aqueous semi-dilute solutions of high-Mw poly(ethylene oxide) (PEO) were prepared gravimetrically by adding the appropriate masses of PEO to a 4 mL glass vial. PEO with average molecular weights Mw of 1000, 2000 and 4000 kDa were used, each obtained from Sigma-Aldrich. The PEO concentrations c were 1, 2, 3 and 4 wt%. The 1 wt% solutions of 1000 kDa and 2000 kDa were too low viscous to yield reliable rheological data and were therefore not considered further in this paper. Per concentration, three samples were prepared by dissolving the polymer in Milli-Q water containing a low concentration of polystyrene particles with one of three different diameters (192, 109 or 69 nm with concentrations of 0.003, 0.01 and 0.04 w/v%, respectively), yielding a total of 30 samples. The polystyrene particles were originally added to allow for dynamic light scattering microrheology experiments, as shown in ref. 80. They do not interfere with the macroscopic oscillatory rheology experiments (see ESI,† Fig. S3) and were therefore not considered any further in this paper. The samples were stirred using a magnetic stirrer until a homogeneous solution was obtained, which required up to 1–2 days depending on c and Mw.
Polymer solutions can be divided into several regimes depending on their concentration. Ideally dilute (I), semi-dilute non-entangled (II), semi-dilute entangled (III) and concentrated (IV).81,82 The regions are separated by three critical concentrations, the overlap concentration c* (I → II), the critical entanglement concentration ce (II → III) and c‡ (III → IV). Different physics govern the viscoelastic behaviour of each region. According to simple estimations shown in the ESI,† the solutions studied here should fall into either the semi-dilute entangled (III) or the concentrated (IV) regimes, as shown in Table 1.
Table 1 Expected concentration regimes for the PEO solutions studied in this paper. Samples marked with an asterisk were not considered further due to being too low viscous
|
M
w
|
c
|
| 1 wt% |
2 wt% |
3 wt% |
4 wt% |
| 1000 kDa |
II* |
III |
III |
III |
| 2000 kDa |
II* |
III |
III |
IV |
| 4000 kDa |
III |
IV |
IV |
IV |
3.2 Rheology
Oscillatory shear experiments were performed on an MCR 502 WESP temperature-controlled rheometer from Anton Paar (Graz, Austria) in strain-imposed mode using a cone and plate measuring system with a 50 mm diameter and a cone angle of 1°. The gap width is fixed at 101 μm. The temperature was kept fixed at 25 °C for all measurements. In two successive frequency sweeps, the oscillation frequency was varied between 0.1 and 100 rad s−1 first in increasing and then decreasing order to check for hysteresis effects. Since no significant differences between both sweeps were found, only the first of the two sweeps was considered further. The strain amplitude was kept fixed at 5%. This value lies well within the linear viscoelastic regime, as demonstrated by amplitude sweeps that can be found in the ESI† (Fig. S2). For some samples, additional steady shear experiments were performed. The shear rate was varied between 0.1 and 100 rad s−1 first in order of increasing shear rates and then in order of decreasing shear rates. Since no significant hysteresis effects were observed, only the increasing order data were considered further.
3.3 Fitting viscoelastic models
Viscoelastic models were fitted using the lmfit package in Python, which utilizes a non-linear least-squares optimization routine.83 Model functions were written to return a one-dimensional array containing G′ and G′′, so both the real and the imaginary parts are fitted at the same time. The minimized quantity is given by:| |  | (22) |
where dividing by  and
and  ensures that all data points are considered equally. i = 1…M corresponds to the individual frequencies.
4 Results
4.1 Comparison of GMM versus FMM
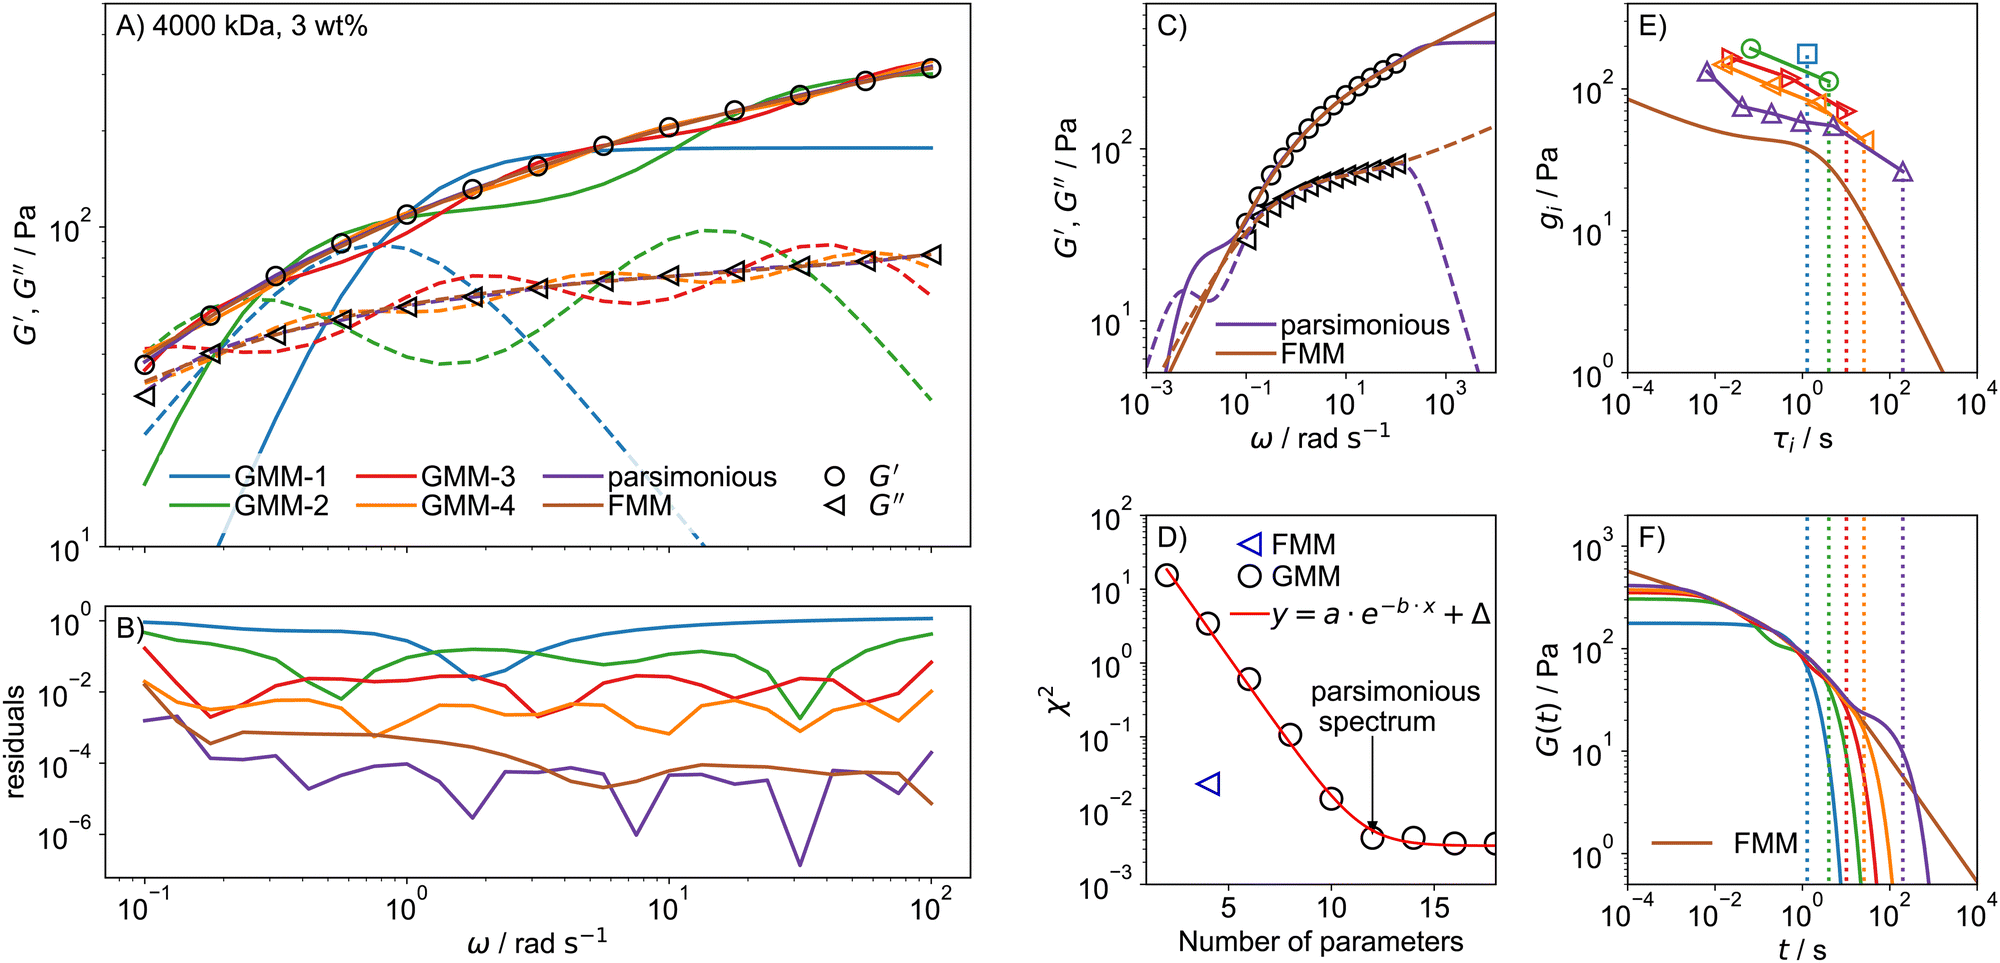
To compare the quality of describing experimental data by the GMM and FMM, frequency sweeps were performed on a collection of PEO solutions with varying c and Mw. To demonstrate the differences of the GMM and FMM, we shall focus on a 3 wt% solution of 4000 kDa PEO. The G′, G′′ data were fitted with the GMM with an increasing number of modes, N = 1…9, as well as with the FMM. In addition, the parsimonious spectrum was determined using the IRIS rheology software.78,84 The fits for the GMM with N = 1…4 and for the remaining models are shown in Fig. 4A together with the residuals in B. The residual is defined as| |  | (23) |
when a small number of modes is used, the GMM, which predicts G′ ∼ ω2 and G′′ ∼ ω scaling for ω → 0, struggles to reproduce the weak frequency dependence of G′ and G′′ seen in the data. At least 4 modes, meaning 8 parameters are necessary for a reasonable description of the data, but there are still marked oscillations in the model data. The parsimonious model yields a very good description with N = 6 modes and 12 parameters. In comparison, the FMM achieves an excellent description of similar quality over the whole frequency range with only 4 parameters. The advantage of the FMM is particularly pronounced for highly viscoelastic solutions, where G′ and G′′ show only weak dependence on frequency. Looking at the residuals in Fig. 4B, the FMM performs almost as good as the parsimonious model, which has many more parameters. That this is a general observation is demonstrated in Fig. S5 (ESI†), showing the fit residuals for the less stiff 1000 and 2000 kDa PEO solutions at 3 wt%.
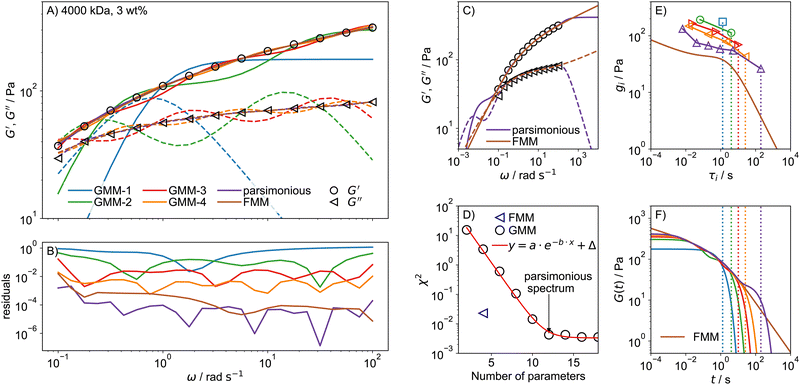 |
| | Fig. 4 (A) Fits of GMM-N with increasing number of modes N = 1 to N = 4, the parsimonious model and the FMM for a 4000 kDa, 3 wt% PEO solution. Only every second data point is shown to improve lucidity. Solid and broken lines indicate G′ and G′′ respectively. (B) Fit residuals. (C) The fit parameters of the parsimonious and FMM models are used to predict G′ and G′′ outside of the data range. (D) The fit error χ2 as a function of the number of model parameters. (E) Relaxation time spectra determined from GMM fits with an increasing number of modes, as well as the FMM spectrum calculated from eqn (14). (F) Predictions for the relaxation modulus calculated using eqn (2) for GMM and using eqn (10) for the FMM. The dotted lines indicate the longest relaxation time of each spectrum. The colour code in (E) and (F) is the same as in (A). | |
Another advantage of the FMM becomes clear when the fitted functions are extended to frequencies below and above the measured (and fitted) range, as shown in Fig. 4C. The parsimonious model predicts a second crossover of G′ and G′′ at low frequencies, for which there is no evidence based on the data. This indicates that the GMM can only ever describe the behaviour in a specified range but does not allow for predictions outside that range. In contrast, the FMM prediction is smoother and looks much more realistic. The four model parameters of the FMM thus encode the rheological behaviour of the sample over a very wide range, exceeding the experimental one.
To quantify the fit quality, the chi-square statistic χ2, eqn (22), is shown in Fig. 4D as a function of the number of model parameters. For the GMM-type models, χ2 decreases exponentially with the number of model parameters until a limiting value, Δ, is reached, which can be associated with the noise level of the data.55 The spectrum with the lowest number of model parameters that reaches a fit error close to Δ is the parsimonious spectrum. The FMM reaches a fit error much lower than GMM-4 with half the number of fit parameters.
The relaxation times τi and strengths gi of the GMM fits with increasing number of modes are shown in Fig. 4E. The relaxation time spectrum widens as the number of modes is increased until it spans from around 10−2 s to 102 s, which roughly corresponds to the inverse of the measured frequency range. This indicates that the determined spectrum merely reflects the time scale of the experiment, but the individual parameters do not hold any particular meaning. The FMM on the other hand intrinsically predicts a continuous relaxation time spectrum. The continuous spectrum is always lower than the individual values of the GMM, because the same mechanical response is spread out over an infinitely large number of relaxation modes.
The predictions for the relaxation modulus G(t), as calculated from eqn (2) and (10) for the GMM and FMM, respectively, are shown in Fig. 4F. The predictions are similar in the intermediate time range that corresponds to the measured frequency range. Differences arise in the limiting behaviour. The GMM quickly approaches a constant plateau value for times t shorter than the shortest relaxation time. The plateau is given by the sum of all relaxation strengths,  . At times longer than the longest relaxation time (demonstrated by the dotted lines in Fig. 4E and F), G(t) decays exponentially. The FMM on the other hand predicts power-law behaviour in both limits. Accordingly, the FMM is typically the much more realistic description, as it is less bound to reflect the artefacts seen in the GMM arising from the limited experimental window and the intrinsically assumed exponential relaxation.
The scenario that stress relaxation follows a power law until it decays exponentially beyond a longest relaxation time is given by the Rouse model, which explains the dynamics of unentangled polymers.37,81 In the Rouse model, stress relaxation follows a ∼t−1/2 power law at intermediate times and decays exponentially for t > τr, where τr is the Rouse time, corresponding to the relaxation on the scale of the entire chain.81
4.2 Scaling of FMM parameters
Having established the conceptual advantages of using the FMM over classical viscoelastic models, we now apply this model to a range of PEO solutions with varying viscoelasticity with a focus on the behaviour of the fit parameters as a function of concentration and Mw. The studied PEO solutions range from rather low viscous solutions for the short PEO chains and low concentrations to stiffer gel-like materials for high Mw and high concentrations. At each Mw and concentration, three measurements on three separately prepared samples were performed (see Section 3.1) in order to obtain statistically robust data.
For the 1000 and 2000 kDa polymers, the determined values for α were very close to 1 in all cases, meaning the corresponding spring-pot reduces to a regular dashpot. The fit was therefore repeated with the α-parameter fixed to 1. This particular variant of the FMM is referred to as the fractional Maxwell liquid (FML).53 The fits for one of three sets of samples are shown in Fig. 5A–C, the remaining fits are shown in the ESI.† There is excellent agreement between model and data in all cases for not too low values of G′ and G′′ (as here simply the limits of reliability of the experimental data are reached). The determined fractional exponents, α and β, from the three samples were averaged and are plotted as a function of polymer concentration in Fig. 5D and E. For 1000 and 2000 kDa, β shows close to no dependence on concentration and has an average value of 0.41 and 0.36 for 1000 and 2000 kDa, respectively. This means that the behaviour of all 1000 and 2000 kDa solutions are well-described by a model consisting of a dashpot and a rather elastic spring-pot in series. For 4000 kDa, the situation is quite different, because both α and β decrease systematically with concentration. In this case, the model elements become more elastic in nature to capture the behaviour of the higher concentrated, more gel-like solutions. Looking at the Mw dependence, one sees almost no change between the 1000 and 2000 kDa samples but a rather large jump in behaviour when going to the 4000 kDa samples. The more distinct changes in α and β seen for the 4000 kDa samples indicate that different physics are governing these samples. This is mirrored in Table 1, where the higher concentrated 4000 kDa samples were predicted to be in the concentrated regime (IV) as opposed to the semi-dilute entangled regime (III). Within the semi-dilute entangled regime, the exponents remain largely unchanged.
 |
| | Fig. 5 (A)–(C) G′, G′′ data of one set of PEO solutions fitted with the FML and FMM. Only every second data point is shown to increase lucidity. (D)–(G) Results for fitted parameters averaged over the three data sets. (H) The scaling exponents of  and and  exhibit a roughly linear dependence on the fractional exponents. The grey area shows the 95% confidence interval of the linear fit. (I) The arithmetic mean of the two fractional exponents elucidates whether the sample can be classified as a viscoelastic solid or liquid. (J) Characteristic time τc. (K) Characteristic modulus Gc. (L)–(N) Relaxation spectra calculated viaeqn (14) using the averaged fit parameters. exhibit a roughly linear dependence on the fractional exponents. The grey area shows the 95% confidence interval of the linear fit. (I) The arithmetic mean of the two fractional exponents elucidates whether the sample can be classified as a viscoelastic solid or liquid. (J) Characteristic time τc. (K) Characteristic modulus Gc. (L)–(N) Relaxation spectra calculated viaeqn (14) using the averaged fit parameters. | |
The variation of the quasi-properties  and
and  is shown in Fig. 5F and G. Note that the physical units of
  and
and  change with α and β, respectively, as indicated by the dashed arrows in Fig. 5F and G. Plotting a quasi-property with varying units on the same ordinate is strictly speaking not meaningful. However, doing so reveals that, similar to the classical model parameters zero-shear viscosity and shear modulus, they show power law scaling with concentration. They therefore behave as if they were regular material constants. The scaling exponents are shown in relation to the fractional exponent of the corresponding spring-pot in Fig. 5H. The more viscosity-like quasi-property
  , generally shows a stronger dependence on concentration than the more modulus-like property
  . All scaling exponents are intermediate between the expected exponents for the classical shear modulus (∼c2.3) and zero-shear viscosity (∼c4.7) of entangled polymer solutions in θ-solvents.81 There is a roughly linear correlation between the scaling exponent and the fractional exponent of the corresponding spring-pot, as indicated by the linear fit in Fig. 5H. This means that the quasi-properties of the fractional model scale in a way directly related to the classical predictions of polymer theory.
The arithmetic mean of the two fractional exponents (Fig. 5I), m = (α + β)/2 can help classify the overall nature of the sample. If m = 0, both spring-pots are springs and the sample is a pure solid. If m = 1, both spring-pots are dashpots and the sample is a pure liquid. We therefore propose that for 0 < m < 0.5, the sample can be classified as a viscoelastic solid and for 0.5 < m < 1 as a viscoelastic liquid. As shown in Fig. 5I, according to this framework, all 1000 and 2000 kDa samples can be classified as viscoelastic liquids. For 4000 kDa, m dips below 0.5 for c ≥ 2 wt%, indicating that a more profound change in the rheological behaviour is taking place, i.e. the samples change to behave like a viscoelastic solid. The characteristic time and modulus τc and Gc, are shown in Fig. 5J and K, respectively. Interestingly, τc is almost constant for 4000 kDa PEO, while for 1000 and 2000 kDa it increases substantially with increasing concentration. Similarly, the concentration dependence of Gc is much higher for the 4000 kDa samples than for the two shorter polymers. It is important to keep in mind that τc corresponds to the intersection of the limiting power laws of |G*(ω)| and is not strictly the same as a structural relaxation time. The quantities τc and Gc are unique to fractional models that show power law scaling. The product ηc = τcGc defines a characteristic viscosity ηc whose physical meaning is a priori not known. As mentioned in Section 4.1, the zero-shear viscosity diverges for the FMM if α < 1. For the case of the FML, i.e., when α = 1, the model yields a finite zero-shear viscosity and it is easy to verify that: η = η0 = ηc.53,76,77 In steady-shear experiments, we found that the viscosity of all samples approaches a plateau towards low shear rates, confirming the existence of a finite zero-shear viscosity (see Fig. S6, ESI†). In Fig. 6 we show the ratios  and ηc/η0, as well as α for one of the three samples sets. As expected, both ratios are very close to 1 for the less viscous samples, where α = 1. For the stiffer 4000 kDa samples, both ratios drop significantly below 1, as α also decreases. In all cases,
  . A reason for this discrepancy might arise from the fact that for these very viscous samples, the value of η0, estimated from a cross model fit (see ESI†), is inaccurate because the plateau is not yet fully reached in the experiment range.
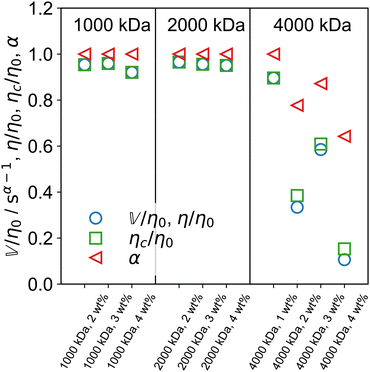 |
| | Fig. 6 Ratio of the more viscosity-like quasi-property  (or η in the FML case) and the characteristic viscosity ηc to the measured zero-shear viscosity η0 (from steady shear experiments), as well as the ratio of the characteristic viscosity ηc to η0. The fractional exponent α is also shown. Both ratios are very close to unity when α = 1. Deviations appear for α < 1. (or η in the FML case) and the characteristic viscosity ηc to the measured zero-shear viscosity η0 (from steady shear experiments), as well as the ratio of the characteristic viscosity ηc to η0. The fractional exponent α is also shown. Both ratios are very close to unity when α = 1. Deviations appear for α < 1. | |
4.3 Analysis of relaxation spectra
Fractional viscoelastic models are intrinsically associated with continuous relaxation time spectra. After obtaining the FMM parameters from fitting G′, G′′ data, the continuous spectra can be calculated analytically using eqn (14). This is a great advantage over classical models, because it circumvents the need to first determine a discrete spectrum and numerically convert it into a continuous one.55
The PEO spectra were calculated from the averaged FMM parameters and are shown in Fig. 5L–N. The spectra for the 1000 and 2000 kDa polymers look generically similar, irrespective of concentration. FML spectra exhibit ∼τ−(2−β) scaling for τ → ∞ as opposed to ∼τ−α in the FMM case, because the sin(απ/2) term in eqn (14) vanishes for α = 1. For 1000 and 2000 kDa, an increase in concentration leads to a diagonal shift of the spectra towards higher values of H(τ) and longer relaxation times, indicating that no significant change of the dynamics of the system occurs. In the case of 4000 kDa, the shape of the spectra changes significantly with concentration, which is mirrored in the stronger variation of α and β. This can be explained such that the slower dynamics at large τ are affected much more than the faster dynamics at small τ. Faster dynamics generally take place on a smaller length scale. In the case of our polymer solutions, the fast dynamics include the movement of isolated polymer segments or dangling chain ends. These local processes are largely unaffected by an increasing concentration of polymer but only happen more frequently, explaining why H(τ) is shifted upward. Slower dynamics, taking place on a much larger length scale, include entanglement and disentanglement and an overall reorganization of the structure. These processes are closely related to the elastic properties and change considerably if the concentration is increased, explaining why the variation of H(τ) at large τ is much stronger.
4.4 Time-concentration superposition
The identical shape of the relaxation spectra seen in Fig. 5L–N motivates collapsing all the corresponding G′, G′′ data sets onto one master curve. Since the curves belong to solutions of varying concentration, this procedure is known as time-concentration superposition (TCS). TCS refers to shifting rheological spectra in both the horizontal and vertical direction with respect to a reference curve to obtain a single master curve.85–87 We can define the horizontal and vertical shift factors ac and bc such that| |  | (24) |
and| |  | (25) |
where cref is an arbitrary reference concentration. TCS assumes that all relaxation modes show the same dependence on concentration:andHowever, this is not generally true, because, e.g., in the case of polymer solutions the fast Rouse dynamics show a different concentration dependence than the terminal reptation dynamics.81 For that reason, superposition can only be achieved either in the Rouse regime or in the terminal regime.86 The horizontal shift factor is determined first by shifting the loss tangent, tan![[thin space (1/6-em)]](https://www.rsc.org/images/entities/char_2009.gif) δ = G′′/G′, in the horizontal direction to align with the loss tangent of a reference curve. Afterwards, G′ and G′′ are shifted in the vertical direction to match the values of the reference curve (for details about the shifting procedure refer to the ESI†). For all Mw, the respective 2 wt% solution was chosen as the reference sample.
δ = G′′/G′, in the horizontal direction to align with the loss tangent of a reference curve. Afterwards, G′ and G′′ are shifted in the vertical direction to match the values of the reference curve (for details about the shifting procedure refer to the ESI†). For all Mw, the respective 2 wt% solution was chosen as the reference sample.
The shifted curves for one of the three sample sets are shown in Fig. 7. The plots for the remaining samples can be found in the ESI.† The shifted curves, as seen in Fig. 7B, D and F match very well in the case of the two lower molecular weights, corresponding to the cases where α and β show little variation with concentration. For 4000 kDa, superposition is still decent, but considerably worse than in the other two cases, providing further evidence that the rheological properties of the longer chain polymer solutions are governed by other physics.
 |
| | Fig. 7 Time-concentration superposition results for different PEO samples. Firstly, horizontal shifts are obtained by shifting the loss tangents (left column). Secondly, vertical shifts are obtained by shifting G′, G′′ (right column). (A) and (B) 1000 kDa, (C) and (D) 2000 kDa, (E) and (F) 4000 kDa. | |
The shift factors ac and bc were determined for all three sets of samples and their averages are shown in Fig. 8. The determined shift factors scale as power laws with concentration. The scaling exponents are between 3.40 and 4.46 for ac and between 1.03 and 1.57 for bc. The vertical shift factor, bc is a measure of the scaled plateau modulus and is therefore expected to scale as ∼ϕ3ν/3ν−1 ≈ ϕ2.3 for polymers in good solvents (ν = 0.588), where ν is the Flory exponent.81,86 The scaling exponents found here are significantly smaller than 2.3, meaning that our polymer solutions are less dependent on concentration than expected for entangled polymer solutions. However, the number of shift factors per Mw is rather small (2 for 1000 and 2000 kDa and 3 for 4000 kDa), so more experiments would be needed to draw a final conclusion.
 |
| | Fig. 8 Averages of (A) horizontal (ac) and (B) vertical (bc) scaling exponents as a function of polymer volume fraction as determined from time-concentration superposition. The values from the three individual data sets were averaged and the error bars indicate the standard deviations. The power law scaling exponents are indicated in the same colors as the respective curves. | |
5 Conclusions
We have shown that the fractional Maxwell model (FMM) yields an excellent description of the frequency-dependent rheology of PEO solutions. In general, the FMM leads to better descriptions with substantially fewer model parameters compared to the classical, generalized Maxwell model (GMM). The FMM has been successfully applied to solutions of PEO of varying Mw and concentration, ranging from low viscous solutions to hydrogel-like materials. The quasi-properties  and
and  show power-law scaling as a function of polymer concentration with exponents intermediate between those expected for the shear modulus and the zero-shear viscosity of polymer solutions. Continuous relaxation spectra can be calculated analytically from the FMM-parameters.
As a particular finding, we observed that upon increasing the polymer concentration of 1000 and 2000 kDa PEO, the spectra do not change in shape but are only shifted, indicating that the overall nature of the samples remains unchanged. In those samples, the rheological spectra from various concentrations could be merged into a master curve using the concept of time-concentration superposition (TCS). In the case of 4000 kDa, more profound changes are taking place as the solution transitions form a viscoelastic liquid to a viscoelastic solid. Here, TCS shows larger errors.
In summary, it can be stated that the FMM is a very suitable model of describing the viscoelastic properties of entangled polymer solutions over an extended frequency range in a reliable way and allows us to gain good insights into the relaxation mechanisms of such systems.
Author contributions
Conceptualization: MG, RS and HW. Data curation: RS. Formal analysis: RS and HW. Investigation: RS. Writing/original draft preparation: RS, HW, MG. Writing/review & editing: RS, HW and MG.
Data availability
The raw rheology data shown in this paper is available at https://doi.org/10.14279/depositonce-20768.
Conflicts of interest
There are no conflicts to declare.
Acknowledgements
This study was funded by the Deutsche Forschungsgemein-schaft (DFG, German Research Foundation, Project ID 431232613) – SFB 1449 project A02. We acknowledge the support by the German Research Foundation. Further, RS would like to acknowledge the Fonds der Chemischen Industrie (FCI) for financial support. HHW acknowledges the support of the U.S. Department of Energy, Award Number DEEE0009285. Finally, we would like to thank the reviewers, whose comments contributed substantially to improving this article further.
References
-
Z. A. Rehan and A. Usman, in Advanced Functional Polymers: Synthesis to Applications, ed. K. Shaker and A. Hafeez, Springer Nature Singapore, Singapore, 2023, pp. 49–76 Search PubMed
 .
.
- H. M. van der Kooij and J. Sprakel, Soft Matter, 2015, 11, 6353–6359 RSC .
- R. Y. Lochhead, Cosmetic Nanotechnology, American Chemical Society, 2007, 961, 3–56 CAS .
- Y. K. Sung and S. W. Kim, Biomater. Res., 2020, 24, 12 CrossRef CAS PubMed .
- N. N. Nyamweya, Futur. J. Pharm. Sci., 2021, 7, 18 CrossRef .
- J. Zhu, Biomaterials, 2010, 31, 4639–4656 CrossRef CAS PubMed .
- N. A. Peppas, K. B. Keys, M. Torres-Lugo and A. M. Lowman, J. Controlled Release, 1999, 62, 81–87 CrossRef CAS PubMed .
- J. H. Lee, H. B. Lee and J. D. Andrade, Prog. Polym. Sci., 1995, 20, 1043–1079 CrossRef CAS .
- D. M. Yu, G. L. Amidon, N. D. Weiner and A. H. Goldberg, J. Pharm. Sci., 1994, 83, 1443–1449 CrossRef CAS PubMed .
- K. W. Ebagninin, A. Benchabane and K. Bekkour, J. Colloid Interface Sci., 2009, 336, 360–367 CrossRef CAS PubMed .
- D. Rivero, L. M. Gouveia, A. J. Müller and A. E. Sáez, Rheol. Acta, 2012, 51, 13–20 CrossRef CAS .
- V. K. Daga and N. J. Wagner, Rheol. Acta, 2006, 45, 813–824 CrossRef CAS .
-
N. W. Tschoegl, The phenomenological theory of linear viscoelastic behavior: an introduction, Springer Science & Business Media, 2012 Search PubMed .
- H. Rehage and H. Hoffmann, J. Phys. Chem., 1988, 92, 4712–4719 CrossRef CAS .
- A. Bonfanti, J. L. Kaplan, G. Charras and A. Kabla, Soft Matter, 2020, 16, 6002–6020 RSC .
- S. Aime, L. Cipelletti and L. Ramos, J. Rheol., 2018, 62, 1429–1441 CrossRef CAS .
- J. T. Hang, Y. Kang, G. K. Xu and H. Gao, Nat. Commun., 2021, 12, 1–7 CrossRef PubMed .
- V. D. Djordjević, J. Jarić, B. Fabry, J. J. Fredberg and D. Stamenović, Ann. Biomed. Eng., 2003, 31, 692–699 CrossRef PubMed .
- M. Kohandel, S. Sivaloganathan, G. Tenti and K. Darvish, Phys. Med. Biol., 2005, 50, 2799 CrossRef CAS PubMed .
- F. Gobeaux, E. Belamie, G. Mosser, P. Davidson and S. Asnacios, Soft Matter, 2010, 6, 3769–3777 RSC .
- T. S. K. Ng and G. H. McKinley, J. Rheol., 2008, 52, 417–449 CrossRef CAS .
- T. J. Faber, A. Jaishankar and G. H. McKinley, Food Hydrocolloids, 2017, 62, 325–339 CrossRef CAS .
- V. M. Laurent, R. Fodil, P. Cañadas, S. Féréol, B. Louis, E. Planus and D. Isabey, Ann. Biomed. Eng., 2003, 31, 1263–1278 CrossRef PubMed .
- M. Balland, N. Desprat, D. Icard, S. Féréol, A. Asnacios, J. Browaeys, S. Hénon and F. Gallet, Phys. Rev. E: Stat., Nonlinear, Soft Matter Phys., 2006, 74, 021911 CrossRef PubMed .
- M. Baumgaertel and H. H. Winter, Rheol. Acta, 1989, 28, 511–519 CrossRef CAS .
- H. Schiessel, R. Metzler, A. Blumen and T. F. Nonnenmacher, J. Phys. A: Math.
Gen., 1995, 28, 6567 CrossRef CAS .
- G. W. Scott Blair, J. Colloid Sci., 1947, 2, 21–32 CrossRef .
-
R. Gorenflo and F. Mainardi, in Fractals and Fractional Calculus in Continuum Mechanics, ed. A. Carpinteri and F. Mainardi, Springer Vienna, Vienna, 1997, pp. 223–276 Search PubMed .
- H. Henning Winter and M. Mours, Neutron Spin Echo Spectroscopy Viscoelasticity Rheology, Adv. Polym. Sci., 1997, 134, 165–234 CrossRef .
- H. Schiessel and A. Blumen, Macromolecules, 1995, 28, 4013–4019 CrossRef CAS .
- A. Jaishankar and G. H. McKinley, Proc. R. Soc. A, 2013, 469, 20120284 CrossRef .
- G. W. S. Blair, B. C. Veinoglou and J. E. Caffyn, Proc. R. Soc. A, 1947, 189, 69–87 CAS .
- A. Bonfanti, J. L. Kaplan, G. Charras and A. Kabla, Soft Matter, 2020, 16, 6002 RSC .
-
K. S. Miller and B. Ross, An introduction to the fractional calculus and fractional differential equations, Wiley, 1993 Search PubMed .
- G. W. S. Blair and F. M. V. Coppen, Am. J. Psychol., 1942, 55, 215–229 CrossRef .
- R. L. Bagley and P. J. Torvik, J. Rheol., 1983, 27, 201–210 CrossRef CAS .
- P. E. Rouse Jr., J. Chem. Phys., 1953, 21, 1272–1280 CrossRef .
- R. L. Bagley and P. J. Torvik, J. Rheol., 1986, 30, 133–155 CrossRef CAS .
- A. W. Wharmby and R. L. Bagley, J. Rheol., 2013, 57, 1429–1440 CrossRef CAS .
- K. Adolfsson, M. Enelund and P. Olsson, Mech. Time-Depend Mater., 2005, 9, 15–34 CrossRef CAS .
- S. Ki-Won, K. Hoa-Youn and C. Gap-Shik, Korea-Australia Rheol. J., 2006, 18, 67–81 Search PubMed .
- A. Jaishankar and G. H. McKinley, J. Rheol., 2014, 58, 1751 CrossRef CAS .
- I. Rosalina and M. Bhattacharya, Carbohydr. Polym., 2002, 48, 191–202 CrossRef CAS .
- E. Raee, A. Avid and B. Kaffashi, J. Appl. Polym. Sci., 2020, 137, 48742 CrossRef CAS .
- C. E. Wagner, A. C. Barbati, J. Engmann, A. S. Burbidge and G. H. McKinley, Food Hydrocolloids, 2017, 69, 242–254 CrossRef CAS .
- Y. Abidine, V. M. Laurent, R. Michel, A. Duperray, L. I. Palade and C. Verdier, Europhys. Lett., 2015, 109, 38003 CrossRef .
- M. Caputo and F. Mainardi, Pure Appl. Geophys., 1971, 91, 134–147 CrossRef .
- R. L. Bagley and P. J. Torvik, J. Rheol., 2000, 27, 201 CrossRef .
- R. C. Koeller, J. Appl. Mech., 1984, 51, 299–307 CrossRef .
-
F. Mainardi, Fractional calculus and waves in linear viscoelasticity: an introduction to mathematical models, World Scientific, 2022 Search PubMed .
- Y. A. Rossikhin and M. V. Shitikova, Appl. Mech. Rev., 1997, 50, 15–67 CrossRef .
- D. Ramirez-Brewer, O. D. Montoya, J. U. Vivero and L. García-Zapateiro, Fluids, 2021, 6, 418 CrossRef CAS .
- J. Song, N. Holten-Andersen and G. H. McKinley, Soft Matter, 2023, 19, 7885–7906 RSC .
- E. Wiechert, Ann. Phys., 1893, 286, 546–570 CrossRef .
- M. Baumgaertel and H. H. Winter, J. Non-Newtonian Fluid Mech., 1992, 44, 15–36 CrossRef CAS .
- M. Baumgaertel and H. H. Winter, Rheol. Acta, 1989, 28, 511–519 CrossRef CAS .
-
J. D. Ferry, Viscoelastic Properties of Polymers, Wiley, 1980 Search PubMed .
- H. H. Winter, J. Non-Newtonian Fluid Mech., 1997, 68, 225–239 CrossRef CAS .
- J. Honerkamp and J. Weese, Continuum Mech. Therm., 1990, 2, 17–30 CrossRef .
- N. W. Tschoegl and I. Emri, Rheol. Acta, 1993, 32, 322–327 CrossRef CAS .
- D. W. Mead, J. Rheol., 1994, 38, 1769–1795 CrossRef CAS .
- V. M. Kamath and M. R. Mackley, J. Non-Newtonian Fluid Mech., 1989, 32, 119–144 CrossRef CAS .
- J. Honerkamp and J. Weese, Macromolecules, 1989, 22, 4372–4377 CrossRef CAS .
- C. Elster, J. Honerkamp and J. Weese, Rheol. Acta, 1992, 31, 161–174 CrossRef CAS .
- N. W. Tschoegl and I. Emri, Int. J. Polym. Mater. Polym. Biomater., 1992, 18, 117–127 CrossRef CAS .
- C. Friedrich, H. Braun and J. Weese, Polym. Eng. Sci., 1995, 35, 1661–1669 CrossRef CAS .
- I. McDougall, N. Orbey and J. M. Dealy, J. Rheol., 2014, 58, 779–797 CrossRef CAS .
- F. J. Stadler and C. Bailly, Rheol. Acta, 2009, 48, 33–49 CrossRef CAS .
- J. Wang, Y. Zhou and D. O’Regan, Integral. Transf. Spec. Funct., 2018, 29, 81–94 CrossRef .
- M. A. Özarslan and B. Yılmaz, J. Inequal. Appl., 2014, 2014, 85 CrossRef .
- H. J. Haubold, A. M. Mathai and R. K. Saxena, J. Appl. Math., 2011, 2011, 298628 CrossRef .
-
R. Garrappa, The Mittag-Leffler function, 2015, https://www.mathworks.com/matlabcentral/fileexchange/48154-the-mittag-leffler-function.
- R. Garrappa, SIAM J. Numer. Anal., 2015, 53, 1350–1369 CrossRef .
- A. Stankiewicz, Polymers, 2023, 15, 3552 CrossRef CAS PubMed .
- S. M. Guskey and H. H. Winter, J. Rheol., 1991, 35, 1191–1207 CrossRef CAS .
- J. D. J. Rathinaraj, B. Keshavarz and G. H. McKinley, Phys. Fluids, 2022, 34, 033106 CrossRef CAS .
- J. D. J. Rathinaraj, J. Hendricks, G. H. McKinley and C. Clasen, J. Non-Newtonian Fluid Mech., 2022, 301, 104744 CrossRef CAS .
- H. H. Winter and M. Mours, Rheol. Acta, 2006, 45, 331–338 CrossRef CAS .
- S. Khandavalli, J. H. Park, H. H. Winter, D. J. Myers, M. Ulsh and S. A. Mauger, Macromolecules, 2023, 56, 6988–7005 CrossRef CAS .
- R. F. Schmidt, H. Kiefer, R. Dalgliesh, M. Gradzielski and R. R. Netz, Nano Lett., 2024, 24, 4758–4765 CAS .
-
M. Rubinstein and R. H. Colby, Polymer Physics, Oxford University Press, London, England, 2003 Search PubMed .
- W. W. Graessley, Polymer, 1980, 21, 258–262 CrossRef CAS .
-
M. Newville, T. Stensitzki, D. B. Allen and A. Ingargiola, LMFIT: Non-Linear Least-Square Minimization and Curve-Fitting for Python, 2014 DOI:10.5281/ZENODO.1699739.
- L. Poh, E. Narimissa, M. H. Wagner and H. H. Winter, Rheol. Acta, 2022, 61, 259–269 CrossRef CAS .
- M. Baumgärtel and N. Willenbacher, Rheol. Acta, 1996, 35, 168–185 CrossRef .
- S. Banik, D. Kong, M. J. San Francisco and G. B. McKenna, Macromolecules, 2021, 54, 8632–8654 CrossRef CAS .
- X. Peng, J. G. Wang, Q. Li, D. Chen, R. N. Zia and G. B. McKenna, Phys. Rev. E, 2018, 98, 62602 CrossRef .
Footnote |
| † Electronic supplementary information (ESI) available: (1) FMM material functions, (2) estimation of critical concentrations, (3) amplitude sweeps, (4) frequency sweeps, (5) zero-shear viscosity, (6) determination of shift factors. See DOI: https://doi.org/10.1039/d4sm00749b |
|
| This journal is © The Royal Society of Chemistry 2024 |
Click here to see how this site uses Cookies. View our privacy policy here. 
 Open Access Article
 This Open Access Article is licensed under a
  *a,
Horst Henning
Winter
b and
Michael
Gradzielski
*a,
Horst Henning
Winter
b and
Michael
Gradzielski
 has units of Pa sα and lies somewhere between a viscosity (units Pa s) and a modulus (units Pa). Since its physical interpretation is not straightforward, it is referred to as a quasi-property. It is descriptive of the magnitude of the spring-pot's resistance against deformation and can be associated with the material's firmness.31–35


 becomes a regular modulus G and the low-τ limiting behaviour of H(τ) changes to
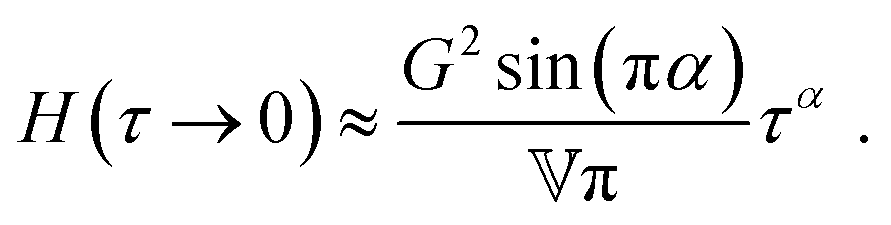
 becomes a regular viscosity η and the high-τ limiting behaviour of H(τ) changes to
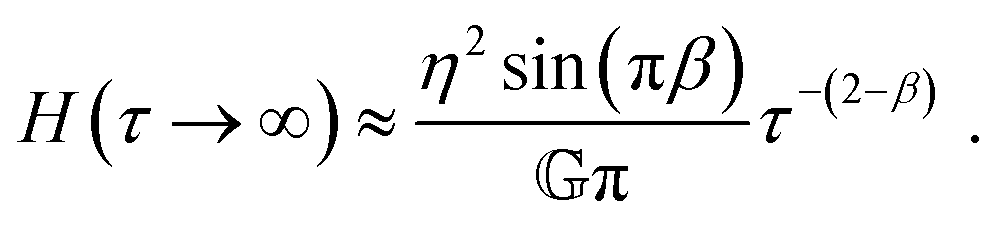
 and
and  . In Fig. 2A and B, we see that
  only influences the low frequency behaviour, which is governed by the α-spring pot. The opposite is true for
  . Looking at eqn (15) and (16) and at Fig. 2B and D sheds light on the physical interpretation of the quasi-properties. With increasing
  , a whole section of the relaxation spectrum is shifted upwards, as indicated by the black arrows. This means that in contrast to normal viscosities and moduli,
  acts on a large range of relaxation times simultaneously.
 and constant
  . G′ and G′′ (C) and H(τ) (D) for varying
  and constant
  .
.  is in units of Pa s0.75 and
  in units of Pa s0.25.

 and
and  .
.
 and
and  or in terms of τc and Gc. Both formulations are mathematically equivalent, but the latter circumvents the need for parameters with units containing fractional dimensions of time. However, despite their elusive dimensions, the original parameters
  and
and  are more readily comparable to the traditional model parameters, viscosity and modulus, since they also describe the magnitude of the corresponding spring-pot's response.

 and
and  ensures that all data points are considered equally. i = 1…M corresponds to the individual frequencies.

 . At times longer than the longest relaxation time (demonstrated by the dotted lines in Fig. 4E and F), G(t) decays exponentially. The FMM on the other hand predicts power-law behaviour in both limits. Accordingly, the FMM is typically the much more realistic description, as it is less bound to reflect the artefacts seen in the GMM arising from the limited experimental window and the intrinsically assumed exponential relaxation.
 and
and  exhibit a roughly linear dependence on the fractional exponents. The grey area shows the 95% confidence interval of the linear fit. (I) The arithmetic mean of the two fractional exponents elucidates whether the sample can be classified as a viscoelastic solid or liquid. (J) Characteristic time τc. (K) Characteristic modulus Gc. (L)–(N) Relaxation spectra calculated viaeqn (14) using the averaged fit parameters.
 and
and  is shown in Fig. 5F and G. Note that the physical units of
  and
and  change with α and β, respectively, as indicated by the dashed arrows in Fig. 5F and G. Plotting a quasi-property with varying units on the same ordinate is strictly speaking not meaningful. However, doing so reveals that, similar to the classical model parameters zero-shear viscosity and shear modulus, they show power law scaling with concentration. They therefore behave as if they were regular material constants. The scaling exponents are shown in relation to the fractional exponent of the corresponding spring-pot in Fig. 5H. The more viscosity-like quasi-property
  , generally shows a stronger dependence on concentration than the more modulus-like property
  . All scaling exponents are intermediate between the expected exponents for the classical shear modulus (∼c2.3) and zero-shear viscosity (∼c4.7) of entangled polymer solutions in θ-solvents.81 There is a roughly linear correlation between the scaling exponent and the fractional exponent of the corresponding spring-pot, as indicated by the linear fit in Fig. 5H. This means that the quasi-properties of the fractional model scale in a way directly related to the classical predictions of polymer theory.
 and ηc/η0, as well as α for one of the three samples sets. As expected, both ratios are very close to 1 for the less viscous samples, where α = 1. For the stiffer 4000 kDa samples, both ratios drop significantly below 1, as α also decreases. In all cases,
  . A reason for this discrepancy might arise from the fact that for these very viscous samples, the value of η0, estimated from a cross model fit (see ESI†), is inaccurate because the plateau is not yet fully reached in the experiment range.
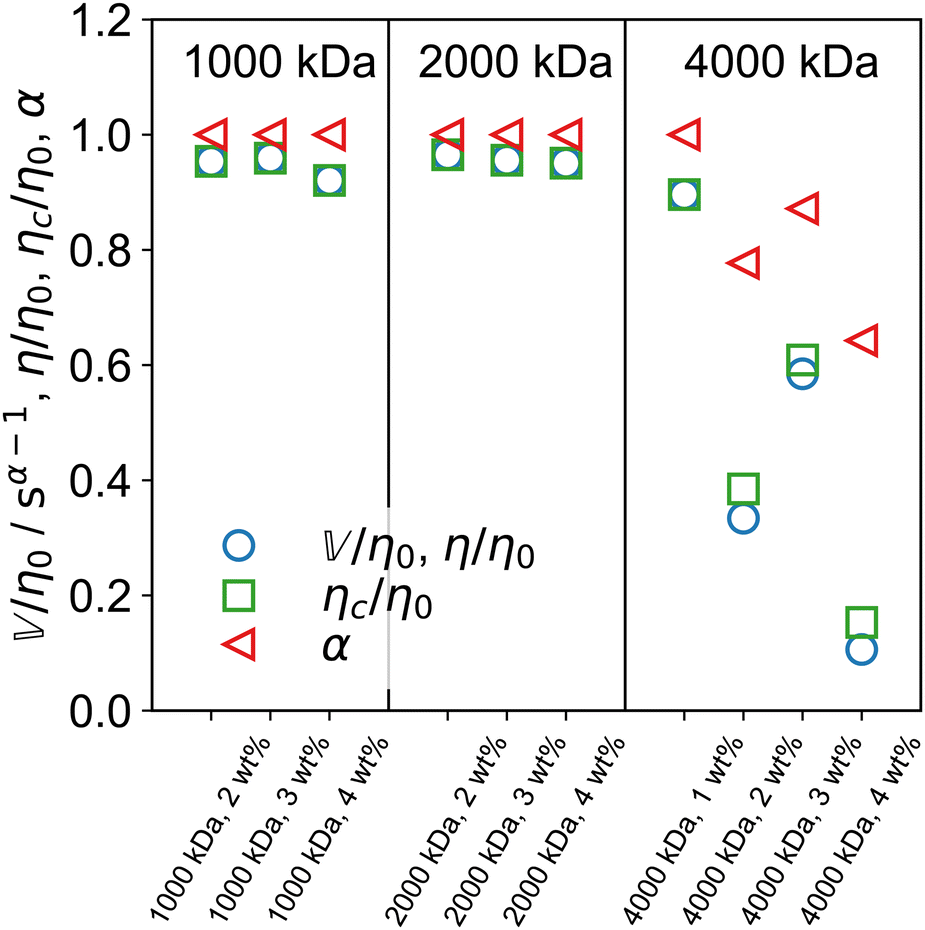
 (or η in the FML case) and the characteristic viscosity ηc to the measured zero-shear viscosity η0 (from steady shear experiments), as well as the ratio of the characteristic viscosity ηc to η0. The fractional exponent α is also shown. Both ratios are very close to unity when α = 1. Deviations appear for α < 1.


 and
and  show power-law scaling as a function of polymer concentration with exponents intermediate between those expected for the shear modulus and the zero-shear viscosity of polymer solutions. Continuous relaxation spectra can be calculated analytically from the FMM-parameters.