
 Open Access Article
 This Open Access Article is licensed under a
 Creative Commons Attribution 3.0 Unported Licence
Microscopic molecular mobility of high-performance polymers of intrinsic microporosity revealed by neutron scattering – bend fluctuations and signature of methyl group rotation
Reiner
Zorn
a,
Paulina
Szymoniak
b,
Mohamed A.
Kolmangadi
b,
Richard
Malpass-Evans
c,
Neil B.
McKeown
 c,
Niina H.
Jalarvo
d,
Madhusudan
Tyagi
e,
Martin
Böhning
b and
Andreas
Schönhals
*bf
c,
Niina H.
Jalarvo
d,
Madhusudan
Tyagi
e,
Martin
Böhning
b and
Andreas
Schönhals
*bf
aForschungszentrum Jülich GmbH, Jülich Centre for Neutron Science (JCNS-1) and Institute for Biological Information Processing (IBI-8), Jülich 52425, Germany
bBundesanstalt für Materialforschung und -prüfung (BAM), Unter den Eichen 87, Berlin 12205, Germany. E-mail: Andreas.Schoenhals@bam.de; Tel: +49 30/8104-3384
cEastChem, School of Chemistry, David Brewster Road, University of Edinburgh, Edinburgh, EH9 3FJ, UK
dNeutron Scattering Division, OAK RIDGE National Laboratory, One Bethel Valley Rd, Oak Ridge, TN 37831, USA
eNIST Center for Neutron Research Gaithersburg MD 20899 and Department of Materials Science and Engineering, University of Maryland, College Park, MD 20742, USA
fInstitut für Chemie, Technische Universität Berlin, Straße des 17. Juni 135, Berlin 10623, Germany
First published on 13th June 2024
Abstract
Polymers of intrinsic microporosity exhibit a combination of high gas permeability and reasonable permselectivity, which makes them attractive candidates for gas separation membrane materials. The diffusional selective gas transport properties are connected to the molecular mobility of these polymers in the condensed state. Incoherent quasielastic neutron scattering was carried out on two polymers of intrinsic microporosity, PIM-EA-TB(CH3) and its demethylated counterpart PIM-EA-TB(H2), which have high Brunauer–Emmett–Teller surface area values of 1030 m2 g−1 and 836 m2 g−1, respectively. As these two polymers only differ in the presence of two methyl groups at the ethanoanthracene unit, the effect of methyl group rotation can be investigated solely. To cover a broad dynamic range, neutron time-of-flight was combined with neutron backscattering. The demethylated PIM-EA-TB(H2) exhibits a relaxation process with a weak intensity at short times. As the backbone is rigid and stiff this process was assigned to bend-and-flex fluctuations. This process was also observed for the PIM-EA-TB(CH3). A further relaxation process is found for PIM-EA-TB(CH3), which is the methyl group rotation. It was analyzed by a jump-diffusion in a three-fold potential considering also the fact that only a fraction of the present hydrogens in PIM-EA-TB(CH3) participate in the methyl group rotation. This analysis can quantitatively describe the q dependence of the elastic incoherent structure factor. Furthermore, a relaxation time for the methyl group rotation can be extracted. A high activation energy of 35 kJ mol−1 was deduced. This high activation energy evidences a strong hindrance of the methyl group rotation in the bridged PIM-EA-TB(CH3) structure.
1. Introduction
Separation processes based on polymeric membranes belong to the key technologies for sustainable energy supply in the future. Membrane technologies are energy and cost-efficient when compared to conventional approaches which are based on adsorption or cryogenic distillation. In addition, polymer-based membrane processes can be employed at large scales such as for the purification of natural gas as well as on smaller, local scales like the upgrading of biogas at farms.The most promising class of materials for the active separation layer in membranes are glassy polymers with a high free volume. This is due to the generally accepted model for gas transport in dense polymers, the solution diffusion mechanism.1 Following this mechanism the gas molecules are first adsorbed at one side of the membrane where the amount of adsorbed gas is described by their solubility S in the material. Driven by a gradient in concentration or chemical potential, the gas molecules then diffuse through the membrane. The diffusion process is based on individual jumps of gas molecules related to the molecular mobility of the surrounding polymer and is modeled by the diffusion coefficient D. The gas transport is then described by two key quantities. One parameter is the permeability P which describes mainly the flux of the gas molecules through the membrane.2,3 The permeability is given by the product P = S × D. As the purpose of such membranes is the separation of gases, the employed gas transport through the employed polymer should have a certain selectivity. This property of a membrane material is described by the second key quantity, the (perm)selectivity αab. The selectivity is defined as the ratio of the permeabilities of a gas pair a and b αab = Pa/Pb. Furthermore, it is known that more permeable membranes are less selective and vice versa. This trade-off relationship between permeability and selectivity is known as the Robeson upper bound and is represented in a double-logarithmic plot of selectivity αabversus the permeability Pa of the more permeable gas.2–6 Freeman and co-workers discussed a theoretical basis of the phenomenologically established Robeson upper bound.7,8
To optimize polymers for gas transport processes, new glassy polymers with an extremely high fractional free volume such as poly(trimethylsilylpropyne) (PTMSP)9 and poly(4-methyl-2-pentyne) (PMP)10,11 have been synthesized. The measured permeabilities of these polyacetylenes are orders of magnitude higher than those for conventional polymers like polysulfones. However, they suffer from a low permselectivity. Keeping the principal direction to synthesize polymers with a high free volume leads to novel classes of polymers partially having an intrinsic microporosity characterized by large values of Brunauer/Emmett/Teller (BET) surface areas in the range of several hundred m2 g−1. One class of those polymers are addition-polymerized polynorbornenes with a relatively stiff backbone and bulky side groups (see for instance12–16). In the case of these polynorbornenes, the microporosity arises from the semi-stiff backbone with bulky side groups mainly hindering conformational changes leading to an inefficient chain packing.
The second group of innovative high free volume macromolecules are polymers of intrinsic microporosity known as PIMs.17–20 In the case of PIMs, the intrinsic microporosity is related to a rigid ladder-type backbone with a contorted structure including for example spiro-centers. These structural features prevent an effective packing of the segments during solidification to a condensed state and result in the formation of an interconnected microporous network.21
Therefore, PIMs can be considered as materials with high permeabilities with at least reasonable values of permselectivities. This point is somehow surprising, given the interconnected microporous network structure a less selective Knudsen-like diffusion should be expected in contrast to an activated size-depending sieving process enabling a selective permeation.
In the framework of the solution diffusion model, the diffusion coefficient of a gas in a polymer membrane can be related to its effective size. This becomes clear when the diffusion of penetrant gas molecules is regarded as a series of individual jump events between free volume elements in the polymeric matrix that can accommodate the gas molecule. Such a jump can only occur when a channel between adjacent free volume elements exists – temporarily or permanently. Then, the minimal diameter of a gas molecule is the determining factor enabling its diffusion through a dynamic or static bottleneck. For the formation of a temporary connecting channel – related to the local molecular mobility of the polymeric matrix – this results in a diffusivity selectivity. In the case of a permanent channel, one should expect a kind of size sieving effect resulting in a fixed threshold rather than a size-dependent selectivity. In this context, often the effective kinetic diameter of a gas molecule is considered.4,22–24 For instance, for thermally rearranged polymers an almost linear relationship between the diffusion coefficient and the square of the effective diameter of the gas molecules is observed.25 However, for PIMs, a more detailed study shows that there is a less pronounced size dependence for gases with a small kinetic diameter like H2 and He compared to penetrant molecules with a larger kinetic diameter such as O2, CO2, N2 and CH4. Such a behavior is completely different from that found for glassy conventional polymers and thus this change might indicate a transition from a Knudsen-like to a dynamic selectivity. Additionally, from atomistic molecular dynamic simulations, it was retrieved that there are characteristic bottlenecks that form connections between different free volumes sites. These bottlenecks have sizes intermediate between the kinetic diameter of H2 and He and that of gas molecules with larger sizes.26,27 From these results one can conclude that penetrants with a smaller kinetic diameter can diffuse more or less without restrictions (Knudsen-like) while the diffusion of gas molecules with a larger kinetic diameter depends on the molecular dynamics of the bottlenecks which is in turn due to the molecular mobility of the polymer. Even localized molecular fluctuations can change the size of the bottleneck and so open or close gateways for the transport of gas molecules. Therefore, it is important to understand the molecular mobility of polymers of intrinsic microporosity.
Quasielastic neutron scattering has been employed to study the microscopic dynamics of high-performance polymers like polyacetylenes.28–30 As one important result it was found that the permeabilities for instance of CO2 or CH4 could be correlated to molecular fluctuations at a time scale of picoseconds at room temperature.28,30 Based on this correlation, a random gate model was developed by Kanaya et al.29 As discussed above, in this random gate model it was assumed that localized fluctuations can open or close bottlenecks between free volume sites or pores. Such investigations of the microscopic mobility of high-performance polymers were continued by further quasielastic neutron scattering experiments on the archetypical polymer of intrinsic microporosity PIM-1,31 and on microporous polynorbornenes.32 In these investigations, the methyl group dynamics is revealed which is characterized by jump diffusion in a three-fold potential. In addition to the microscopic dynamics the low frequency density of states was studied by inelastic neutron scattering for PIM-1, and for a series of microporous polynorbornenes with different values of the BET surface areas.33,34 As a main result, a correlation between the maximum frequency of the excess contribution to the Debye-like density of states and BET surface area was found.
In the presented study quasielastic neutron scattering is employed to investigate the microscopic dynamics of two polymers of intrinsic microporosity, PIM-EA-TB(CH3),35,36 and its demethylated counterpart PIM-A-TB(H2).37 Some results concerning the low frequency of states and elastic fixed window scans have been published elsewhere.38
2. Materials and methods
Materials
As the first polymer, PIM-EA-TB(CH3) is considered.35,36 The chemical structure of PIM-EA-TB(CH3) is given in Fig. 1a. A detailed description of the synthesis can be found elsewhere.35 The molecular weight of PIM-EA-TB(CH3) was estimated to be 156![[thin space (1/6-em)]](https://www.rsc.org/images/entities/char_2009.gif) 000 g mol−1 (PDI 3.8).39 For details of the estimation of the molecular weights see ref. 39. BET surface area measurements were carried out to characterize the microporosity of the polymer, and was found to be 1030 m2 g−1.39 The PIM-EA-TB(CH3) comes from the same synthesis batch as discussed in ref. 39. It is worth mentioning, that the methyl groups of PIM-EA-TB(CH3) are located at bridgehead positions.
000 g mol−1 (PDI 3.8).39 For details of the estimation of the molecular weights see ref. 39. BET surface area measurements were carried out to characterize the microporosity of the polymer, and was found to be 1030 m2 g−1.39 The PIM-EA-TB(CH3) comes from the same synthesis batch as discussed in ref. 39. It is worth mentioning, that the methyl groups of PIM-EA-TB(CH3) are located at bridgehead positions.
 | ||
| Fig. 1 Chemical structure of PIM-EA-TB(CH3) (left side) and PIM-EA-TB(H2) (right side). | ||
The stiff and contorted main chain structure of PIM-EA-TB(CH3) obstructs the segmental dynamics. Therefore, no glass transition temperature could be deduced by conventional DSC before the thermal degradation of the polymer. Nevertheless, by decoupling the kinetics of the glass transition and thermal degradation by fast scanning calorimetry, a glass transition temperature of 663 K is estimated for PIM-EA-TB(CH3) with a heating rate of 104 K s−1.40
For comparison with PIM-EA-TB(CH3), its demethylated counterpart PIM-EA-TB(H2) is considered too. PIM-EA-TB(H2) has the same backbone structure as PIM-EA-TB(CH3) but no methyl groups (see Fig. 1b). Details of the synthesis are given in ref. 37 where the molecular weight is found to be 62000 g mol−1 (PDI 2.3).39 The BET surface area was found to be 845 m2 g−1. For PIM-EA-TB(H2) the glass transition was not investigated yet by fast scanning calorimetry, but it is expected that the Tg value is in the same temperature range as found for PIM-EA-TB(CH3).
For comparison, data for PIM-1, the archetypal PIM, have been included, which are taken from ref. 31. The sample investigated here comes from the same batch as discussed in ref. 37. Moreover, data obtained for the high-performance polynorbornenes PTCNSi1 and PTCNSi2g are also discussed.32
To prepare the samples, the polymers were dissolved in chloroform. To reduce multiple scattering events, the concentration of the solutions was adjusted to have a final thickness of the films, which allows for approximately 10% neutron scattering. The obtained solution was cast into a mold made from PTFE. The mold with the sample form was placed in a closed box saturated with the vapor of chloroform. By that procedure, the initial evaporation of the solvent was controlled. A film was formed after three days and was transferred to a vacuum oven with an oil-free vacuum to be annealed at 343 K for a further three days to remove the solvent completely. For the neutron scattering experiments, the films were placed in flat Aluminum containers which were sealed by electro-welding. Aluminum is nearly transparent for neutrons.
Neutron scattering
Quasielastic neutron scattering is a suited technique to investigate molecular fluctuations at microscopic length and time scales. Information about the molecular fluctuations is extracted from the broadening of the spectra compared to the resolution of the instrument. To cover a reasonably broad dynamic range of more than 3 decades in time for the quasielastic neutron scattering experiments, neutron time-of-flight scattering was combined with neutron backscattering.The cold neutron disk chopper spectrometer DCS, operated at the NIST Center for Neutron Research, was employed as a time-of-flight spectrometer to measure the faster part of the molecular dynamics of both PIM-EA-TB(CH3) and PIM-EA-TB(H2).41 A standard configuration was used for the measurements which resulted in an energy resolution of 63…66 μeV (full width at half maximum of the energy resolution, depending slightly on the angle). The resolution of DCS was estimated by measuring the sample at a temperature of 4.1 K, by assuming that all molecular motions and vibrations are frozen except for zero-point quantum fluctuations. The DCS data were reduced by the MSLICE procedure of the DAVE software suite.42 The reduction includes an empty cell subtraction, conversion of TOF to energy transfer, vanadium normalization, and ‘flat plane’ self-shielding correction. A rebinning of the energy scale was not used to preserve the original resolution given by the TOF channels. The detectors in the angle range of 20° to 105° were used for analysis. ‘Negative angle’ detectors were not employed. An example of a measurement at DCS is given in Fig. 2a. With increasing temperature, a broadening of Sinc(q,ΔE) compared to the resolution is observed, indicating molecular fluctuations.
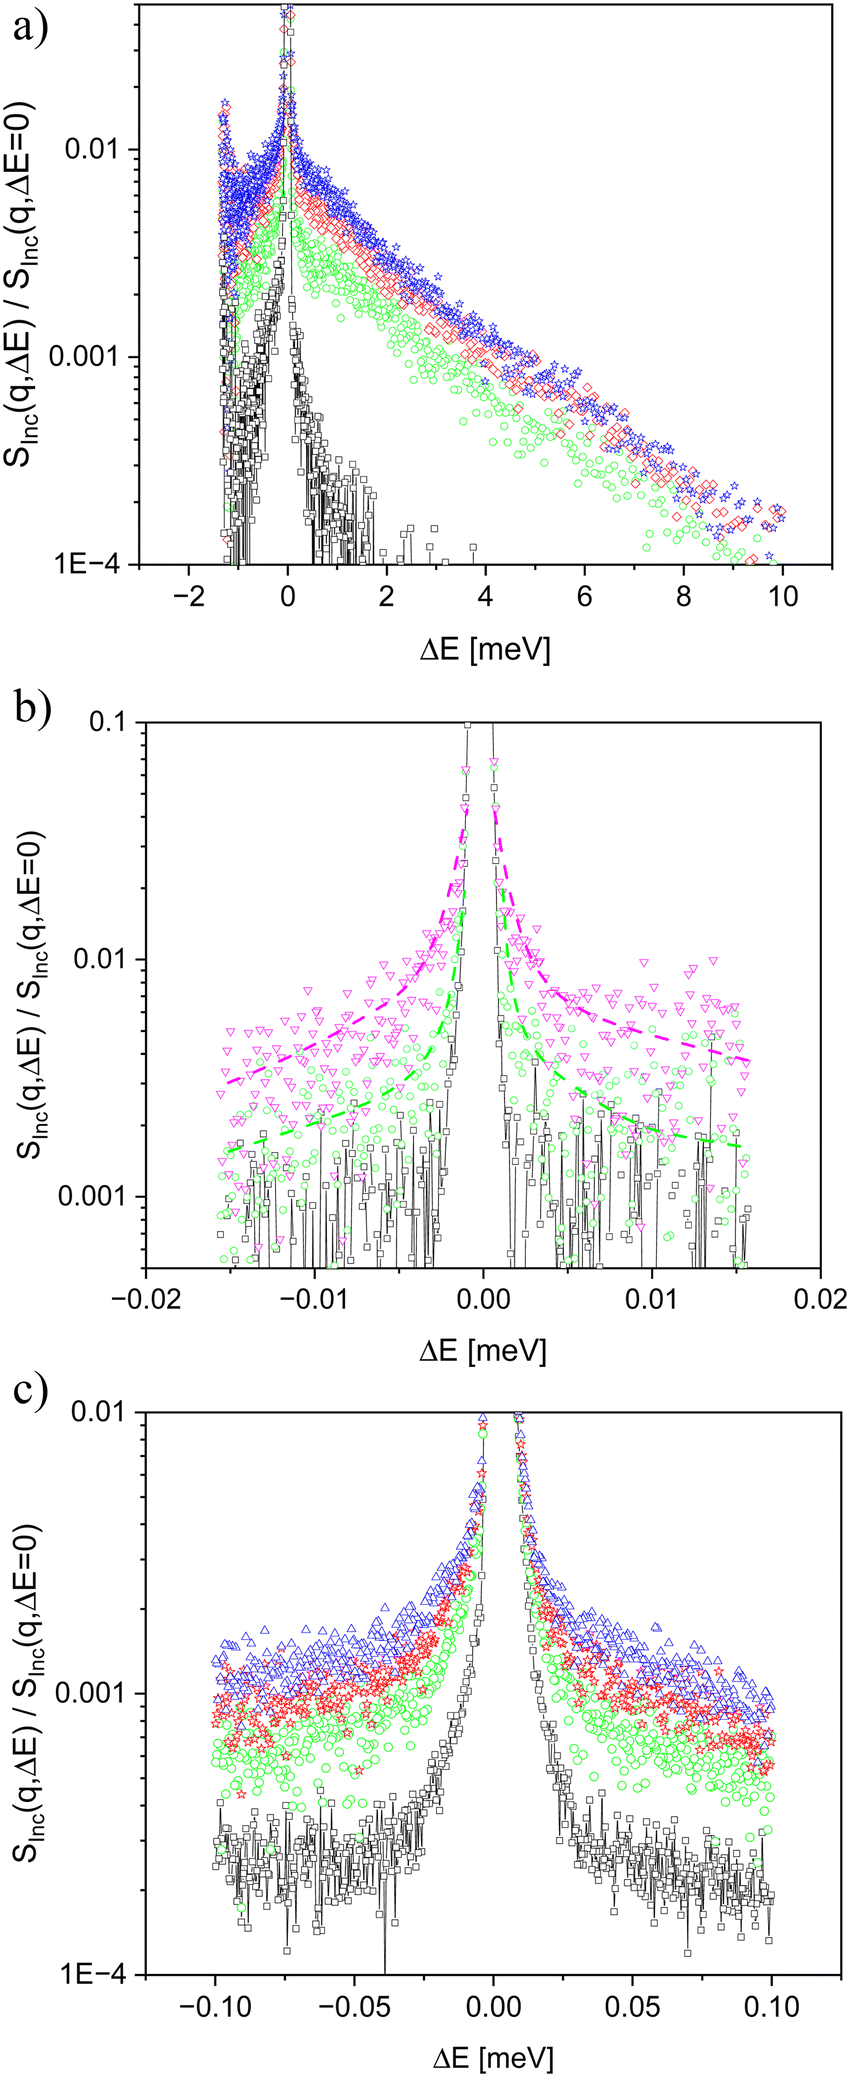 | ||
| Fig. 2 (a) Incoherent dynamical structure factor SInc(q,ΔE) versus energy transfer ΔE for PIM-EA-TB(CH3) normalized by the height of the elastic line measured at DCS at a q value of 1.6 Å−1: black – T = 4.1 K as resolution for DCS. Green – T = 240 K, red – T = 280 K and blue – T = 320 K. The errors of the data are mainly due to counting statistics and can be estimated from the deviation of the points from the guidelines. (b) Incoherent dynamical structure factor SInc(q,ΔE) versus energy transfer ΔE for PIM-EA-TB(CH3) normalized by the height of the elastic line measured at HFBS at an angle of 90.25°. Black – measurement at 4.6 K as resolution of HFBS. Green – T = 240 K, violet – T = 360 K. The dashed lines are guides to the eyes. The errors of the data are mainly due to counting statistics and can be estimated from the deviation of the points from the guidelines. (c) Incoherent dynamical structure factor SInc(q,ΔE) versus energy transfer ΔE for PIM-EA-TB(H2) normalized by the height of the elastic line measured at BASIS at q value of 1.6 Å−1. Black – Measurement at 30 K as resolution of BASIS. Green – T = 240 K, red – T = 280 K, blue – T = 320 K. The errors of the data are mainly due to counting statistics and can be estimated from the deviation of the points from the guidelines. | ||
For PIM-EA-TB(CH3), the high flux neutron backscattering spectrometer HFBS was used to carry out the backscattering experiments for this material.43 HFBS is operated at the NIST Center for Neutron Research. HFBS is a conventional (exact) backscattering spectrometer with a phase-space transformer to enhance the intensity. The analyzers are Si 111 crystals, defining a final energy of the neutrons to 2.08 meV, corresponding to a wavelength of 6.271 Å. The energy resolution was >0.9 μeV (FWHM) for the detectors above a 40° scattering angle and 0.9…1.2 μeV below. The energy range was limited by the maximal speed of the Doppler drive to –15.6 μeV … +15.6 μeV. The q range covered by the detectors is 0.25…1.75 Å−1. The resolution of HFBS was estimated by measuring the sample at 4.6 K (see above). The data reduction was done using DAVE, with an HFBS-specific module provided by NIST. The data reduction comprises the normalizations necessary for backscattering spectra, and subtraction of background from an empty cell. The original files contain data from 16 detectors over the whole q range. These were averaged to 0.31, 0.51, 0.68, 0.99, 1.32, 1.60 Å−1. An example of raw spectra of PIM-EA-TB(CH3), measured at HFBS is depicted in Fig. 2b. Like for the time-of-flight experiments, the broadening of the spectra is due to molecular motions.
For the slower part of the dynamics of PIM-EA-TB(H2), the (near-)backscattering spectrometer BASIS was used.44 BASIS is operated at the spallation neutron source, at the Oak Ridge National Laboratories (ORNL). In contrast to HFBS, it does not use a monochromator but employs a time-of-flight (TOF) measurement to determine the incident energy of the neutrons. In relation to conventional TOF instruments (such as DCS), this principle is often called an “inverse geometry time-of-flight” spectrometer. On spallation sources, such instruments make efficient use of the neutron pulses. Also, the energy transfer range is larger, because no energy offset energy by a Doppler drive is necessary. Due to technical restrictions, it is not possible to put the analyzers in exact backscattering orientation. This reduces the resolution, compared to exact backscattering instruments such as HFBS.
In the actual experiment, Si 111 analyzers were used, fixing the final energy of the neutrons to 2.08 meV, corresponding to a wavelength of 6.271 Å. The energy resolution was 3.0…3.5 μeV (FWHM, increasing with scattering angle), and the energy transfer range was −100… +100 μeV. Compared to HFBS, the accessible dynamic range is similar but shifted by a factor of three towards faster dynamics. The range of the q vectors of 0.3…1.9 Å−1 is comparable to that of HFBS. The resolution of BASIS was estimated by measuring the sample at a temperature of 30 K. Unfortunately, no lower temperatures than 30 K can be accessed by the employed cryostat. The primary data reduction was done on the data analysis cluster of ORNL, using the module BASISReduction in Mantid. The q bins were chosen as 0.3, 0.5, 0.7, 1.0, 1.3, 1.6 ± 0. Å. Subtraction of the empty cell was done on the reduced data, with a transmission factor of 0.9. An example of raw data measured on BASIS is represented in Fig. 2c for PIM-EA-TB(H2). Again, the broadening of spectra indicates the onset of molecular motions.
3. Result and discussion
Quasielastic neutron scattering senses molecular fluctuations on microscopic length and time scales.45 This is due to the wavelength and energy of neutrons. Related to the spatial and time information content of a quasielastic neutron scattering experiment, the basic experimental quantity is the double differential cross-section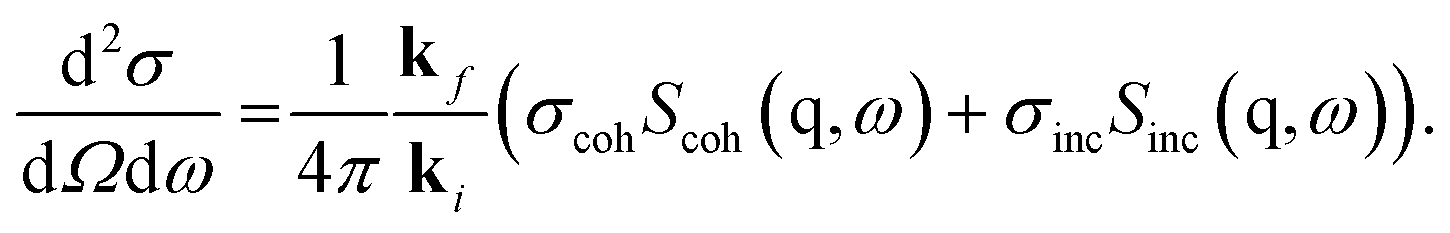 | (1) |
The radial frequency ω is connected to the experimentally measured energy transfer ΔE by ΔE = ℏω, where ℏ is Planck's constant divided by 2π. The solid angle of detection is denoted by Ω. ki and kf symbolize the incidental and final wave vector of the neutron beam. The scattering vector is given by q = kf − ki. In the following, q denotes the modulus of the scattering vector. The cross-sections σcoh and σinc for coherent and incoherent scattering provide the contrast. Scoh(q,ω) and Sinc(q,ω) are the coherent and incoherent dynamic structure factors (scattering functions). Their contributions to the double differential cross-section are weighted by σcoh and σinc. It should be noted that Scoh(q,ω) results from two-particle correlations, while the incoherent counterpart Sinc(q,ω) is due to self-correlations. As discussed in ref. 38, and provided by Fig. 1 both considered compounds consist of carbon (C), hydrogen (H), and nitrogen (N). For the methylated PIM-EA-TB(CH3), this gives macroscopic cross-sections per volume to σcoh = 0.0421 mm−1 and σinc = 0.3896 mm−1. For the demethylated counterpart, 0.0416 mm−1 and 0.3438 mm−1 are calculated for σcoh and σinc respectively. The ESI of ref. 38 provides details of the calculation of the scattering cross-sections. The large difference in the values obtained for σcoh and σinc indicates that the observed scattering is predominantly incoherent.
The difference in the energy resolution in the neutron time-of-flight and the neutron backscattering is large (see Fig. 2). To analyze the data from time-of-flight and backscattering jointly, SInc(q,ΔE) measured at both spectrometers were Fourier transformed and divided by the corresponding Fourier transform of the resolution. So, absolute values of the incoherent intermediate scattering function SInc(q,t) were obtained. Fig. 3 depicts SInc(q,t) for PIM-EA-TB(H2) measured at DCS and BASIS at different temperatures for q = 1.3 Å. This figure shows how the data for DCS and BASIS can be combined in the time domain.
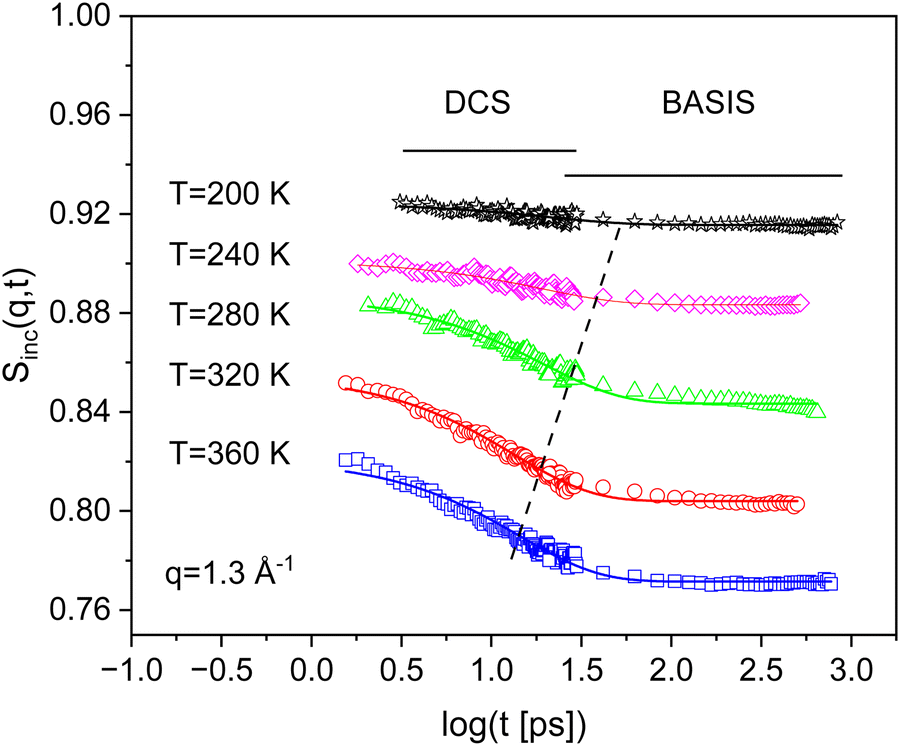 | ||
| Fig. 3 Incoherent intermediate scattering function SInc(q,t) for PIM-EA-TB(H2) versus time for the indicated temperatures at the q vector of 1.3 Å−1. The error of the data is smaller than the size of the symbols. The solid lines are fit of eqn (2) to the corresponding data. | ||
Bend-and-flex fluctuations for PIM-EA-TB(H2)
The incoherent intermediate scattering function SInc(q,t) measured for PIM-EA-TB(H2) shows a step-like decay versus time indicating a relaxation process (see Fig. 3). The step-like decay shifts to shorter times with increasing temperature. This behavior supports the assignment of this mode as a relaxation process. Colmenero et al. assigned such a behavior to the onset of fast dynamics caused by carbon–carbon torsional fluctuations.46 These carbon–carbon fluctuations are considered as precursor for the glass transition. The structure of the backbone of PIM-EA-TB(H2) is rigid and stiff. Considering this structure, it seems not possible for molecular motions like rotations or even carbon–carbon torsional fluctuations to be the origin of such a relaxation. However, detailed atomistic molecular dynamic simulations reveal some localized fluctuations denoted as bend-and-flex fluctuations for a comparable PIM structure.47,48 For PIM-1 the fluctuations are due to the bending and flex motion of the dioxan and spirobifluorene (SBI) structure. Such localized fluctuations can also occur in the PIM-EA-TB backbone. For that reason, the relaxation process observed for PIM-EA-TB(H2) is assigned to these bend-and-flex fluctuations of the backbone. Recently the glass transition of PIM-149 and PIM-EA-TB40 has been also assigned to cooperative bend-and-flex fluctuation. As discussed in ref. 46, the process observed here by neutron scattering might be considered as precursor for the glass transition in PIMs.As suggested in ref. 46 the time the dependence of the incoherent intermediate scattering function for PIM-EA-TB(H2) is analyzed by an exponential function
 | (2) |
Here DWF symbolizes the Debye–Waller factor, EISF denotes an elastic incoherent structure factor and, τ a relaxation time. Fig. 3 shows that the data can be well described by that approach. From the fits the relaxation time τ is obtained. For a localized process the relaxation time should not depend on the scattering vector q. Therefore, the relaxation time τ of the bend-and-flex fluctuations is plotted for q = 1.3 Å−1versus inverse temperature in the activation or Arrhenius diagram (Fig. 4).
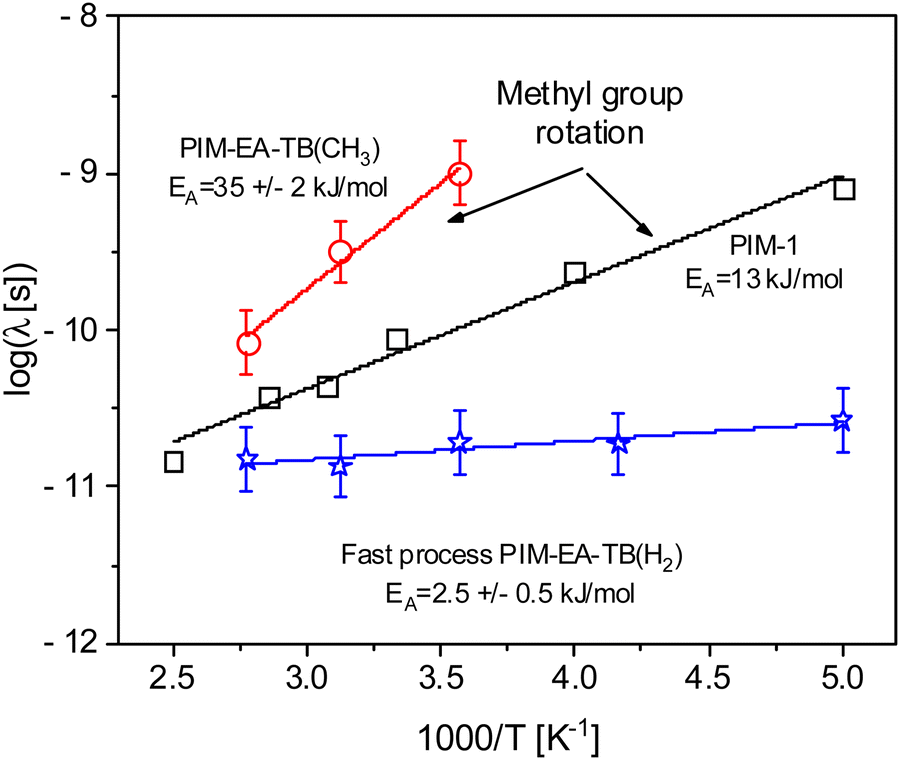 | ||
| Fig. 4 Relaxation time τ versus inverse temperature: red circles methyl group rotation PIM-EA-TB(CH3), black squares methyl group rotation PIM-1, blue asterisk – fast process (bend-and-flex fluctuations) for PIM-EA-TB(H2). The lines are fits of the Arrhenius equation (eqn (3)) to the corresponding data. | ||
The data can be well described by the Arrhenius equation which is given by
 | (3) |
E A is the activation energy and τ∞ denotes the relaxation time at infinite temperatures. R symbolizes the general gas constant. The fit of eqn (3) gives a rough estimation for the activation energy of 2.5 kJ mol−1 for the fast process of PIM-EA-TB(H2). This value is a bit lower than the data reported for carbon–carbon torsional fluctuations reported in ref. 46. Fig. 3 shows that the intensity of the relaxation process due to the bend-and-flex fluctuations is quite low. Therefore, it can be analyzed only for the two highest q vectors and the dependence on the scattering vector cannot be discussed.
Methyl group rotation for PIM-EA-TB(CH3)
Fig. 5 compares the incoherent intermediate scattering function for PIM-EA-TB(H2) and PIM-EA-TB(CH3) at T = 240 K and a scattering vector of 1.3 Å. As for PIM-EA-TB(H2) also for PIM-EA-TB(CH3) a relaxation process with a weak intensity is observed for short times. This process is also assigned to bend-and-flex fluctuations as the backbone of both polymers is identical. Besides this process, a further relaxation process is visible at longer times than those characteristic for the bend-and-flex fluctuations. The only structural difference between PIM-EA-TB(CH3) and PIM-EA-TB(H2) is that the former has methyl groups while the latter has none. Therefore, the additional relaxation process observed for PIM-EA-TB(CH3) must be assigned to the methyl group rotation. Fig. 6 depicts the incoherent intermediate scattering function for PIM-EA-TB(CH3) at T = 280 K for different scattering vectors. As for PIM-EA-TB(H2) the neutron time-of-flight and the neutron backscattering data can be well combined in the time domain.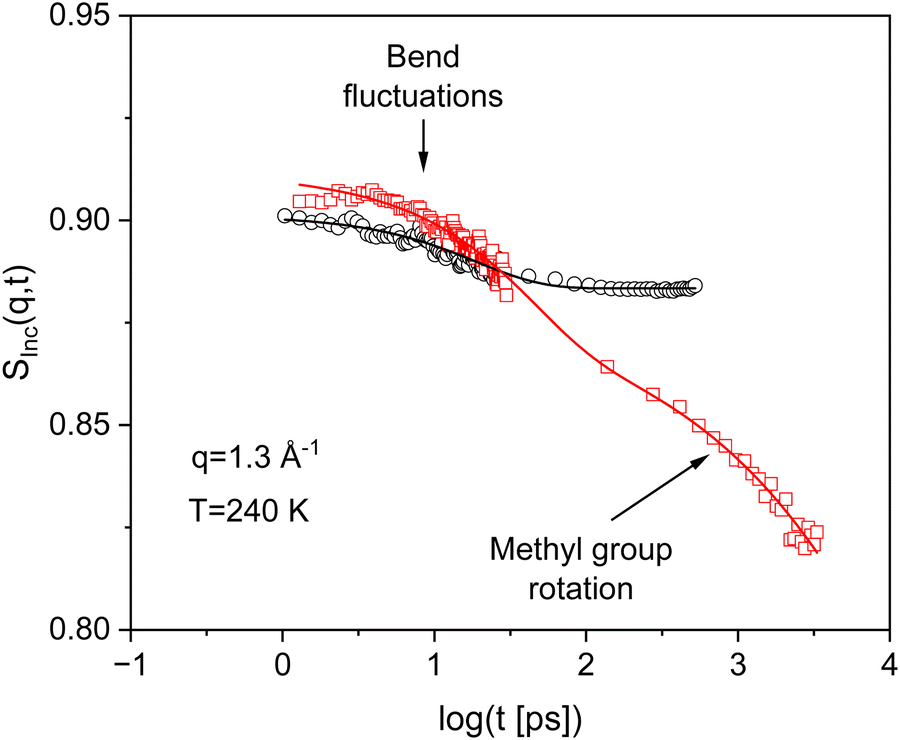 | ||
| Fig. 5 Incoherent intermediate scattering function SInc(q,t) for PIM-EA-TB(H2) (black circles) and PIM-EA-TB(CH3) (red squares) versus time for the indicated q vector and temperature. The error of the data is smaller than the size of the symbols. The black solid line is a fit of eqn (2) to the data of PIM-EA-TB(H2). The red solid line is fit of eqn (4b) to the data of PIM-EA-TB(CH3). | ||
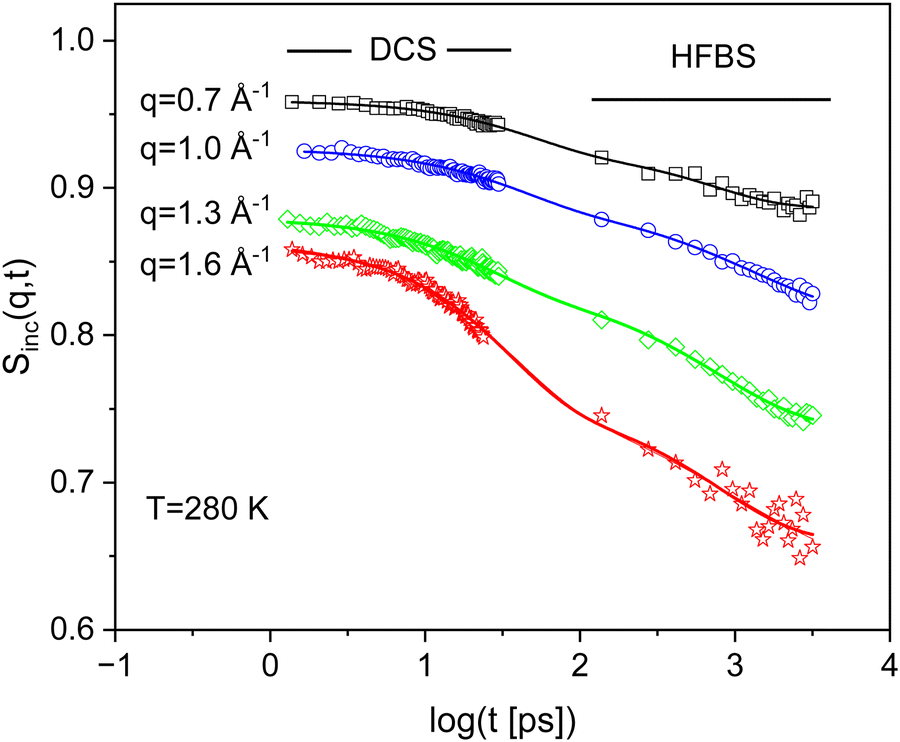 | ||
| Fig. 6 Incoherent intermediate scattering function SInc(q,t) for PIM-EA-TB(CH3) versus time for the indicated q values at T = 280 K. The error of the data is smaller than the size of the symbol. The solid lines are fit of eqn (4b) to the corresponding data. | ||
The standard model for the methyl rotation is the rotation rate distribution model (RRDM).50 To simplify the analysis, here a stretched exponential function is employed to describe the time dependence of SInc(q,t) for the methyl group rotation. The fitting function only for the methyl group contribution to SInc(q,t) then reads
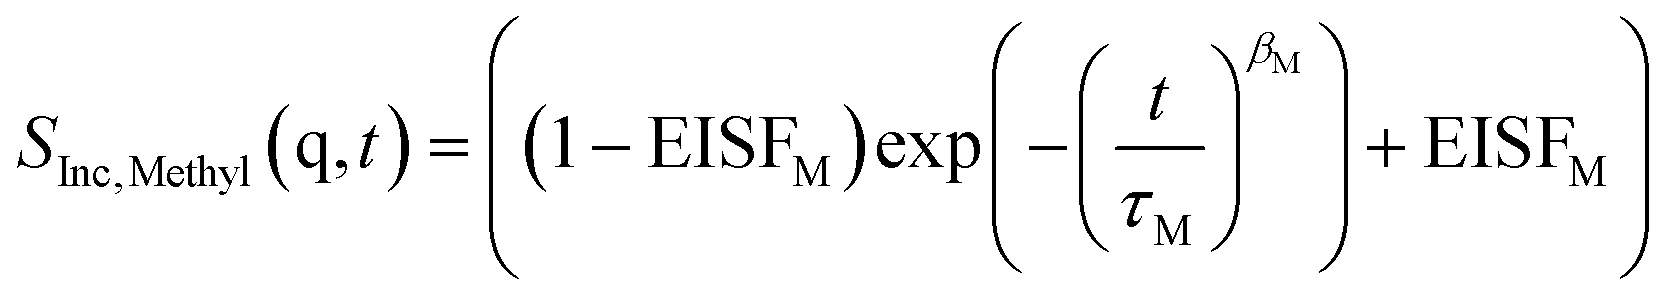 | (4a) |
EISFM is the elastic incoherent structure factor for the methyl group rotation, τM is the corresponding relaxation time, and βM is the stretching parameter. To take into account the fast process discussed above the scattering function due to the bend-and-flex fluctuations must be considered in addition to eqn (4a). The appearance of two relaxation processes leads to a convolution of their scattering functions in energy or frequency domains. In the time domains which is considered here the convolution is reduced to a product. Therefore, the whole fit function reads
| SInc(q,t) = DWF × S(q,t)Inc,Bend × S(q,t)Inc,Methyl | (4b) |
For processes that are well separated concerning to their relaxation time, the product can be replaced by a sum.51,52 Such an approach cannot be employed here as both processes overlap in time and a second elastic incoherent structure factor EISFMethyl is involved in addition to EISF related to the bend-and-flex fluctuations. Therefore, the exact eqn (4b) is fitted to the data. Fig. 6 shows that the data for PIM-EA-TB(CH3) can be well modeled by eqn (4b).
The elastic incoherent structure factor for the methyl group can be most straightforwardly calculated by a jump-diffusion in a three-fold potential V(ϕ) ∼ (1 − cos(3ϕ))/2.50,53 In this model concerning to the rotation angle ϕ of the methyl group three equivalent energy minima are considered. Employing this model for the EISFM of the methyl groups
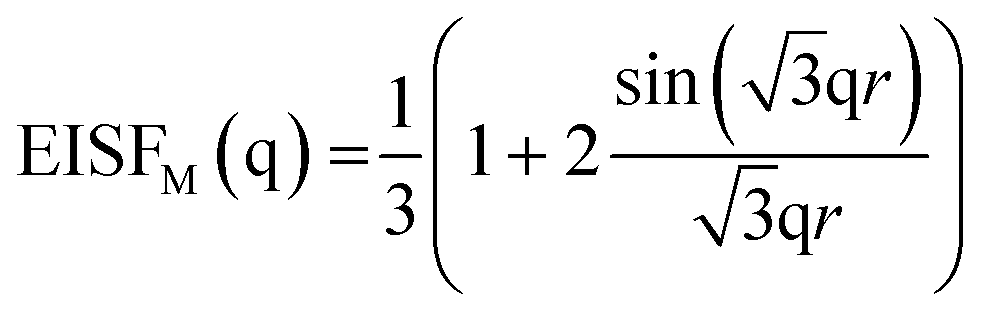 | (5) |
The estimated elastic incoherent structure for the methyl group rotation is plotted versus the q vector in Fig. 7. A comparison of the experimental data with the dependence given by eqn (5) reveals that the experimental result does not follow the theoretical prediction. To discuss this discrepancy, one must consider the number of hydrogens that undergo the methyl rotation in comparison to the whole number of hydrogens in the repeating unit. PIM-EA-TB(CH3) has 21 hydrogen nuclei in the repeating unit while only 6 are in the two methyl groups. Therefore, 15 hydrogen nuclei do not contribute to the methyl group rotation and scatter elastically in the temperature where the methyl group rotation takes place. The number fraction of hydrogen nuclei that scatter elastically Cfix is calculated from the chemical structure of PIM-EA-TB(CH3) to be (21-6)/21 = 0.714. This number fraction must be considered by evaluation eqn (5) by31,32,54,55
| EISFM,corr(q) = (1 − Cfix)EISFM(q) + Cfix | (6) |
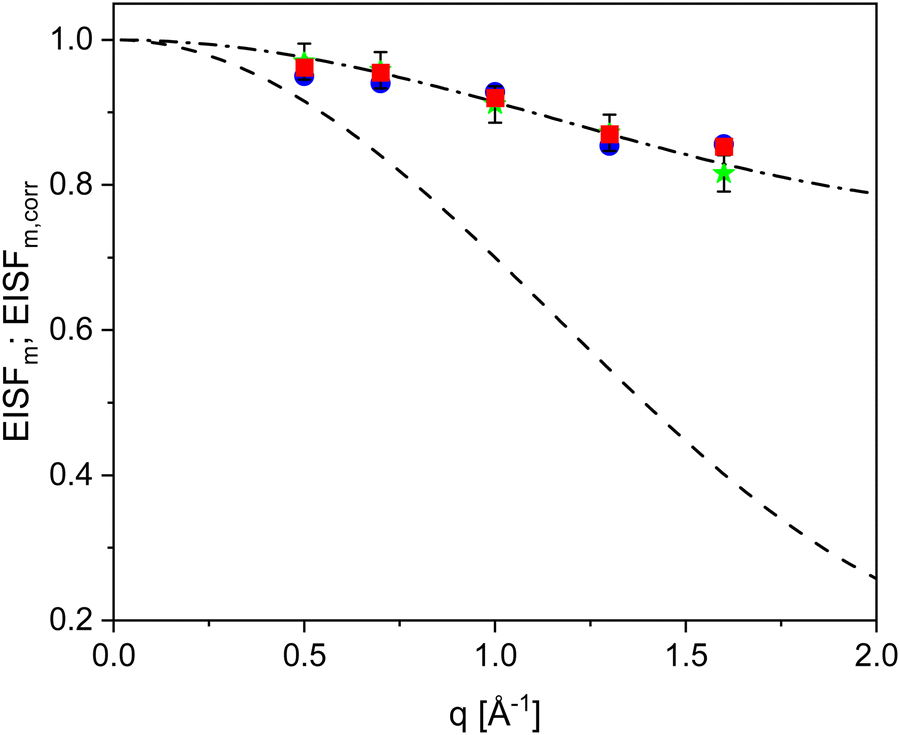 | ||
| Fig. 7 Elastic incoherent structure factor for the methyl group rotation versus the scattering vector. Green asterisks – T = 280 K, blue circles – T = 320 K. Red squares – T = 360 K. Dashed line three-fold jump diffusion according to eqn (5). Dashed-dotted line prediction of eqn (6) with a value of Cfix of 0.714 according to the structure of PIM-EA-TB(CH3). Typical error bars are added for the data of 280 K. | ||
Fig. 7 reveals that the experimental data points can be well described by eqn (6) with a value of Cfix of 0.714. This quantitative agreement between the experimental data and the prediction of the modified three-fold jump model evidence that the second relaxation process observed for PIM-EA-TB(CH3) is due to the methyl group rotation. There seems to be a slight deviation of the experimental data from the prediction for the lowest value of the q vector. These deviations might be due to multiple scattering. However, the data also show that the possible influence of a multiple scattering is around one percent. As this is in the range of the error of the measurement and therefore the data are not corrected for multiple scattering events as suggested elsewhere.51
From the fit of the data also a relaxation time for the methyl group rotation can be deduced. As the methyl group rotation is a localized process, the relaxation time should not be dependent on the q vector. Therefore, an arithmetically q averaged value is considered. The obtained data are given in Fig. 4. The temperature dependence of the relaxation time of the methyl group rotation can be described by an Arrhenius equation. The fit of eqn (3) to the data reveals an activation energy of 35 kJ mol−1 with a prefactor of log(τ∞ [ps]) = −14. This value is much higher than the activation energies obtained for the methyl group rotation of PIM-131 as well as for the high-performance polynorbornenes PTCNSi1 and PTCNSi2g.32 Therefore, one has to conclude that the methyl group rotation in these bridged PIM-EA-TB(CH3) is more hindered than for other materials. This is further evidenced by the relatively high value of the prefactor which indicates in an Eyring approach a high value of the activation entropy.56 NMR techniques have been employed to study the methyl group rotation in low molecular model compounds.
For 9,10-dimethylethanoantracene an activation energy of ca. 14 kJ mol−1 was found by 1H NMR in solution.57 Using 13C solid state NMR gives a value for the methyl group rotation of ca. 25 kJ mol−1 for 9-methyl triptycene.58 It might not be that straightforward to compare the activation energies for a polymer to low molecular weight compounds in solution or the crystalline state. Nevertheless, the high values of the activation energies for the model molecules evidence further that the group in bridgehead positions is hindered.
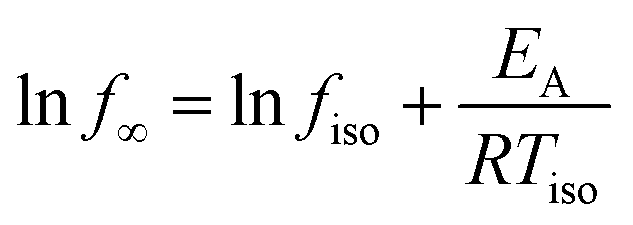
In Fig. 8 the prefactor for the methyl group rotation is plotted versus the activation energy of the methyl group rotation for polymers including PIM-1 as well as the high-performance polynorbornenes PTCNSi1 and PTCNSi2 in a kind of compensation diagram (Meyer–Neldel plot).59–61 Also data for poly(methyl phenyl siloxane) (PMPS)55 as an example of a simple polymer with a flexible backbone and Matrimid31 with a more rigid mainchain have been included in this plot. The Meyer-Neldle or compensation law is observed for a variety of processes like diffusive processes, charge transfer in conductors or the denaturation of proteins, just to mention a few. A more detailed compilation can be found ref. 62. Recently it was shown by Thoms et al. that the slow Arrhenius (SAP) process found for glass forming materials also obeys the compensation law.62 The Meyer-Neldle law can be expressed by
 | (7) |
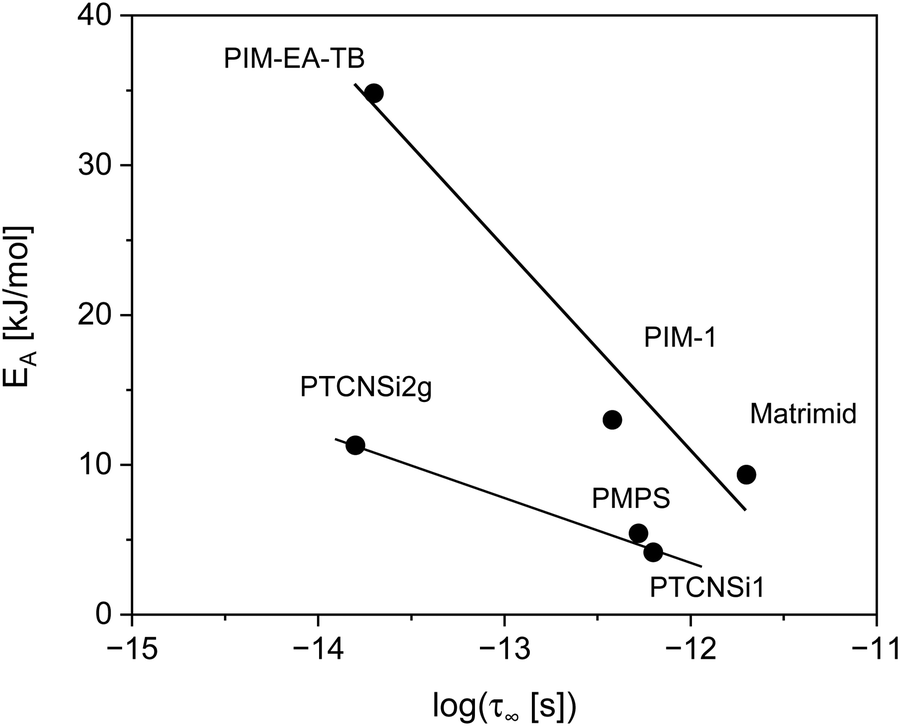 | ||
| Fig. 8 Activation energy for the methyl group rotation versus log(τ∞ [ps]) for different polymers as indicated. The data for PIM-1 and Matrimid were taken from ref. 31. The date for PTCNSi1 and PTCNSi2g were taken from ref. 32. The data for PMPS were taken from ref. 55. | ||
T iso is here a so-called isokinetic temperature where all processes occur at the same rate fiso.
Fig. 8 shows that the data fall into two different groups represented by two different lines one for the polymers with a more flexible backbone and one for those having a rigid, mainly aromatic ladder-type mainchain. Both groups reveal different behavior for these distinct groups of polymers. There is some agreement in the literature that the molecular origin of the Meyer–Neldel law is the cooperativity of the underlying molecular fluctuations.60,63 Therefore, it might be concluded that cooperative effects influence the methyl group rotation for all cases presented in Fig. 8. Considering the different slopes of the linear relations these effects are distinctly stronger for the rigid main chain polymers in comparison to the polymers having a flexible backbone. Unfortunately, the number of data points given for each group in Fig. 8 is too low to extract a value for Tiso unambiguously.
4. Conclusion
Quasielastic neutron scattering has been carried out for PIM-EA-TB(CH3) and its demethylated counterpart PIM-EA-TB(H2). Both polymers belong to the group of polymers of intrinsic microporosity which are in general promising candidates for the active separation layer in polymer-based gas separation membranes. Due to the wavelength and energy of cold neutrons, the molecular fluctuations of these polymers can be studied on microscopic time and length scales.To cover a reasonably broad time range in the intermediate (time dependent) scattering function neutron time-of-flight was combined with neutron backscattering. For the time-of-flight measurements, the spectrometer DCS (NIST Center for Neutron Research) was employed. For neutron backscattering two different spectrometers were utilized. For PIM-EA-TB(CH3) the exact backscattering instrument HFBS (NIST Center for Neutron Research) is used while for PIM-EA-TB(H2) the (near)backscattering spectrometer BASIS (Oak Ridge National Laboratory) was employed. As the energy resolution of the time-of-flight spectrometer (DCS) is larger than that of the backscattering spectrometers (HFBS, BASIS) the data obtained from both kinds of spectrometer were Fourier transformed and divided by the Fourier transform of the resolution. By this approach, absolute values of the intermediate scattering function were obtained.
For the demethylated PIM-EA-TB(H2) a single relaxation process with a weak intensity was observed at short times. As no mobile groups are present in the structure of PIM-EA-TB(H2) and its backbone is stiff and rigid with no torsional degrees of freedom this process was assigned to bend-and-flex fluctuations of the backbone. Such fluctuations were evidenced earlier for PIM-1 which exhibits a comparable backbone structure. From a quantitative analysis, a low activation energy of 2.5 kJ mol−1 was estimated for this process.
For the methylated PIM-EA-TB(CH3) the relaxation due to bend-and-flex fluctuations is also observed as the backbone is identical for both polymers. In addition to this process, another relaxation process is found. As the presence of methyl groups in the structure PIM-EA-TB(CH3) is the only difference to that of PIM-EA-TB(H2) this process only observed for PIM-EA-TB(CH3) must be assigned to the methyl groups which can rotate. The q vector dependence of the estimated elastic incoherent structure factor of the methyl group rotation is discussed according to jump diffusion in a three-fold potential. For a quantitative comparison, one must consider that only a fraction of protons in the structure of PIM-EA-TB(CH3) participate in the methyl group rotation. This approach describes the experimental data well. In turn, from this agreement, one can further confirm that this process is due to the methyl group rotation. Moreover, for the analysis of the data, a relaxation time can be deduced. From the temperature dependence of the relaxation time, an activation energy of 35 kJ mol−1 was estimated. From this rather high value of the activation energy in comparison to the methyl group rotation of other polymers, it is concluded that the methyl group rotation in PIM-EA-TB(CH3) is considerably hindered than in other polymers.
Data availability
The data are part of a running research project. Data will be available by reasonable request from the corresponding author.Conflicts of interest
The authors declare no competing financial interest.Acknowledgements
Access to HFBS was provided by the Centre for High Resolution Neutron Scattering, a partnership between the National Institute of Standards and Technology and the National Science Foundation under agreement no. DMR-2010792. A portion of this research used resources at the Spallation Neutron Source, a DOE Office of Science User Facility operated by the Oak Ridge National Laboratory. RME and NBMK acknowledge the Engineering and Physical Science Research Council, UK, for funding through the programme grant SynHiSel (EP/V047078).References
- J. G. Wijmans and R. W. Baker, The solution-diffusion model: a review, J. Membr. Sci., 1995, 107, 1–21 CrossRef CAS.
- R. W. Baker, Membrane Technology and Applications, John Wiley & Sons, Chichester, UK, 2004 Search PubMed.
- Y. Yampolskii, Polymeric gas separation membranes, Macromolecules, 2012, 45, 3298–3311 CrossRef CAS.
- L. M. Robeson, The upper bound revisited, J. Membr. Sci., 2008, 320, 390–400 CrossRef CAS.
- R. Swaidan, B. Ghanem and I. Pinnau, Fine-Tuned Intrinsically Ultramicroporous Polymers Redefine the Permeability/Selectivity Upper Bounds of Membrane-Based Air and Hydrogen Separations, ACS Macro Lett., 2015, 4, 947–951 CrossRef CAS.
- B. Comesaña-Gándara, J. Chen, C. G. Bezzu, M. Carta, I. Rose, M.-C. Ferrari, E. Esposito, A. Fuoco, J. C. Jansen and N. B. McKeown, Redefining the Robeson upper bounds for CO2/CH4 and CO2/N2 separations using a series of ultrapermeable benzotriptycene-based polymers of intrinsic microporosity, Energy. Environm. Sci., 2019, 12, 2733–2740 RSC.
- B. D. Freeman, Basis of permeability/selectivity tradeoff relations in polymeric gas separation membranes, Macromolecules, 1999, 32, 375–380 CrossRef CAS.
- L. M. Robeson, B. D. Freeman, D. R. Paul and B. W. Rowe, An empirical correlation of gas permeability and permselectivity in polymers and its theoretical basis, J. Membr. Sci., 2009, 341, 178–185 CrossRef CAS.
- T. Higashimura, T. Masuda and M. Okada, Gas Permeability of Polyacetylenes with Bulky Substituents, Polym. Bull., 1983, 10, 114–117 CrossRef CAS.
- T. Masuda, M. Kawasaki, Y. Okano and T. Higashimura, Polymerization of Methylpentynes by Transition Metal Catalysts: Monomer Structure, Reactivity, and Polymer Properties, Polym. J., 1982, 14, 371–377 CrossRef CAS.
- A. Morisato and I. Pinnau, Synthesis and Gas Permeation Properties of Poly(4-methyl-2-pentyne), J. Membr. Sci., 1996, 121, 243–250 CrossRef CAS.
- P. P. Chapala, M. V. Bermeshev, L. E. Starannikova, N. A. Belov, V. E. Ryzhikh, V. P. Shantarovich, V. G. Lakhin, N. N. Gavrilova, Y. P. Yampolskii and E. S. Finkelshtein, A Novel, Highly Gas-Permeable Polymer Representing a New Class of Silicon-Containing Polynorbornens as Efficient Membrane Materials, Macromolecules, 2015, 48, 8055–8061 CrossRef CAS.
- M. Gringolts, M. Bermeshev, Y. Yampolskii, L. Starannikova, V. Shantarovich and E. Finkelshtein, New High Permeable Addition Poly(tricyclononenes) with Si(CH3)3 Side Groups. Synthesis, Gas Permeation Parameters, and Free Volume, Macromolecules, 2010, 43, 7165–7172 CrossRef CAS.
- M. A. Zotkin, D. A. Alentiev, S. Shorunov, S. E. Sokolov, N. N. Gavrilova and M. V. Bermeshev, Microporous polynorbornenes bearing carbocyclic substituents. Structure-property study, Polymer, 2023, 269, 125732 CrossRef CAS.
- D. A. Alentiev and M. Bermeshev, Design and synthesis of porous organic polymeric materials from norbornene derivatives, Polym. Rev., 2021, 38, 430–437 Search PubMed.
- X. Wang, T. J. Wilson, D. Alentiev, M. Gringolts, E. Finkelshtein, M. Bermeshev and B. K. Long, Substituted polynorbornene membranes: a modular template for targeted gas separations, Polym. Chem., 2021, 12, 2947–2977 RSC.
- P. M. Budd, K. J. Msayib, C. E. Tattershall, B. S. Ghanem, K. J. Reynolds, N. B. McKeown and D. Fritsch, Gas Separation Membranes from Polymers of Intrinsic Microporosity, J. Membr. Sci., 2005, 251, 263–269 CrossRef CAS.
- M. Carta, R. Malpass-Evans, M. Croad, Y. Rogan, J. C. Jansen, P. Bernardo, F. Bazzarelli and N. B. McKeown, An Efficient Polymer Molecular Sieve for Membrane Gas Separations, Science, 2013, 339, 303–307 CrossRef CAS.
- Y. Wang, B. S. Ghanem, Y. Han and I. Pinnau, State-of-the-art polymers of intrinsic microporosity for high-performance gas separation membranes, Curr. Opin. Chem. Eng., 2022, 35, 100755 CrossRef.
- R. Swaidan, B. Ghanem, E. Litwiller and I. Pinnau, Physical Aging, Plasticization and Their Effects on Gas Permeation in “Rigid” Polymers of Intrinsic Microporosity, Macromolecules, 2015, 48, 6553–6561 CrossRef CAS.
- M. Heuchel, D. Fritsch, P. M. Budd, N. B. McKeown and D. Hofmann, Atomistic Packing Model and Free Volume Distribution of a Polymer with Intrinsic Microporosity (PIM-1), J. Membr. Sci., 2008, 318, 84–99 CrossRef CAS.
- D. W. Breck, Zeolite Molecular Sieves: Structure, Chemistry, and Use. J. Wiley & Sons, New York, 1974 Search PubMed.
- V. Teplyakov and P. Meares, Correlation aspects of the selective gas permeabilities of polymeric materials and membranes, Gas Sep. Purif., 1990, 4, 66–74 CrossRef CAS.
- L. M. Robeson, Z. P. Smith, B. D. Freeman and D. R. Paul, Contributions of diffusion and solubility selectivity to the upper bound analysis for glassy gas separation membranes, J. Membr. Sci., 2014, 453, 71–83 CrossRef CAS.
- L. M. Robeson, M. E. Dose, B. D. Freeman and D. R. Paul, Analysis of the transport properties of thermally rearranged (TR) polymers and polymers of intrinsic microporosity (PIM) relative to upper bound performance, J. Membr. Sci., 2017, 525, 18–24 CrossRef CAS.
- A. Fuoco, C. Rizzuto, E. Tocci, M. Monteleone, E. Esposito, P. M. Budd, M. Carta, B. Comesañ-Gándara, N. B. McKeown and J. C. Jansen, The origin of size-selective gas transport through polymers of intrinsic microporosity, J. Mater. Chem. A, 2019, 7, 20121–20126 RSC.
- M. Mazo, M. Balabaev, A. Alentiev and Y. Yampolskii, Molecular Dynamics Simulation of Nanostructure of High Free Volume Polymers with SiMe3 Side Groups, Macromolecules, 2018, 51, 1398–1408 CrossRef CAS.
- R. Inoue, T. Kanaya, T. Masuda, K. Nishida and O. Yamamuro, Relationship between the Local Dynamics and Gas Permeability of Para-Substituted Poly(1-chloro-2-phenylacetylenes), Macromolecules, 2012, 45, 6008–6014 CrossRef CAS.
- T. Kanaya, M. Teraguchi, T. Masuda and K. Kaji, Local mobility of substituted polyacetylenes measured by quasielastic neutron scattering and its relationship with gas permeability, Polymer, 1999, 40, 7157–7161 CrossRef CAS.
- T. Kanaya, T. Kawaguchi, K. Kaji, T. Sakaguchi, G. Kwak and T. Masuda, Role of Local Dynamics in the Gas Permeability of Glassy Substituted Polyacetylenes. A Quasielastic Neutron Scattering Study, Macromolecules, 2002, 35, 5559–5564 CrossRef CAS.
- R. Zorn, W. Lohstroh, M. Zamponi, W. J. Harrison, P. Budd, M. Böhning and A. Schönhals, Molecular mobility of a polymer of intrinsic microporosity revealed by quasielastic neutron scattering, Macromolecules, 2020, 53, 6731–6739 CrossRef CAS.
- A. Schönhals, P. Szymoniak, M. A. Kolmangadi, M. Böhning, M. Zamponi, B. Frick, M. Appel, G. Günther, M. Russina, D. A. Alenttiev, M. Bermeshev and R. Zorn, Microscopic dynamics of highly permeable super glassy polynorbornenes revealed by neutron scattering, J. Membr. Sci., 2022, 642, 119972 CrossRef.
- R. Zorn, H. Yin, W. Lohstroh, W. Harrison, P. M. Budd, B. R. Pauw, M. Böhning and A. Schönhals, Anomalies in the low frequency vibrational density of states for a polymer with intrinsic microporosity – the Boson peak of PIM-1, Phys. Chem. Chem. Phys., 2018, 20, 1355–1363 RSC.
- R. Zorn, P. Szymoniak, M. Kolmangadi, M. Wolf, D. Alentiev, M. Bermeshev, M. Böhning and A. Schönhals, Low frequency vibrational density of state of highly permeable super glassy polynorbornenes – The Boson peak, Phys. Chem. Chem. Phys., 2020, 22, 8381–18387 RSC.
- I. Rose, C. G. Bezzu, M. Carta, B. Comesaña-Gándara, E. Lasseuguette, M. C. Ferrari, P. Bernardo, G. Clarizia, A. Fuoco, J. C. Jansen, K. E. Hart, T. P. Liyana-Arachchi, C. M. Colina and N. B. McKeown, Polymer Ultrapermeability from the inefficient packing of 2D chains, Nat. Mater., 2017, 16, 932 CrossRef CAS.
- M. Carta, R. Malpass-Evans, M. Croad, Y. Rogan, J. C. Jansen, P. Bernardo, F. Bazzarelli and N. B. McKeown, An efficient polymer molecular sieve for membrane gas separations, Science, 2013, 339, 303–307 CrossRef CAS.
- P. Bernardo, V. Scorzafave, G. Clarizia, E. Tocci, J. C. Jansen, A. Borgogno, R. Malpass-Evans, N. B. McKeown, M. Carta and F. Tasselli, Thin film composite membranes based on a polymer of intrinsic microporosity derived from Tröger's base: A combined experimental and computational investigation of the role of residual casting solvent, J. Membr. Sci., 2019, 569, 17–31 CrossRef CAS.
- R. Zorn, P. Szymoniak, M. A. Kolmangadi, R. Malpass-Evans, N. B. McKeown, M. Tyagi, M. Böhning and A. Schönhals, Low frequency vibrations and diffusion in disordered polymers bearing an intrinsic microporosity as revealed by neutron scattering, Crystals, 2021, 11, 1482 CrossRef CAS.
- R. Malpass-Evans, I. Rose, A. Fuoco, P. Bernardo, G. Clarizia, N. B. McKeown, J. C. Jansen and M. Carta, Effect of Bridgehead Methyl Substituents on the Gas Permeability of Tröger's-Base Derived Polymers of Intrinsic Microporosity, Membranes, 2020, 10, 62 CrossRef CAS.
- H. Yin, B. Yang, Y. Z. Chua, P. Szymoniak, M. Carta, R. Malpass-Evans, N. McKeown, W. J. Harrison, P. M. Budd, C. Schick, M. Böhning and A. Schönhals, Effect of Backbone Rigidity on the Glass Transition of Polymers of Intrinsic Microporosity Probed by Fast Scanning Calorimetry, ACS Macro Lett., 2019, 8, 1022–1028 CrossRef CAS.
- J. R. D. Copley and J. C. Cook, The Disk Chopper Spectrometer at NIST: A new instrument for quasielastic neutron scattering studies, Chem. Phys., 2003, 292, 477 CrossRef CAS.
- R. T. Azuah, L. R. Kneller, Y. Qiu, P. L. W. Tregenna-Piggott, C. M. Brown, J. R. D. Copley and R. M. Dimeo, DAVE: A comprehensive software suite for the reduction, visualization, and analysis of low energy neutron spectroscopic data, J. Res. Natl. Inst. Stand. Technol., 2009, 114, 341 CrossRef CAS.
- A. Meyer, R. M. Dimeo, P. M. Gehring and D. A. Neumann, The high-flux backscattering spectrometer at the NIST Center for Neutron Research, Rev. Sci. Instrum., 2003, 74, 2759–2777 CrossRef CAS.
- E. Mamontov and K. W. Herwig, A time-of-flight backscattering spectrometer at the spallation neutron source, BASIS, Rev. Sci. Instrum., 2011, 82, 85109 CrossRef CAS.
- M. Bée, Quasielastic neutron scattering. Principles and applications in solid state chemistry, biology and materials science, Adam Hilger, Bristol, UK, 1988 Search PubMed.
- J. Colmenero and A. Arbe, Carbon-carbon torsional barriers driving the fast dynamics in glass-forming polymers, Phys. Rev. B, 1998, 57, 1358–13513 CrossRef.
- K. Golzar, H. Modarress and S. Amjad-Iranagh, Effect of pristine and functionalized single- and multi-walled carbon nanotubes on CO2 separation of mixed matrix membranes based on polymers of intrinsic microporosity (PIM-1): a molecular dynamics simulation study, J. Mol. Model., 2017, 23, 266 CrossRef.
- G. Kupgan, L. J. Abbot, K. E. Hart and C. M. Colina, Modeling amorphous microporous polymers for CO2 capture and separations, Chem. Rev., 2018, 11, 5488–5538 CrossRef.
- H. Yin, Y. Chua, B. Yang, C. Schick, W. Harrison, P. M. Budd, M. Böhning and A. Schönhals, First clear-cut experimental evidence of a glass transition in a polymer with intrinsic microporosity: PIM-1, J. Chem. Phys. Lett., 2018, 2018, 2003–2008 CrossRef.
- J. Colmenero, A. Moreno and A. Alegria, Prog. Polym. Sci., 2005, 30, 1147–1184 CrossRef CAS.
- A. Schönhals, R. Zorn and B. Frick, Inelastic neutron spectroscopy as a tool to investigate nanoconfined polymer systems, Polymer, 2016, 105, 393–406 CrossRef.
- A. Yildirim, C. Krause, R. Zorn, W. Lohstroh, M. Zamponi, O. Holderer, B. Frick and A. Schönhals, Complex molecular dynamics of a symmetric model discotic liquid crystal revealed by broadband dielectric, thermal and neutron spectroscopy, Soft Matter, 2020, 16, 2005–2016 RSC.
- M. Prager and A. Heidemann, Rotational Tunneling and Neutron Spectroscopy: A Compilation, Chem. Rev., 1997, 97, 2933–2966 CrossRef CAS.
- R. Zorn, B. Frick and L. Fetters, Quasielastic neutron scattering study of the methyl group dynamics in polyisoprene, J. Chem. Phys., 2002, 116, 845–853 CrossRef CAS.
- A. Schönhals, C. Schick, H. Huth, B. Frick, M. Mayorova and R. Zorn, Molecular Dynamics in Glass-forming Poly(phenyl methyl siloxane) as Investigated by Broadband Thermal, Dielectric and Neutron Spectroscopy, J. Non-Cryst. Solids, 2007, 353, 3853–3861 CrossRef.
- H. W. Starkweather, Simple and complex relaxation, Macromolecules, 1981, 15, 1277–1281 CrossRef.
- F. Imashiro, T. Terao and A. Saika, Barriers to Rotation of Methyl Groups in 9-Methyltriptycene and 9-Methyl-9,10-dihydro-9,10-ethenoanthracene, JACS, 1979, 101, 3762–3766 CrossRef CAS.
- N. Piślewski, J. Tritt-Goc, M. Bielejewski, A. Rachocki, T. Ratajczyk and S. Szymański, Spin-lattice relaxation study of the methyl proton dynamics in solid 9,10-dimethyltriptycene (DMT), Solid State Nucl. Magn. Reson., 2009, 35, 194–200 CrossRef.
- W. V. Meyer and H. Neldel, Über die Beziehng zwischen der Energiekonstanten c und der Mengenkonstante in der Leitwerts-Temperaturformel bei oxydischen Halbleitern, Z. Tech. Phys., 1937, 18, 588 CAS.
- J. C. Dyre, A phenomenological model for the Meyer–Neldel rule, J. Phys. C: Solid State Phys., 1986, 19, 5655 CrossRef.
- A. Yelon, B. Movaghar and H. M. Branz, Origin and consequences of the compensation (Meyer–Neldel) law, Phys. Rev. B, 1992, B46, 12244 CrossRef.
- E. Thoms and S. Napolitano, Enthalpy-entropy compensation in the slow Arrhenius process, J. Chem. Phys., 2023, 159, 161103 CrossRef CAS.
- A. Schönhals, D. Wolff and J. Springer, Influence of the mesophase structure on the β-relaxation in comb-like polymethacrylates, Macromolecules, 1995, 28, 6254–6257 CrossRef.
| This journal is © The Royal Society of Chemistry 2024 |