
 Open Access Article
 This Open Access Article is licensed under a
 Creative Commons Attribution 3.0 Unported Licence
Morphology, repulsion, and ordering of red blood cells in viscoelastic flows under confinement†
Steffen M.
Recktenwald
 *ab,
Yazdan
Rashidi
a,
Ian
Graham
c,
Paulo E.
Arratia
c,
Francesco
Del Giudice
d and
Christian
Wagner
ae
*ab,
Yazdan
Rashidi
a,
Ian
Graham
c,
Paulo E.
Arratia
c,
Francesco
Del Giudice
d and
Christian
Wagner
ae
aDynamics of Fluids, Department of Experimental Physics, Saarland University, 66123 Saarbrücken, Germany. E-mail: steffen.recktenwald@uni-saarland.de
bMicro/Bio/Nanofluidics Unit, Okinawa Institute of Science and Technology Graduate University, 1919-1 Tancha, Onna-son, Okinawa 904-0495, Japan
cDepartment of Mechanical Engineering and Applied Mechanics, University of Pennsylvania, Philadelphia, PA 19104, USA
dComplex Fluid Research Group, Department of Chemical Engineering, Faculty of Science and Engineering, Swansea University, Swansea SA1 8EN, UK
ePhysics and Materials Science Research Unit, University of Luxembourg, L-1511 Luxembourg, Luxembourg
First published on 14th June 2024
Abstract
Red blood cells (RBC), the primary carriers of oxygen in the body, play a crucial role across several biomedical applications, while also being an essential model system of a deformable object in the microfluidics and soft matter fields. However, RBC behavior in viscoelastic liquids, which holds promise in enhancing microfluidic diagnostic applications, remains poorly studied. We here show that using viscoelastic polymer solutions as a suspending carrier causes changes in the clustering and shape of flowing RBC in microfluidic flows when compared to a standard Newtonian suspending liquid. Additionally, when the local RBC concentration increases to a point where hydrodynamic interactions take place, we observe the formation of equally-spaced RBC structures, resembling the viscoelasticity-driven ordered particles observed previously in the literature, thus providing the first experimental evidence of viscoelasticity-driven cell ordering. The observed RBC ordering, unaffected by polymer molecular architecture, persists as long as the surrounding medium exhibits shear-thinning, viscoelastic properties. Complementary numerical simulations reveal that viscoelasticity-induced repulsion between RBCs leads to equidistant structures, with shear-thinning modulating this effect. Our results open the way for the development of new biomedical technologies based on the use of viscoelastic liquids while also clarifying fundamental aspects related to multibody hydrodynamic interactions in viscoelastic microfluidic flows.
1 Introduction
The microvascular system is a vital network of small blood vessels that intricately weave throughout tissues and organs.1 In it, red blood cells (RBCs) flow in small capillaries to exchange nutrients and gases. Microscale flow of RBCs determines microvascular perfusion in the microcirculatory system; it is also central to a broad range of biomedical applications for blood cell separation,2 single-cell analysis,3 and to assess storage lesion in transfusion medicine.4 In small vessels, RBCs usually flow in a single file and dynamically adapt their shape to the vessel flow conditions, such as flow rate, geometric confinement, and rheological properties of the surrounding plasma.5,6 Importantly, the RBC shape in capillary flow is susceptible to alterations in the intrinsic cell properties,7 which can serve as a phenotypical marker for many diseases, including malaria, diabetes, sickle cell disease, or neuroacanthocytosis syndromes,8–10 impairing blood flow and microvascular RBC perfusion.11,12 While cell count and morphology have clear implications for human health, they can also serve as an opportunity to develop fast and accessible in vitro diagnostic platforms.13,14Progress in our understanding of in vitro RBC single-cell flow has advanced the development of lab-on-a-chip technologies for point-of-care instruments to assess RBC deformability and evaluate RBC flow properties on the microscale.4,15–18 In this context, microfluidic experiments19–21 and numerical simulations22–24 have been employed to investigate RBC flow on the single-cell level, revealing various RBC shape configurations in microvascular flow.25–27 At rest, healthy RBCs have a biconcave, discocyte shape with a diameter of 8 μm and a thickness of 2 μm. RBCs suspended in a Newtonian buffer and subjected to microfluidic flows display more complex steady and dynamic shapes, such as parachutes, trilobes, tank-treading, tumbling, and rolling cells. In rectangular microchannels with dimensions similar to the RBC size, this shape complexity reduces to two dominant RBC shapes: the croissant and the slipper.20,21 The symmetric croissant shape predominantly appears at flow speeds v < 5 mm s−1 in microchannels with a width and height of approximately 10 μm and 8 μm, respectively. In contrast, the asymmetric slipper shape emerges at elevated cell speeds above v > 3 mm s−1. These cell shapes are inherently coupled to their equilibrium position in the channel cross-section. For healthy RBCs, croissant-like RBCs flow at the channel centerline, whereas slippers flow closer to the channel side walls at an off-centered position. Recently, machine-learning approaches have been employed for fast and robust shape classification of healthy and diseased RBCs in confined microfluidic flows,28,29 demonstrating the potential of RBC shapes and equilibrium position in the channel as a biomarker for specific pathologies and to assess the cell deformability in stored blood.4,18,23
With a few notable exceptions,30,31 the study of RBC in small capillary flows has mainly focused on using a buffer, a Newtonian liquid, as a suspending medium. Recently, non-Newtonian liquids have gained significant attention across several microfluidic applications due to the possibility of exploiting their nonlinear rheological properties (e.g., viscoelasticity, shear-thinning viscosity) for cell focusing and separation.32 However, the behavior of RBCs in non-Newtonian fluids remains largely unexplored.
In this work, we explored the flow of RBCs under confined microfluidic flows using several viscoelastic polymer solutions with distinct rheological properties as suspending liquids. We experimentally explored the impact of the rheological properties of the carrier on RBC clustering and individual shape, observing marked differences compared to the Newtonian case. We also provided the first experimental evidence of the formation of equally-spaced RBC structures in viscoelastic flows, called RBC trains, resemblant to the viscoelastic ordering phenomenon recently reported for rigid particles.33–37 Finally, we employed numerical simulations to elucidate the interplay between cell shape and viscoelastic properties in developing RBC trains.
2 Methods
2.1 Experimental
To explore the impact of fluid rheology and polymer properties on the behavior of RBCs in microchannels, we prepared aqueous solutions of several macromolecules having different molecular weights and concentration values. We prepared solutions of hyaluronic acid salt (HA, Sigma-Aldrich, Taufkirchen, Germany) with a molecular weight in the range 1.5–1.8 MDa at mass concentrations of 0.1 wt% (HA01), 0.3 wt% (HA03), and 0.5 wt% (HA05) in a PBS/BSA mixture. Additionally, aqueous solutions of poly(ethylene oxide) (PEO, Sigma-Aldrich, Taufkirchen, Germany) at 1 wt% PEO with an average molecular weight of Mw = 4 × 10⁵ g mol−1 (PEO400k), at 1 wt% with Mw = 4 × 10⁶ g mol−1 (PEO4M), and at 0.01 wt% with Mw = 8 × 10⁶ g mol−1 (PEO8M) were prepared. The polymer powder was slowly added to the PBS/BSA mixture, and the resulting solutions were mixed by gentle agitation on a roller-mixer for 24 hours to allow the complete dissolution of the polymer. We determined the osmolality mosm of the used fluids (Table 1) using a freezing point osmometer (Osmomat 3000 basic, Gonotec, Berlin, Germany). Similar to the control sample in pure PBS/BSA, a bulk concentration of 3%Ht was adjusted in all investigated fluids.
| Sample | w (wt%) | m osm (mOsm kg−1) | η 0 (mPa s) | η ∞ (mPa s) | λ (ms) | λ e (ms) |
|---|---|---|---|---|---|---|
| Control | — | 297.7 ± 1.5 | 1.2 ± 0.2 | — | — | — |
| HA01 | 0.1 | 300.7 ± 1.2 | 7.2 ± 0.1 | 3.8 ± 0.4 | 2.0 ± 0.5 | 0.5 ± 0.1 |
| HA03 | 0.3 | 307.0 ± 4.6 | 89.2 ± 1.3 | 11.9 ± 0.9 | 13.2 ± 0.2 | 2.0 ± 0.1 |
| HA05 | 0.5 | 309.3 ± 4.5 | 580.8 ± 21.9 | 23.0 ± 0.9 | 51.9 ± 0.3 | 3.3 ± 0.2 |
| PEO8M | 0.01 | 298.3 ± 0.7 | 1.3 ± 0.2 | — | — | 0.8 ± 0.4 |
| PEO400k | 1 | 303.0 ± 4.2 | 11.7 ± 0.4 | — | — | 0.6 ± 0.3 |
| PEO4M | 1 | 301.5 ± 2.1 | 354.1 ± 6.5 | 21.9 ± 0.4 | 57.6 ± 0.2 | 31.0 ± 6.5 |
Besides the control solution, we investigated three additional fluids with a near-constant viscosity that do not exhibit significant elastic properties in shear, namely an iodixanol solution, an isotonic polyvinylpyrrolidone (PVP), and a volume replacement fluid (VRF) (Table S1, ESI†). A description of the sample preparation for the constant-viscosity fluids and a summary of their rheological properties can be found in the ESI.† Results on RBC flow in the PEO solutions and constant viscosity fluids are presented in the ESI† if not mentioned otherwise.
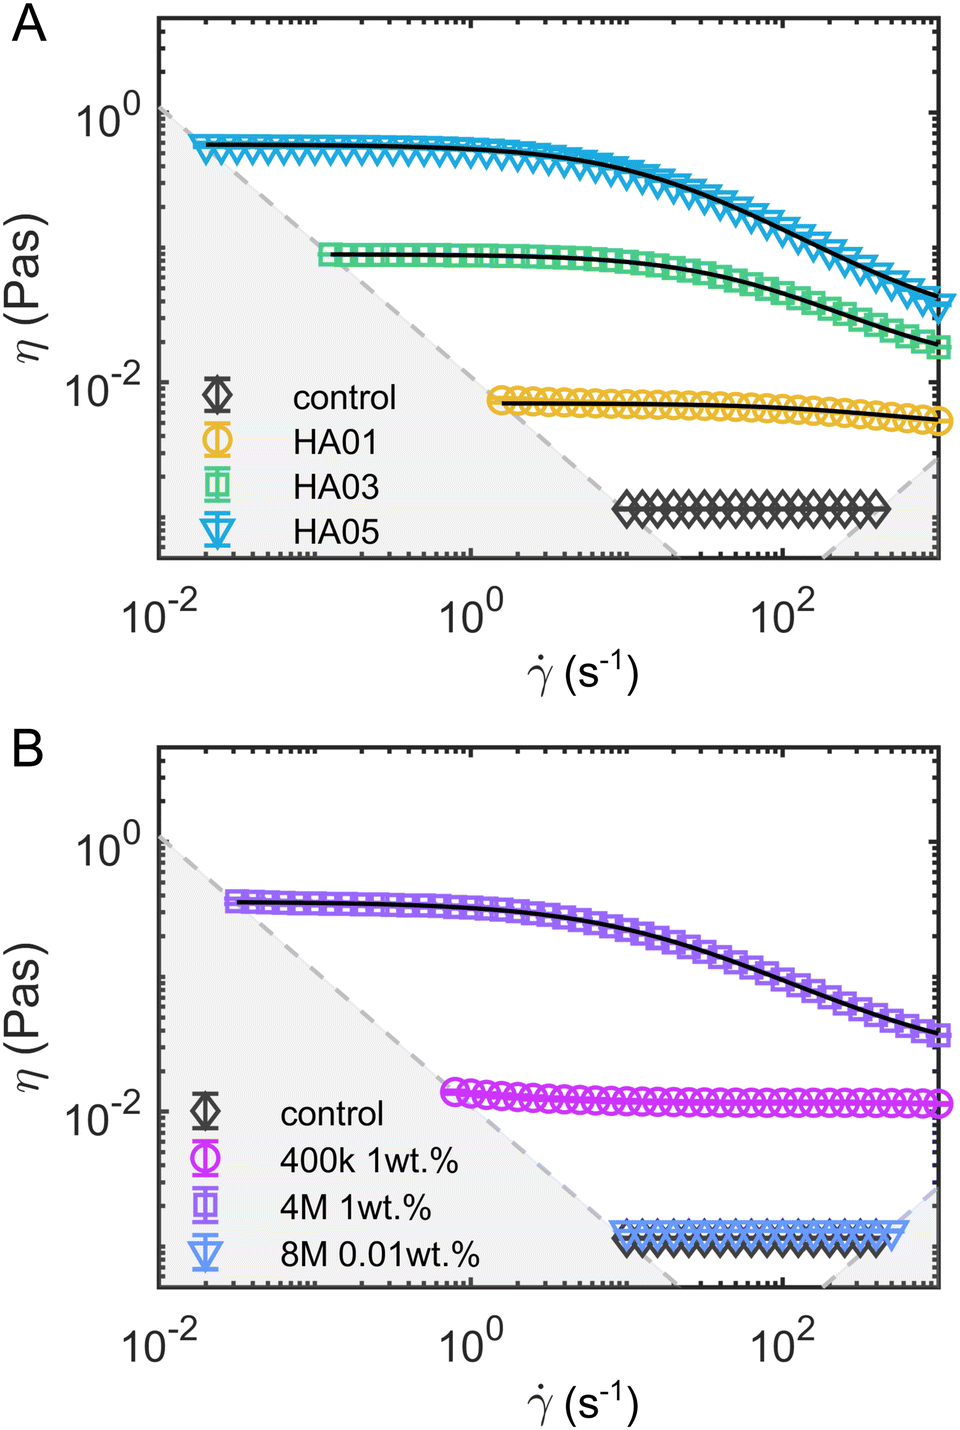 | ||
Fig. 1 Steady shear rheology of the polymeric fluids. Shear viscosity η as a function of the shear rate ![[small gamma, Greek, dot above]](https://www.rsc.org/images/entities/i_char_e0a2.gif) for (A) the HA solutions and (B) the PEO solutions. The solid black lines in the HA solution data represent fits of the viscosity curves with the cross model (eqn (1)). Dashed gray lines and areas indicate the lower torque limit of the device and the onset of flow instabilities under steady shear measurements in the cylinder geometry.38 for (A) the HA solutions and (B) the PEO solutions. The solid black lines in the HA solution data represent fits of the viscosity curves with the cross model (eqn (1)). Dashed gray lines and areas indicate the lower torque limit of the device and the onset of flow instabilities under steady shear measurements in the cylinder geometry.38 | ||
In oscillatory shear measurements (Fig. S1B, ESI†), we did not capture the terminal flow regime at low angular frequencies ω, which can be used to calculate the longest relaxation time based on the slopes of the storage G′ and loss G′′ moduli using standard small angle oscillatory shear (SAOS) analysis.39 Therefore, we estimate the longest relaxation time λ by fitting the viscosity curves of the HA solutions (black lines in Fig. 1) with the cross-model:
 | (1) |
the shear rate, and m the factor that modulates the transition between the zero-shear viscosity region and the shear-thinning regime. For HA01, where the shear-thinning was scarcely noticeable, we further determined a relaxation time of λ = 3.7 ± 1.4 ms using the μ-rheometer introduced previously.40 This value agrees with the relaxation time of λ = 2 ms obtained from the cross-model (Table 1). For consistency, we use the relaxation time of λ = 2 ms for further analysis.
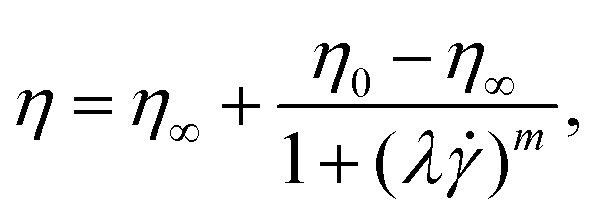
Moreover, we measured the shear rate dependent first normal stress difference N1 (Fig. 2A) and shear stress τ (Fig. 2B) of the fluids using a cone-and-plate geometry (CP50/2, 50 mm diameter, 2° angle, Anton Paar, Graz, Austria). We employed a protocol with shear “peak hold” intervals,41,42 which allowed us to correct for the normal-force transducer drift empirically. Additionally, the contribution of inertia to the normal force was subtracted.39 Based on power-law fits of N1() and the shear stress τ(), we calculated the Weissenberg number Wi = N1()/τ() as a measure of the contribution of elastic effects (Fig. 2C). From these measurements, we concluded that elastic stresses dominate for the viscoelastic, shear-thinning polymer solutions (HA03, HA05, and PEO4M) at the shear rates observed in the microfluidic channel at our experimental conditions (Fig. 2C). To complete the rheological characterization of the fluids, we also performed extensional rheology experiments using the uniaxial elongation of the stretched fluid filaments (ESI†). In uniaxial extension, all HA and PEO solutions, as well as PVP, displayed elastic properties as evidenced by the formation of axially uniform cylindrical filaments during the last stage of capillary breakup (Fig. S4, ESI†).
 | ||
| Fig. 2 Assessment of fluid elasticity under shear. (A) First normal stress difference N1 as a function of the shear rate for the HA and PEO solutions. The horizontal dashed-dotted line in (A) indicates the experimental limit that can be resolved by the rheometer by measuring the N1 response for the Newtonian solvent (which should be identically zero). The dashed line corresponds to the onset of secondary flows at high velocities in the used cone-and-plate geometry.38 (B) Shear stress τ as a function of the shear rate . Solid lines in (A) and (B) correspond to power-law fits of N1 and τ, respectively. (C) Weissenberg number Wi = N1/τ calculated from the power-law fits of N1 and τ. For HA01 and PEO400k, we used the fit of N1 in the high shear rate regime as an upper estimation of the maximum Weissenberg number for these fluids (open circles). The squares show the estimated shear rates channel = v/Dh and shear rate ranges in the microfluidic channel, based on the RBC velocity v and the hydraulic channel diameter Dh. | ||
 | ||
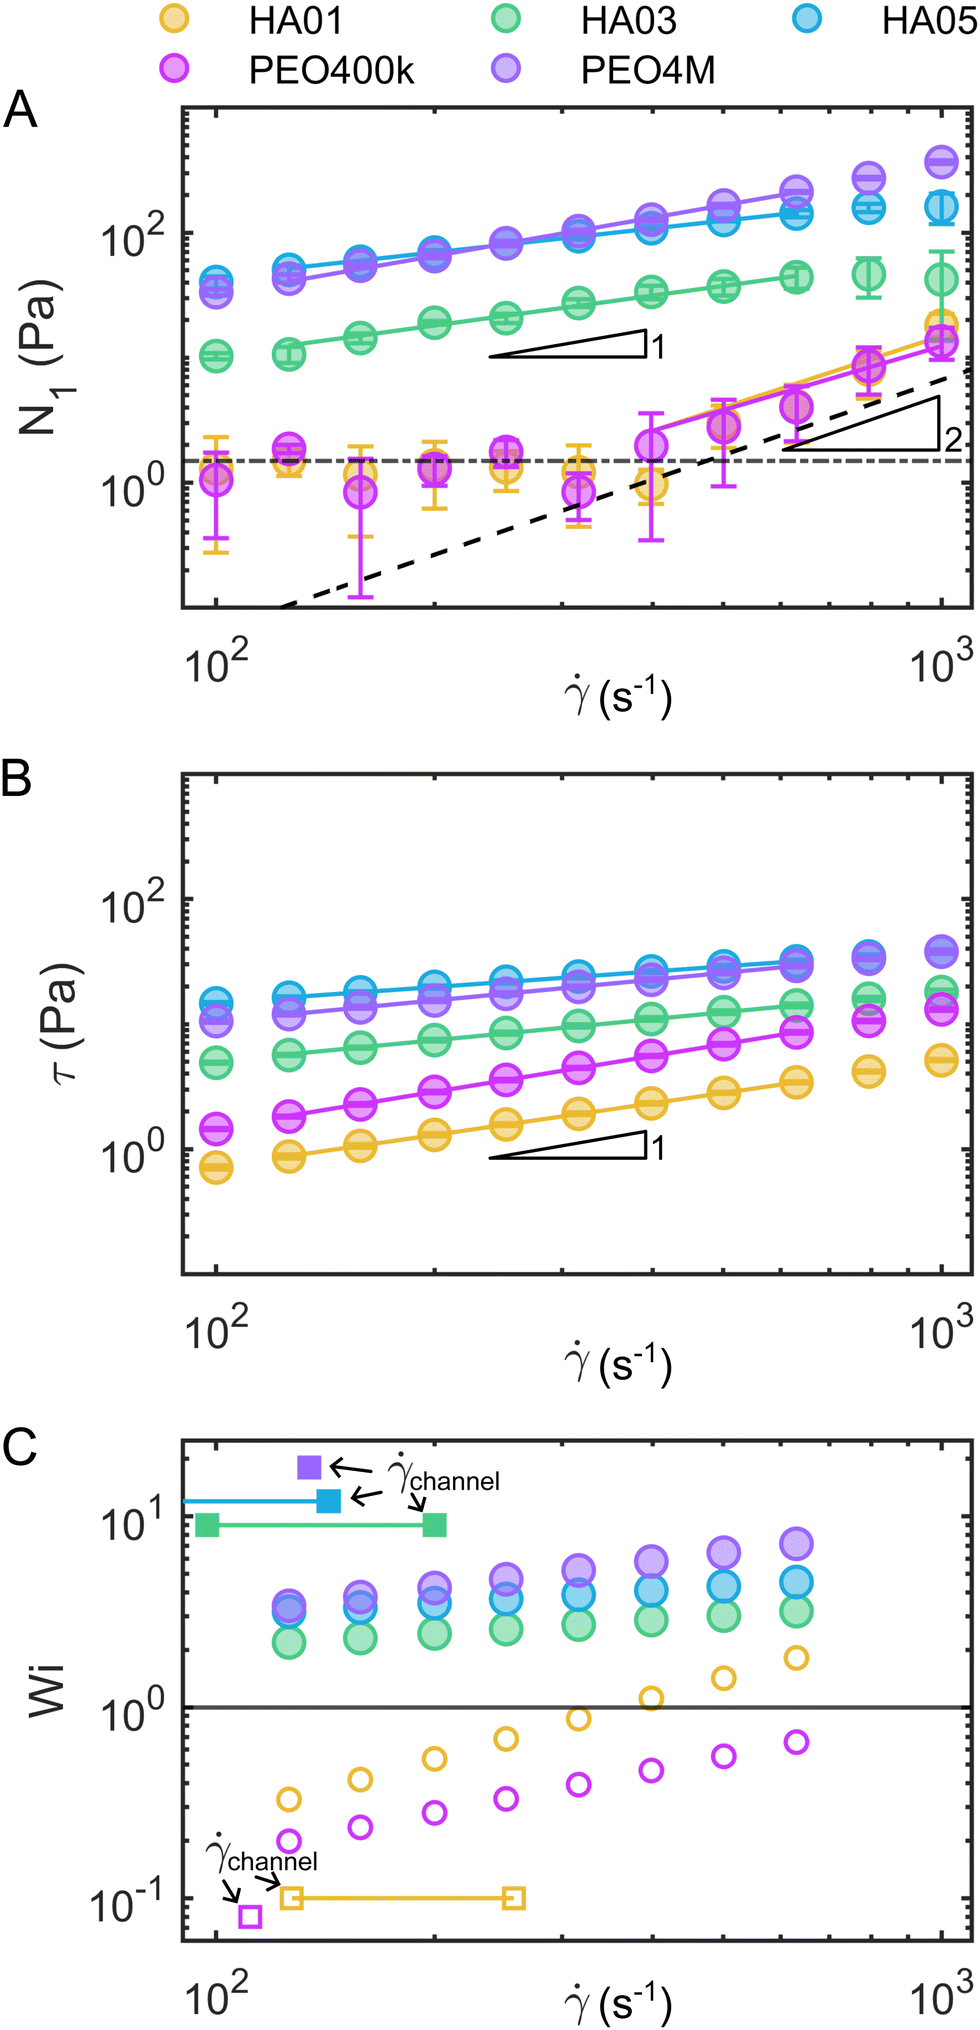
| Fig. 3 Microfluidic flow of RBCs in HA solutions. (A) A representative snapshot of the RBC flowing in a HA05 solution at v = 1 mm s−1. Red boxed highlight RBCs with length LRBC in flow direction and diameter DRBC across the channel width. Blue arrows indicate distances s between consecutive RBCs and clusters. (B)–(E) Representative histograms and probability density distributions (PDFs) by kernel density estimation of (B) the RBC length LRBC, (C) the RBC diameter DRBC, (D) the projection area ARBC, and (E) the deformability index DIRBC. Data are shown for the HA05 solution at an RBC velocity of v = 1 mm s−1. Red circles indicate PDF peaks corresponding to single RBCs, doublets, and triplets (see inset images) (scale bars, 5 μm). | ||
We recorded the RBC flow and obtained single-cell morphology data at two regions of interest (ROI) along the channel flow direction corresponding to L/Dh = 120 and L/Dh = 1200 from the inlet, with the hydraulic diameter of the rectangular channel Dh = 2WH/(W + H) = 8.5 μm. A low frame rate was chosen for each ROI to assess the distance s between different RBCs and RBC clusters. The frame rate was adjusted depending on the fluid viscosity so that in each frame of the image sequence, a specific cell was detected only once.
Based on the projection of the RBC flow in the x–y-plane of the microfluidic channel (Fig. 3A), we extracted the center of mass, the cell length LRBC in the flow direction, the cell area ARBC, and the cell diameter DRBC across the channel from binarized images of all single RBCs and RBC clusters using a custom MATLAB (9.14.0.2206163 (R2023a), MathWorks, Natick, MA) algorithm. Due to the absorbance of blue LED light used in this study (see Fig. 3A), and the resulting excellent contrast between the RBC and the surrounding medium, no additional image processing is required. We calculated the cell deformability index DIRBC defined as DIRBC = (a − b)/(a + b), where a and b are the major and minor axes of the RBC shape during flow. Furthermore, we calculated the probability density distributions (PDFs) by kernel density estimation based on the histograms of each quantity (Fig. 3B–E and Fig. S1C, ESI†). The first peaks in the length and area distributions correspond to the most probable single-cell length LRBC,1 and area ARBC,1. These single-cell characteristics were used to assess the effect of the polymer solutions on the RBC shape. Further, the distributions of LRBC and the distance s between two consecutive objects (Fig. 3A) were used to discriminate single RBCs from RBC clusters. Here, we defined a single RBC as a cell that exhibits a length smaller than the minimum in the PDF between the first and second peak (Fig. 3B) and which is further than a distance of LRBC,1 away from any other RBC or cluster.
Based on a single-cell diameter of DRBC,1 ≈ 8 μm, the confinement ratio β = DRBC,1/Dh is approximately 0.94, which is much larger than the values of 0.2 < β < 0.45, previously employed to investigate viscoelastic train formation of rigid particles.36,45,46 Note that reducing the confinement ratio by increasing the channel cross-section results in the emergence of unstable shape types that display rich shape dynamics.43
To calculate the RBC velocity, we performed a second set of experiments with a frame rate of up to 400 frames per second, depending on the applied pressure drop and fluid sample. Individual cell velocities were determined in this second recording by tracking the cell position over the image sequence within the field of view. Since we did not observe inter-individual variations in the results, data were averaged between the three donors. For individual RBC shape and ordering measurement, data analysis was performed on an average of 7725 cells (between 4629 and 20![[thin space (1/6-em)]](https://www.rsc.org/images/entities/char_2009.gif) 337 cells).
337 cells).
 | (2) |
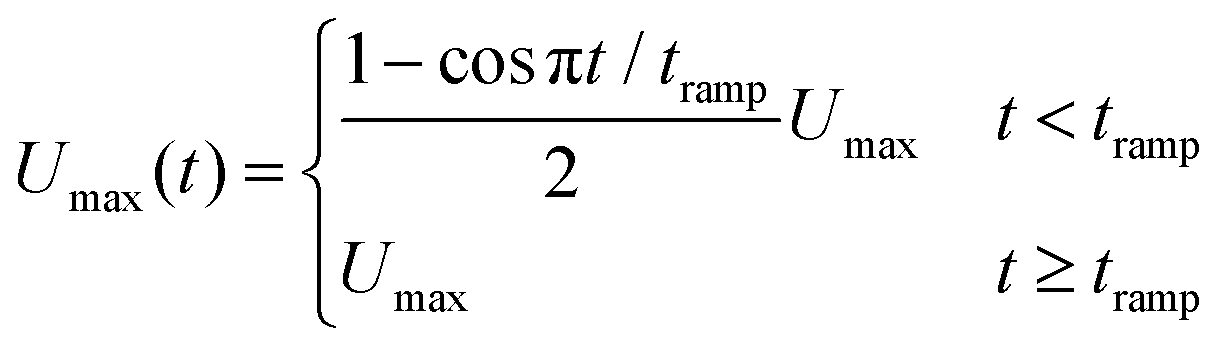
![[0 with combining macron]](https://www.rsc.org/images/entities/char_0030_0304.gif) . The wall velocity condition is similarly varied with time as
. The wall velocity condition is similarly varied with time as | (3) |
Note that the velocity boundary condition is chosen by performing simulations of a single RBC placed at the center of the channel; a velocity sweep is performed for each set of fluid parameters to determine the single RBC terminal velocity. For all fluid types explored here, a single RBC terminal velocity of approximately 0.805Umax is found. We ensured that the repulsive pair forces found in the viscoelastic models are insensitive to small changes in the RBC velocity near terminal velocity.
The pressure outlet boundary condition is p = 0 and at all other boundaries ∇p = . The conformation tensor Θ boundary condition is set to ∇Θ = 0 on all boundaries. The boundary of each RBC is formed by tracing an RBC boundary taken from an image of the HA05 experiment.
For each RBC separation, the 2D boundary of the simulation is formed in CAD software and ingested into GMSH to extrude and create an unstructured mesh. The mesh is composed primarily of (in 2D) quadrilateral cells. Care is taken at the boundaries of the simulation domain to keep surfaces orthogonal. Each mesh is heavily refined near each RBC surface, with a refinement that decreases gradually with the distance to the RBCs.
Two main constitutive models are used to describe the rheological properties of the polymeric fluids, namely the Giesekus and FENE-P models. While both constitutive models are known to describe polymeric fluids possessing viscoelastic behavior and shear-thinning properties, the Giesekus accounts for microstructural anisotropy and is more appropriate for non-dilute solutions.47 Conveniently, these constitutive models are readily available within OpenFOAM, an open-source computational fluid dynamics solver, and RheoTool (for more info, please see ref. 48 and 49). For both models, the total stress σ can be written as the sum of solvent and polymeric contributions, σs and τ.
| σ = σs + τ | (4) |
The solvent stress tensor is formed from the solvent viscosity ηs and deformation tensor D = ∇u + ∇uT.
| σs = ηs(∇u + ∇uT) | (5) |
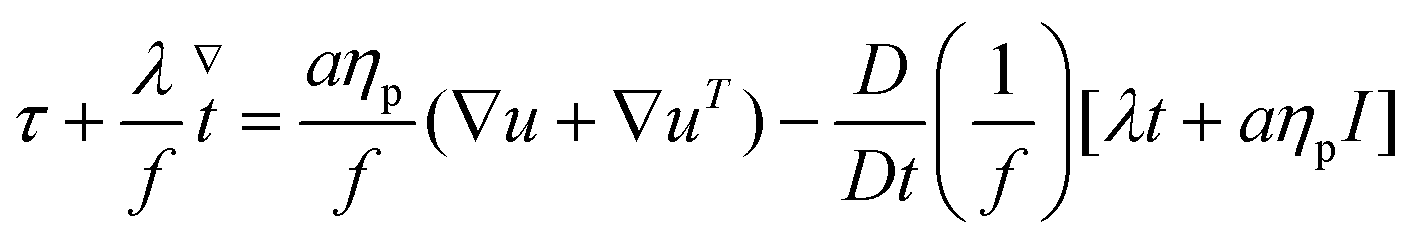
The constitutive equations governing the polymeric extra-stress in the Giesekus and FENE-P models can be written respectively as
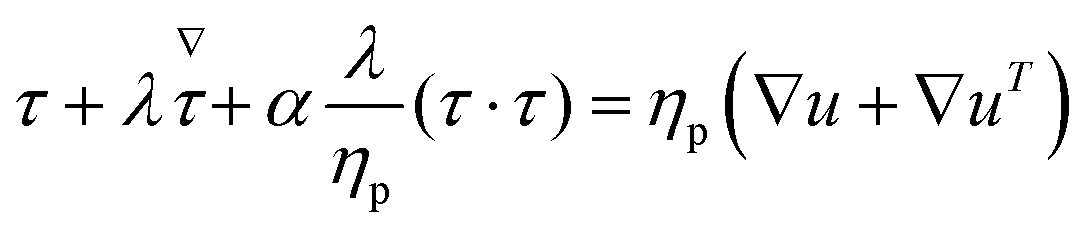 | (6) |
 | (7) |
 | (8) |
All simulations are performed in the log-conformation approach,49 where the polymeric extra-stress τ is recast (in the Giesekus model) as
 | (9) |
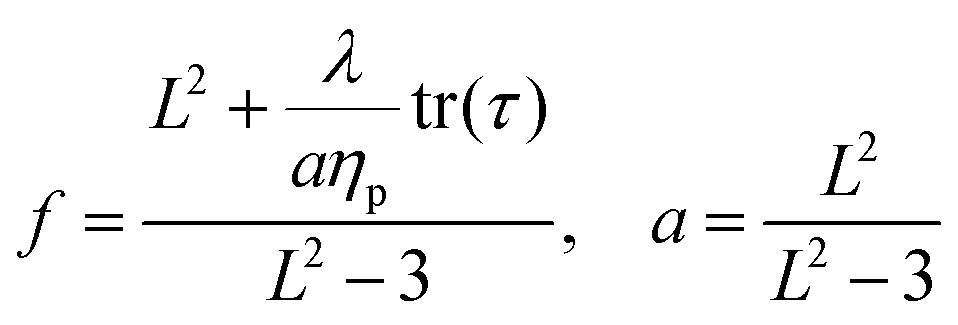
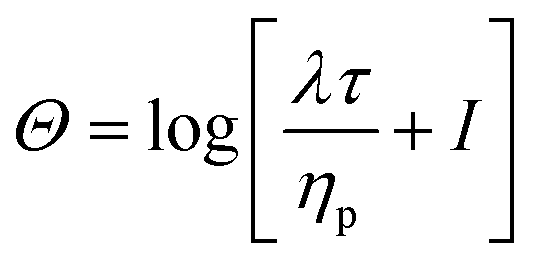
It is common to define the dimensionless parameter  which is a proxy for the inverse polymer concentration. For all simulations, we chose the common model parameters β′ = 0.2 and λ = 0.1. Within the Giesekus model, we set the microstructural parameter α = 0.4 and in the FENE-P model, the extensibility parameter is set to L2 = 10.
We explored Wi ∈ [0.1, 1.0, 5.0] for each model, where the Weissenberg number is estimated as Wi = λUmax/R. The simulations are solved using a partially coupled direct solver (p and U coupled, Θ segregated) and a Crank–Nicholson time integration scheme. A time step of dt = 1 × 10⁻⁴ is applied in all simulations for a total time of 30λ. The parameter τ, used to vary the velocity inlet condition slowly, is set to 2.5λ.
3 Results
RBCs are highly deformable, meaning that their shape under confinement is expected to depend upon a combination of both rheological properties of the suspending liquid and experimental conditions, such as volumetric flow rate and channel size. Hence, we start by examining the formation of RBC clusters and RBC shapes in highly confined microfluidic flow (Fig. 3A). Specifically, we explore the resulting RBC clusters and shapes in different viscoelastic liquids, namely, HA and PEO, when compared to the control.To assess the effect of fluid elasticity, we define the dimensionless Deborah number, De = λv/Dh, where λ is the fluid relaxation time, v is the RBC speed, and Dh is the hydraulic diameter of the rectangular microfluidic channel. Note that our definition of De employs the RBC speed v rather than the fluid speed: this is justified by the large confinement experienced by RBC in the microchannel (see, for instance, Fig. 3A), with the RBC occupying almost the entire channel. Depending on the Deborah number and the distance between them, two flowing objects can either experience attraction or repulsion dynamics.35
3.1 RBC cluster formation
RBCs are well-known for forming clusters in microfluidic flows, i.e., two or more closely adhering cells.51–54 Cell clustering is often undesirable in diagnostic microfluidic applications since it makes single-cell analysis difficult. Here, we observed a significant distinction in cluster formation depending on the fluid rheological properties (Fig. 4A). Our results show that in the Newtonian control (i.e., buffer), RBCs can be distinguished within a cluster. In contrast, RBCs in the polymeric HA solutions are closely attached. For the control fluid and HA01 an average of roughly 63% of all RBCs flow as single cells (Fig. 4B). This percentage increases to approximately 80% for HA03 and HA05. While we observe a large number of RBC clusters containing N > 3 cells in the control and HA01 samples, this fraction is significantly reduced in the higher concentrated HA03 and HA05 solutions (Fig. 4C). Moreover, we observe an increase in the number of clusters in the control buffer as the cells travel through the channel from ROI1 (L/Dh = 120) to ROI2 (L/Dh = 1200), which is not found in the HA solutions.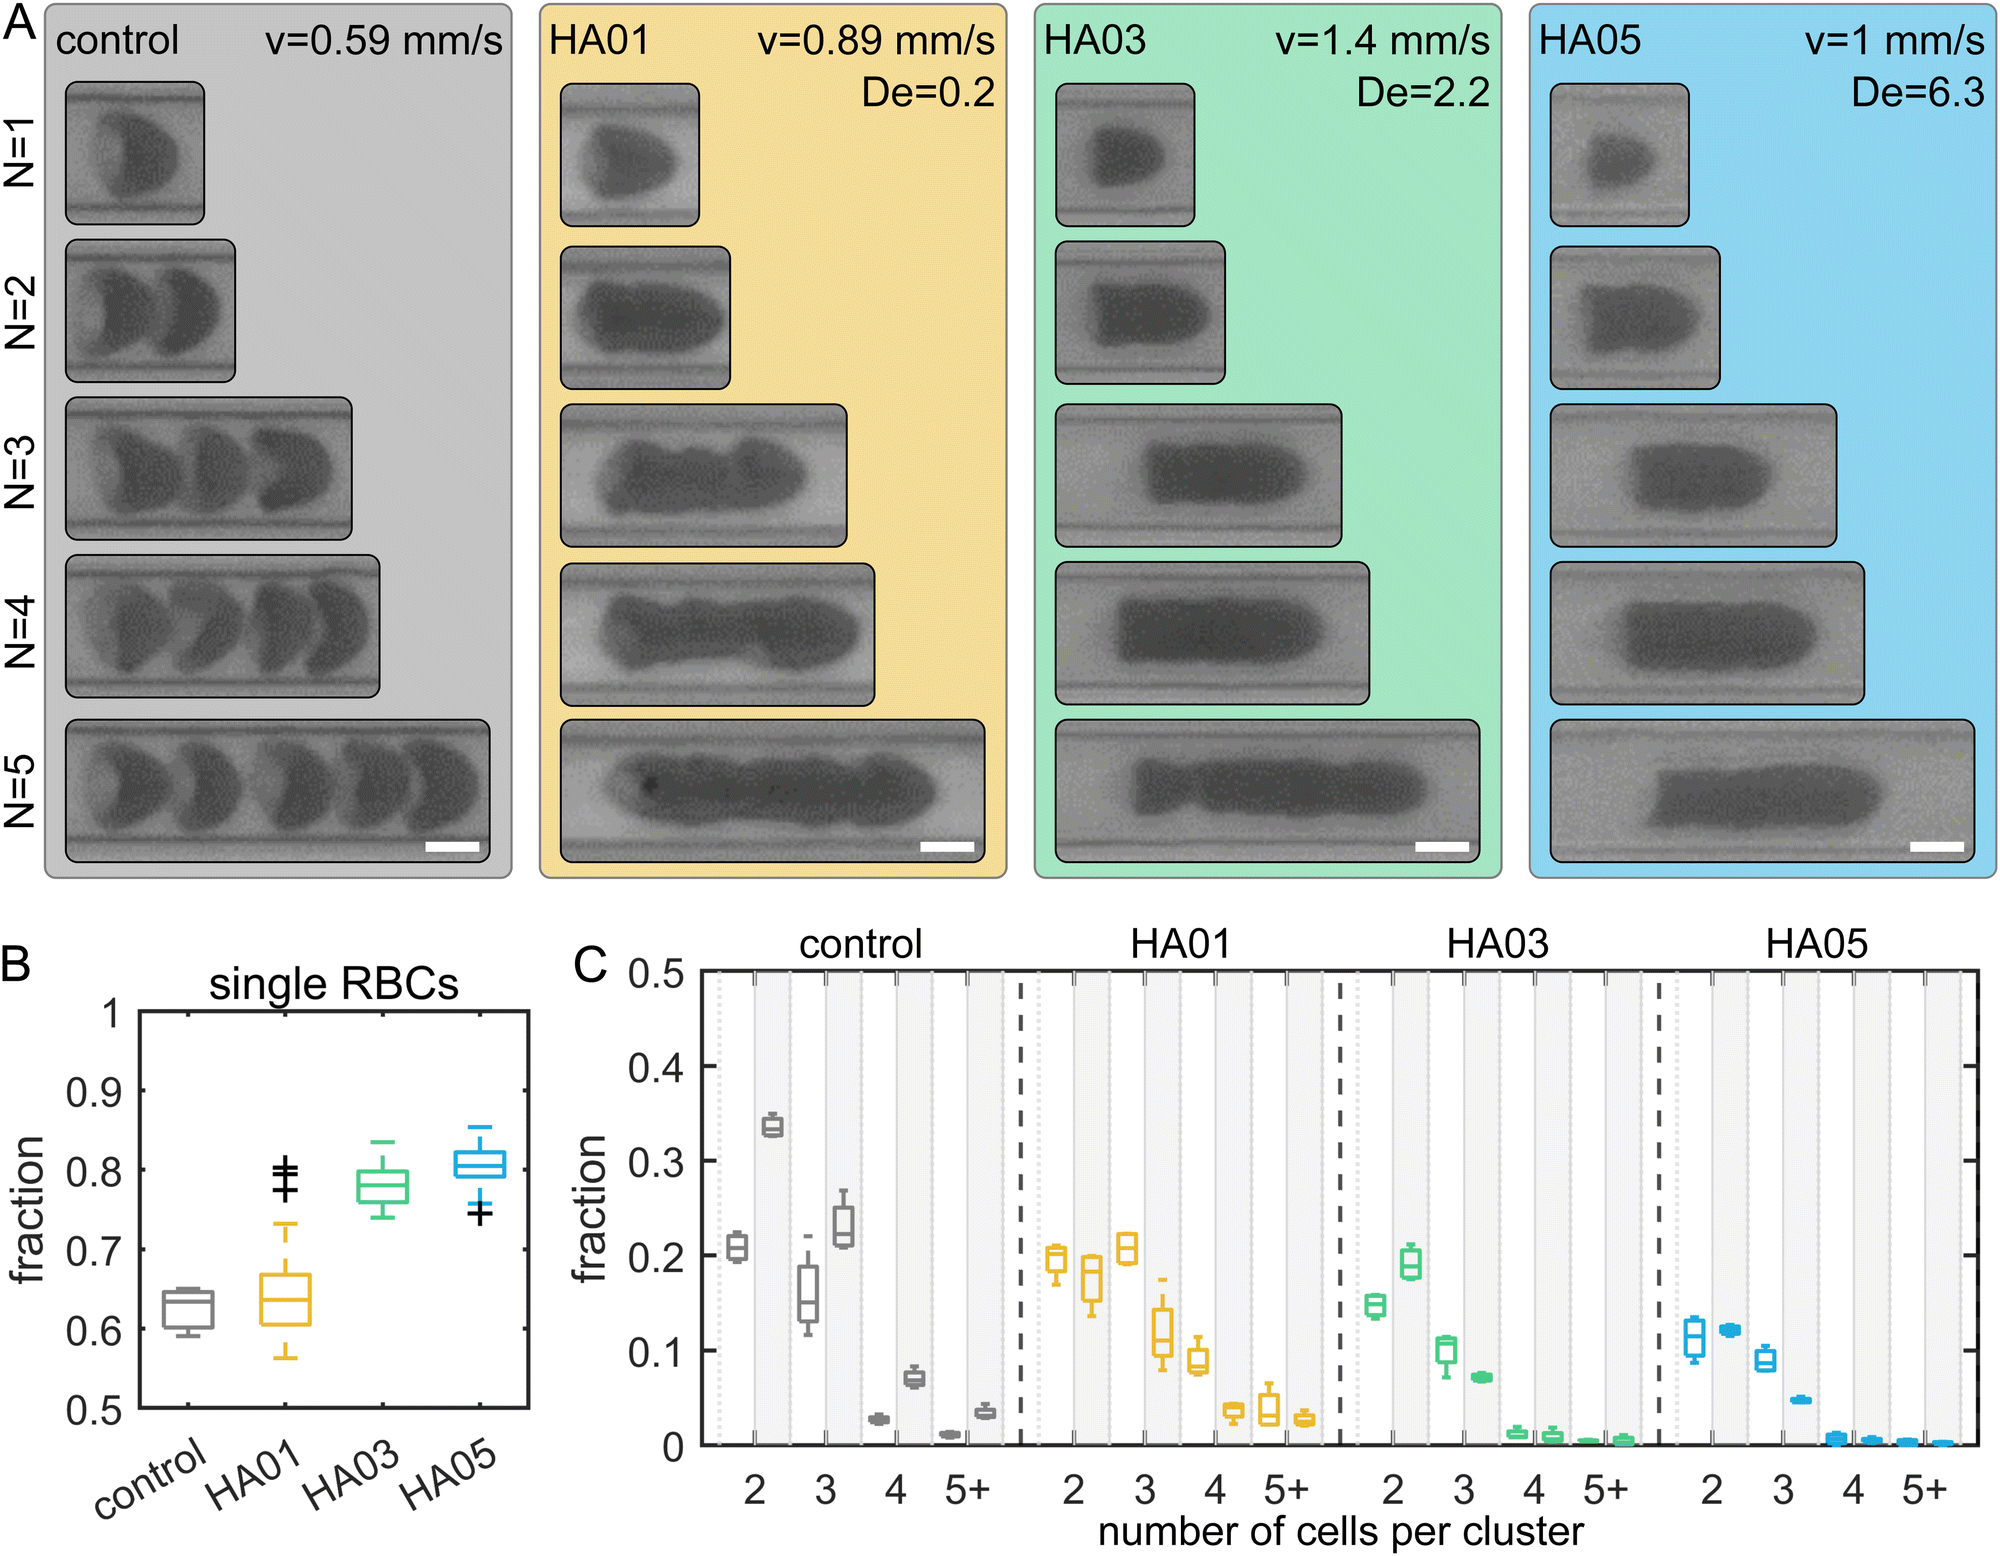 | ||
| Fig. 4 RBC cluster formation in polymeric liquids. (A) Representative snapshots of clusters containing N = 1–5 RBCs (top to bottom) for the different HA samples. (Scale bars, 5 μm.) For the control, the individual RBCs can be discriminated within the clusters. Individual RBCs adhere closely to one another for the HA solutions and cannot be discriminated within the clusters. (B) Box plots of the fraction of single RBCs that are spaced further than one RBC length apart and do not belong to an adhering cluster. (C) Box plots of the fraction of RBC clusters. The x-axes label 5+ denotes clusters with N = 5 or more RBCs. The x-axis shows the number of RBCs per cluster. Boxplots in front of the white and gray areas correspond to data in ROI1 (L/Dh = 120) and ROI2 (L/Dh = 1200), respectively. The bottom and top of each box are the 25th and 75th percentiles of the sample, respectively. The line in the middle of each box is the sample median. Whiskers go from the end of the interquartile range to the furthest observation. Data beyond the whisker length are marked as outliers with ‘+’ signs. | ||
PEO8M shows similar clustering behavior to the control buffer (Fig. S5, ESI†). In contrast, RBCs in PEO400k and PEO4M exhibit more closely packed clusters and an increased probability of single-cell flow. RBC suspended in the constant viscosity PVP and VRF solutions show clusters that are similar to those in PEO and HA. However, we do not observe a pronounced increase in the percentage of single cells in these fluids (Fig. S6, ESI†).
Generally, the initial aggregation process is attributed to slower RBCs acting to create a sequence of trailing cells.52 Once the cells are in close proximity, RBCs aggregate into clusters. This reversible aggregation was previously explained based on the bridging of macromolecules between the RBCs or induced by depletion.55,56 We find that adding polymers results in macromolecule-induced adhesion of individual cells. In combination with the bullet-like shape, these RBCs form closely packed clusters. Due to their high deformability, RBCs that adhere to a cluster deform and create large interaction surfaces between the cells. This results in high interaction energies, larger than for hard sphere suspensions. Once RBCs form a cluster of adhering cells in the polymeric fluids, either in the tubing, inlet reservoir, or channel, the RBCs stick together and are not separated by the flow.
3.2 RBC shape characteristics
Next, we characterize single-cell RBC morphology as a function of fluid type and flow conditions (Fig. 5A). To this end, we determine the single-cell length LRBC,1, diameter DRBC,1, area ARBC,1, and deformability index DIRBC,1 during capillary flow in the different solutions (Fig. 5B–E). For the control, HA03, and HA05 cases, the average single-cell length in flow is 7.5 μm, independent of the cell velocity (Fig. 5B). In contrast, LRBC,1 for HA01 exhibits higher values between 8 μm and 9 μm, and displays an increase with increasing flow velocity. This is due to a pronounced fraction of slipper-shaped and other elongated, non-croissant-like RBCs in the HA01 solution (Fig. S1D, ESI†). Slipper-like cells flow at an off-centered position in the microfluidic channel (Fig. S1E, ESI†) and exhibit an elongated shape, which results in a larger calculated single-cell length and deformability index (Fig. S1F, ESI†) based on their projection in the x–y-plane. Disregarding off-centered slipper-shaped RBCs leads to a smaller single-cell length (inset for HA01 in Fig. 5B). However, symmetry breaking in the rectangular cross-section results in slipper-like cells that are rotated by 90° in the channel cross-section. These cells flow at a centered position with respect to the x−y-plane, similar to croissants, and were, therefore, referred to as sheared croissants in previous studies.28 Similar to slipper-shaped cells in the x−y-plane of the channel, their pronounced tail (see arrow in the bottom panel of Fig. 5A for HA01) contributes to an increase in LRBC,1.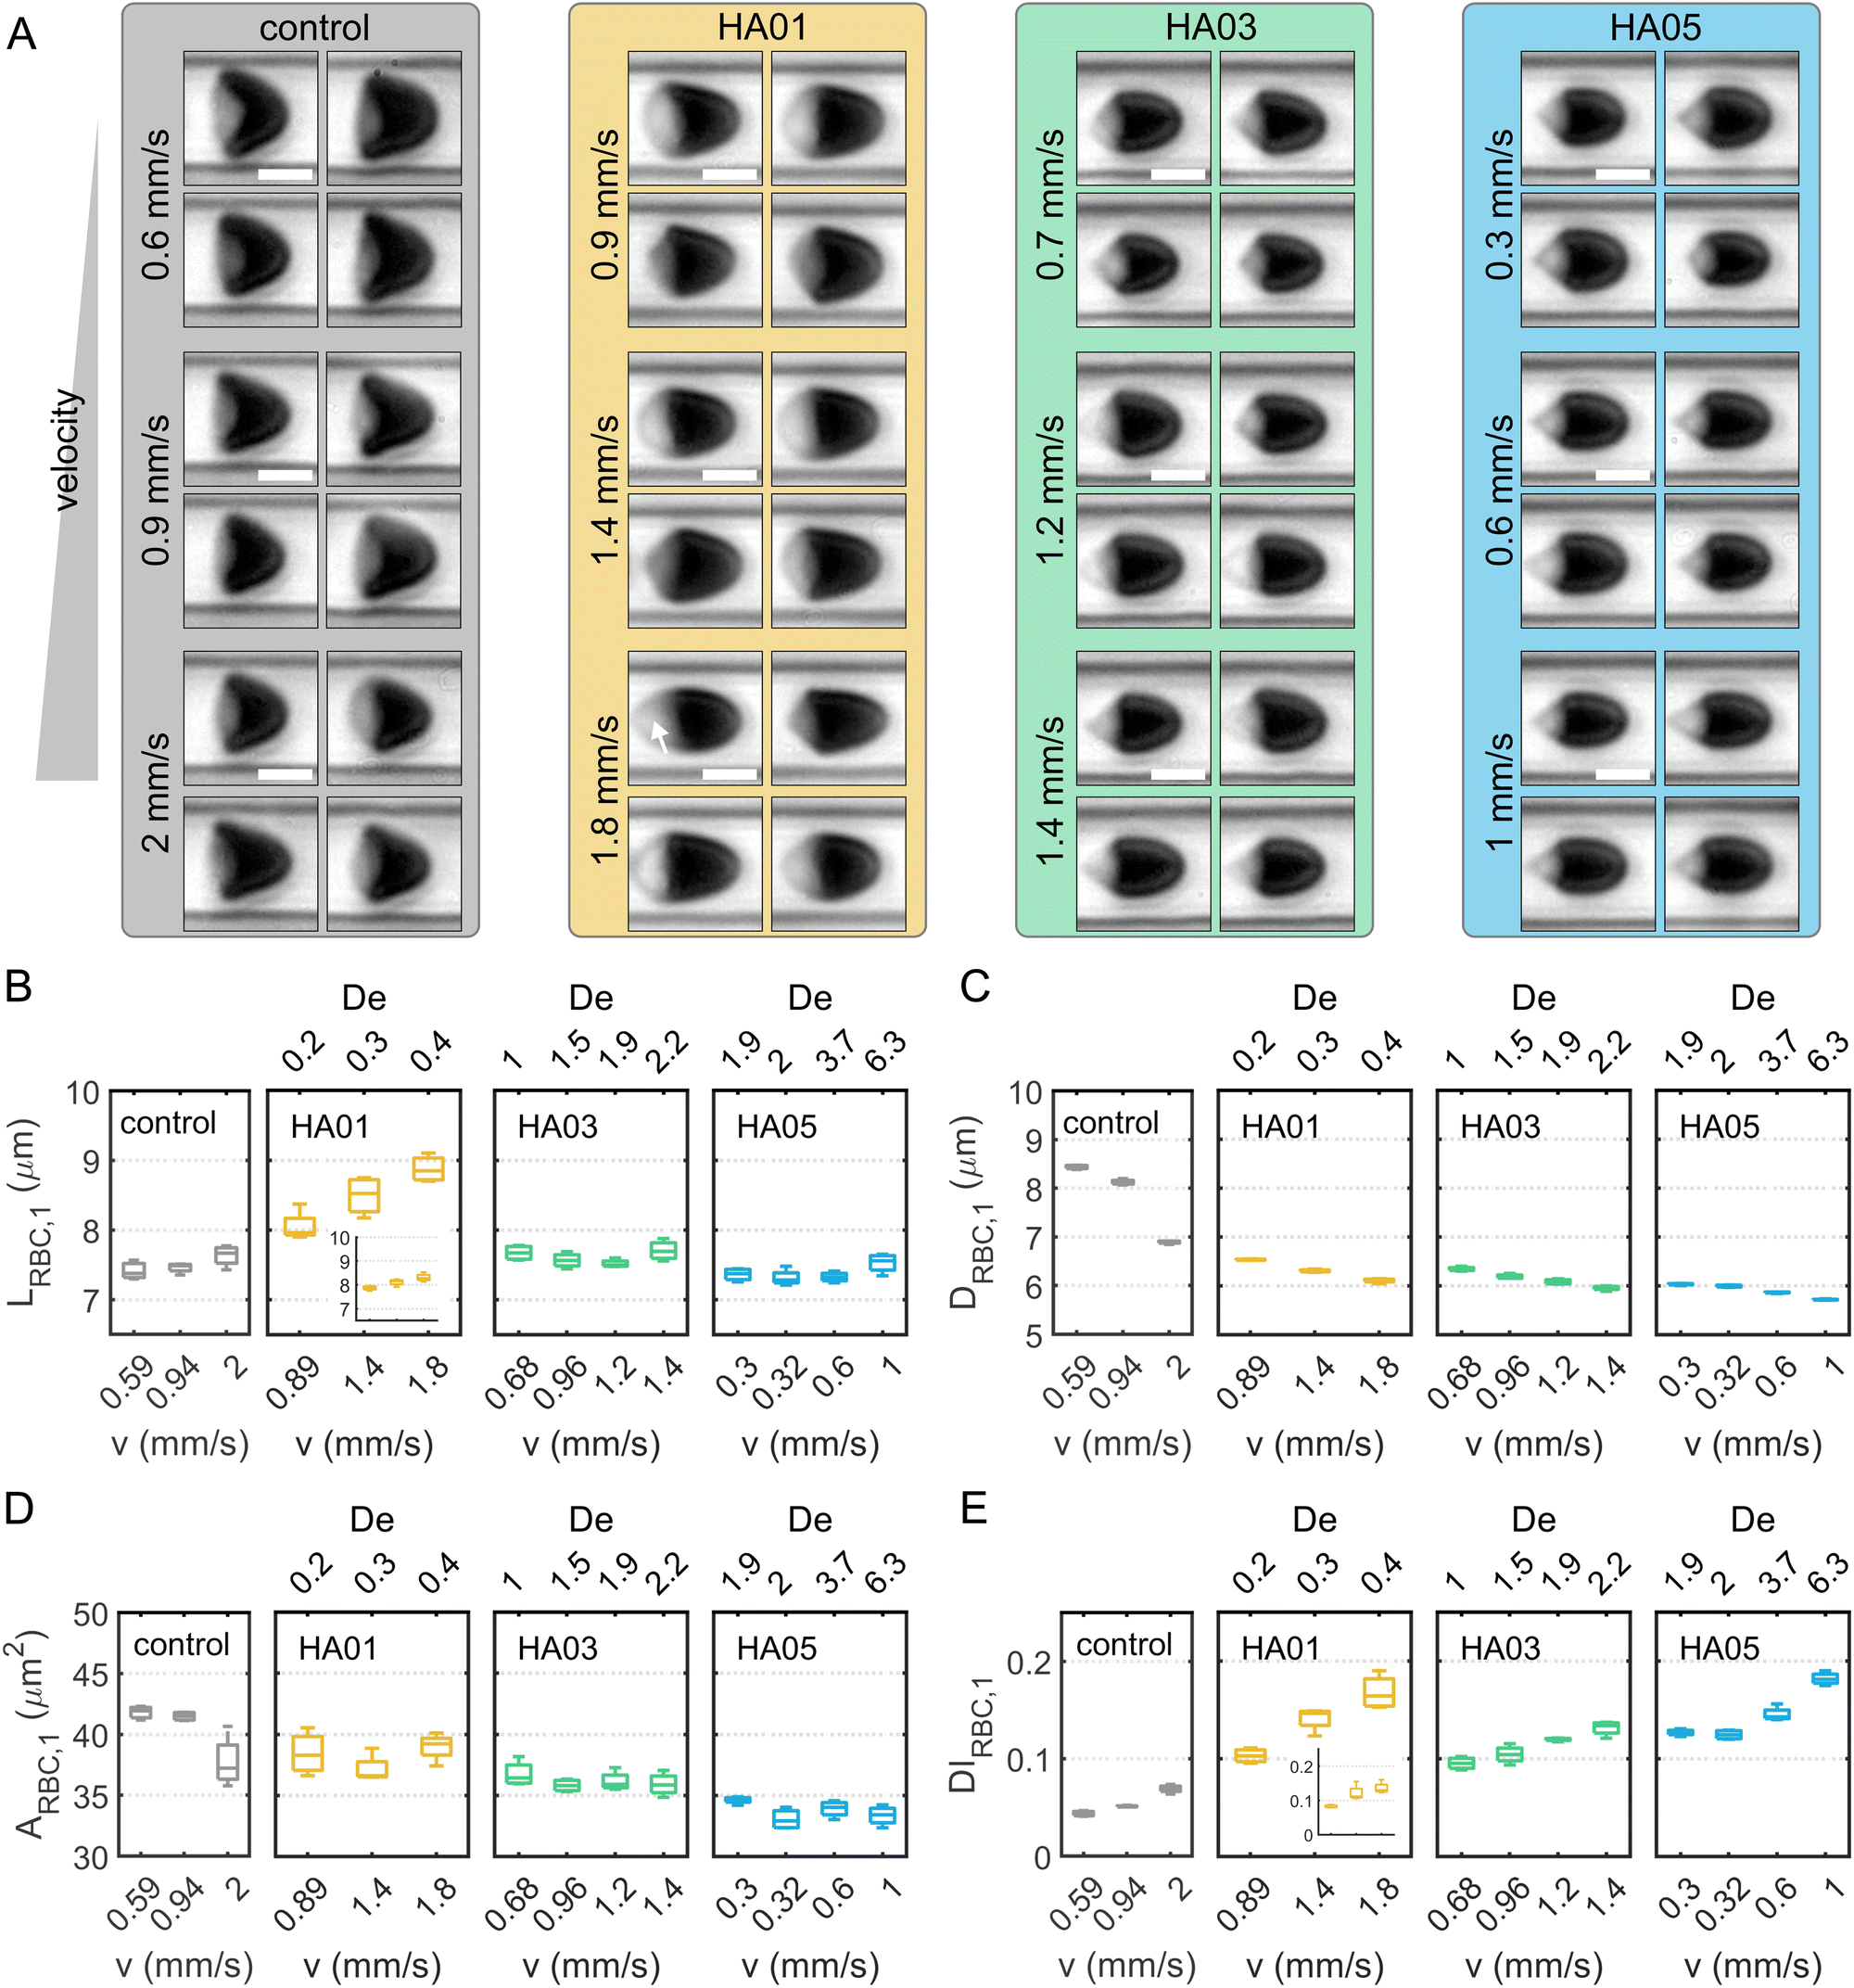 | ||
| Fig. 5 Shape characteristics of single RBCs in flow. (A) Representative images of RBC shapes for the four samples and at different cell velocities. (Scale bars, 5 μm.) The white arrow in the lower panel for HA01 indicates the projection of a pronounced RBC tail of a strongly sheared cell. (B)–(E) Boxplots of the single-cell length LRBC,1, diameter DRBC,1, projection area ARBC,1, and deformability index DIRBC,1, respectively. The insets for HA01 in (A) and (D) show the corresponding shape characteristic, omitting slipper-shaped RBCs. The bottom and top of each box are the 25th and 75th percentiles of the sample, respectively. The line in the middle of each box is the sample median. Whiskers go from the end of the interquartile range to the furthest observation. Data beyond the whisker length are marked as outliers with ‘+’ signs. | ||
The single-cell diameter DRBC,1 decreases with increasing cell velocity for all samples and is smaller in the HA solutions than in the control buffer (Fig. 5C). Compared to the parabolic velocity profile observed in Newtonian liquids, the velocity profile in shear-thinning fluids is flatter around the centerline, resulting in a squeezing of the cells and forming bullet-like RBC shapes. The projection area ARBC,1 decreases with increasing HA concentration (Fig. 5D). In the control solution, ARBC,1 is approximately 42 μm2 below cell velocities of 1 mm s−1, in good agreement with previous studies.29 The single-cell deformability index DIRBC,1 increases as the cells elongate with increasing velocity (Fig. 5E). Note that the occurrence of slipper-shaped RBCs for HA01 leads again to an apparent increase in DIRBC,1, similar to the observations regarding LRBC,1. For HA03 and H05, we observe a strong correlation of the deformability index with increasing De.
RBCs suspended in PEO follow a qualitatively similar behavior regarding their shape as in HA (Fig. S2C–G, ESI†). In the near-constant viscosity fluids, the RBC shape closely resembles the croissant-like shape found in the control buffer solution (Fig. S3B–F, ESI†). Generally, the osmolality of the suspending fluid must be considered when assessing the RBC shape and its characteristics.57 With increasing concentrations of HA and PEO, the osmolality rises up to 309.3 mOsm kg−1 (Table 1). The human plasma osmolality is primarily determined by the plasma sodium concentration with an RBC isotonic osmolality in a range of approximately 280–310 mOsm kg−1.58 Healthy RBCs can preserve their shape for osmolality values between 210–380 mOsm kg−1,59 within the osmolality range of the used polymer solutions (Table 1 and Table S1, ESI†). Our results are independent of the medium's osmolality as we do not observe a strong correlation between the RBC single-cell area in capillary flow and the osmolality of the surrounding medium for the fluids used in this study (Fig. S7, ESI†). Only the iodixanol solution has an elevated osmolality (Table S1, ESI†), and suspended RBCs display a smaller shape. Hence, we do not find a pronounced effect of the medium osmolality on the RBC shape during capillary flow by swelling or shrinking in the HA and PEO solutions.
Overall, these results demonstrate that the RBC shape is highly sensitive to the rheological properties of the surrounding medium beyond its osmolality. RBCs exhibit a squeezed, bullet-like shape in the polymeric solutions compared to the Newtonian control. Surprisingly, we find that fluid elastic stresses can lead to a different shape of RBC, even in the near-constant viscosity case (HA01 and PEO400k). For these solutions, we observed a pronounced fraction of slipper-shaped RBCs below 2 mm s−1, which usually only emerges at higher velocities in Newtonian buffer solutions. Even at low velocities, the emergence of slipper cells has been reported before using Newtonian fluids, such as dextran solutions, with a higher viscosity than the control buffer.21,60 This result indicates a dependence of the stable RBC shape on the external shear stress experienced by the cell.
3.3 RBC ordering and train formation
We now proceed to explore the behavior of RBC flowing in a microchannel under the large confinement of β = DRBC,1/Dh = 0.94 (Fig. 6). By looking at the experimental snapshots in Fig. 6, we notice that RBCs align along the channel centreline irrespective of the liquids in which they are suspended. However, the distance between consecutive cells is strongly affected by the properties of the suspending liquids. For instance, in both the Newtonian control buffer (Fig. 6A) and the HA01 with negligible shear-thinning properties, RBCs tend to be close to each other. For HA03 and HA05, both presenting shear-thinning properties, RBCs arrange to form equally-spaced structures reminiscent of the viscoelastic particle trains recently observed in the literature.35,36,46 To fully characterize the onset of RBC-ordered train structures, we employed the normalized distance S* = s/LRBC,1 with s as the distance between consecutive single RBCs or clusters (Fig. 3A). Hence, S* = 0 if two objects are in close contact yet can still be distinguished as two single objects. It is well established that the bulk concentration is not an appropriate parameter to study ordering because of the fluctuations of objects entering the device.35,61 For this reason, we employ the local RBC concentration ϕl = NRBCLRBC,1/Lf, in agreement with previous studies,35,36 where NRBC is the number of RBCs in the observation window and Lf is the length of the observation window. Consequently, frames of the image sequence that contain the same ϕl are identified, and the distributions of the normalized distance S* between two cells in these frames are evaluated. Moreover, data is analyzed in two regions of interest at L/Dh = 120 and L/Dh = 1200 downstream of the channel entrance.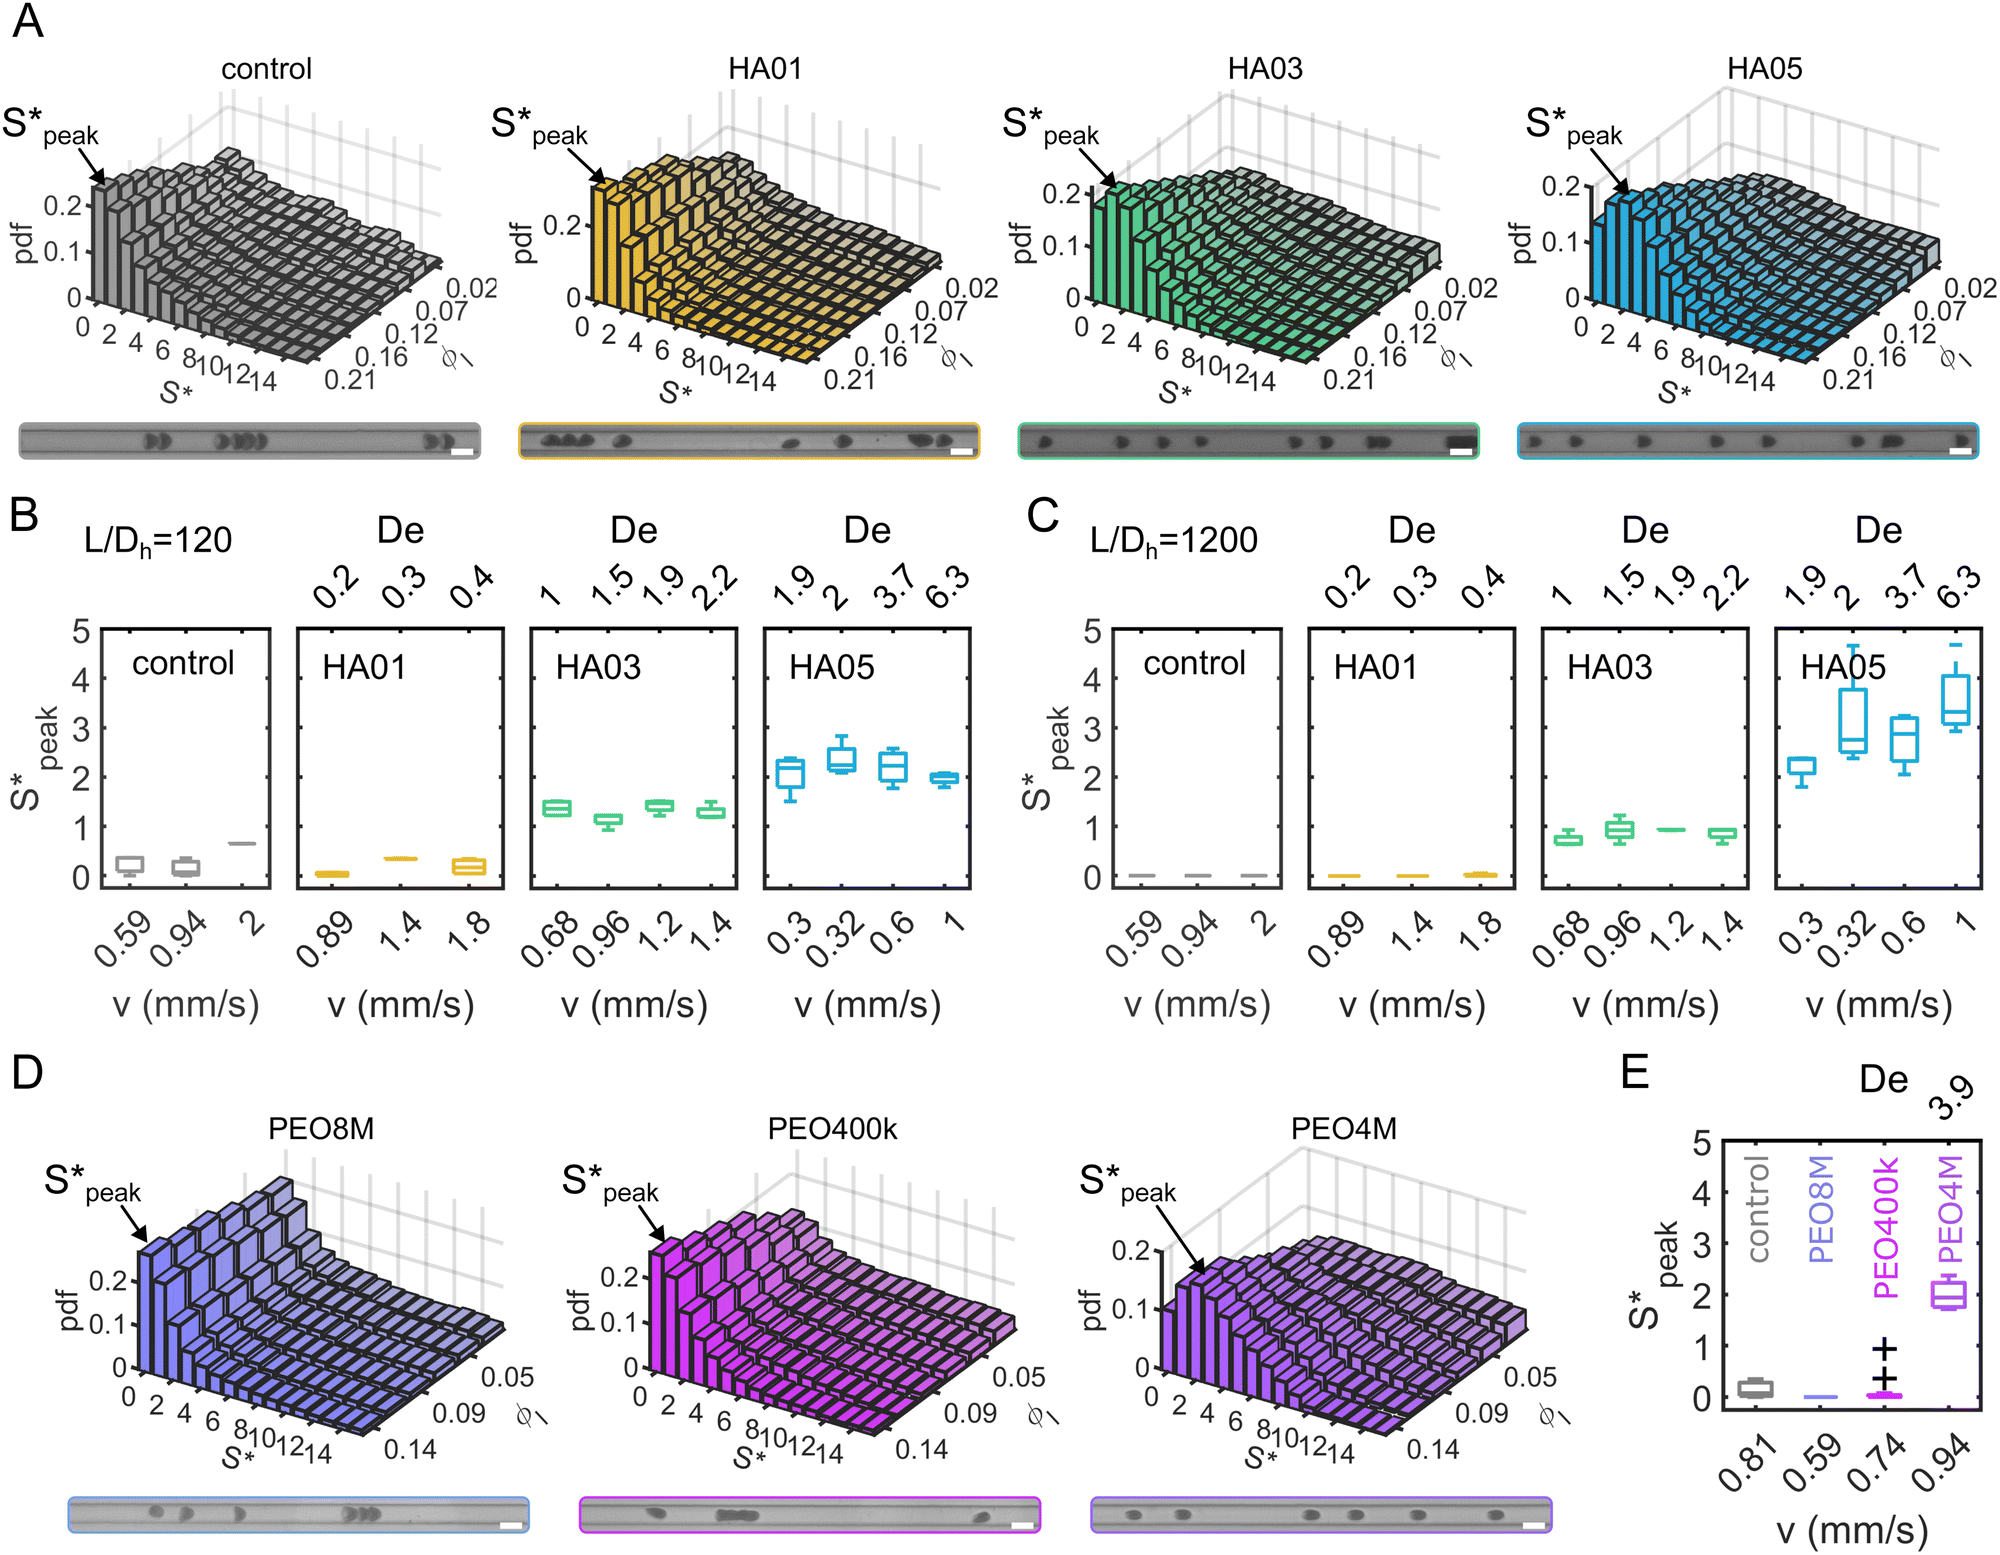 | ||
Fig. 6 Ordering of RBCs in viscoelastic confined flows. (A) Probability density distributions (PDF) of the normalized distance S* = s/LRBC,1 as a function of the local RBC concentration ϕl. Data is shown for control (v = 0.6 mm s−1, De = 0), HA01 (v = 1.8 mm s−1, De = 0.4), HA03 (v = 1.2 mm s−1, De = 1.9), and HA05 (v = 1 mm s−1, De = 6.3) at L/Dh = 120. (B) and (C) Boxplots of the peak distance  at L/Dh = 120 and L/Dh = 1200, respectively. (D) PDF of S* for the different PEO samples as a function ϕl. Data is shown for PEO8M (v = 0.74 mm s−1), PEO400k (v = 0.81 mm s−1), and PEO4M (v = 0.59 mm s−1, De = 3.9) at L/Dh = 120. (D) Boxplots of the peak distance for the PEO samples at L/Dh = 120. The arrows in (A) and (D) indicate the peak value at L/Dh = 120 and L/Dh = 1200, respectively. (D) PDF of S* for the different PEO samples as a function ϕl. Data is shown for PEO8M (v = 0.74 mm s−1), PEO400k (v = 0.81 mm s−1), and PEO4M (v = 0.59 mm s−1, De = 3.9) at L/Dh = 120. (D) Boxplots of the peak distance for the PEO samples at L/Dh = 120. The arrows in (A) and (D) indicate the peak value  of the corresponding PDF at the highest local concentration. Inset images below the graphs in (A) and (D) show representative experimental snapshots with N = 8 individual objects (single RBCs or clusters) in the field of view (ϕl ≈ 0.21) for the HA solutions and N = 6 individual objects (ϕl ≈ 0.14) for the PEO solutions. (Scale bars, 10 μm.) Data in (B), (C), and (D) is shown at a bulk RBC concentration of 3%Ht. The bottom and top of each box in (B), (C), and (D) are the 25th and 75th percentiles of the sample, respectively. The line in the middle of each box is the sample median. Whiskers go from the end of the interquartile range to the furthest observation. Data beyond the whisker length are marked as outliers with ‘+’ signs. of the corresponding PDF at the highest local concentration. Inset images below the graphs in (A) and (D) show representative experimental snapshots with N = 8 individual objects (single RBCs or clusters) in the field of view (ϕl ≈ 0.21) for the HA solutions and N = 6 individual objects (ϕl ≈ 0.14) for the PEO solutions. (Scale bars, 10 μm.) Data in (B), (C), and (D) is shown at a bulk RBC concentration of 3%Ht. The bottom and top of each box in (B), (C), and (D) are the 25th and 75th percentiles of the sample, respectively. The line in the middle of each box is the sample median. Whiskers go from the end of the interquartile range to the furthest observation. Data beyond the whisker length are marked as outliers with ‘+’ signs. | ||
The quantitative analysis of RBC distance distributions confirms the experimental observations. Notably, for HA03 and HA05, we observed the occurrence of a clear peak between 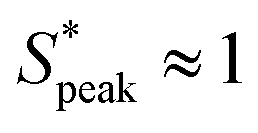 and
and 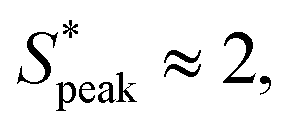 meaning that there now is a characteristic distance between consecutive RBCs, thus establishing the first experimental evidence of viscoelastic ordering on cells. The prominence of this peak increases with increasing local concentration, demonstrating the existence of a preferential inter-RBC distance S* > 0 and the formation of RBC trains in the strongly shear-thinning, viscoelastic HA solutions (see bottom insets in Fig. 6A). This peak value is independent of the cell velocity and De (Fig. 6B), in agreement with previous studies on rigid particles.35,46 We observe an increase in the preferential inter-RBC distance further downstream at L/Dh = 1200 for HA05, where the peak in the S* distribution shifts to
 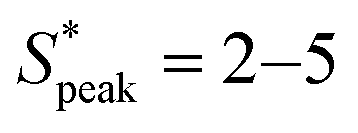 (Fig. 6C and Fig. S8A, ESI†). Our results also echoed previous experimental46 and numerical33 studies on the viscoelastic ordering of rigid particles, where ordered structures were observed in viscoelastic shear-thinning liquids but not in viscoelastic liquids with constant viscosity. Jeyasountharan et al.36 reported that an increase of the confinement ratio from β = 0.2 to β = 0.45 promoted the formation of equally-spaced structures over shorter channel lengths, with particles ordered at L/Dh > 2000 for β = 0.2 and particles ordered at L/Dh > 1000 for β = 0.45. In our case, with β = 0.94, we observed the formation of the RBC trains already at L/Dh = 120. According to Jeyasountharan et al.,36 the ordering for rigid particles is expected to scale with β3 when defining S* with respect to the particle characteristic length rather than the channel diameter. Since our β is approximately two times β = 0.45, the ordering should be observed at an S* roughly eight times smaller, meaning 1000/8 = 125, in excellent agreement with our observations.
Our results are general and not only restricted to HA solutions. RBCs in the PEO8M solution show similar behavior as in the control buffer with a pronounced peak in the distance distribution at S* = 0 independent of the local concentration (Fig. 6D). Similarly, the viscoelastic, near-constant viscosity PEO400k solution does not induce RBC ordering at the investigated cell velocities. As opposed to this, we observe a pronounced peak at  in the inter-RBC distribution for the viscoelastic, strongly shear-thinning PEO4M solution (Fig. 6E). RBCs in the other constant viscosity fluids do not self-assemble into equally-spaced cell trains (Fig. S8B, ESI†).
3.4 Forces between RBCs
We now use numerical simulations to gain insights into the main forces responsible for the ordering of RBCs in viscoelastic fluids. Specifically, we want to clarify whether the RBC ordering is caused by the fluid elasticity alone or whether it is a combination of suspending liquid viscoelasticity and RBC shapes. We performed numerical simulations using two viscoelastic constitutive models, namely the Giesekus and the FENE-P models (see Section 2.1.4). Parameters for the fluid rheological models used in the numerical simulations are obtained by fitting them to experimental data (Table 1). In addition, the RBC shape used in the simulations is obtained from the experiments (Fig. 5). In the simulations, we extract the flow field, the forces between the RBCs, and the fluids stresses around the RBCs for different configurations of surface–surface RBC distances S* and Weissenberg numbers Wi.The streamlines of the velocity field between the RBCs (Fig. 7A) exhibit vortical structures, similar to experimental flow field measurements in the vicinity of two RBCs in capillaries.62 At this distance and Wi, changes in the x normal stress component of the polymeric extra-stress relative to that in an empty pipe flow (τxx − τxx,∞) develop (Fig. 7B). We observe a high-stress region that appears on the right of the trailing RBC, which gives rise to a net force that pushes the RBCs away. As the RBCs are brought together, the elastic wakes formed in front and behind each RBC interact to yield a net repulsion, similar to numerical simulations on rigid spheres.33 Moreover, high-stress regions on both sides near the tail of the RBCs emerge. This leads to a repulsion between RBCs and the wall, which could explain the emergence of squeezed bullet-like cells observed in the experiments. Representative velocity and stress fields around a single RBC and cells spaced at various surface-to-surface distances are shown in Fig. S9 (ESI†).
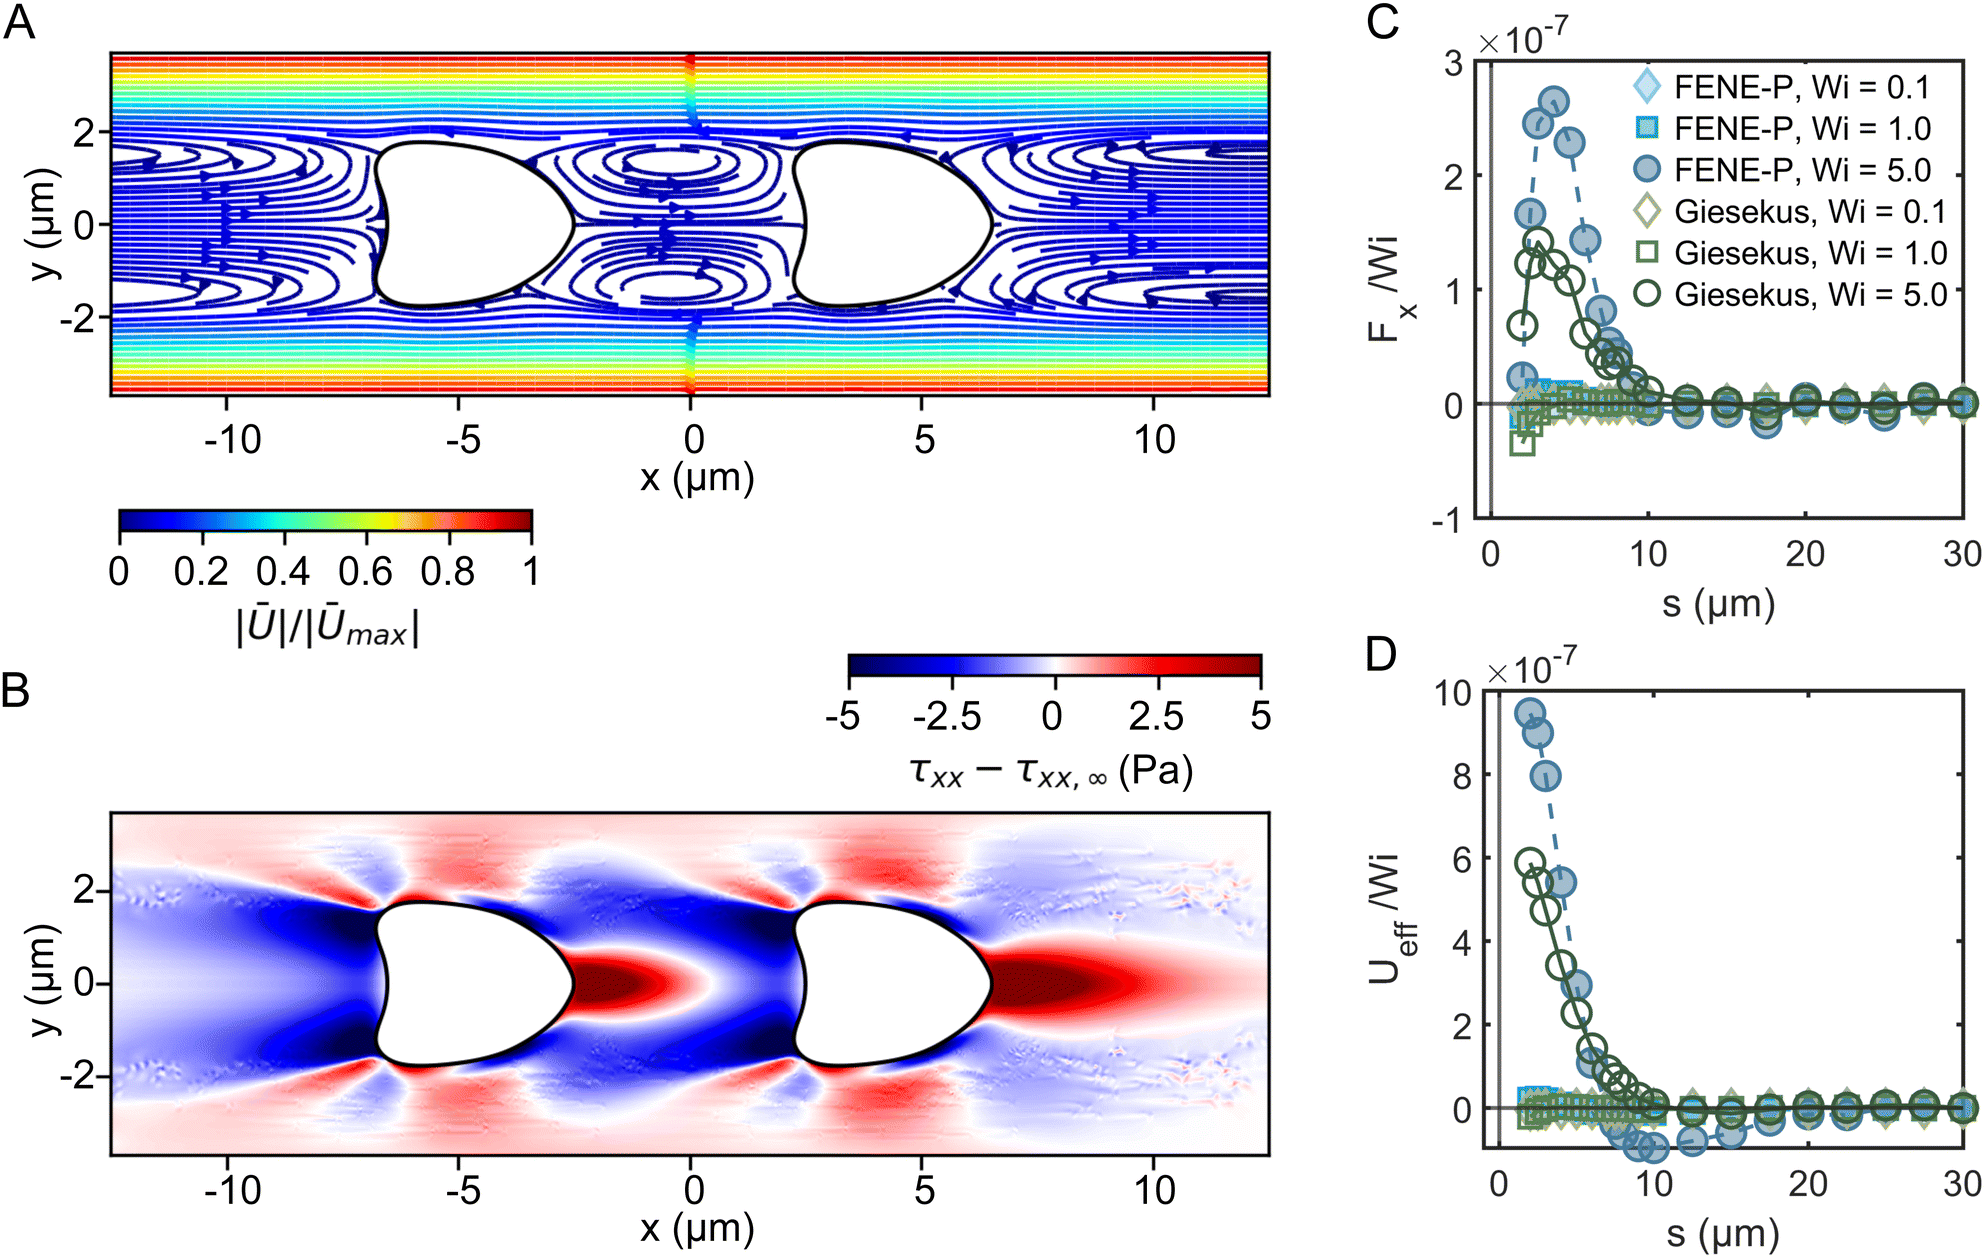 | ||
| Fig. 7 Numerical simulations of two croissant-shaped RBCs in different polymer solutions. (A) Streamlines of the velocity field of the system around RBCs at a surface-surface separation of 5 μm and Wi = 5.0 using the Giesekus model. (B) Visualization of the differences in the x normal stress component for the same system as in (A). (C) The pair-force between RBCs, rescaled with the Wi of the flow, against the surface–surface displacement between the two RBCs. Positive force indicates a net repulsion between RBCs, while negative forces indicate a net attraction. As the Wi is increased to Wi ≫ 1, RBCs develop a substantial repulsion at approximately one RBC diameter. Shear-thinning, present in the Giesekus model, modifies the turn-on of the viscoelastic repulsion. (D) Effective pair-potential between RBCs, calculated by numerically integrating the force curves in (C). | ||
Simulations allow us to calculate the force curves and effective pair potential between RBCs as a function of the RBC distances S* for the explored models and Weissenberg numbers (Fig. 7C and D). Positive force indicates an observed repulsion between the RBCs, while negative force indicates attraction. For Wi ≪ 1, both models show a short-ranged attraction that starts at approximately 5 μm. As Wi is increased, we find in both models that the attraction at short distances is overwhelmed by new repulsive forces. The turn-on of the repulsion is modified and weakened in the Giesekus model at intermediate and high Wi. Thus, we believe that the mechanism of the pair repulsion comes mainly from the elasticity of the fluid, and it seems that for Wi ≫ 1, the repulsion can be obtained despite the fluid shear-thinning properties. Nevertheless, shear-thinning viscosity appears to modulate the repulsion by reducing the velocity gradients around the center line of the fluid, leading to lessened elastic stresses.
In summary, our numerical simulations demonstrate that the fluid elasticity produces significant repulsion between the cells above Wi ≫ 1. Similarly, the Weissenberg number for the solutions where we observe RBC ordering (HA03, HA05, and PEO4M) is always larger than one at the probed shear rate in the microfluidic channel experiments (Fig. 2C). In contrast, Wi ≪ 1 for HA01 and PEO400k, based on an upper estimation of the maximum Weissenberg number for these weakly viscoelastic fluids (Fig. 2C). Potentially, experimental RBC ordering could also appear in these solutions at much larger shear rates when Wi ≫ 1, as predicted by our numerical simulations. However, this would require a higher pressure drop for the microfluidic chip and fluids used, resulting in channel de-bonding in our experimental apparatus. Using a different type of bonding method based on adhesive tape can provide higher bonding strength. Still, it can also lead to surface modification, thus altering the overall interpretations of the results. For this reason, we believe such an analysis of ordering in viscoelastic near-constant-viscosity liquids at Wi ≫ 1 falls behind the scope of this work.
4 Discussion and conclusions
Our results show that the interplay of fluid stresses, cell shape, and volume fraction can lead to the ordering of RBCs in microflows. We provide the first experimental evidence that fluid elasticity can lead to highly deformable, anisotropic RBCs that self-assemble into trains with a preferential inter-cell distance. Using two different polymers in combination with different polymer concentrations and molecular weights, we experimentally show that viscoelastic, shear-thinning features of the suspending medium are required for RBC ordering independent of the molecular architecture of the monomer. This result transcends the nature of the individual polymers (e.g., HA or PEO), and can be generalized to the specific bulk rheological properties. For rigid particles, migration towards the channel centerline and ordering is commonly observed in viscoelastic fluids for confinement ratios β > 0.15.63 In this study, we impose velocities at which mainly croissant-shaped RBCs emerge.20 Hence, RBCs preferentially flow at a stable equilibrium position at the channel centerline y/W = 0 (Fig. S1C, ESI†). We show that this cell alignment along the channel flow direction is reached relatively quickly in the first region of interest (L/Dh = 120) in accordance with previous studies.53 In combination with the high confinement ratio of β ≈ 0.94 in the present work, cell train formation of aligned RBCs is achieved already at L/Dh = 120 after the fluid inlet, which presents a sweet spot for both cell ordering and RBC shape assessment.20 The observed inter-RBC distance, represented by the peak in the distribution of the normalized cell distance is independent of De within the investigated Deborah number regime, as long as a Deborah number above the critical one describes the flow. For RBCs, a clear peak in the distribution of inter-particle distances can be observed at local concentrations larger than ϕl ≥ 0.1, similar to the required local concentration for rigid beads.35
Self-assembled croissant-shaped RBCs exhibit a more squeezed shape in flow with respect to the channel width and resemble the shape of a bullet in the HA and PEO solutions compared to cells in the control buffer solution. Simultaneously, the single-cell deformability index DI of these centered shapes shows a pronounced increase with the Deborah number. A similar cell stretching and the occurrence of bullet-like RBC shapes have been observed in micro-confined RBC flow using Newtonian buffer solutions.64,65 However, these shape configurations were induced by compressing the cells in channels with a width smaller than 10 μm, hence smaller than the RBC size. In contrast, the shape changes observed in this study emerge as a consequence of the blunted velocity profile in the channel cross-section using shear-thinning fluids. While we focus on characterizing the effect of fluid viscoelastic on centered croissant-like shapes in the present study, future work will be required to investigate these effects on the off-centered slipper and other dynamic RBC shapes. This comprehensive framework will then encompass all shapes commonly observed in the so-called RBC shape phase diagram20 and the potential of cell-ordering of stable and dynamic shapes.
Assessing the RBC shape and its characteristics, such as the cell's deformability index DI, during microfluidic flow has received increasing attention as a tool to evaluate pathological cell changes induced by diseases such as malaria, hemoglobinopathies, and COVID-19,8–10,29 and to assess stored blood quality.18,66 Based on the results presented in this study, future work is required to verify if cell ordering of such impaired RBCs is possible and to evaluate how the addition of polymers and deviations from the parabolic velocity profile affect the shape of diseased RBCs. Addressing these points and exploring polymer solutions, such as the HA and PEO solutions used in this study, in microfluidic single-cell analysis techniques will further expand our understanding of self-assembling systems beyond rigid particles and enhance various biomedical applications.
Viscoelastic ordering has been found to improve the encapsulation efficiency of flowing particles well above the Poisson statistics limit, but this has only been demonstrated for rigid particles.67,68 Our findings on RBC confirm that it is also possible to order living cells. This means that single-cell analysis of encapsulated cells using viscoelastic liquids is now feasible.
Author contributions
S. M. R. and F. D. G. designed research; S. M. R. and Y. R. performed experiments; I. G. and P. E. A. performed numerical simulations; S. M. R., Y. R., I. G., and F. D. G. analyzed data; S. M. R., Y. R., I. G., P. E. A., F. D. G., and C. W. wrote the paper; S. M. R., C. W., and P. E. A. supervised research.Conflicts of interest
There are no conflicts of interest to declare.Acknowledgements
This research was funded by the Deutsche Forschungsgemeinschaft (DFG, German Research Foundation) – project number 349558021 (WA 1336/13-1 and RE 5025/1-2). Y. R. acknowledges funding by the Marie Skłodowska-Curie grant agreement no. 860436—EVIDENCE. F. D. G. acknowledges partial support from EPSRC (Grant no. EP/S036490/1).Notes and references
- R. Monahan-Earley, A. M. Dvorak and W. C. Aird, J. Thromb. Haemostasis, 2013, 11, 46–66 CrossRef PubMed.
- S. O. Catarino, R. O. Rodrigues, D. Pinho, J. M. Miranda, G. Minas and R. Lima, Micromachines, 2019, 10, 593 CrossRef PubMed.
- G. Tomaiuolo, Biomicrofluidics, 2014, 8, 051501 CrossRef PubMed.
- K. Matthews, E. S. Lamoureux, M.-E. Myrand-Lapierre, S. P. Duffy and H. Ma, Lab Chip, 2022, 22, 1254–1274 RSC.
- R. Skalak and P. I. Brånemark, Science, 1969, 164, 717–719 CrossRef CAS.
- Y. Suzuki, N. Tateishi, M. Soutani and N. Maeda, Microcirculation, 1996, 3, 49–57 CrossRef CAS PubMed.
- M. Nouaman, A. Darras, T. John, G. Simionato, M. A. E. Rab, R. van Wijk, M. W. Laschke, L. Kaestner, C. Wagner and S. M. Recktenwald, Cells, 2023, 12, 1529 CrossRef CAS.
- J. Stuart and G. Nash, Blood Rev., 1990, 4, 141–147 CrossRef CAS PubMed.
- R. Mannino, D. R. Myers, Y. Sakurai, R. E. Ware, G. Barabino and W. Lam, Blood, 2012, 120, 818 CrossRef.
- A. Rabe, A. Kihm, A. Darras, K. Peikert, G. Simionato, A. K. Dasanna, H. Glaß, J. Geisel, S. Quint, A. Danek, C. Wagner, D. A. Fedosov, A. Hermann and L. Kaestner, Biomolecules, 2021, 11, 727 CrossRef CAS PubMed.
- A. R. Pries and T. W. Secomb, Microcirculation, Elsevier, 2008, pp. 3–36 Search PubMed.
- L. Lanotte, J. Mauer, S. Mendez, D. A. Fedosov, J. M. Fromental, V. Claveria, F. Nicoud, G. Gompper and M. Abkarian, Proc. Natl. Acad. Sci. U. S. A., 2016, 113, E8207 CrossRef.
- R. Banerjee, K. Nageshwari and R. Puniyani, Clin. Hemorheol. Microcirc., 1998, 19, 21–24 CAS.
- S. Chien, Annu. Rev. Physiol., 1987, 49, 177–192 CrossRef CAS.
- D. Dannhauser, D. Rossi, F. Causa, P. Memmolo, A. Finizio, T. Wriedt, J. Hellmers, Y. Eremin, P. Ferraro and P. A. Netti, Lab Chip, 2015, 15, 3278–3285 RSC.
- M.-E. Myrand-Lapierre, X. Deng, R. R. Ang, K. Matthews, A. T. Santoso and H. Ma, Lab Chip, 2015, 15, 159–167 RSC.
- Y. Man, E. Kucukal, R. An, Q. D. Watson, J. Bosch, P. A. Zimmerman, J. A. Little and U. A. Gurkan, Lab Chip, 2020, 20, 2086–2099 RSC.
- S. M. Recktenwald, M. G. M. Lopes, S. Peter, S. Hof, G. Simionato, K. Peikert, A. Hermann, A. Danek, K. van Bentum, H. Eichler, C. Wagner, S. Quint and L. Kaestner, Front. Physiol., 2022, 13, 1–10 Search PubMed.
- G. Tomaiuolo, M. Simeone, V. Martinelli, B. Rotoli and S. Guido, Soft Matter, 2009, 5, 3736 RSC.
- A. Guckenberger, A. Kihm, T. John, C. Wagner and S. Gekle, Soft Matter, 2018, 14, 2032–2043 RSC.
- S. M. Recktenwald, K. Graessel, F. M. Maurer, T. John, S. Gekle and C. Wagner, Biophys. J., 2022, 121, 23–36 CrossRef CAS PubMed.
- D. A. Fedosov, B. Caswell, A. S. Popel and G. E. Karniadakis, Microcirculation, 2010, 17, 615–628 CrossRef.
- F. Reichel, J. Mauer, A. Ahsan Nawaz, G. Gompper, J. R. Guck and D. A. Fedosov, Biophys. J., 2019, 116, 123a–124a CrossRef.
- F. Guglietta, M. Behr, L. Biferale, G. Falcucci and M. Sbragaglia, Soft Matter, 2020, 16, 6191–6205 RSC.
- M. Abkarian, M. Faivre and A. Viallat, Phys. Rev. Lett., 2007, 98, 188302 CrossRef.
- J. Dupire, M. Socol and A. Viallat, Proc. Natl. Acad. Sci. U. S. A., 2012, 109, 20808–20813 CrossRef CAS PubMed.
- D. A. Fedosov, M. Peltomäki and G. Gompper, Soft Matter, 2014, 10, 4258–4267 RSC.
- A. Kihm, L. Kaestner, C. Wagner and S. Quint, PLoS Comput. Biol., 2018, 14, e1006278 CrossRef PubMed.
- S. M. Recktenwald, G. Simionato, M. G. Lopes, F. Gamboni, M. Dzieciatkowska, P. Meybohm, K. Zacharowski, A. von Knethen, C. Wagner, L. Kaestner, A. D'Alessandro and S. Quint, eLife, 2022, 11, 1–17 CrossRef PubMed.
- S. Yang, S. S. Lee, S. W. Ahn, K. Kang, W. Shim, G. Lee, K. Hyun and J. M. Kim, Soft Matter, 2012, 8, 5011 RSC.
- J. Nam, B. Namgung, C. T. Lim, J.-E. Bae, H. L. Leo, K. S. Cho and S. Kim, J. Chromatogr. A, 2015, 1406, 244–250 CrossRef CAS PubMed.
- J. Zhou and I. Papautsky, Microsystems Nanoeng., 2020, 6, 113 CrossRef CAS.
- G. D'Avino and P. L. Maffettone, Microfluid. Nanofluidics, 2019, 23, 82 CrossRef.
- G. D'Avino and P. L. Maffettone, Meccanica, 2020, 55, 317–330 CrossRef.
- A. Jeyasountharan, K. Shahrivar, G. D'Avino and F. Del Giudice, Anal. Chem., 2021, 93, 5503–5512 CrossRef CAS.
- A. Jeyasountharan, G. D'Avino and F. Del Giudice, Phys. Fluids, 2022, 34, 042015 CrossRef CAS.
- A. Jeyasountharan and F. Del Giudice, Micromachines, 2023, 14, 563 CrossRef PubMed.
- R. H. Ewoldt, M. T. Johnston and L. M. Caretta, Complex Fluids Biol. Syst., Springer Science + Business Media, New York, 2015, ch. 6, pp. 207–241 Search PubMed.
- C. W. Macosko, Rheology: Principles, Measurements, and Applications, Wiley-VCH, 1994 Search PubMed.
- F. Del Giudice and C. Barnes, Anal. Chem., 2022, 94, 3617–3628 CrossRef CAS PubMed.
- L. Casanellas, M. A. Alves, R. J. Poole, S. Lerouge and A. Lindner, Soft Matter, 2016, 12, 6167–6175 RSC.
- O. M. Maklad, K. McAulay, S. Lerouge, D. J. Adams and R. J. Poole, Rheol. Acta, 2022, 61, 827–840 CrossRef CAS.
- M. Nouaman, A. Darras, C. Wagner and S. M. Recktenwald, Biomicrofluidics, 2024, 18, 024104 CrossRef CAS PubMed.
- J. Friend and L. Yeo, Biomicrofluidics, 2010, 4, 026502 CrossRef PubMed.
- G. D'Avino, M. Hulsen and P. Maffettone, Comput. Fluids, 2013, 86, 45–55 CrossRef.
- F. Del Giudice, G. D'Avino, F. Greco, P. L. Maffettone and A. Q. Shen, Phys. Rev. Appl., 2018, 10, 064058 CrossRef CAS.
- S. S. Datta, A. M. Ardekani, P. E. Arratia, A. N. Beris, I. Bischofberger, G. H. McKinley, J. G. Eggers, J. E. López-Aguilar, S. M. Fielding, A. Frishman, M. D. Graham, J. S. Guasto, S. J. Haward, A. Q. Shen, S. Hormozi, A. Morozov, R. J. Poole, V. Shankar, E. S. G. Shaqfeh, H. Stark, V. Steinberg, G. Subramanian and H. A. Stone, Phys. Rev. Fluids, 2022, 7, 080701 CrossRef.
- F. Pimenta and M. Alves, J. Non-Newtonian Fluid Mech., 2017, 239, 85–104 CrossRef CAS.
- M. Alves, P. Oliveira and F. Pinho, Annu. Rev. Fluid Mech., 2021, 53, 509–541 CrossRef.
- H. A. Castillo Sánchez, M. R. Jovanović, S. Kumar, A. Morozov, V. Shankar, G. Subramanian and H. J. Wilson, J. Non-Newtonian Fluid Mech., 2022, 302, 104742 CrossRef.
- J. L. McWhirter, H. Noguchi and G. Gompper, Proc. Natl. Acad. Sci. U. S. A., 2009, 106, 6039–6043 CrossRef CAS PubMed.
- G. Tomaiuolo, L. Lanotte, G. Ghigliotti, C. Misbah and S. Guido, Phys. Fluids, 2012, 24, 051903 CrossRef.
- V. Clavería, O. Aouane, M. Thiébaud, M. Abkarian, G. Coupier, C. Misbah, T. John and C. Wagner, Soft Matter, 2016, 12, 8235–8245 RSC.
- O. Aouane, A. Farutin, M. Thiébaud, A. Benyoussef, C. Wagner and C. Misbah, Phys. Rev. Fluids, 2017, 2, 063102 CrossRef.
- B. Neu and H. J. Meiselman, Biophys. J., 2002, 83, 2482–2490 CrossRef CAS PubMed.
- P. Steffen, C. Verdier and C. Wagner, Phys. Rev. Lett., 2013, 110, 018102 CrossRef CAS PubMed.
- W. H. Reinhart, N. Z. Piety, J. S. Goede and S. S. Shevkoplyas, Microvasc. Res., 2015, 98, 102–107 CrossRef CAS PubMed.
- M. Son, Y. S. Lee, M. J. Lee, Y. Park, H.-R. Bae, S. Y. Lee, M.-G. Shin and S. Yang, PLoS One, 2021, 16, e0262106 CrossRef CAS PubMed.
- A. Abay, G. Simionato, R. Chachanidze, A. Bogdanova, L. Hertz, P. Bianchi, E. van den Akker, M. von Lindern, M. Leonetti, G. Minetti, C. Wagner and L. Kaestner, Front. Physiol., 2019, 10, 1–14 CrossRef PubMed.
- M. Abkarian, M. Faivre, R. Horton, K. Smistrup, C. A. Best-Popescu and H. A. Stone, Biomed. Mater., 2008, 3, 034011 CrossRef PubMed.
- S. Kahkeshani, H. Haddadi and D. Di Carlo, J. Fluid Mech., 2016, 786, R3 CrossRef.
- F. Yaya, J. Römer, A. Guckenberger, T. John, S. Gekle, T. Podgorski and C. Wagner, Microcirculation, 2021, 28, 1–8 CrossRef PubMed.
- F. Del Giudice, S. Sathish, G. D'Avino and A. Q. Shen, Anal. Chem., 2017, 89, 13146–13159 CrossRef CAS PubMed.
- S. Guido and G. Tomaiuolo, C. R. Phys., 2009, 10, 751–763 CrossRef CAS.
- G. Tomaiuolo, L. Lanotte, R. D'Apolito, A. Cassinese and S. Guido, Med. Eng. Phys., 2016, 38, 11–16 CrossRef PubMed.
- M. Doan, J. A. Sebastian, J. C. Caicedo, S. Siegert, A. Roch, T. R. Turner, O. Mykhailova, R. N. Pinto, C. McQuin, A. Goodman, M. J. Parsons, O. Wolkenhauer, H. Hennig, S. Singh, A. Wilson, J. P. Acker, P. Rees, M. C. Kolios and A. E. Carpenter, Proc. Natl. Acad. Sci. U. S. A., 2020, 117, 21381–21390 CrossRef CAS PubMed.
- K. Shahrivar and F. Del Giudice, Soft Matter, 2021, 17, 8068–8077 RSC.
- K. Shahrivar and F. Del Giudice, Soft Matter, 2022, 18, 5928–5933 RSC.
Footnote |
| † Electronic supplementary information (ESI) available: One PDF containing additional experimental and numerical data. See DOI: https://doi.org/10.1039/d4sm00446a |
| This journal is © The Royal Society of Chemistry 2024 |