 Open Access Article
Creative Commons Attribution 3.0 Unported Licence
Hydrogel–tissue adhesion by particle bridging: sensitivity to interfacial wetting and tissue composition†
Raphaël
Michel
 *ab and
Laurent
Corté
 *ac
*ac
aMolecular, Macromolecular Chemistry, and Materials, ESPCI Paris, CNRS, PSL University, 10 rue Vauquelin, 75005, Paris, France. E-mail: raphael.michel@cermav.cnrs.fr
bUniversité Grenoble Alpes, CNRS, CERMAV, 38000 Grenoble, France
cCentre des Matériaux, MINES Paris, CNRS, PSL University, 63-65 rue Henri-Auguste Desbruères, 91003, Evry, France. E-mail: laurent.corte@minesparis.psl.eu
First published on 6th June 2024
Abstract
Solid particles placed at the interface between hydrogels and biological tissues can create an adhesive joint through the adsorption of macromolecules onto their surfaces. Here, we investigated how this adhesion by particle bridging depends on the wetting of tissue surfaces and on the heterogeneities in tissue composition. Ex vivo peeling experiments were performed using poly(ethylene glycol) films coated with aggregates of silica nanoparticles deposited on the internal tissues of porcine liver. We show that the adhesion produced by particle bridging is altered by the presence of fluid wetting the tissue–hydrogel interface. For both uncoated and coated films, a transition from lubricated to adhesive contact was observed when all the interfacial fluid was drained. The presence of a silica nanoparticle coating shifted the transition towards more hydrated conditions and significantly enhanced adhesion in the adhesive regime. After 5 min of contact, the adhesion energy achieved on liver parenchyma with the coated films (7.7 ± 1.9 J m−2) was more than twice that of the uncoated films (3.2 ± 0.3 J m−2) or with a surgical cyanoacrylate glue (2.9 ± 1.9 J m−2). Microscopic observations during and after peeling revealed different detachment processes through either particle detachment or cohesive fracture in the tissue. These mechanisms could be directly related to the microanatomy of the liver parenchyma. The effects of both interfacial wetting and tissue composition on adhesion may provide guidelines to tailor the design of tissue adhesives using particle bridging.
1. Introduction
Particle bridging consists in placing solid particles at the interface between two pieces of polymer gels to create adhesion.1 Binding between the two pieces occurs when numerous polymer strands from both gels adsorb onto the particles which then act as connectors across the interface. This effect was demonstrated in the case of polymer hydrogels using nanoparticles (NPs) or microscopic aggregates of nanoparticles.1–4 Interestingly, it can also be applied to create adhesion to biological tissues which are composed of hydrated networks of biomacromolecules. In their seminal study, Rose et al. achieved ex vivo adhesion by gluing two pieces of calf liver with a solution of silica nanoparticles.1 An in vivo study by Meddahi-Pelé et al. on rat models showed that poly(vinyl alcohol)- and polysaccharide-based hydrogel membranes coated with aggregates of silica NPs adhered within a minute to the bleeding surface of a resected liver as well as to the surface of a beating heart.5 Following these works, several studies have investigated the adhesion to biological tissues by particle bridging using various types of particles such as silica,3–8 bioactive glass,9,10 silicon11 and diverse metal oxides.5,9 Particles were designed to combine the particle bridging effect with other functionalities such as antibacterial6 and antioxidant properties8 as well as enhanced contrast for medical imaging.7,11 Such tissue adhesives could be of practical interest for a large array of biomedical applications including hemostasis,12 wound dressing12,13 or topical drug and cell delivery.14 Nevertheless, for these applications, the design of efficient particle bridging adhesives is greatly challenged by the wet conditions of the contact area, which may hinder the adsorption of polymer strands, and by the variability and heterogeneity of the tissue composition, which may require a specific design of particle surfaces for each case. In this work, we explored these two effects using model ex vivo peeling experiments.One major difficulty in creating adhesion onto biological tissues arises from the fact that living tissues are highly hydrated. Living tissue surfaces are submitted to a continuous wetting that dilutes possible reactive moieties and prevents molecular interactions across the interface. Adhesion can be promoted by draining the interfacial fluid and dehydrating the tissues. This effect was first reported in the case of mucoadhesion. Studies by Smart and coworkers showed how adhesion to the mucus increases with local mucus dehydration.15,16 More recently, we showed through peeling experiments of hydrogel membranes on porcine liver tissues, that the capacity of the hydrogel to drain the interfacial fluid is a key factor to achieve adhesion onto tissues.17 A model describing the competition between wetting of the interface by tissue fluids and draining of the interface by hydrogel swelling captured the transition from a lubricated to an adhesive contact. In a separate study, Yuk et al. further combined these interfacial draining and tissue dehydration effects using appropriate surface chemistry to design superabsorbant double-sided tapes with remarkable in vivo tissue adhesive performances.18 In the case of particle bridging, little is known about the sensitivity toward wet conditions. However, pull-off tests on the capsule of porcine liver using hydrogel patches coated with silica nanoparticles showed a five-fold drop in adhesion strength when comparing ex vivo to in vivo conditions.19 This effect most likely arises from differences in tissue hydration and strongly suggests that particle bridging onto tissues is altered by interfacial wetting.
Another critical consideration is the sensitivity of particle bridging to the tissue composition. The surface of biological tissues has complex macro- and microscopic morphologies with heterogeneous composition and mechanical properties. Therefore, heterogeneities in the tissue may lead to heterogeneities in the adhesive properties. This is well illustrated by studies using bare hydrogels (without interfacial NPs) on different tissues (i.e. from different organs).20,21 In these cases, a single hydrogel system exhibits dissimilar adhesive performances depending on the nature of the tissue substrate. Building on this observation, it has been shown that tuning the chemistry of a gel, for instance by increasing the density of certain chemical functions (aldehyde), can improve its adhesive performance on a given tissue.20,22 This underlines the necessity of adapting the hydrogel chemistry to the specific tissue composition. Therefore, in the case of adhesion by particle bridging, it appears necessary to define which part of the tissue preferentially adheres to the particles in order to improve their adhesive role.
Here, we address these questions experimentally using an ex vivo system to measure the adhesion produced by silica nanoparticle aggregates placed at the interface between poly(ethylene glycol) (PEG) films and porcine liver tissues. These aggregates of silica nanoparticles are similar to the ones used in previous ex vivo and in vivo studies.19 The cross-linked PEG films were specifically formulated to display an almost purely elastic behaviour. Therefore, the dissipation in the bulk of the film during the debonding process is negligible and the measured work of adhesion corresponds mainly to the mechanisms occurring near the interface. Adhesion testing was performed on porcine liver which is commonly used to assess the properties of surgical adhesives.7,18,19,21 It is a particularly challenging substrate and the reported adhesion values are usually substantially lower than the ones obtained on other organs such as the heart or the small intestine.18,21 We focus on the mechanisms of particle bridging onto the internal tissues of porcine liver, referred to here as parenchyma. These internal tissues exhibit a microanatomy consisting of adjacent structural units called the liver lobules that have a polygonal shape with a characteristic size varying from 1 mm to 2.5 mm.23,24 Two types of tissues compose this lobular structure: (i) the lobule interior made of a porous cellular tissue containing mostly hepatocytes with a variety of other cells (Kupfer cells, endothelial cells and stellate cells) forming a porous network of blood and bile vessels23 and (ii) the lobular walls also called connective tissue septa that surround the lobules and are essentially made of extracellular matrix proteins (collagen type I, III and IV, and fibronectin).25 Upon contact with coated PEG films, these heterogeneities in composition may lead to distinct interactions with the nanoparticles and yield different local adhesive behaviours. Using porcine hepatic parenchyma as an ex vivo model also gives us the possibility to precisely adjust the hydration of superficial tissue layers by immersing liver samples in physiological serum for a specific time.17 In the following, experiments were performed on liver substrates with varying water content so as to probe the influence of tissue hydration on the adhesive performance of NP-coated hydrogels. Due to the absence of tissue vascularization, ex vivo adhesion with long contact times is expected to be less representative of the in vivo conditions. For this reason, we were primarily interested in probing short contact times. The sensitivity to tissue composition was investigated via microscopic observations of the detachment mechanisms during peeling.
The present study first reveals that adhesion by particle-bridging is altered on highly hydrated tissues for which interfacial wetting prevents molecular contact. Depending on the ability of the NP-coated films to drain interfacial fluids, lubricated or adhesive contact may be achieved. Additionally, we find that the capillary absorption of fluids within the porosities of the NP-coating contribute to interfacial draining and thus improve the adhesive performance in moderately hydrated conditions. Secondly, our experiments demonstrate that the strength of the particle bridging mechanism varies with the local composition and nature of the tissues. On heterogeneous tissues like the liver parenchyma, the joint formed by tough collagen-rich tissues adsorbed onto the silica NP-coating constitute the main contribution to the recorded adhesion strength while fragile cellular tissues remain adsorbed on the silica NP-coating and break cohesively upon detachment.
2. Experimental section
2.1. Materials
Sodium chloride (≥99%), ethanol (≥99.8%), pentaerythritol tetrakis (3-mercaptopropionate) (QT, ≥95%), poly(ethylene glycol) diacrylate (PEGDA, Mn = 700 kg mol−1) and a colloidal silica suspension (Ludox® TM-50) were purchased from Sigma-Aldrich. Triethylamine (TEA, ≥99%), 1,6-hexanedithiol (HT, 97%), ammonia solution (NH3·H2O, 28%) and tetraethyl orthosilicate (TEOS) were purchased from Alfa Aesar. A surgical cyanoacrylate glue (GLUture®) containing 60% 2-octyl cyanoacrylate and 40% N-butyl cyanoacrylate, was purchased from Zoetis. Unless otherwise specified, all these chemicals were used as purchased without further purification.2.2. Porcine liver harvesting and storage
Porcine liver tissues were obtained from two different sources. (i) Freshly dissected livers were harvested from freshly killed 3-month-old pigs (Sus scrofa domesticus, approx. 25 kg) at the Ecole de Chirurgie du Fer-à-Moulin (AP-HP) (7 Rue du Fer À Moulin, 75005, Paris, France) in accordance with the principles of animal care. Whole livers were transported in a cooler and were stored at 4 °C in physiological serum. They were used between 2 and 30 hours following their harvesting. (ii) Drained pig livers were purchased from a local butcher shop (59 rue Monge, 75005 Paris, France). Drained livers were transported in a cooler and stored at 4 °C. They were used during the 3 days following their purchase (18–76 hours after harvesting). These livers were not stored in the freezer as this is known to alter their integrity.262.3. Fabrication and characterization of PEG films
Cross-linked PEG films were prepared as previously reported.17 Poly(ethylene glycol)diacrylate (PEGDA) was cross-linked with a mixture of hexanedithiol (HT) and pentaerythritol tetrakis(3-mercaptopropionate) (QT) in 15 wt% ethanol and triethylamine (TEA) was used as a catalyst (molar ratio PEGDA/HT/QT: 24/22/1). The concentration of TEA was adjusted to account for 1 mol% of thiol groups. PEGDA, HT and the corresponding fraction of TEA were first mixed at 21 °C and left to react under stirring (150 rpm) until conversion of 90% of the acrylate groups was achieved, as confirmed by infrared spectroscopy. QT, ethanol, and the remaining TEA were then added to the mixture and further stirred for 10 minutes. The mixture was injected in rectangular glass molds of 100 mm × 80 mm × 1.1 mm. The molds were sealed with silicone and stored for 5 days at room temperature (20 ± 2 °C). After removal from the molds, the hydrogel films were vacuum-dried until complete evaporation of the ethanol and triethylamine. They were then thoroughly washed by immersion (>3 h) in ultrapure water to eliminate the extractible soluble fraction (<0.1 wt%). The washed hydrogel membranes were subsequently dried in an oven at 60 °C until complete water evaporation. The resulting dry PEG films had a thickness of 1 ± 0.03 mm. The swelling ratio defined as the ratio of the swollen mass over the dry mass at equilibrium in water at room temperature was measured to be Qeq = 2 and was reached after 3 hours of immersion (see Fig. S1, ESI†).2.4. Preparation and characterization of silica nanoparticle coatings
2.5. Ex vivo adhesion measurements
Peeling experiments were also performed on the liver capsule (the liver external collagenous membrane). For that, rectangular samples were cut from superficial liver tissues and immersed twice for 30 s in physiological serum. This gentle washing not only removed traces of coagulated blood that may affect adhesive properties but also ensured reproducible wetting of the tissue surface. Then, 1 min after the second tissue immersion in physiological serum, the bottom face of the liver sample was glued onto a flat holder with the capsule surface exposed to air on the top face. Uncoated or coated dry PEG films were deposited on the surface of the capsule in the same way as for parenchyma samples.
2.6. Characterization of liver hydration
 | (1) |
2.7. Assessment of the wetting of the PEG–tissue interface
Following a previously developed model,17 the wetting state of the interface between the liver surface and the PEG film surface at the moment of peeling was characterized by the ratio vabs/vfree where vabs is the volume per unit surface of water absorbed by the PEG film at the time of peeling and vfree is the volume per unit surface of free water available in the superficial tissues before peeling. For each peeling experiment, vabs was measured by weighing the mass of the PEG ribbon before and after peeling. It is then simply given by vabs = ΔM/ρA where ΔM is the mass uptake of the ribbon, ρ is the water density and A is the contact area. The value of vfree was calculated from the measured water weight fraction of the liver sample H as follows: | (2) |
2.8. Optical microscopy for post-peeling observations
Bright field micrographs of the ribbons after the peeling experiments were performed on a Leica DMRXE microscope in transmission mode. Fluorescent micrographs of the PEG film and liver surfaces after peeling were carried out on a DMi8 Video microscope (Leica Microsystems) in reflection mode using a GFB filter (excitation wavelength: 470/40 nm, dichroic mirror: 495 nm, emission wavelength: 525/50 nm).2.9. Statistical analysis
Statistical analysis was carried out on adhesion energies obtained using peeling experiments in the presence and absence of NP-coating. A Shapiro Wilk test was first performed on each population of data to determine if it follows a normal distribution. As normality was verified for all studied populations, an unpaired t-test was used to establish statistical significance. Statistical significance was accepted at the level of p < 0.05.3. Results and discussion
3.1. Effect of tissue hydration
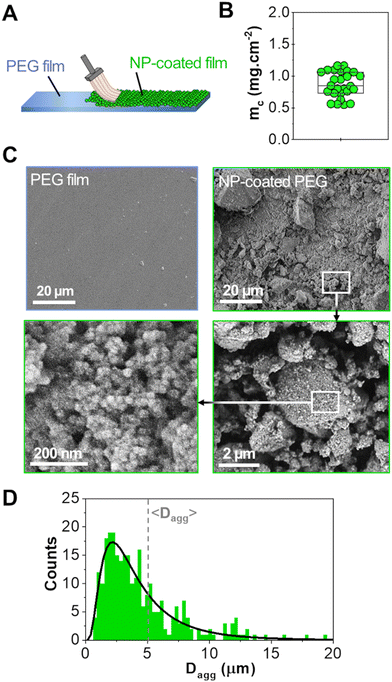
A powder consisting of microscopic aggregates of silica NPs was obtained from a solution of spherical silica nanoparticles with a diameter of 30 nm. Coated PEG films were obtained by brush spreading a given amount of this powder (4 mg cm−2) as illustrated in Fig. 1(A). In this process, the PEG surface was saturated with aggregates and the excess powder was removed with a brush until a reproducible area density of 0.8 ± 0.2 mg cm−2 was achieved (Fig. 1(B)). SEM observations showed that the coatings were composed of a layer of microscopic polygonal aggregates as shown in Fig. 1(C). Image analysis indicated that the distribution in aggregate size followed a log-normal law with an average size 〈Dagg〉 of 5.0 μm and a standard deviation of 2.9 μm (Fig. 1(D)). The majority of those aggregates (∼80%) were sufficiently adsorbed to the PEG film to resist washing in water for several hours, as shown in a previous study.19For adhesion experiments, sections of porcine liver were cut to expose a flat surface of parenchyma, as represented in Fig. 2(A). The water weight fraction, H, of the liver tissue was varied by using two types of liver samples as shown in Fig. 2(B): (i) freshly dissected liver samples (n = 9), referred to as “fresh liver”, for which H ranges from 76 to 80 wt% depending on the blood loss experienced by the tissues during dissection; (ii) butcher liver samples (n = 7), referred to as “drained livers”, which contain less fluid (H = 72 ± 1 wt%). For some drained liver samples, the surface of the parenchyma was rehydrated just before adhesion measurement by immersion in physiological serum (NaCl 9 g L−1) for various durations. This rehydration process was shown to be confined in the first layer of lobules exposed at the liver surface.17 The local values of H near the surface of the rehydrated tissue were assessed to vary from 73 to 81 wt%, as shown in Fig. 2(C).
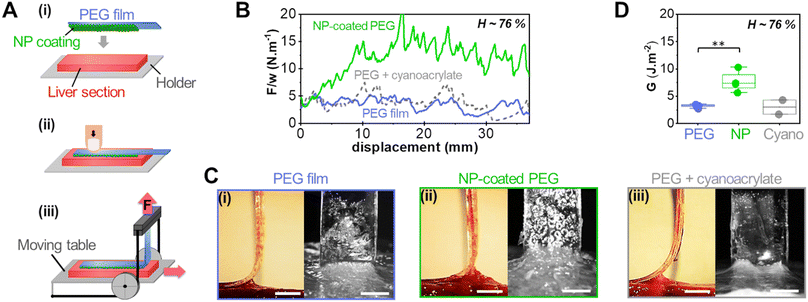
Adhesion was measured by 90° peeling of PEG ribbons deposited on those liver sections, as depicted in Fig. 3(A). Typical force displacement curves obtained for the peeling after 5 min of contact are shown in Fig. 3(B) in the case of fresh liver parenchyma with a moderate water content (H = 76 ± 0.5 wt%) for bare and NP-coated PEG films. These results are compared to those obtained with PEG films glued with a comparatively much larger quantity of medical grade cyanoacrylate glue, GLUture® (4.3 ± 1.1 mg cm−2). For the bare PEG film, a normalised peeling force of 3.3 ± 1.1 N m−1 was reached in the steady state. During peeling, liver tissues were slightly lifted by the gel as illustrated in Fig. 3(C)-(i) and detachment was located at a height of 1.7 ± 0.3 mm above the plane of the hydrogel–tissue interface (Fig. S2, ESI†). For the NP-coated PEG film, the normalized peeling force was three times higher with an average value of 10.3 ± 4.8 N m−1. This came along with a larger tissue deformation at the detachment front, lifting the liver 3 ± 1 mm above the hydrogel–tissue interface, as seen in Fig. 3(C)-(ii) and Fig. S2 (ESI†). By comparison, the PEG ribbon glued with cyanoacrylate glue led to an average peeling force of 4.3 ± 2.4 J m−2 and a detachment height of 1.0 ± 0.7 mm (Fig. 3(C)-(iii) and Fig. S2, ESI†). This low adhesion value is consistent with the poor adhesive performance generally reported for surgical cyanoacrylate glues under hydrated conditions due to the rapid formation of a hard and brittle interfacial film.21,32
The adhesion energy, G, was estimated from the averaged normalised peeling force using Kendall's model for elastic peeling (see the materials and methods section). Fig. 3(D) shows the values of G obtained on several sections of a moderately hydrated parenchyma (H = 76 ± 0.5 wt%) for bare PEG films, NP-coated PEG films and PEG films with cyanoacrylate glue. The adhesion of NP-coated films was systematically and significantly stronger than that of bare PEG films (p = 0.0013). The average adhesion energy obtained with the NP coating was 7.7 ± 1.9 J m−2 which represents a 2- to 3-fold increase as compared to the bare PEG films (3.2 ± 0.3 J m−2) and the cyanoacrylate glue (2.9 ± 1.9 J m−2).
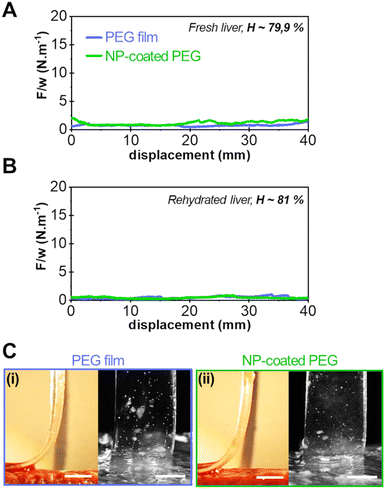
Typical results of peeling experiments on highly hydrated liver tissues are shown in Fig. 4. For the most hydrated fresh liver samples (H = 79.9 ± 0.9 wt%), the peeling force and adhesion energy after 5 min of contact were greatly reduced as shown in Fig. 4(A) for the bare PEG (0.8 ± 0.2 J m−2) and NP-coated PEG (1.3 ± 0.3 J m−2). This loss of adhesion was amplified when peeling on even more hydrated tissues (H = 81 ± 1 wt%) obtained by rehydration of drained liver samples (Fig. 4(B)). On these tissues, the average peeling force for both the bare and NP-coated PEG films was of the order of capillary forces (<0.5 N m−1). Accordingly, the side and front views of the detachment zone indicate the presence of a lubricated interface with a meniscus moving as the peeling proceeds (Fig. 4(C)). Hence, on these very hydrated substrates, the NP coating did not produce any adhesive effect.
The sensitivity of adhesion to liver hydration can be rationalized by considering the competition between the wetting of the interface due to the capillary rise of the free liquid contained in the tissue and the draining of the interfacial liquid by the swelling hydrogel film. As reported in a previous study on bare PEG films,17 this competition is well described by the ratio vabs/vfree between the volume of liquid absorbed by the PEG film at the moment of peeling (vabs) and the volume of free liquid contained in the superficial tissue before contact (vfree). At the moment of peeling, two situations can arise: (vabs/vfree < 1) some liquid remains at the interface and the contact is lubricated, therefore preventing adhesion; (vabs/vfree > 1) all the interfacial liquid has been drained and adhesive contact has been achieved.
In the present work, vabs was measured by weighing the film mass uptake immediately after peeling and vfree was calculated from histological data and from the measured tissue water weight fraction H (see the materials and methods section). The values of vabs and vfree were varied by adjusting experimental conditions such as the initial swelling ratio of the PEG film (Q), the initial water weight fraction of the liver substrate (H) and the duration of contact between the film and the tissue (Δt). The resulting values of adhesion energy G are plotted as a function of vabs/vfree in Fig. 5(A) and (B) for the bare PEG and the NP-coated PEG films, respectively. For both systems, the transition from a lubricated contact (open symbols) to an adhesive contact (full symbols) occurs for vabs/vfree ≈ 1, suggesting that adhesive binding is only established once all the interfacial fluid has been drained. In the adhesive regime (vabs/vfree > 1), NP-coated PEG films produced higher adhesion energies than bare PEG films. In particular, the maximum energy recorded for NP-coated films was 13 J m−2 for vabs/vfree = 1.5, corresponding to a 2.2-fold increase when compared to uncoated films under the same conditions. More generally, the presence of the NP-coating resulted in a statistically significant increase in adhesion energy (p < 0.001) when examining all the data obtained under conditions for which vabs/vfree > 1 (Fig. 5(C)).
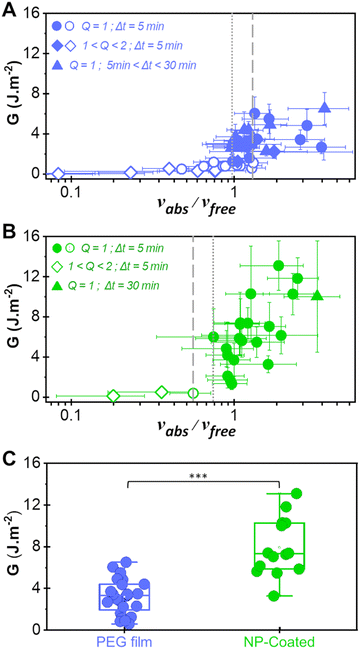 | ||
| Fig. 5 Adhesion as a function of interfacial wetting. (A) and (B) Adhesion energy as a function of the ratio vabs/vfree describing the competition between interfacial wetting and draining for bare PEG films (A) and NP-coated PEG films (B). Circles correspond to peelings performed with dry PEG ribbons after 5 min of contact, diamonds to peelings performed with partially swollen PEG ribbons after 5 min of contact and triangles to peeling performed with dry PEG ribbons after various contact times. Open symbols correspond to lubricated peeling and full symbols to adhesive peeling. The data in (A) were reproduced and modified with permission from ref. 17, copyright 2019 National Academy of Sciences. (C) Adhesion energy obtained with bare PEG and NP-coated PEG films under conditions for which vabs/vfree > 1 (***p < 0.001). | ||
A closer comparison between the data for the bare and the NP-coated films reveals that the transition from the lubricated to the adhesive regime is shifted to more hydrated conditions in the presence of the NP coating. For the bare films, the adhesive regime starts at vabs/vfree = 1.0 ± 0.3 and there is an overlap of lubricated and adhesive data between 1.0 and 1.3 (the space between the dotted and dashed lines in Fig. 5(A)). For the NP-coated films, the first adhesive peeling was obtained for vabs/vfree = 0.8 ± 0.4 (dotted line in Fig. 5(B)) and no lubricated peeling was observed above vabs/vfree = 0.6 ± 0.2 (dashed line in Fig. 5(B)).
This improved adhesive performance of NP-coated PEG films under moderately hydrated conditions can be attributed to the ability of the porous NP aggregates to rapidly drain the interfacial liquid by capillarity. In the case of a bare PEG film, the draining of interfacial liquid occurs due to the swelling of the PEG network.17 This process is limited by the diffusive dynamics of the PEG chains and is much slower than the capillary rise of free fluid coming from the microscopic interstices of the parenchyma. To quantify this difference, let us consider the characteristic time t* that is necessary for fluids to rise through the tissue microporosities and wet the tissue surface with a layer of thickness h*. From the Lucas and Washburn law, t* is expressed as follows (see the ESI† for details):33,34
 | (3) |
In the presence of a NP coating, the draining of the interfacial liquid may occur in two stages. In the first stage, immediately after contact with wet tissues, a certain amount of liquid may be quickly absorbed by capillary rise inside the inter- and intra-aggregate porosities of the coating. In the second stage, once the pores of the coating are filled, the draining of the interfacial liquid is governed by the slow swelling kinetics of the PEG network, like in the case of the bare film. Eqn (3) can be employed to calculate the characteristic time necessary for a 10-μm-thick fluid layer to be absorbed through the nanoparticle coating porosities. In this case, the medium porosity Φ was evaluated from the structural parameters of the coating with the following equation (see the ESI† for details):
 | (4) |
Increasing the contact time up to 30 min produced the highest adhesion energies for both the bare and NP-coated films, as shown by triangle symbols in Fig. 5(A) and (B), respectively. For those longer contact times, higher values of vabs were measured suggesting a stronger local dehydration of the tissue, which is more favourable to macromolecular adsorption and viscous dissipation during peeling. In such ex vivo experiments, much longer contact times may be needed to achieve equilibration and rehydration of the interface that could lead to a decrease in adhesion. For in vivo adhesion, rehydration is expected to occur much faster due to the continuous vascularization of tissues, therefore favouring the lubrication of the contact. This is consistent with the very low pull-out strength measured during in vivo experiments on the liver capsule with the same NP-coated films for 10 min and 40 min contact times.19
3.2. Effect of local tissue composition
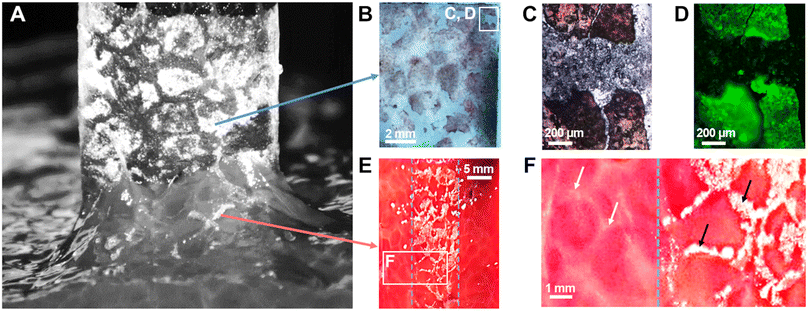
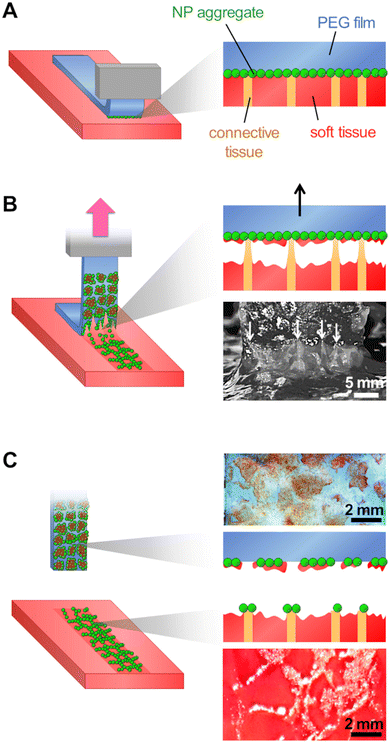
When NP-coated films were peeled from the surface of liver parenchyma in the adhesive regime (vabs/vfree > 0.75), transfer of matter was observed as shown in Fig. 3(B)-(ii) and Fig. 6(A). On the one hand, some NP-aggregates transferred from the PEG film to the liver surface and on the other hand, some liver fragments transferred to the PEG film surface. These transfers displayed a patterned structure resembling the lobular architecture of the liver parenchyma, as presented in Fig. 2(A)-(iii). In a series of experiments, a small amount of fluorescent silica particles (1 wt%) was included in the NP aggregates composing the coating to better characterize these transfers by means of bright field and fluorescent microscopy. The adhesive properties of these fluorescent coatings were tested and found to be very similar to those presented above with non-fluorescent coatings (Fig. S4, ESI†).After peeling of PEG films covered with this fluorescent coating, observations of the film surface show the deposition of reddish tissue patches, as seen on macroscopic images and bright field micrographs in Fig. 6(B) and (C). In the areas where liver tissue was transferred, fluorescence microscopy revealed that the NP coating was still present on the PEG surface as shown in Fig. 6(D) (see Fig. S5, ESI† for larger scale mapping). The intensity of fluorescence recorded in these areas was comparable to the one observed on the NP-coated film before peeling (Fig. S6B, ESI†). In contrast, the areas between the transferred tissue fragments exhibited a negligible fluorescence, similar to that of the bare PEG membrane (Fig. S6A, ESI†). In these areas, the NP aggregates were removed from the PEG surface during peeling.
Observations of the liver surface after peeling showed a patterned deposition of NP aggregates (Fig. 6(E)) forming a negative footprint of the pattern observed on the corresponding coated PEG film. This transfer seemed to occur almost exclusively on the connective tissues constituting the collagen-rich walls of the liver lobules (Fig. 6(F)). The deposition of NP-aggregates on the liver tissues was further confirmed by fluorescent microscopy, as NP-aggregates are visible on fluorescent micrographs and emit light in an intensity range for which the liver auto-fluorescence is almost entirely suppressed (Fig. S7, ESI†).
These results show a strong correlation between the local detachment mechanisms and the local composition of the tissue. We propose a microscopic picture for the detachment process that accounts for the histology of the liver parenchyma, as depicted in Fig. 7. The surface of the porcine liver parenchyma displays a cellular structure consisting of hepatic lobules separated by walls composed of collagen-rich connective tissues. We assume here that peeling was performed in the adhesive regime for which the interstitial liquid was drained and macromolecules composing the tissue could adsorb on the NP coating (Fig. 7(A)). During peeling, the tissues are pulled upwards by the PEG film which first causes a cohesive rupture of the more fragile lobule internal tissues (Fig. 7(B)). As peeling proceeds, the collagen-rich lobular walls can resist higher tensile stresses and experience a larger deformation as evidenced by the appearance of elongated strands at the peeling front (white arrows in Fig. 7(B)). Eventually, the NP aggregates adsorbed to the lobular walls detach from the PEG surface and get transferred to the tissue surface (Fig. 7(C)). After detachment, the PEG film displays patches of coating covered with fragments of the soft tissues originating from the interior of the liver lobules while the tissue surface presents a patterned deposition of NP aggregates located on top of the lobular walls.
From this microscopic picture, it appears that the main contribution to the measured peeling force arises from the adhesion of the NP-coating to the collagen-rich lobular walls of the liver parenchyma. The cohesive strength of the soft cellular tissues of the lobule interior is clearly lower than the strength of the adhesion with the NP-coating. During peeling, the cohesive rupture inside the lobule occurs early while binding is maintained in the areas in contact with the lobular walls which stretch until NP aggregates detach from the PEG surface. As compared to the soft lobule interior, the collagen-rich lobular walls are much tougher materials due to the ability of collagen fibrils to withstand large tensile stresses, up to 0.6 GPa according to Shen et al.35 Our microscopic observations did not allow us to determine whether the NP aggregates desorbed from the gel or whether there was a cohesive rupture in the PEG gel underneath the particles. Nevertheless, these experiments indicate that a strong binding was established between collagen-rich tissues and NP aggregates. This is in line with previous reports highlighting the affinity between collagen and silica resulting from a combination of attractive electrostatic interactions and hydrogen bonds.36,37 More generally, these results suggest that such silica-coated films may adhere rather strongly to other tissue types displaying a collagenous lining.
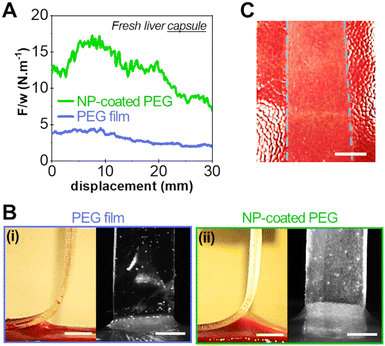
To support this hypothesis, peeling experiments were performed on the liver capsule (the liver external membrane) that is composed of a collagenous basal membrane. Liver capsules were soaked in saline water in a controlled way to mimic the physiological wetting of the liver. After 5 min of contact on the so-prepared liver capsule, we showed in a previous study that the interface is in the adhesive regime (vabs/vfree > 1).17Fig. 8 shows typical peeling experiments conducted with a bare PEG film and a NP-coated PEG film on the capsule of fresh liver samples. The presence of the silica NP-coating produces a very significant increase in adhesion energy as compared to the bare PEG film, as shown in Fig. 8(A). The adhesion energy (∼12 J m−2) is similar to what was obtained on the parenchyma. However, unlike adhesion onto the parenchyma, the peeling front of the NP-coated PEG on the liver capsule displays a homogeneous profile: the detachment height is constant across the width of the film (Fig. 8(B)). A transfer of silica particles is observed on the liver capsule covering homogeneously the contact area (Fig. 8(C)), like the transfer observed on the collagen-rich lobular walls of the parenchyma.
Conclusions
Model adhesion experiments using peeling on ex vivo liver parenchyma shed light on the interfacial phenomena governing the adhesion by particle bridging onto biological tissues. Firstly, the transport of fluid at the interface was found to be determinant for the establishment of an adhesive behaviour. Under highly hydrated conditions, for which interstitial fluids wet the interface and prevent molecular contact, no enhancement of adhesion by particle bridging was obtained. In contrast, under moderately humid conditions, the use of NP-coating yielded a statistically significant increase in adhesion and led to adhesive performances superior to that of cyanoacrylate glues. In addition, adhesion measurements with various tissue hydration levels showed that the capillary transport inside the porous coating might accelerate the draining of the interface at short times and facilitate the creation of an adhesive contact. This beneficial effect of the coating might be combined with other draining strategies including the patterning of surfaces38,39 or the use of superabsorbent gels17,18 to enhance tissue adhesion. Moreover, the use of highly dissipative films21,40 could provide a way to increase the adhesion energy when an adhesive contact is produced. Secondly, these experiments showed that the detachment process depends on the local tissue composition, which determines the local adhesion strength. For a tissue surface as heterogeneous as the porcine liver parenchyma, the adsorption of the silica NP coating onto the tissue was strong enough to either lead to cohesive tissue rupture when in contact with soft cellular tissues or to a detachment of the NP particles from the PEG film when in contact with collagen-rich connective tissues. This understanding of microscopic interfacial processes, involving fluid transport and tissue-specific interactions, delivers new insights into the design of particle-bridging approaches as adhesives to biological tissues.Conflicts of interest
There are no conflicts to declare.Acknowledgements
We thank J. Legagneux (AP-HP) for the liver harvesting. Technological support from the Institut P-G de Gennes Program ANR-10-EQPX-34 as well as financial support from the Agence Nationale de la Recherche (ANR-18-CE19-0022-04 NanoBioTape), PSL University (PSL-Chimie-2014 HemoSoftChem), MINES Paris and ESPCI Paris are acknowledged. For the purpose of open access, the authors have applied a CC-BY public copyright licence to any Author Accepted Manuscript (AAM) version arising from this submission.Notes and references
- S. Rose, A. Prevoteau, P. Elziere, D. Hourdet, A. Marcellan and L. Leibler, Nature, 2014, 505, 382–385 CrossRef CAS.
- M. C. Arno, M. Inam, A. C. Weems, Z. Li, A. L. A. Binch, C. I. Platt, S. M. Richardson, J. A. Hoyland, A. P. Dove and R. K. O’Reilly, Nat. Commun., 2020, 11, 1420 CrossRef CAS.
- J. S. Baik, S. A. Kim, D.-W. Jung, W.-S. Chae, C. Pang, S. H. Bhang, L. Corté and G.-R. Yi, Chem. Mater., 2022, 34, 584–593 CrossRef CAS.
- J.-H. Kim, H. Kim, Y. Choi, D. S. Lee, J. Kim and G.-R. Yi, ACS Appl. Mater. Interfaces, 2017, 9, 31469–31477 CrossRef CAS.
- A. Meddahi-Pelle, A. Legrand, A. Marcellan, L. Louedec, D. Letourneur and L. Leibler, Angew. Chem., Int. Ed., 2014, 53, 6369–6373 CrossRef CAS.
- M.-M. Lu, J. Bai, D. Shao, J. Qiu, M. Li, X. Zheng, Y. Xiao, Z. Wang, Z.-M. Chang, L. Chen, W.-F. Dong and C.-B. Tang, Int. J. Nanomed., 2018, 13, 5849–5863 CrossRef CAS.
- K. Shin, J. W. Choi, G. Ko, S. Baik, D. Kim, O. K. Park, K. Lee, H. R. Cho, S. I. Han, S. H. Lee, D. J. Lee, N. Lee, H.-C. Kim and T. Hyeon, Nat. Commun., 2017, 8, 15807 CrossRef CAS.
- H. Wu, F. Li, S. Wang, J. Lu, J. Li, Y. Du, X. Sun, X. Chen, J. Gao and D. Ling, Biomaterials, 2018, 151, 66–77 CrossRef CAS.
- M. T. Matter, F. Starsich, M. Galli, M. Hilber, A. A. Schlegel, S. Bertazzo, S. E. Pratsinis and I. K. Herrmann, Nanoscale, 2017, 9, 8418–8426 RSC.
- E. Palierse, M. Roquart, S. Norvez and L. Corté, RSC Adv., 2022, 12, 21079–21091 RSC.
- Q. Zeng, K. Han, C. Zheng, Q. Bai, W. Wu, C. Zhu, Y. Zhang, N. Cui and T. Lu, J. Colloid Interface Sci., 2022, 607, 1239–1252 CrossRef CAS.
- S. Pourshahrestani, E. Zeimaran, N. A. Kadri, N. Mutlu and A. R. Boccaccini, Adv. Healthcare Mater., 2020, 9, 2000905 CrossRef CAS.
- Y. Liang, J. He and B. Guo, ACS Nano, 2021, 15, 12687–12722 CrossRef CAS.
- J. Chen, D. Wang, L.-H. Wang, W. Liu, A. Chiu, K. Shariati, Q. Liu, X. Wang, Z. Zhong, J. Webb, R. E. Schwartz, N. Bouklas and M. Ma, Adv. Mater., 2020, 32, 2001628 CrossRef CAS.
- S. A. Mortazavi and J. D. Smart, J. Controlled Release, 1993, 25, 197–203 CrossRef CAS.
- J. D. Smart, Adv. Drug Delivery Rev., 2005, 57, 1556–1568 CrossRef CAS.
- R. Michel, L. Poirier, Q. van Poelvoorde, J. Legagneux, M. Manassero and L. Corté, Proc. Natl. Acad. Sci. U. S. A., 2019, 116, 738 CrossRef CAS.
- H. Yuk, C. E. Varela, C. S. Nabzdyk, X. Mao, R. F. Padera, E. T. Roche and X. Zhao, Nature, 2019, 575, 169–174 CrossRef CAS.
- R. Michel, M. Roquart, E. Llusar, F. Gaslain, S. Norvez, J. S. Baik, G.-R. Yi, M. Manassero and L. Corté, ACS Appl. Bio Mater., 2020, 3, 8808–8819 CrossRef CAS.
- N. Artzi, T. Shazly, A. B. Baker, A. Bon and E. R. Edelman, Adv. Mater., 2009, 21, 3399–3403 CrossRef CAS.
- J. Li, A. D. Celiz, J. Yang, Q. Yang, I. Wamala, W. Whyte, B. R. Seo, N. V. Vasilyev, J. J. Vlassak, Z. Suo and D. J. Mooney, Science, 2017, 357, 378 CrossRef CAS.
- N. Artzi, A. Zeiger, F. Boehning, A. Bon Ramos, K. Van Vliet and E. R. Edelman, Acta Biomater., 2011, 7, 67–74 CrossRef CAS.
- L. Eberlova, A. Maleckova, P. Mik, Z. Tonar, M. Jirik, H. Mirka, R. Palek, S. Leupen and V. Liska, J. Surg. Res., 2020, 250, 70–79 CrossRef.
- E. G. White, J. Anat., 1939, 73, 365–386 CAS.
- P. M. Baptista, M. M. Siddiqui, G. Lozier, S. R. Rodriguez, A. Atala and S. Soker, Hepatology, 2011, 53, 604–617 CrossRef CAS.
- E. D. Strange, M. P. Dahms, R. C. Benedict and J. H. Woychik, J. Food Sci., 1985, 50, 1484–1485 CrossRef.
- B. J. Frisken, Appl. Opt., 2001, 40, 4087–4091 CrossRef CAS.
- D. Zhang, Z. Wu, J. Xu, J. Liang, J. Li and W. Yang, Langmuir, 2010, 26, 6657–6662 CrossRef CAS.
- K. Kendall, J. Phys. D: Appl. Phys., 1975, 8, 1449–1452 CrossRef.
- C. F. Rothe, in Veins: Their Functional Role in the Circulation, ed. S. Hirakawa, C. F. Rothe, A. A. Shoukas and J. V. Tyberg, Springer, Japan, Tokyo, 1993, pp. 90–97 Search PubMed.
- J. Schafer, M. S. D’Almeida, H. Weisman and W. W. Lautt, Hepatology, 1993, 18, 969–977 CrossRef CAS.
- V. Bhagat and M. L. Becker, Biomacromolecules, 2017, 18, 3009–3039 CrossRef CAS.
- R. Lucas, Kolloid-Z., 1918, 23, 15–22 CrossRef CAS.
- E. W. Washburn, Phys. Rev., 1921, 17, 273–283 CrossRef.
- Z. L. Shen, M. R. Dodge, H. Kahn, R. Ballarini and S. J. Eppell, Biophys. J., 2008, 95, 3956–3963 CrossRef CAS.
- D. Eglin, T. Coradin, M. M. Giraud Guille, C. Helary and J. Livage, Bio-Med. Mater. Eng., 2005, 15, 43–50 CAS.
- D. Eglin, G. Mosser, M.-M. Giraud-Guille, J. Livage and T. Coradin, Soft Matter, 2005, 1, 129–131 RSC.
- F. Meng, Q. Liu, Z. Shi, D. Tan, B. Yang, X. Wang, K. Shi, M. Kappl, Y. Lei, S. Liu and L. Xue, Adv. Mater. Interfaces, 2021, 8, 2100528 CrossRef.
- M. Li, J. Xie, Q. Dai, W. Huang and X. Wang, J. Mech. Behav. Biomed. Mater., 2018, 78, 266–272 CrossRef CAS.
- P. Karami, C. S. Wyss, A. Khoushabi, A. Schmocker, M. Broome, C. Moser, P.-E. Bourban and D. P. Pioletti, ACS Appl. Mater. Interfaces, 2018, 10, 38692–38699 CrossRef CAS.
Footnote |
| † Electronic supplementary information (ESI) available. See DOI: https://doi.org/10.1039/d4sm00287c |
| This journal is © The Royal Society of Chemistry 2024 |

