 Open Access Article
Creative Commons Attribution 3.0 Unported Licence
Energy dissipation of a contact line moving on a nanotopographical defect
Sylvain
Franiatte
a,
Germercy
Paredes
 b,
Thierry
Ondarçuhu
 *a and
Philippe
Tordjeman
 *a
*a
aInstitut de Mécanique des Fluides de Toulouse (IMFT), Université de Toulouse, CNRS, Toulouse, France. E-mail: thierry.ondarcuhu@imft.fr; philippe.tordjeman@imft.fr
bPontificia Universidad Católica Madre y Maestra, Santiago de Los Caballeros, Dominican Republic
First published on 10th April 2024
Abstract
Understanding the origin of the dissipative mechanisms that control the dynamics of a contact line is a real challenge. In order to study the energy dissipation at the contact line when a moving meniscus encounters topographical defects, we developed atomic force microscopy (AFM) experiments using nanofibers with nanometer scale defects. These experiments realized with three liquids are performed in two AFM modes: the contact mode (C-AFM) is used to measure the energy associated with the contact angle hysteresis in the limit of a static situation, deduced from advancing and receding dipping experiments on an isolated defect; the frequency-modulation mode (FM-AFM) is performed at different amplitudes and then velocities to measure the energy dissipated as the contact line moves over the same defect. Strong dissipation peaks appear above a threshold amplitude characteristic of the liquid and the defect, which is determined by the width of the hysteresis measured in statics. Furthermore, the dissipation energy of the moving contact line measured in dynamics is equal to the hysteresis capillary energy whatever the amplitude and is therefore independent of the contact line velocity. These results point out that the defect contribution to dissipation energy of a moving contact line on real surfaces is only governed by the pinning–depinning energy with no contribution of viscous effects.
1 Introduction
The spreading of a liquid on solid surfaces is mainly controlled by the motion of the contact line. It is well known that the dynamics of this line results from the balance between the power of the capillary forces and the total energy dissipation taking place at all scales.1,2 Whereas the capillary driving force is described as the unbalanced Young force, the dissipation of the moving contact line remains only partially understood. Several dissipation models have been proposed leading to different expressions for the dynamic contact angle θ(Ca), where Ca = ηV/γ is the capillary number, V is the contact line velocity and η and γ are the viscosity and the surface tension of the liquid, respectively.Hydrodynamic models such as the Cox–Voinov (CV) model3,4 consider the dissipation due to viscous flow within the moving liquid wedge on a perfectly flat surface. A molecular scale cut-off is introduced to regularize the dissipation which is logarithmically diverging at the contact line.5 In this model, the velocity dependence of the apparent contact angle θ of the triple line follows the relationship θ3 ≈ θ03 + 9Ca![[thin space (1/6-em)]](https://www.rsc.org/images/entities/char_2009.gif) ln(L/l), where θ0 is the equilibrium contact angle assumed to be the microscopic contact angle at the contact line, L is the macroscopic characteristic length and l is a microscopic one, leading to a logarithm term of the order of 10. However, direct comparison with experimental values remains difficult and molecular processes are essentially used as cutoffs to the dissipation.6
ln(L/l), where θ0 is the equilibrium contact angle assumed to be the microscopic contact angle at the contact line, L is the macroscopic characteristic length and l is a microscopic one, leading to a logarithm term of the order of 10. However, direct comparison with experimental values remains difficult and molecular processes are essentially used as cutoffs to the dissipation.6
Another approach is the so-called molecular kinetics theory (MKT)7,8 which considers only thermally activated molecular mechanisms at the contact line. It is equivalent to applying a line friction at the contact line and leads to a different relationship between dynamic contact angle and velocity in the form θ2 ≈ θ02 + αCa where the α coefficient depends on the energy barrier and the molecular jump length used as adjustable parameters.9
Real surfaces always present topographical and/or chemical defects that pin the contact line and lead to contact angle hysteresis.10 Experiments show clearly that nanoscopic defects influence the wetting dynamics at the macroscopic scale.11 Yet, the role of defects in the contact angle dynamics12 is still not understood and one usually applies a CV or a MKT equation using static advancing or receding contact angles. Recently, it was proposed that the thermally activated mechanism on nanometric defects may contribute to contact line friction.13,14 A model considering thermal fluctuations on isolated defects allows relating the asymptotic dynamic contact angle to the defect properties,15 opening the way to a comprehensive description of dynamic wetting on a real surface.
If it is clear that the dissipative mechanisms control the dynamics of the contact line, understanding the origin of these mechanisms is a real challenge. In particular, the energy dissipation associated with an individual defect is the main missing information to assess the effect of surface defects. Macroscopic experiments are generally used to infer information on the pinning at the microscale by comparison with models but a direct measurement of dissipation at the scale of an individual defect has not been reported to our knowledge. Today, the development of wetting experiments at the nanoscale is one way to study the physics of wetting close to the contact line. With this aim, we develop specific experiments of wetting using atomic force microscopy (AFM) in contact mode (C-AFM) and in frequency-modulation mode (FM-AFM). We recently demonstrated that the force measurements in the C-AFM mode allows the study of the pinning of a contact line on a nanometric individual defect16 and identification of their chemical or topographical nature.17 We also pointed out that a contact line in motion is able to induce the desorption of molecules physically adsorbed18 and cleans the surface from airborne contaminants acting as chemical defects. Furthermore, FM-AFM experiments are particularly suited to quantitatively monitor the dissipated energy in an oscillating nanomeniscus19 pinned at the surface. The dissipation in the boundary layer around a nanofiber moving in a viscous fluid can also be measured by FM-AFM experiments.20
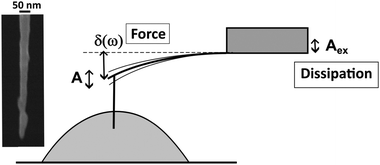
The aim of the paper is to measure the energy dissipation when a moving contact line interacts with a unique topographical defect by experiments at the nanoscale, dipping a nanofiber in model liquids (Fig. 1). We combine both C-AFM and FM-AFM modes to study the statics and dynamics of the contact line. The C-AFM mode is used to measure the energy associated with the contact angle hysteresis in the limit of the static situation, deduced from advancing and receding dipping experiments. The FM-AFM mode is performed to measure the dissipated energy when the contact line moves across an isolated defect, at various velocities. We establish that the corresponding energy dissipation is due to the elastic capillary force during the pinning and depinning process on the defects. Interestingly, in the range of studied velocities, the measurements show that the energy dissipation is independent of the capillary number Ca. The paper is organized as follows: Section 2 describes the experimental procedure and materials used; the results are presented and discussed in Section 3; the main results are finally summarized in the last conclusion section.
2 Experimental section
The experimental configuration consists of a carbon nanocone which is dipped into and withdrawn from the top of a liquid droplet at a constant velocity of 1 μm s−1 (Fig. 1) under ambient conditions (T = 21 °C). Since we aim at studying individual defects, we considered tips with a small enough radius. We used three specific carbon nanocone tips with the cone angle at the apex being close to 0° and the radius in the 10–20 nm range21 (see Fig. 1). The scanning electron microscopy (SEM) image shows individual topographical defects with a 3–8 nm height and 10–20 nm width. The nanocone is attached via micromanipulation techniques to a specially designed cantilever21 with spring constant k ∼ 8 N m−1, resonance pulsation ω0 ∼ 1.13 × 10⁶ rad s−1 and a high quality factor Q ∼ 360. These values are determined by thermal noise measurements using the deflection sensitivity derived from contact mode experiments on a silicon wafer substrate.22 The liquids used are hexadecane (Hx), undecanol (Und) and ethyleneglycol (Gly) which allow varying surface tension γ and viscosity η in ranges suitable for the FM-AFM mode. The corresponding values are reported in Table 1. Millimetric droplets are deposited on a 1′′ silicon wafer. Note that evaporation effects are negligible for these liquids due to their low vapor pressures at room temperature.| Liquid | ρ (kg m−3) | η (mPa s) | γ (mN m−1) |
|---|---|---|---|
| Ethylene glycol (Gly) | 1110 | 30 | 50 |
| Undecanol (Und) | 832 | 14 | 29 |
| Hexadecane (Hx) | 770 | 3 | 27 |
AFM experiments are performed using a JPK Nanowizard 3 instrument. In the C-AFM mode, the capillary force is computed from the deflection δ measurement when a nanoneedle is dipped into and withdrawn from a millimetric drop at constant velocity 1 μm s−1. In this case, Ca  for the three liquids, and the capillary effects dominate. The measured force F = kδ is related to the contact angle θ of the liquid on the tip surface: F = 2πRγ
![[thin space (1/6-em)]](https://www.rsc.org/images/entities/char_2009.gif) cos
cos![[thin space (1/6-em)]](https://www.rsc.org/images/entities/char_2009.gif) θ where R is the radius of the tip. Note that the stiffness of all cantilevers used (k ∼ 8 N m−1) is at least 200 times larger than the effective spring constant of the interface, which is of the order of γ/2.23
θ where R is the radius of the tip. Note that the stiffness of all cantilevers used (k ∼ 8 N m−1) is at least 200 times larger than the effective spring constant of the interface, which is of the order of γ/2.23
In the FM-AFM mode, a phase-lock loop device is used to oscillate the cantilever at its resonance angular frequency ω0. A proportional–integral–derivative controller adjusts the excitation signal Aex in order to maintain the tip oscillation rms amplitude A constant. The excitation signal Aex is therefore a direct indication of the system dissipation. It is linearly related to the friction coefficient of the interaction through β = β0(Aex/A0 − 1), where A0 and β0 = k/(ω0Q) are, respectively, the excitation signal and the friction coefficient of the free system in air, measured far from the liquid interface.24 This method allows the determination of the friction coefficient β when the tip oscillates with a maximum velocity given by V = Aω. The dissipated energy is therefore E = βA2ω.
In a typical experiment for a given tip and a given liquid, we first measure in C-AFM mode, the capillary force curve F(h) where h is the position of the tip extremity with respect to the unperturbed liquid surface. We then switch to the FM-AFM mode and measure β(h) for each amplitude A comprised between 3 and 30 nm, in steps of 0.5 nm. This corresponds to  , velocities comparable with macroscopic natural spreading. In both modes, ten curves with 4000 points (about 1 point per nm) are recorded for each condition to assess the repeatability. The standard deviation is systematically calculated and represented in all figures. The results presented below are based on the analysis of about 6000 curves.
3 Results and discussion
3.1 Force and dissipation curves
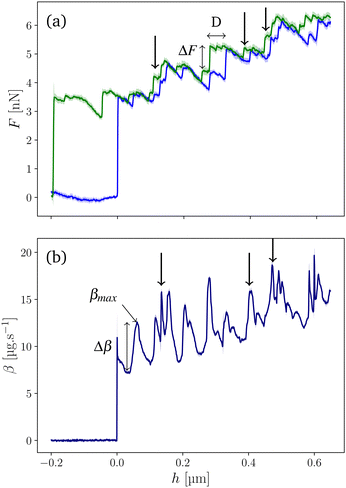
An example of force and dissipation measurements in hexadecane is reported in Fig. 2a and b, respectively. The capillary force is measured in C-AFM mode as a function of h. The meniscus is created at h = 0 nm and the contact line scans the tip surface during the tip dipping and the tip withdrawing. Fig. 2a presents the superposition of the advancing (blue) and receding (green) curves. Due to the conical shape of the tip, the mean capillary force increases with h. In addition, both curves evidence fluctuations which, according to ref. 17, reveal the presence of topographical defects. When the defects are isolated, we clearly observe a hysteresis cycle due to the pinning and depinning of the contact line (examples indicated by arrows in Fig. 2a). This cycle is defined as the difference between advancing and receding curves around one defect.16,17 Each capillary hysteresis cycle is characterized by a width D and a force amplitude ΔF. The corresponding hysteresis energy is calculated from the area of the cycle Es ≃ ΔF·D assumes a rectangular shape of the cycle.For the same tip and the same liquid, β is measured in the FM-AFM mode. The β(h) curve is plotted in Fig. 2b for A = 19 nm. At h = 0 nm, β increases abruptly due to the meniscus formation,19 and then increases slowly due to the dissipation in the viscous layer around the immersed tip.20 This effect leads to the friction coefficient βvis which can be calculated by solving the Navier–Stokes equation.20 In addition, we observe large peaks of dissipation of amplitude Δβ = β − βvis at well defined positions. Interestingly, the comparison between the force and friction curves shows clearly that large dissipation (examples of peaks marked by arrows) corresponds to force hysteresis cycles and therefore to a given isolated defect. The maximum friction value of the peak is called βmax.
In the following, we focus on such events which correspond to the motion of the contact line across a single isolated defect in order to provide a comprehensive description of the dissipation mechanism. For all the systems, we investigate the effect of oscillation amplitude A and, in consequence, the effect of contact line velocity V = Aω, which is around 3 decades larger than the dipping velocity.
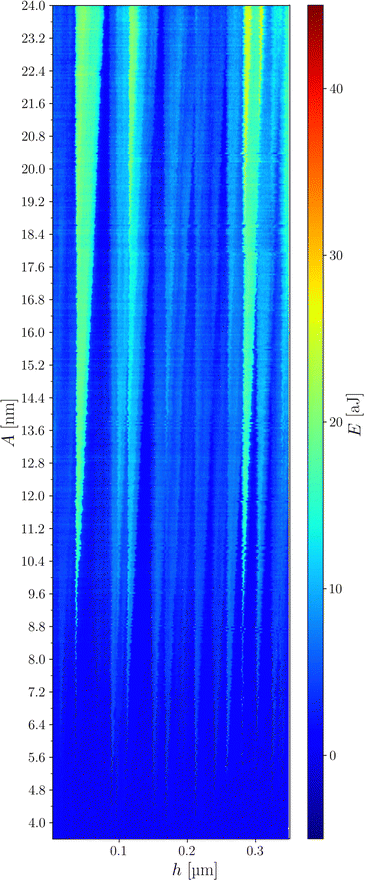
3.2 Dissipation maps
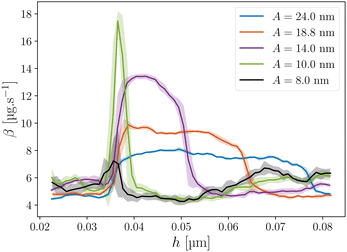
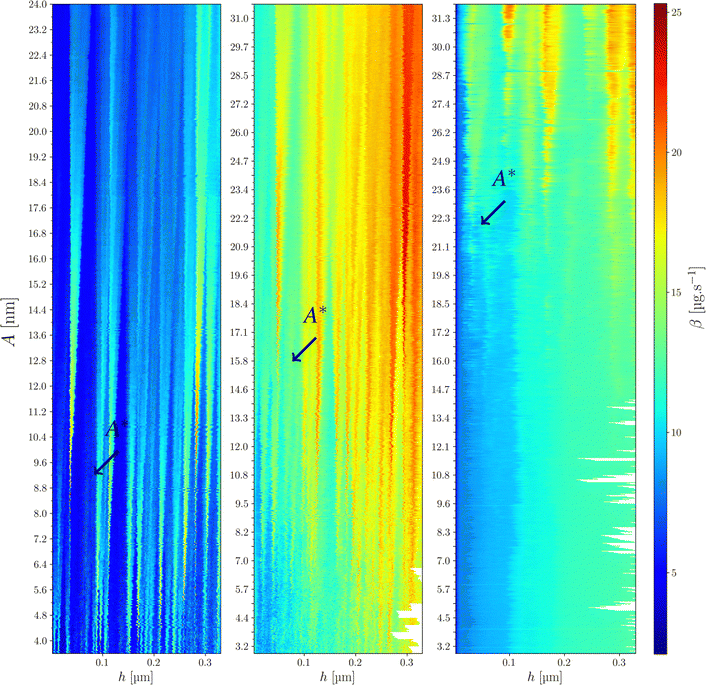
Fig. 3 shows the evolution of the first dissipation peak of Fig. 2b starting at h ≈ 0.035 μm, for different amplitudes. We note that for the smaller A value the dissipation is weak and rather constant. For larger values a dissipation peak appears. For A = 10 nm, this peak is very sharp. Increasing A further, its lateral extension d increases with A while its intensity decreases. This behavior, which is observed for each defect, indicates the appearance of a strong dissipation for amplitudes larger than a threshold value noted A*. In the case of Fig. 3, A* is of the order of 9 nm.The results can be represented in a 2D map where the variation of β is plotted in the A–h plane in color scale. As an example, Fig. 4 compares the 2D maps for the three liquids for a given tip. This representation allows visualizing all the defects swept by the meniscus at different heights h and different amplitudes A. Some of these defects can be considered as isolated meaning that the contact line only encounters a unique defect during the oscillation. Typically, an isolated defect on a given amplitude range presents a well-defined triangular shape in the 2D map. Few defects remains isolated over the whole range of investigated amplitudes: as an example, the first peak of dissipation at h ≈ 0.035 μm for Hx (Fig. 4a) corresponds to the data shown in Fig. 3. In many cases, the defects are close enough from each other and the dissipation peaks observed in the A–h map then overlap when increasing A and lead to an increase of the dissipated energy. In such situation, the contact line moves across several defects during its oscillation. The defects are then considered as “non isolated”. This situation is detailed in Section 3.5. Due to the triangular shape of the dissipation, isolated defects are mostly encountered at small amplitudes.
The interest of this 2D representation is to identify all the defects present at the tip surface and to select the individual defects to investigate the dissipation of the contact line. It also allows determining the threshold amplitude A*. In the case of the isolated defect discussed above, the signature is well identified for the three liquids around h ≈ 0.035 μm. We observe that A* increases when the liquid changes from Hx to Und and Gly and the β values also increase. A slight shift of the peak position in h is also observed as a consequence of different meniscus heights attributed to change in contact angles.
3.3 Energy dissipation at the threshold amplitude
The variation of the maximum magnitude βmax of the dissipation characteristic of one isolated defect as a function of A is plotted in Fig. 5. We observe systematically that βmax increases suddenly at A = A*, reaches a maximum value, then decreases with the amplitude as seen in Fig. 3. The dispersion of friction values is low except around A*. Note that the dissipation is locally three times larger than βvis. The dissipation due to a single surface defect is therefore much larger than the one associated with the oscillation of the tip in the liquid (Δβ > βvis).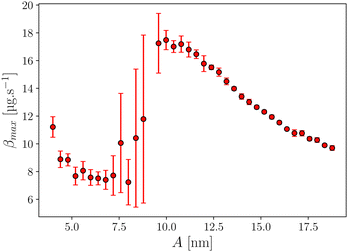 | ||
| Fig. 5 Maximum of the friction coefficient βmax with hexadecane as a function of the oscillation amplitude A for an isolated defect. | ||
In order to understand the origin of the dissipation mechanism for isolated defects, we compare C-AFM and FM-AFM data which provide complementary static and dynamic information. The force curves measured in C-AFM mode display hysteresis cycles described above, which reveal the presence of defects. The hysteresis energy Es is calculated from the area of the cycle which depends on the defect topography, the contact angle and the surface tension of the liquid. The width D of the hysteresis can be also extracted from the experimental force curves (see Fig. 2a). In the FM-AFM mode, the dissipated energy associated with one defect is derived from the variation of the friction coefficient Δβ defined in Fig. 2b, E = ΔβA2ω. The value of the dissipated energy at A* is called E*. Hence, a topographical defect wetted by a given liquid is characterized by both the couple D–Es in the static mode and the couple A*–E* in the dynamic mode. We can show that the two couples of parameters are analogous. Indeed, Fig. 6 displays that E* ≃ Es and  . The latter relationship can be understood by considering that dissipation in FM-AFM mode can occur only if the contact line describes a hysteresis cycle during one oscillation. This is observed when the total fiber oscillation
  . Moreover, for A = A*, we find that the dissipation energy E* measured in the FM-AFM mode is equal to Es. This correspondence between the static and dynamic energies holds over three decades with three liquids and for many isolated defects. In consequence, E* can be calculated from the static equations that express the capillary force F(h) and therefore Es as a function of the defect topography, the contact angle and the surface tension of the liquid. From this model, we observe that the width D of the hysteresis cycle for a given defect, increases with the surface tension and contact angle.17 This result explains the increase of A* when the liquid changes from Hx to Und and Gly. Note that for experiments with glycerol, hysteresis cycles are very large and lead to large A* values which cannot be reached under our experimental conditions and no defect dissipation is observed in the FM-AFM mode (results not shown in this paper).
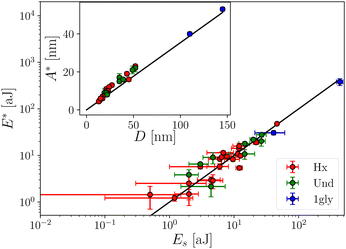 | ||
Fig. 6 Dissipation energy E* at A* in function the hysteresis energy Es. Inset: Threshold amplitude A* function of the width D of the hysteresis cycle. The black lines correspond to E* = Es and  . . | ||
Hence, the combination of static and dynamic AFM experiments on the same tip-liquid system provides consistent results which allow measurement of the threshold amplitude A*. This parameter determines the value of the energy dissipation E* of an individual defect at the threshold.
3.4 Effect of velocity
In FM-AFM mode, the contact line velocity can be varied by changing the oscillation amplitude A. Systematic measurements are realized by varying A between 3 and 30 nm for all the liquids. To investigate the viscous effect due to the pinning and depinning process of the moving contact line on the defect, we plot the normalized dissipated energy E/E* vs. the capillary number Ca (Fig. 7). Note that it is necessary to focus on individual defects that remain isolated over a large amplitude range. The results plotted in Fig. 7 correspond to five such defects with different sizes for Hx and four for Und. The corresponding E* energies vary from 60 to 190 aJ. All curves show that the dissipated energy reaches a plateau beyond the critical capillary number, Ca* = A*ωη/γ. A similar behavior is observed for Hx and Und. Despite the limited range of oscillation amplitudes with our set-up, it is possible to explore a range of Ca about 3 times the value of Ca*. Within this range, these measurements show that the dissipated energy is independent of velocity and then of Ca when Ca ≥ Ca*. Under these conditions, the dissipated energy is equal to E* without any viscous effects associated with pinning and depinning processes.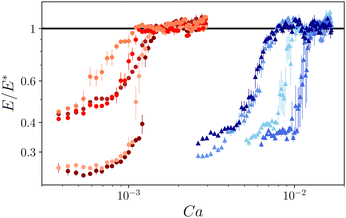 | ||
| Fig. 7 Normalized dissipated energy E/E* for different defects as a function of the capillary number Ca for Hx (red curves) and Und (blue curves). | ||
We can understand this result by considering that the pinning and depinning processes occur in a regime where inertia dominates the viscous effects. Following the approach developed by Quéré et al.25 who studied the formation of a meniscus on a fiber, we estimate the “snapping” velocity when the contact line detaches from a topographical defect using energy conservation. We find  . This expression is close to the characteristic capillary velocity
  . As reported in the literature, this velocity also governs capillary phenomena such as the short time dynamics of liquid spreading,26 the flat fluid sheet retraction27 or the beginning of the coalescence process between two droplets.28 For the studied liquids, Uc ≈ 70 m s−1, value larger than the velocity in our experiments, V = Aω ≈ 10−2 m s−1. In comparison, the velocity linked to the viscous relaxation of a contact line after depinning from a surface defect proposed by ref. 29 is around
  , a value of the order of V.
3.5 Dissipation on neighboring defects
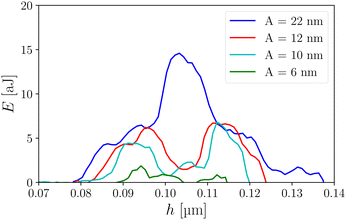
A 2D map of the dissipated energy can be constructed by plotting the dissipated energy in an A–h plane (Fig. 8). It allows a global view of the surface defects, their position on the tip and their properties. Each defect is identified by a triangular shape. The color of this triangle is uniform for a given isolated defect as a consequence of the fact that the dissipated energy does not depend on velocity and therefore on A. We also observe that the angle of the triangle is the same for all defects. This can be understood by considering the range d of h values for which the contact line can jump over the defect. By geometrical arguments, we can show that d varies as which gives a slope
  independent of the defect. Interestingly, when two defects are close enough at the amplitude scale, the dissipation increases significantly. This is evidenced for example in Fig. 8 around h = 0.1 μm where the peaks of several defects overlap leading to higher dissipation values above A = 15 nm. For a more quantitative study, E(h) curves in this region are plotted in Fig. 9 for increasing A values. For A = 9.6 nm, the amplitude is above the individual A* of both defects and 2 dissipation peaks show off. When increasing A both peaks widen with a rather constant dissipated energy of the order of E ≃ 5–7 aJ. At some point, the amplitude is enough for the contact line to pass over both defects during its oscillation. This is the case for A = 22 nm. For a given position range h ∈ [0.10, 0.11] μm the dissipation becomes about twice the dissipation of individual defects and E ≃ 14 aJ. The dissipation then doubles due to the fact that the contact line scans both defects. A simple estimation gives that this is possible if the amplitude oscillation verifies
  , where H is the distance between the tops of two neighboring topographical defects. Using H = 25 nm and
  , we expect that this should occur for A ≥ 15 nm which is consistent with the measurements.
3.6 Determination of defect size
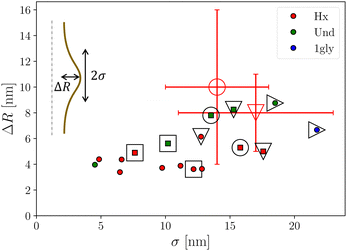
In order to go one step further, we developed a model to deduce the size of each defect. With that aim we first used F(h) force curves where each defect is characterized by a hysteresis cycle of width D, amplitude ΔF (see Fig. 2). In order to relate these quantities to defect size, we consider a fiber with an axisymmetric defects with a Gaussian profile where R is the nominal fiber radius, ΔR and σ the height and width of the defect, respectively. The corresponding capillary force curve F(h) can be computed from analytical equations as described in ref. 17. For more realistic description, we considered the case of punctual defects, with a Gaussian shape in both z and azimuthal directions. Since no analytical calculation of the force F is available in this case, we used the surface evolver (SE) software30 to compute the meniscus shape and the corresponding force using the procedure described in ref. 31. We found that the values of D and ΔF for punctual defects can be deduced within 30% from the ones for axisymmetric defects divided by the ratio α = πR/σ. In other words, for the relevant quantities considered, a punctual defect acts as an axisymmetric defect weighted by the ratio α of its size to the perimeter of the tip. This simple relationship allows determining ΔF and D for punctual defects from their straightforward calculation in axisymmetric geometry, without resorting to time consuming SE simulations. For each isolated hysteresis cycle in the F(h) curves, we therefore optimize the values of ΔR and σ to fit the experimental quantities ΔF and D. The results are reported in Fig. 10 where a large number of defects wetted by the three different liquids are mapped by their height ΔR and width σ. The defects height is comprised between 3 and 8 nm while their width varies from 4 to 22 nm. Among all the plotted points some of them could be unambiguously attributed to the same defect measured in two or three different liquids. We identified 4 of such defects which are surrounded by 4 types of large marks in Fig. 10. It can be seen that, for all these defects, the values of ΔR and σ extracted in different liquids agree reasonably. We can also identify two of these defects on high resolution SEM pictures of the tips. For both defects the values of ΔR and σ measured on the SEM images (see Fig. 1) coincide with the ones deduced from force curves, thus validating the method.
4 Conclusions
Specific C-AFM mode and FM-AFM experiments have been developed to measure the energy dissipation of a contact line moving on an isolated nanoscale defect. Peaks of dissipation are systematically observed when the oscillation amplitude is larger than a threshold value A*, which is linked to the width D of the hysteresis cycle measured in the static mode. Above this amplitude, the dissipation energy is constant, and E* ≃ Es. This work points out the high consistency between the results obtained in static and dynamic AFM measurements. This quantitative agreement holds for nanometric defects leading to dissipated energy down to the aJ scale.A major result is that the contact line dissipation on a nanometric defect is only due to the capillary effect without any viscous contribution ηV. This can be understood by considering that contact line dissipation is controlled by the pinning–depinning process which largely dominates viscous dissipation. This result may lead to a new closing model to describe the wetting dynamics on real surfaces. Here, the characteristic scale is defined by the defect size rather than molecular or Navier slip length generally invoked in the theoretical model.
We also describe the dissipation on neighboring defects and demonstrate that the dimensions (width and height) of the defects can be inferred from the AFM measurements. This provides a cartography of the defects on the tip which will be crucial for developing models of wetting dynamics on real surfaces including collective effects.
Conflicts of interest
There are no conflicts to declare.Acknowledgements
We thank Marc Monthioux for his collaboration on tip fabrication. This research was partially funded by the French national project COCLICO (ANR-23-CE30-0041), the CNRS International Research Project NEWCA and the Fondo Nacional de Innovación y Desarrollo Científico y Tecnológico (FONDOCyT), Dominican Republic, Subvención no. 2022-1A1-096. For the purpose of open access, the authors have applied for a CC-BY public copyright licence for the present document which will be applied to all subsequent versions up to the Author Accepted Manuscript arising from this submission.Notes and references
- J. H. Snoeijer and B. Andreotti, Ann. Rev. Fluid Mech., 2013, 45, 269–292 CrossRef.
- D. Bonn, J. Eggers, J. Indekeu, J. Meunier and E. Rolley, Rev. Mod. Phys., 2009, 81, 739–804 CrossRef CAS.
- O. Voinov, Fluid Dyn., 1976, 11, 714–721 CrossRef.
- R. Cox, J. Fluid Mech., 1986, 168, 169–194 CrossRef CAS.
- C. Huh and L. E. Scriven, J. Colloid Interface Sci., 1971, 35, 85–101 CrossRef CAS.
- X. Li, F. Bodziony, M. Yin, H. Marschall, R. Berger and H.-J. Butt, Nat. Commun., 2023, 14, 4571 CrossRef CAS PubMed.
- T. Blake and J. Haynes, J. Colloid Interface Sci., 1969, 30, 421–423 CrossRef CAS.
- T. Blake and J. De Coninck, Eur. Phys. J.: Spec. Top., 2011, 197, 249–264 CAS.
- W. Zheng, B. Wen, C. Sun and B. Bai, Phys. Fluids, 2021, 33, 082101 CrossRef CAS.
- H.-J. Butt, J. Liu, K. Koynov, B. Straub, C. Hinduja, I. Roismann, R. Berger, X. Li, D. Vollmer and W. Steffen, et al. , Curr. Opin. Colloid Interface Sci., 2022, 59, 101574 CrossRef CAS.
- H. Perrin, R. Lhermerout, K. Davitt, E. Rolley and B. Andreotti, Phys. Rev. Lett., 2016, 116, 184502 CrossRef.
- R. Lhermerout and K. Davitt, Soft Matter, 2018, 14, 8643–8650 RSC.
- A. Prevost, E. Rolley and C. Guthmann, Phys. Rev. Lett., 1999, 83, 348–351 CrossRef CAS.
- D. Guan, Y. J. Wang, E. Charlaix and P. Tong, Phys. Rev. Lett., 2016, 116, 066102 CrossRef PubMed.
- H. Perrin, R. Lhermerout, K. Davitt, E. Rolley and B. Andreotti, Soft Matter, 2018, 14, 1581–1595 RSC.
- M. Delmas, M. Monthioux and T. Ondarçuhu, Phys. Rev. Lett., 2011, 106, 136102 CrossRef.
- S. Franiatte, P. Tordjeman and T. Ondarçuhu, Langmuir, 2022, 38, 2614–2625 CrossRef CAS PubMed.
- S. Franiatte, P. Tordjeman and T. Ondarçuhu, Phys. Rev. Lett., 2021, 127, 065501 CrossRef CAS.
- C. Mortagne, K. Lippera, P. Tordjeman, M. Benzaquen and T. Ondarçuhu, Phys. Rev. Fluid, 2017, 2, 102201 CrossRef.
- J. Dupré de Baubigny, M. Benzaquen, C. Mortagne, C. Devailly, S. K. Acharige, J. Laurent, A. Steinberger, J.-P. Salvetat, J.-P. Aimé and T. Ondarçuhu, Phys. Rev. Fluid, 2016, 1, 044104 CrossRef.
- R. Cours, G. Paredes, A. Masseboeuf, T. Ondarcuhu, G. Seine, P. Puech, R. Arenal, F. Piazza and M. Monthioux, Ultramicroscopy, 2023, 245, 113667 CrossRef CAS.
- N. Burnham, X. Chen, C. Hodges, G. Matei, E. Thoreson, C. Roberts, M. Davies and S. Tendler, Nanotechnology, 2002, 14, 1–6 CrossRef.
- J. Dupré de Baubigny, M. Benzaquen, L. Fabié, M. Delmas, J.-P. Aimé, M. Legros and T. Ondarçuhu, Langmuir, 2015, 31, 9790–9798 CrossRef.
- F. J. Giessibl, Rev. Mod. Phys., 2003, 75, 949–983 CrossRef CAS.
- C. Clanet and D. Quéré, J. Fluid Mech., 2002, 460, 131–149 CrossRef CAS.
- J. C. Bird, S. Mandre and H. A. Stone, Phys. Rev. Lett., 2008, 100, 234501 CrossRef.
- N. Savva and J. W. M. Bush, J. Fluid Mech., 2009, 626, 211–240 CrossRef.
- V. Chireux, P. Tordjeman and F. Risso, Phys. Fluids, 2021, 33, 062112 CrossRef CAS.
- E. Raphael and P.-G. de Gennes, J. Chem. Phys., 1989, 90, 7577–7584 CrossRef CAS.
- K. A. Brakke, Exper. Math., 1992, 1, 141–165 CrossRef.
- L. Fabié, H. Durou and T. Ondarçuhu, Langmuir, 2010, 26, 1870–1878 CrossRef.
| This journal is © The Royal Society of Chemistry 2024 |

