
 Open Access Article
 This Open Access Article is licensed under a
 Creative Commons Attribution 3.0 Unported Licence
Structure formation induced by non-reciprocal cell–cell interactions in a multicellular system†
Biplab
Bhattacherjee
 ,
Masayuki
Hayakawa
and
Tatsuo
Shibata
,
Masayuki
Hayakawa
and
Tatsuo
Shibata
Laboratory for Physical Biology, RIKEN Center for Biosystems Dynamics Research, 2-2-3 Minatojima minamimachi, Chuo-ku, Kobe 650-0047, Japan. E-mail: biplab.bhattacherjee@riken.jp; masayuki.hayakawa@riken.jp; tatsuo.shibata@riken.jp
First published on 4th March 2024
Abstract
Collective cellular behavior plays a crucial role in various biological processes, ranging from developmental morphogenesis to pathological processes such as cancer metastasis. Our previous research has revealed that a mutant cell of Dictyostelium discoideum exhibits collective cell migration, including chain migration and traveling band formation, driven by a unique tail-following behavior at contact sites, which we term “contact following locomotion” (CFL). Here, we uncover an imbalance of forces between the front and rear cells within cell chains, leading to an additional propulsion force in the rear cells. Drawing inspiration from this observation, we introduce a theoretical model that incorporates non-reciprocal cell–cell interactions. Our findings highlight that the non-reciprocal interaction, in conjunction with self-alignment interactions, significantly contributes to the emergence of the observed collective cell migrations. Furthermore, we present a comprehensive phase diagram, showing distinct phases at both low and intermediate cell densities. This phase diagram elucidates a specific regime that corresponds to the experimental system.
1 Introduction
The coordinated movement of biological cells as a group is a fundamental process in several biological phenomena, including morphogenesis,1 wound healing,2 and tumor progression.3 This cooperative migration involves intricate intercellular interactions mediated by secretory chemicals4 and cell–cell contacts. The release of chemical factors can induce chemotactic responses, which promote directional movement of the population.5,6 Moreover, populations of cells that are bound to each other by tight intercellular adhesions, typically found in epithelial cells, achieve coordinated migration by acquiring motility.7–12 Recent studies have shown that transient intercellular contacts, such as contact inhibition of locomotion (CIL)13 and contact following locomotion (CFL)14 or contact following (CF), are also crucial for inducing cooperativity in cell populations.15,16 CIL is a phenomenon where migrating cells avoid moving on top of other cells and migrate away from each other upon contact.17 It has been shown that CIL plays a key role in the formation of supracellular polarity, which determines the orientation of movement as a group.18 On the other hand, CFL is a tail-following behavior observed in pairs of migrating cells, typically found in the slime mold Dictyostelium cells.14,19–21 CFL is responsible for the formation of a stream of cells during its development, and more recently, has been found to be involved in a collective traveling band formation of mutant Dictyostelium cells (KI cells) that lack chemotactic activity.14,22 Various theoretical models have been proposed to understand the role of these transient intercellular contacts in the emergence of collective order of migrating cells.15,16,18,23–26The collective cell migration with various types of intercellular contacts can be modeled by the framework of self-propelled elements. These elements move in the direction of their own polarity by consuming internal energy, and interactions between them induce collective effects. Since these systems are out of equilibrium, the reciprocity between the elements is often broken.27–31 Reciprocity in the context of interacting elements illustrates the property of pair interactions between two elements A and B, where the action on A due to the presence of B accompanies an equal and opposite reaction on B. Non-reciprocal interactions between mesoscopic parts of a system can often arise due to the complex environments surrounding the elements, as well as diffusiophoretic forces between them.32 Furthermore, living cells possess their own internal degrees of freedom, and their states can differ through their interactions with one another. As a result, even a pair of cells can have non-reciprocal effective interaction forces. In a recent study, the front–rear interaction symmetry was found to be broken during the collective migration of three different types of cells: human umbilical vein endothelial cells (HUVECs), kidney epithelial sheets (MDCK cells) and metastatic breast cancer cells.33 Non-reciprocal interactions have also been proposed for the pedestrian dynamics.34 The statistical mechanics of the systems with non-reciprocal interactions has also been discussed.35
A mutant cell of Dictyostelium discoideum that lacks chemotactic activity to cAMP under starvation conditions, called the KI cell, exhibits organized coordinated motions, such as traveling band formation (Fig. 1 (right)) and chain formation (Fig. 1 (left)) at intermediate and low cell densities, respectively.14,22 These collective behaviors are attributable to the contact following locomotion (CFL), without relying on extracellular chemical guidance cues. In fact, a knockout mutant that fails to express the cell–cell adhesion molecule TgrB1 exhibited reduced CFL activity and did not form traveling bands.14 In this study, we develop a theoretical model that captures these collective behaviors and try to understand the mechanisms behind the formation of spatially asymmetric structures and specifically the role of non-reciprocal forces in the formation of chains and bands.
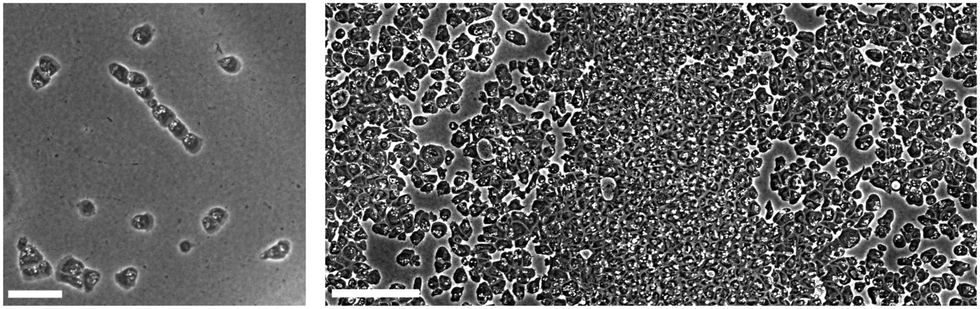 | ||
| Fig. 1 Typical snapshot of chain formation (left) and band formation (right) observed in KI cells.14 The white scale bars in the images mark the length scale of 50 μm (left) and 100 μm (right), respectively. | ||
In this study, we first show an analysis of experimental data, in which we find non-reciprocal interactions for the front and the rear cells moving as a pair. We then introduce a theoretical model that includes the non-reciprocal interaction observed experimentally. We find that the model exhibits a variety of phenomena. At low cell density, transient chain structures with their cell–cell interaction lifetime >300 s are observed. Such an asymmetric structure formation is induced by the non-reciprocal interaction. When the adhesive forces are dominant, the chain structures become stable over time and forms stable elongated clusters. In the intermediate cell density, high density band structures are formed mediated by both the adhesion force of CFL and the self-alignment interactions. Finally, the parameter range corresponding to the experimental system was identified as the range of adhesion and alignment strength in which both chains and traveling bands are formed at low and intermediate densities, respectively.
2 Experimental observations of CFL induced traveling band formation
In our previous experimental study,14 a mutant strain of Dictyostelium discoideum called the KI cell, which lacks chemotactic activity, was observed to exhibit collective cell migration, forming structures such as traveling bands and chains. The typical size σe of the cells is of the order of 10 to 20 μm, and the average speed ve of cells is around 0.3 to 0.4 μm s−1. Isolated single KI cells exhibit a persistent random walk with a persistence time τp of about 320 s, obtained from the temporal correlation function of the velocity.14Within a particular cell density regime of about 105 cells per cm2 (intermediate density), KI cells form band-like structures as shown in Fig. 1 (right) (see also Fig. 1(c) and (d) in ref. 14). These structures are periodically arranged in space with an interval of around 1 mm, equivalent to 50σe to 100σe. The band structures propagate in a sea of low-density cells, perpendicular to the direction in which they span with a speed of about 0.5 μm s−1, which is faster than the cell speed of about 0.3 to 0.4 μm s−1, indicating that there is turnover of cells in the traveling band. The cells enter the band from its front and leave it from its tail. Thus, what is propagating is the density of cells rather than a particular group of cells. The average polar order within the band is greater than 0.6, indicating that the band is in a polar-ordered phase.14 In contrast, the low-density region outside the band lacks an overall direction, with an average polar order of less than 0.3.
The formation of such patterns should be induced by the interactions between cells, which are short ranged. Such cell–cell interactions can be identified in the low density situation. In such a situation, cells are not completely isolated without collective direction, rather they are associated with each other forming a chain structure, in which cells follow the cell in front of them as shown in Fig. 1 (left) (see also Fig. 4(a) in ref. 14). This dynamical motion is called “contact following locomotion (CFL)” or “contact following (CF)”. This chain structure is not stable, but the lifetime tl-exp of a contact between a pair of cells is typically of the order of tl-exp = 300 s (Fig. 4(c) in ref. 14). Therefore, we call it transient chain formation. When a cell that has separated from other cells makes contact with another cell, it often reforms a chain structure. Thus, the chain structure repeatedly forms and collapses.
What kind of force between the cells in a pair maintains the CFL? Upon observing a pair of cells, we noticed interesting features in their motion. The rear cell exhibited faster and more fluctuating motion compared to the front cell. Fig. 2 (top) shows a histogram of the difference between the rear cell speed vr and the front cell speed vf. A statistical test indicates that the average value of the speed difference is significantly positive, revealing that the speed of rear cells is faster on average than the front cell. Comparing both sides of the distribution (Fig. 2 (bottom)), we found that the frequency of vr > vf was greater than in the opposite case. This suggests that the force acting on the rear cell is effectively greater than that acting on the front cell, to maintain the CFL. We speculate that an effective force is induced upon contact that propels the rear cells in the direction of the front cells, while the front cells are less affected by the rear cells. This force imbalance could maintain the CFL and the chain-like structure. The specific type of motion observed during the dynamical evolution of a cell pair depicting CFL, resulting in non-isotropic speed distribution while maintaining the pair, is discussed in Appendix A.
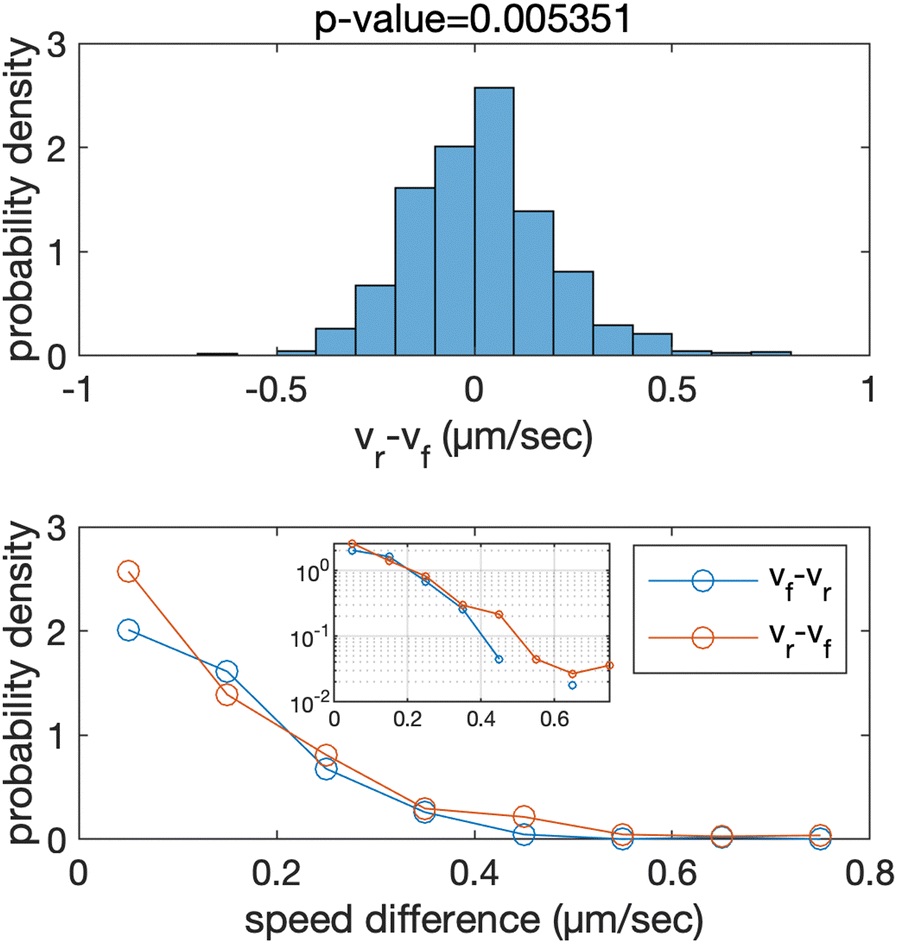 | ||
Fig. 2 (top) Histogram of the difference of rear cell speed vr and front cell speed vf, vr − vf, in a pair of cells. Pairs with relative angle between velocity vectors less than π/2 were considered. The total number of samples in the histogram was 1124. The average speed of front and rear cells was 0.343 (μm s−1) and 0.357, respectively. The average difference in the speeds was  . Using a one-tailed t-test, it was found that with statistically significant P-value = 0.00535, the mean value of the speed difference vr − vf is positive, suggesting that the speed of the rear cell was statistically faster than that of the front cell. bottom comparison of both sides (positive and negative ranges) of the histogram illustrating that the frequency of vr > vf was greater than in the opposite case. . Using a one-tailed t-test, it was found that with statistically significant P-value = 0.00535, the mean value of the speed difference vr − vf is positive, suggesting that the speed of the rear cell was statistically faster than that of the front cell. bottom comparison of both sides (positive and negative ranges) of the histogram illustrating that the frequency of vr > vf was greater than in the opposite case. | ||
3 Model of collective motion induced by contact following locomotion
Here, we present a theoretical model aimed at elucidating the role of CFL in driving collective motion of KI cells. The cells possess polarity that is induced by spontaneous symmetry breaking,36–38 which causes them to move in the direction of their polarity. This motion can be modulated by intracellular perturbations resulting from stochastic processes within the cell. One such process includes signal reactions that lead to spontaneous polarity formation. Consequently, the direction of cell polarity can fluctuate, resulting in the motion of cells being random over a long time scale.37 Our previous analysis has indicated that the correlation time of cell motion is approximately 320 seconds.14 Thus, the motion of individual cells can be described using Langevin equations.We consider two kinds of interactions between cells: selective contact interaction, CFL, and volume exclusion interaction. When a pair of cells come close and move almost in the same direction, the rear cell head is attached to the front cell tail, thereby inducing selective contact. Conversely, when cells come close but move in opposite directions, only mechanical collisions are observed without CFL. The selective contact mechanism is supported by trans-membrane proteins, TgrB1 and TgrC1, expressed during the development of Dictyostelium discoideum cells, which can bind with each other and mediate heterophilic interactions for inter-cellular contact.20,39,40 A previous study reported that TgrC1 operates at the rear-end of the front cell, while TgrB1 operates at the front-end of the rear cell.20 A mutant lacking tgrb1 indeed did not exhibit CFL activity or tail-following behavior,14 indicating the role of these proteins in CFL. Consequently, the CFL term depends on the polarity direction of the cells in contact.
Cells possess polarity that arises from the formation of asymmetric patterns of molecules within the cell. Once the polarity direction is established, cells move in the direction of their polarity. However, due to intercellular interactions, such as CFL, the velocity direction of cells may deviate from their polarity direction. To compensate for this deviation, cells may reorganize their internal polarity through processes that may be induced by the cell–cell adhesions that lead to CFL or mechanical forces resulting from interactions between neighboring cells. These processes give rise to a self-alignment between the directions of cell polarity and cell velocity, promoting the coordinated motion of cells.
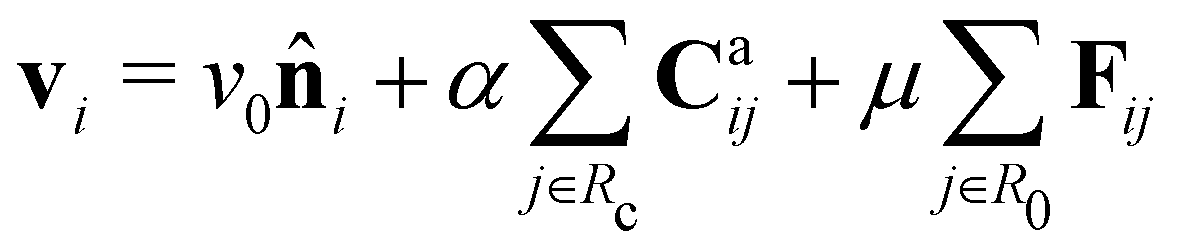
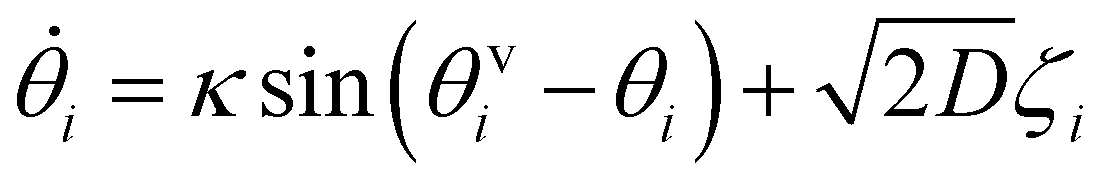
Based on the above considerations, we can now derive the equation of motion for an individual cell i in the system. The system comprises N elements in a two-dimensional space with dimensions A = Lx × Ly. Cell i is located at position ri(t) = (xi(t), yi(t)) with a polarity direction θi(t). Then, the evolution equations for the velocity ṙi = vi and polarity θi are given by:
 | (1) |
 | (2) |
![[n with combining circumflex]](https://www.rsc.org/images/entities/b_char_006e_0302.gif) i = (sin
i = (sin![[thin space (1/6-em)]](https://www.rsc.org/images/entities/char_2009.gif) θi, cosθi), with a constant speed v0. The second and third terms on the right hand side of eqn (1) are the CFL and volume exclusion interactions, respectively, and the first term on the right hand side of eqn (2) is the self-alignment term. These terms are effective with the interaction between cells. With ζi being a zero mean Gaussian white noise with unit variance, isolated cells exhibit a persistent random walk, with the correlation time given by 1/D.
θi, cosθi), with a constant speed v0. The second and third terms on the right hand side of eqn (1) are the CFL and volume exclusion interactions, respectively, and the first term on the right hand side of eqn (2) is the self-alignment term. These terms are effective with the interaction between cells. With ζi being a zero mean Gaussian white noise with unit variance, isolated cells exhibit a persistent random walk, with the correlation time given by 1/D.
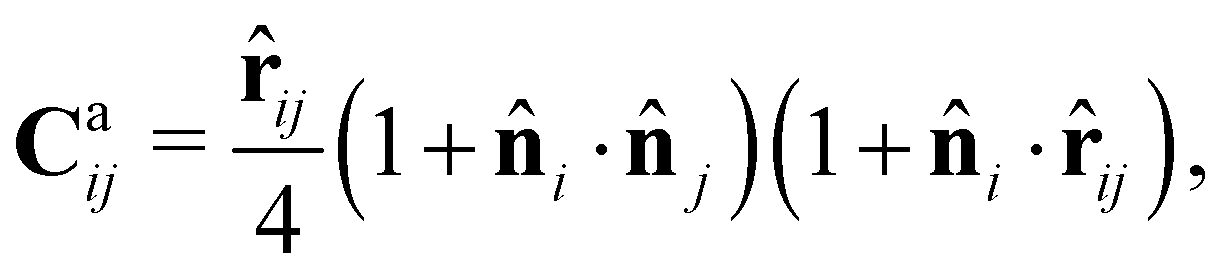
For the CFL term, we construct a force Caij that is exerted on cell i by cell j when it is in contact with cell j, given by
 | (3) |
![[r with combining circumflex]](https://www.rsc.org/images/entities/b_char_0072_0302.gif) ij = (rj − ri)/|rj − ri|. This term describes the forces induced by selective contact, which were observed in the experiment, where the broken reciprocity arises. This force is effective within the distance Rc = 1.9. Here, we choose the unit of length such that the diameter of cell σ is unity, i.e., σ = 1. The strength of CFL is specified by α. The first parenthesis in the expression of Caij indicates the effect of relative orientation on the force. When the two cells in a pair are oriented in the same direction (i·j = 1), it is maximum. In contrast, when they are in the opposite direction (i·j = −1), the force Caij vanishes. The second parenthesis is the tail-following term. When the polarity of cell i, i, and the unit vector from cells i to j, ij, have the same orientation, i.e., cell i is oriented to the direction of cell j, the maximum following force is induced in cell i in the direction of cell j. Such a situation is expected when cell i is located in the tail of cell j and oriented to cell j. In contrast, when cell i is the front cell and is oriented towards the opposite direction from cells i to j, the force Caij vanishes.
ij = (rj − ri)/|rj − ri|. This term describes the forces induced by selective contact, which were observed in the experiment, where the broken reciprocity arises. This force is effective within the distance Rc = 1.9. Here, we choose the unit of length such that the diameter of cell σ is unity, i.e., σ = 1. The strength of CFL is specified by α. The first parenthesis in the expression of Caij indicates the effect of relative orientation on the force. When the two cells in a pair are oriented in the same direction (i·j = 1), it is maximum. In contrast, when they are in the opposite direction (i·j = −1), the force Caij vanishes. The second parenthesis is the tail-following term. When the polarity of cell i, i, and the unit vector from cells i to j, ij, have the same orientation, i.e., cell i is oriented to the direction of cell j, the maximum following force is induced in cell i in the direction of cell j. Such a situation is expected when cell i is located in the tail of cell j and oriented to cell j. In contrast, when cell i is the front cell and is oriented towards the opposite direction from cells i to j, the force Caij vanishes.
For the volume exclusion interaction, we consider a soft repulsive core with the assumption that the cells mostly have a circular shape with a diameter of σ. The corresponding force acting on any cell i in the vicinity of another cell j is given by Fij = −∇iU(rij), obtained from the WCA potential,41
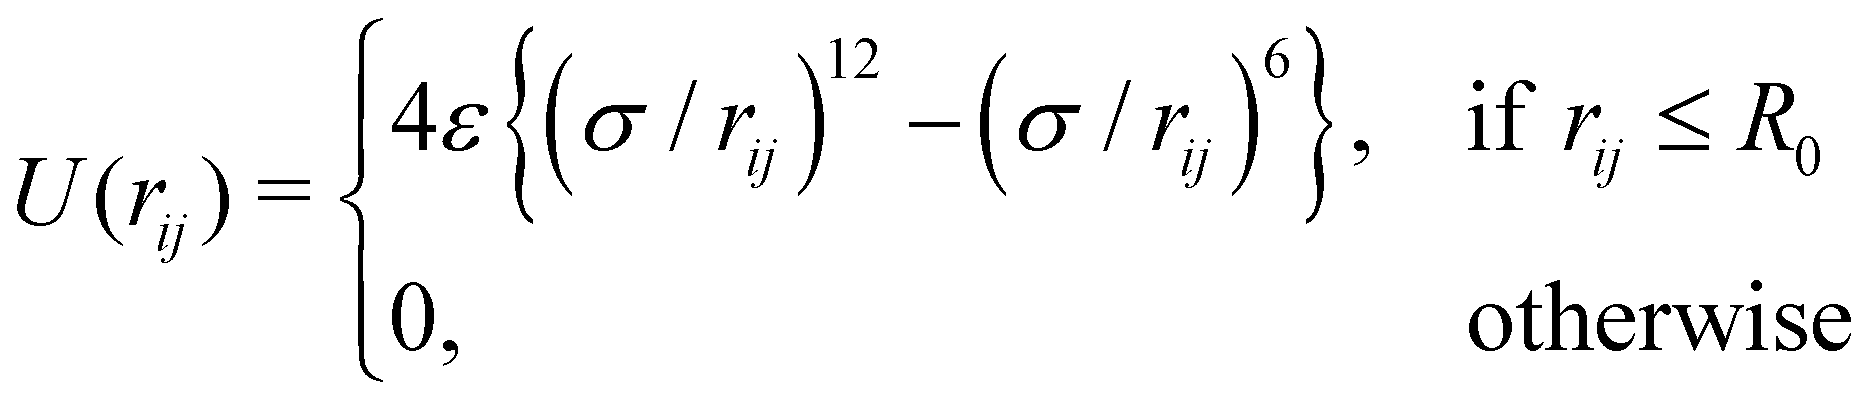 | (4) |
The first term on the right hand side of eqn (2) gives the self-alignment42,43 effect between the polarity direction θi and the velocity direction θvi. The velocity direction is defined by vi/|vi| = (sinθvi, cosθvi). The coefficient κ determines the strength of the internal force that reorganizes the cell polarity to self-align with the velocity direction, and sin(θvi − θi) corresponds to the first term in the Fourier series, satisfying the symmetry with respect to θi → θi + 2π, θvi → θvi + 2π and (θi, θvi) → (−θi, −θvi).
The density ρ = (N/A)(π/4)σ2 plays a crucial role in the experiment. In this paper, we consider two density values: ρ = 0.01 and ρ = 0.2, corresponding to low and intermediate densities in the experiment, respectively. The diffusivity D = 0.003125 s−1 is derived from the observed persistence time scale of a single cell in the experiment, σ2/D = 1/D = 320 s. Based on the values of ve and σe, KI cells take around 30 to 60 seconds to travel across the cell. Thus, the speed v0 is estimated to be between 1/60 = 0.016 s−1 and 1/30 = 0.033 s−1 to become comparable to the experimental situation. An average speed of v0 = 0.025 s−1 is taken for the simulation. The dimensionless Péclet number Pe = v0σ/D = 8 sets the activity of the cells in this system. We use the Euler integration scheme with an integration time step of δt = 10−3τs to perform the numerical simulations. We take N = 1024 for the low-density analysis, N = 512 to show configurations in Fig. 3(F) (for better visualization), and N = 4096 for the intermediate-density analysis. The parameters we will explore in this paper are the strengths of the adhesion interaction α and the self-alignment interaction κ. The dimension (Lx × Ly) of the system is determined by ρ and N. For the low and intermediate densities, (Lx × Ly)(ρ,N) is given by (304.74 × 263.91)(0.01,1024) and (136.284 × 118.025)(0.2,4096), respectively.
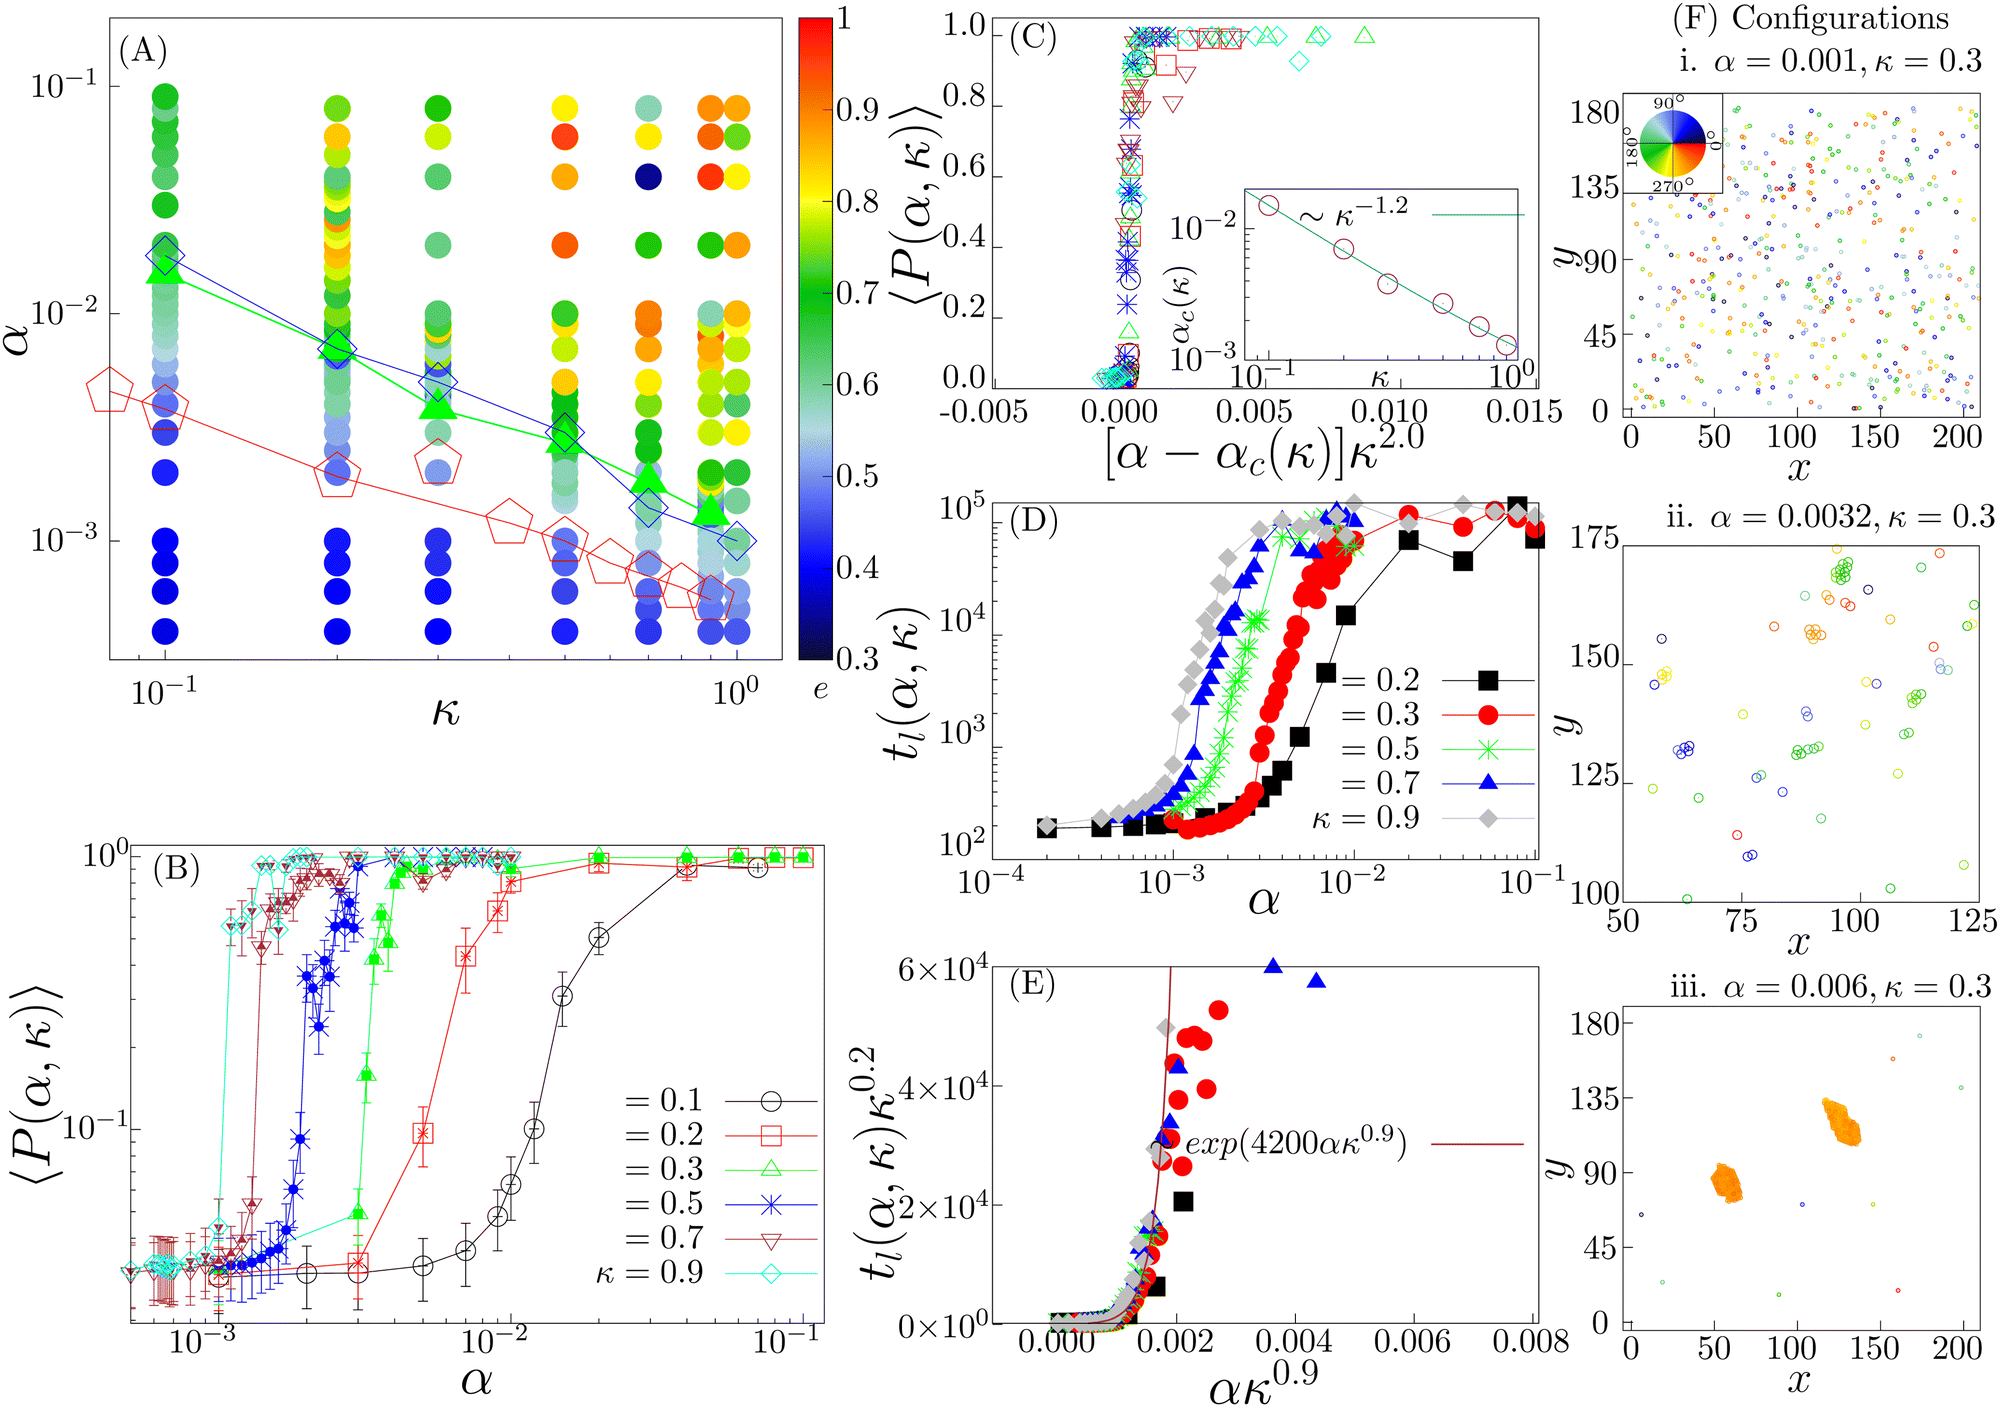 | ||
Fig. 3 Low density (ρ = 0.01): (A) phase diagram in the α–κ plane with the mean eccentricity e(α, κ) color coded. The red pentagons depicts α1(κ) for which tl(α, κ) ∼ tl-exp, identifying the onset of the transient chain formation phase. The green filled triangles denote the order–disorder transition points in the (α, κ) phase plane and consequently identify the onset of the stable elongated cluster phase. The solid lines connecting the points depict the corresponding phase boundaries. (B) The polar order parameter P(α, κ) is shown for different values of κ as a function of α. A disorder–order transition is observed and the maxima in  (errorbar) identify the transition points αc(κ). (C) The data collapse of the 〈P(α, κ)〉 curves are shown with the transformation: α → [α − αc(κ)]κ2.0. The transition point αc(κ) seems to decay as a power law, αc(κ) ∼ κ−1.2 (inset). (D) The order–disorder transition is associated with the pair-lifetime tl(α, κ) becoming infinitely large. The variation of the tl(α, κ) vs. α is shown for different values of κ. (E) The data collapse of tl(α, κ) vs. α curves for different κ values is shown for the transformation: α → ακ0.9 and tl(α, κ) → tl(α, κ)κ0.2. The growing exponential ∼exp(4200ακ0.9) fits well with the data collapse. (F) Typical configurations in the three different phases are shown (isotropic phase in (i), transient chain formation phase in (ii) and stable elongated cluster phase in (iii)) for κ = 0.3. Color indicates the direction of motion. (errorbar) identify the transition points αc(κ). (C) The data collapse of the 〈P(α, κ)〉 curves are shown with the transformation: α → [α − αc(κ)]κ2.0. The transition point αc(κ) seems to decay as a power law, αc(κ) ∼ κ−1.2 (inset). (D) The order–disorder transition is associated with the pair-lifetime tl(α, κ) becoming infinitely large. The variation of the tl(α, κ) vs. α is shown for different values of κ. (E) The data collapse of tl(α, κ) vs. α curves for different κ values is shown for the transformation: α → ακ0.9 and tl(α, κ) → tl(α, κ)κ0.2. The growing exponential ∼exp(4200ακ0.9) fits well with the data collapse. (F) Typical configurations in the three different phases are shown (isotropic phase in (i), transient chain formation phase in (ii) and stable elongated cluster phase in (iii)) for κ = 0.3. Color indicates the direction of motion. | ||
4 Results
Before comparing the simulation behavior of the present model with the experimental observation, we explore the phenomena observed in the model. For the two different densities (ρ = 0.01 and ρ = 0.2), by changing α and κ, this model exhibits a variety of dynamic pattern formation. To characterize individual phases, we use the polar order parameter and the mean eccentricity of cell clusters. The polar order parameter 〈P〉 is defined as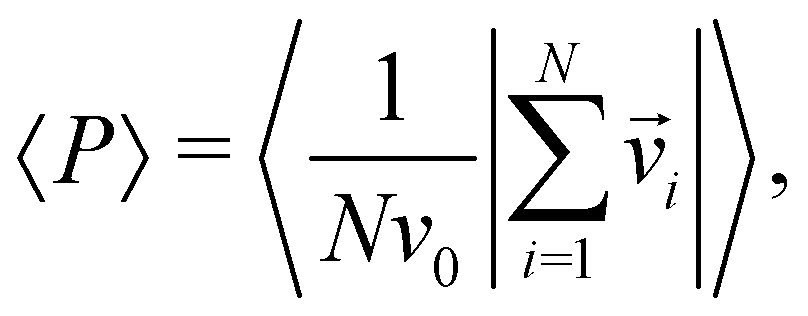 | (5) |
A cluster of cells is defined as a set of cells which are interconnected via the interactions. Here, any two cells which are interacting with each other, i.e., within a distance less than Rc, are considered to be connected. Clusters characterized by a monolayer arrangement of cells, or at most a bi-layered structure, which are elongated along their direction of motion, are referred to as chains. To identify spatial symmetry breaking in the structures such as chains and clusters, which are mostly elongated along their direction of motion, we introduce the mean eccentricity at any phase point (α, κ) in the phase space as 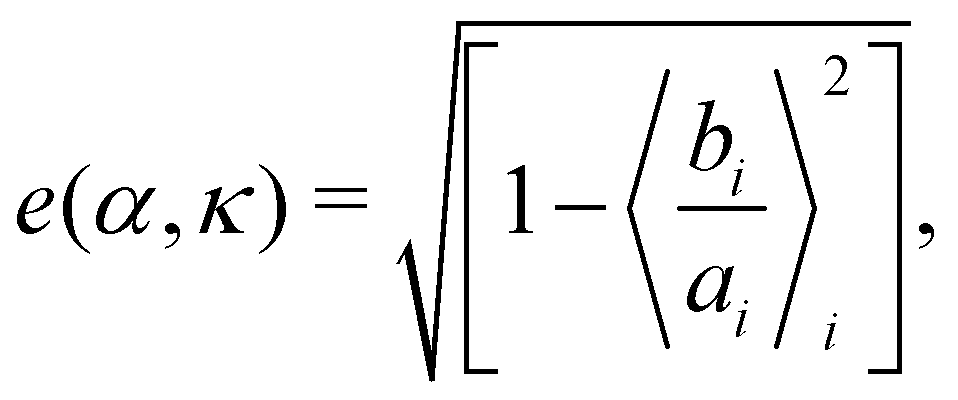 where bi and ai are the semi-minor and semi-major axis of the cluster i, calculated from its Gyration tensor. The averaging 〈·〉i is taken over all such clusters i, in around 5000 well separated steady state configurations. An elongated structure can be identified by its e. For symmetric structures, e remains close to zero. As the structure elongates, e shifts toward unity.
4.1 Chain formation at low density
We first study the case when the density is low (ρ = 0.01). In the small (α, κ) regime, the system resides in the isotropic phase (Fig. 3(A) and (F)-(i)). In this phase, the polar order parameter 〈P〉 is close to zero. e is also observed to be close to zero. The typical average lifetime tl of a pair of cells (hereafter called pair-lifetime) in this phase is quite small (few tens of seconds). Thus, the cells move in random directions and the cell distribution is spatially homogeneous without a specific spatial pattern. With increasing (α, κ), tl keeps on increasing. As it reaches at α = α1(κ), marked by the red line with pentagons in Fig. 3(A), tl becomes larger than tl-exp = 300 s and a transient chain formation phase emerges as shown in Fig. 3(F)-(ii) (see also Movie S1, ESI†). The formed chain structures move along their direction of elongation (see Appendix B). Within the range of chain formation, we can observe the growth of e beyond 0.4. The polar order parameter of the entire system remains close to zero. This phase is considered to explain the formation of transient chain-like structures observed at low density in the experiment.With the further increase of (α, κ) at α = α2(κ) marked by the blue line with diamond in Fig. 3(A), the elongated structures stabilize over time with e > 0.6 (elongated cluster phase), depicting the formation of infinitely long lived clusters (tl → ∞), elongated mostly along their direction of motion (Fig. 3(F)-(iii)). The whole system of cells then forms a very few polar clusters with overall polarisation 〈P〉 becoming close to 1. Thus, a disorder–order transition happens as we go from the transient chain formation phase to the elongated cluster phase. The variation of the polar order 〈P〉 across the transition is shown in Fig. 3(B). The critical transition points αc(κ) (green line with filled triangles in Fig. 3(A)) are identified by the maxima in the fluctuation of the order parameter as  (error bars in Fig. 3(B)). The 〈P(α, κ)〉 curves show data collapse by the transformations, α → [α − αc(κ)]κ2.0 (Fig. 3(C)), with αc(κ) following a power law decay of the form αc(κ) ∼ κ−1.2 (Fig. 3(C) inset). Data collapse of the order parameter growth curve indicates that the growth of order parameter follows the same law close to the transition within the range of α and κ we studied and for a given N.44
Note that the disorder–order transition line indicated by αc(κ) and the boundary line α2(κ) marking the onset of long-lived pairs overlap closely. This suggests that these two events are not independent, rather the formation of the ordered phase stabilizes pairs, making their pair-lifetime infinitely large. The typical growth of the tl(α, κ) as a function of α are shown in Fig. 3(D) for different values of κ. It shows an initial exponential growth followed by a saturation due to the finiteness of the simulation time. A data collapse with the transformation tl(α, κ) → tl(α, κ)κ0.2 and α → ακ0.9 is observed (Fig. 3(E)). The collapsed data fits an exponentially growing function of the form ∼exp(Aακ0.9). This indicates an exponentially fast divergence to the long living pair formation phase near the order–disorder transition.
4.2 Traveling band formation at intermediate density
We next study the case when the density is intermediate (ρ = 0.2). We observe four different phases, i.e., isotropic phase, microscopic cluster phase, macro polar cluster phase and band formation phase. The phase diagram with the observed phases is shown in Fig. 4A. Each of these phases is identified by their unique spatial distribution of the cells and is quantified by their density distributions shown in Fig. 4C. To observe the distribution of the local density, the whole system is divided into 20 × 20 square grids of dimensions lx × ly = 6.8 × 5.9. The local densities of any grid i is estimated as the number of cells (nil) per unit area, i.e. ρil = nil/(lx × ly). The distribution Dp(ρl) is then calculated over all such spatial grids and over a minimum of 50000 well separated steady state configurations.
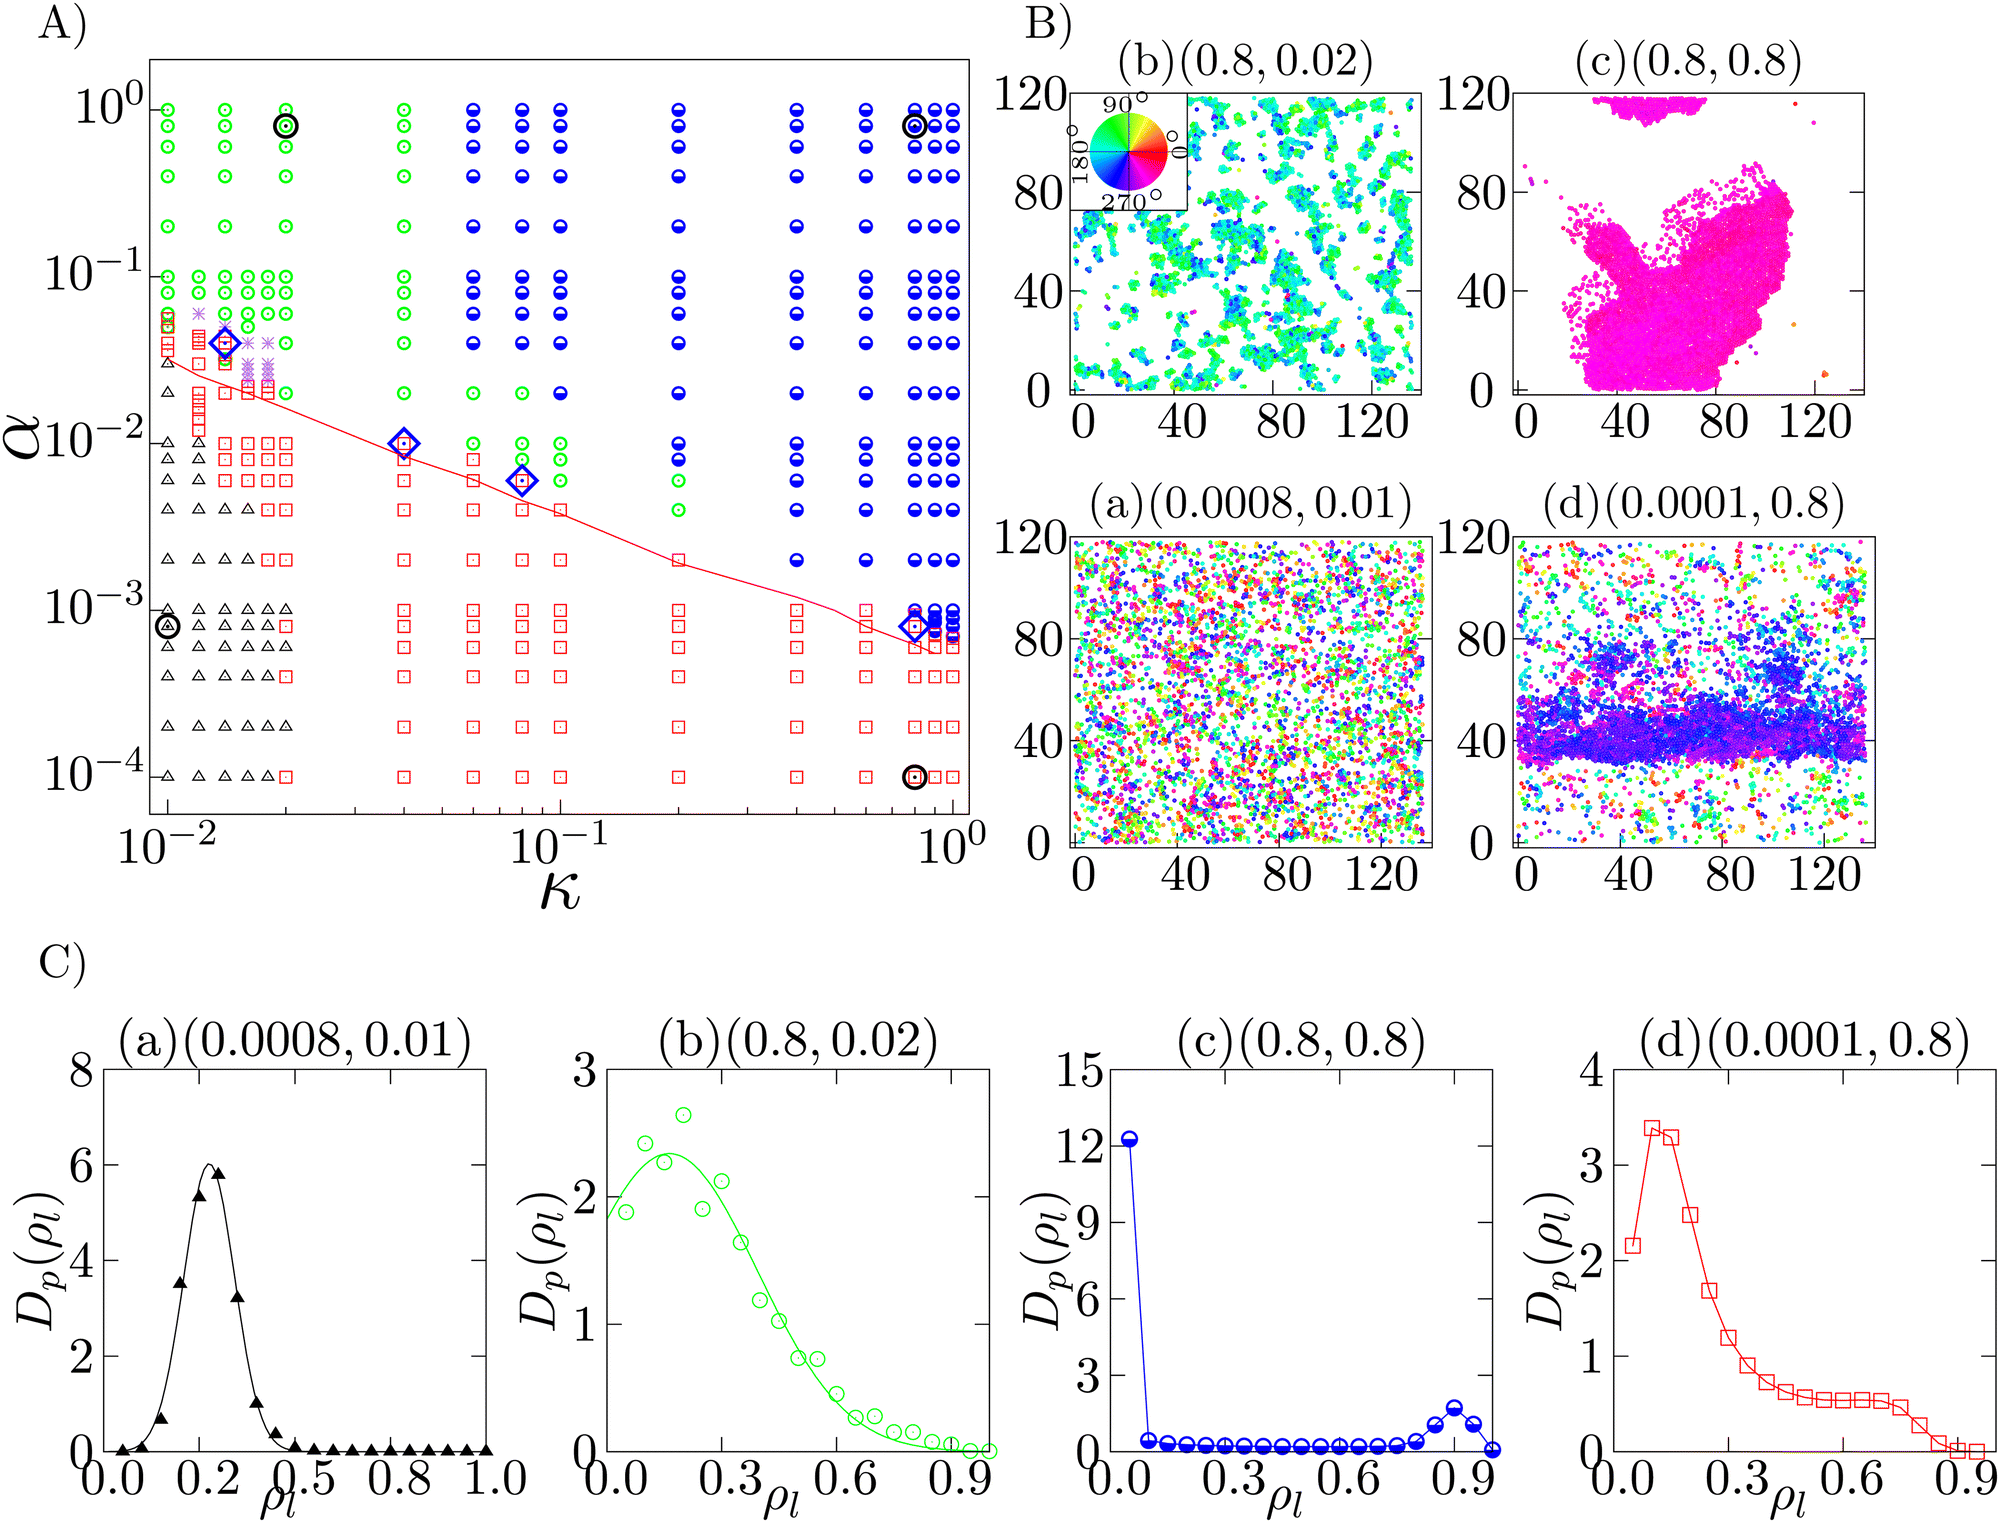 | ||
| Fig. 4 Intermediate density (ρ = 0.20): (A) phase diagram in the α–κ plane, at ρ = 0.2, depicts the isotropic phase (black triangle), microscopic cluster phase (green circle), macro polar cluster phase (blue half-filled circle) and the band formation phase (red square). Typical configurations of the different phases (at phase points marked by open black circles) are shown in (B). The density distribution of the phases in (B) is depicted in (C). The corresponding phase points (α, κ) are mentioned on top of each plot. The red line in (A) marks the onset of longer pair lifetime tl > 300 s at low density. The red squares above the red line in (A) identify the experimental regime. Four points are marked as blue diamonds in (A), within the experimental regime at which the corresponding low (ρ = 0.1) and intermediate density (ρ = 0.2) configurations are shown in Fig. 5. (C) Density distribution Dp(ρl) of (a) isotropic, (b) microscopic cluster, (c) macro polar cluster and (d) band formation phases identified by (a) Gaussian distribution with a peak close to the mean density (ρ = 0.2), (b) left truncated Gaussian distribution, (c) bimodal distribution with one peak at a very high density and another peak at zero identifies, and (d) bimodal distribution with both the peaks at non-zero densities, respectively. Color in (B) indicates the direction of motion. | ||
When both α and κ are sufficiently small, the cellular dynamics is dominated by diffusion and hence the system stays in the isotropic phase (black triangles in Fig. 4A), depicting a homogeneous spatial distribution of cells (Fig. 4B(a)). The velocity vectors of the cells are observed to be pointing in random directions, resulting 〈P〉 to be close to zero. The distribution of the local cell density Dp(ρ) is found to fit a Gaussian with its peak at the mean density (ρ = 0.2) of the system (Fig. 4C(a)).
With the increase of α, keeping κ to be small, we observe a microscopic cluster phase (green circles in Fig. 4A), where the system consist of microscopic polar clusters with the length scales of these clusters much smaller than that of the system. A typical configuration is shown in Fig. 4B(b), with the polar direction marked with color-code. The value of the polar order parameter 〈P〉 in this phase is close to 1/2. The associated density distribution is shown in Fig. 4C(b). The density distribution Dp(ρl) can be fitted to a left truncated Gaussian distribution. As shown in Fig. 4B(b), the spatial distribution of cells is non-homogeneous with vacant spaces (zero density).
When both α and κ are large, the system shows a compact macro polar cluster phase (blue half filled circle in Fig. 4A), with the length scale corresponding to the size of the cluster equivalent to the order of the system size. A typical configuration is shown in Fig. 4B(c). The density distribution Dp(ρl) of this phase (Fig. 4C(c)) is a bimodal distribution, with one peak at high density corresponding to the large high density polar cluster and another peak at zero, corresponding to the larger vacant spaces. This phase is a completely ordered phase with 〈P〉 observed to be close to 1.0. In this phase, the cells move mostly as a connected cluster. However, with evolution of time, the shape of the cluster and the direction of propagation keep on changing, seemingly independently.
For sufficiently large self-alignment interaction κ, with comparatively smaller adhesion strength α or even no adhesion, band formation arises. Here, the term “band” corresponds to a moving high density patch propagating perpendicular to its length within a low density sea of cells. A regime of band formation phase is depicted in Fig. 4A (red square). A typical band structure (Fig. 4B(d)) moves perpendicular to its spanning direction with a sharp front and a comparatively fluctuating tail (Movie S2, ESI†). The density distribution Dp(ρl) of a band formation phase is shown in Fig. 4C(d). The distribution Dp(ρl) has a peak at low density corresponding to the low density of sea of cells, and a high density shallow peak corresponding to the band. Compared to the macro polar cluster phase, in this phase, the low density sea of cells is dominating compared to the large vacant spaces available in the macro polar cluster phase. 〈P〉 is observed to be of the order of 1/2.
Note that, the phase points not identifiable by their statistical characteristics within our observation time are marked as asterisks.
4.3 Parameter region that explains both transient chain and traveling band formations
In the experiment, the band formation and the transient chain formation has been observed by just changing the cellular density.14 Such a parameter region can be identified by observing the overlap between the transient chain formation phase at ρ = 0.01 and the band formation phase at ρ = 0.2. In Fig. 4A, the red line indicates the onset of transient chain formation phase in the low density (ρ = 0.01). The red squares above this red line identify the experimental phase that depicts the chain formation at ρ = 0.01 and the band formation at ρ = 0.2.45 Within this phase, typical spatial configurations of cells at four different parameter sets (marked by blue diamonds in Fig. 4A) are shown at both ρ = 0.2 (Fig. 5(i)) and at ρ = 0.01 (Fig. 5(ii)). In this subsection, we show that the characteristics of the traveling band observed experimentally can be reproduced in our simulations.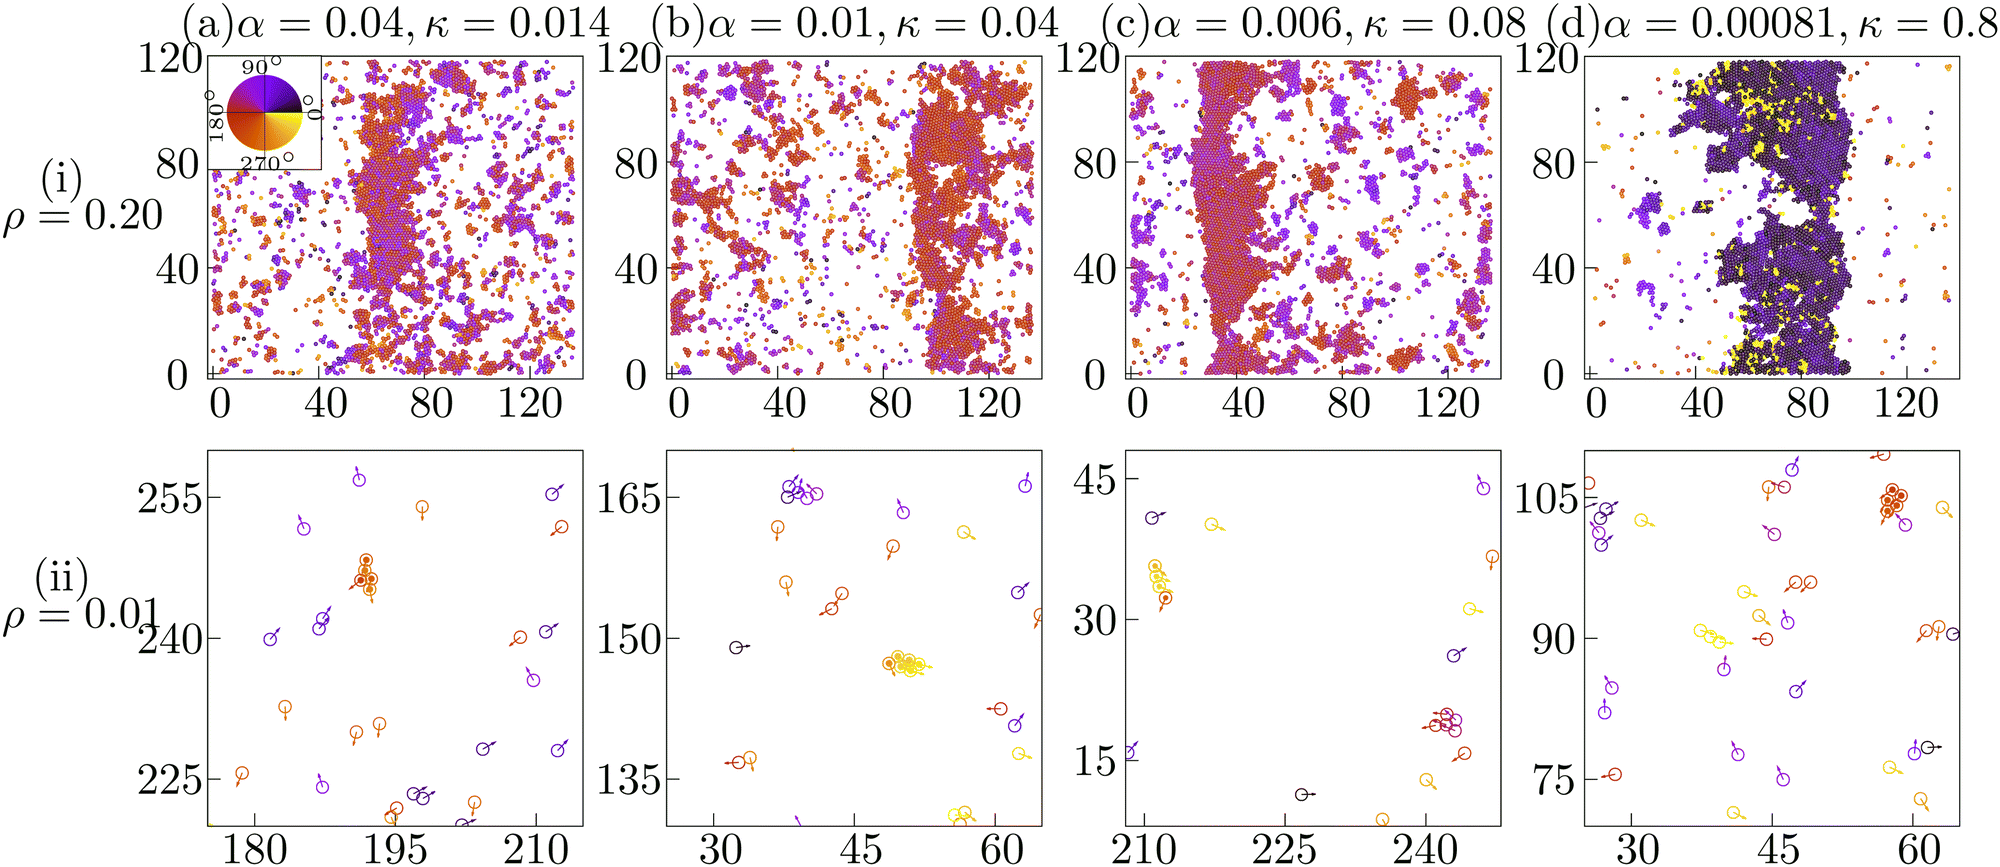 | ||
| Fig. 5 Typical configurations at (i) intermediate density (ρ = 0.2) depicting band formation and at (ii) low density (ρ = 0.01) depicting transient chain formation are shown at four phase points (marked as blue diamonds in Fig. 4A) (a) (0.04, 0.014), (b) (0.01, 0.04), (c) (0.006, 0.08) and (d) (0.00081, 0.8) identified by the set of parameters (α, κ) within the phase corresponding to the experimental system. Color indicates the direction of motion depicted in the color-wheel. Note that the amplitude of the velocity vectors in (ii) are multiplied by 1.5 for better visibility. | ||
The spatial profile of the local density along the direction of band propagation ρl(x) indicates that the high density band has a sharp front and a decaying tail (Fig. 6(a)). We first measured the band propagation speed vb as the rate of displacement of the sharp high density front. The mean speed of the band is higher than that of the cellular speed (v0 = 0.025) (Fig. 6(b)), consistent with the experimental observation. Actually, in the simulation, the cells enter the band from its front and leave it from its tail. The band speed vb depends on the parameter value. As shown in Fig. 6(b), the band speed vb increases as the CFL strength α increases.
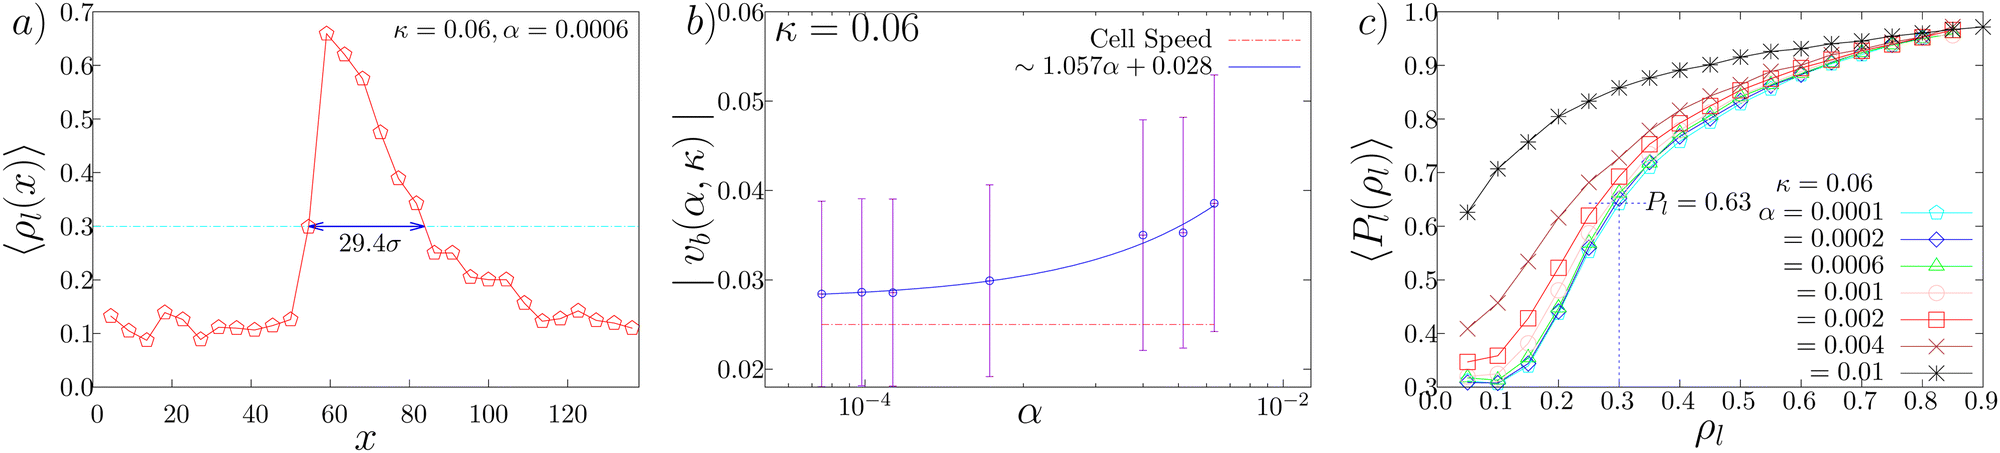 | ||
| Fig. 6 (a) A typical spatial profile of the local density ρl(x) in space along the direction of band propagation shown at (α, κ) = (0.0006, 0.06). To calculate ρl(x), we divided the system into 30 strips of dimension (lbin × Ly) = (4.54σ × 118.03σ) along the x-axis. The cyan dashed line marks the 〈ρl〉 = 0.3 line and the solid blue arrow identifies the bandwidth, which is of about ∼29σ. Note that the local density is above 0.3 within the band. (b) The variation of the band propagation speed vb(α, κ) against α is shown (blue circle) for a fixed value of κ = 0.06. The cellular speed v0 = 0.025 is shown as the red dashed line, for comparison. The variation fits a linear equation of the form vb(α) ∼ 1.057α + 0.028 (blue line). (c) The average local polarisation, 〈Pl(ρl)〉, of cells as a function of local density is shown for a fixed κ = 0.06. Some α values are chosen within the band formation phase at α = 0.0001 (cyan pentagon), 0.0002 (blue diamond), 0.0006 (green triangle), 0.001 (pink circle) and 0.002 (red square). The values α = 0.004 (brown cross) and α = 0.01 (black asterisk) correspond to the regime just below and above the experimental regime, respectively. | ||
From Fig. 6(a), the bandwidth w is estimated to be around w = 29.4, which corresponds to about 300 μm to 600 μm (for σe = 10 μm and 20 μm, respectively), which is consistent with the experimental observation.14 For the cell size (σe = 12 μm) used for the simulations, the average bandwidth corresponds to around 350 μm. From Fig. 6(b), vb is between 0.03 and 0.04 (s−1), which corresponds to about 0.36 μm s−1 to 0.48 μm s−1. Thus, the typical time interval up to which cells stay within bands is given by w/(vb − v0) and thus ranges within 2000 to 5000 s. In the experiment, the bandwidth is observed to be in the range from 200 to 700 μm and the band speed is observed to be approximately 0.5 μm s−1. Thus the time spent by cells within the band is within the range of 1000 to 3500 s. Hence the observed average duration of the cell within the band in the simulations is similar to the experimentally observed result.14
We next study the polar order inside and outside the bands. To identify the band area, we introduce a local density threshold of ρl = 0.3, above which areas are considered as the band region. As there are density fluctuations at the tail of the band, the threshold is taken to be 0.3, which is greater than the system density 0.2. In Fig. 6(c) we show the average of the local order parameter Pl(ρl) as a function of the local density for κ = 0.06. We find that the band area with ρl greater than ρl = 0.3 exhibits the local polar order parameter value larger than 0.63. In contrast, the area outside of the band, whose density is close to ρl = 0.1 as found in Fig. 6(a), exhibits the local polar order parameter which is close to 0.3. Thus, the traveling band is the polar ordered phase, which phase-separates with the disordered background. These results in the simulation is consistent with the experimental observation.14
Why is the local polar order parameter in the band area not close to 1, but distributed around 0.63? As observed in ref. 14, it was found that the migration direction was widely distributed in the range of about 60 degrees with the standard deviation to be about 30 degrees. Such heterogeneity in the direction of cell motion within the band can also be seen in the present model. In Fig. 7(a) and (b), we show two typical configuration depicting band formation. As we zoom in a certain part of the bands, shown in Fig. 7(c) and (d), we observe that there are some cells moving in directions which are almost 90 degrees separated from the other cells within the band. The standard deviation in the distribution of cell orientation within the band is about 16 degrees. Because of this heterogeneity, the local order parameter in the ordered traveling band is much less than 1. However, the origin of such large heterogeneity in the ordered traveling band remains to be elusive.
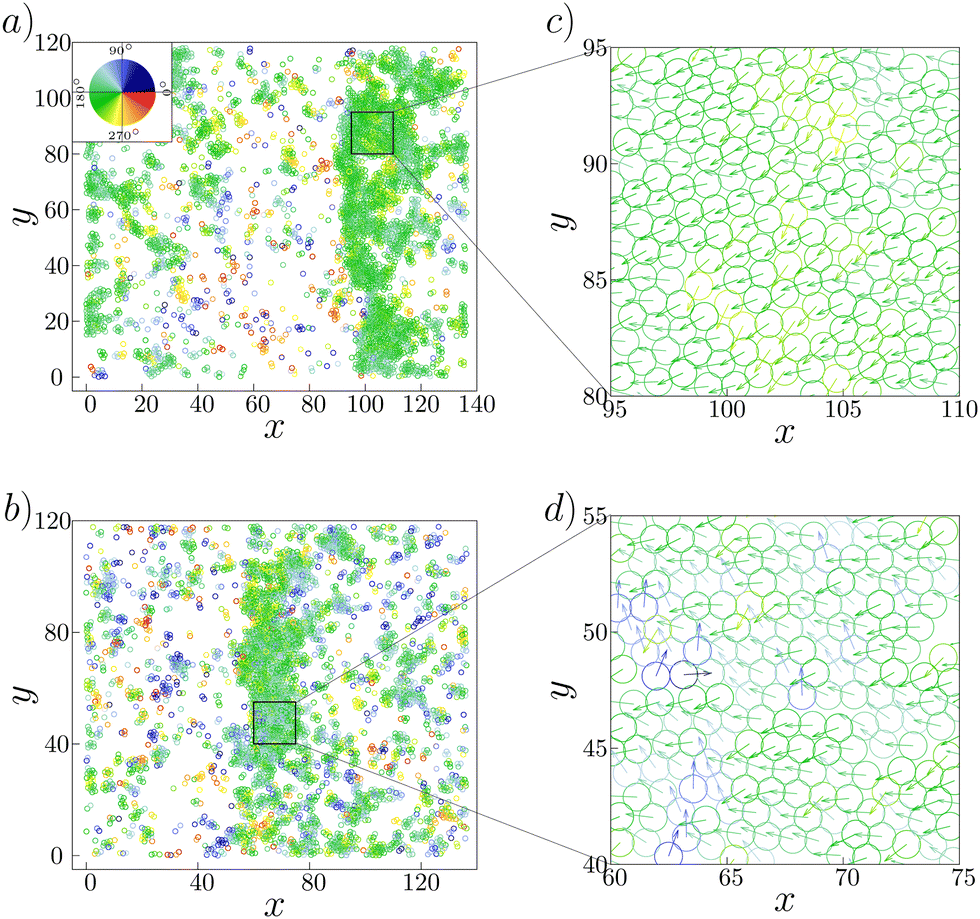 | ||
| Fig. 7 Formation of bands at the phase point (α, κ) = (a) (0.01, 0.04) and (b) (0.04, 0.014). Both the bands move along the negative x-axis. The areas marked as a square box in (a) and (b) are magnified in (c) and (d), respectively. Color indicates the direction of motion depicted in the color-wheel. | ||
5 Discussion
In this article, we presented a theoretical model to reproduce the collective behavior of KI cells, a mutant of Dictyostelium cell that lacks chemotaxis activities.14,22 The KI cells are known to exhibit distinctive patterns of aggregation, forming chain and traveling band structures in low and intermediate cellular densities, respectively (Fig. 1).14 Our model successfully reproduced these phenomena and shed light on the underlying mechanisms driving these pattern formations.We first showed that when cells are moving in a chain, there is an imbalance of force between the front and rear cells (Fig. 2). This observation prompted us to introduce a “Contact Following Locomotion” (CFL) term into our model. The CFL term induced non-reciprocal interaction between cells, creating an additional propulsion force in the rear cells, thereby facilitating the formation of chain structures during migration. Moreover, the model demonstrated a wide range of behaviors, including both chain and traveling band formations (Fig. 3 and 4). We note that in the previous model,14 non-reciprocal intercellular interactions were considered to describe contact following in the evolution equation for the cell polarity, corresponding to a signalling mechanism induced by contact following. Since the speed was found to depend on the cell position relative to the other cells in a pair, in the present model, the non-reciprocity induced by the cell–cell contact is implemented as a mechanical force in the evolution equation for the velocity.
Our results suggest that the non-reciprocal effect in the CFL term primarily contributes to the formation of asymmetrical structures, such as chains. In contrast, the self-alignment effect might be sufficient for the emergence of traveling bands (Fig. 8). However, it is essential to recognize that the parameters governing the CFL term and the self-alignment term may not be entirely independent in real cells. In fact, self-alignment of cell polarity direction may occur through the cell–cell adhesion responsible for the CFL.20 Therefore, it is plausible that in actual cells, the parameters of the CFL term and the self-alignment term are interdependent and cannot be modified independently.
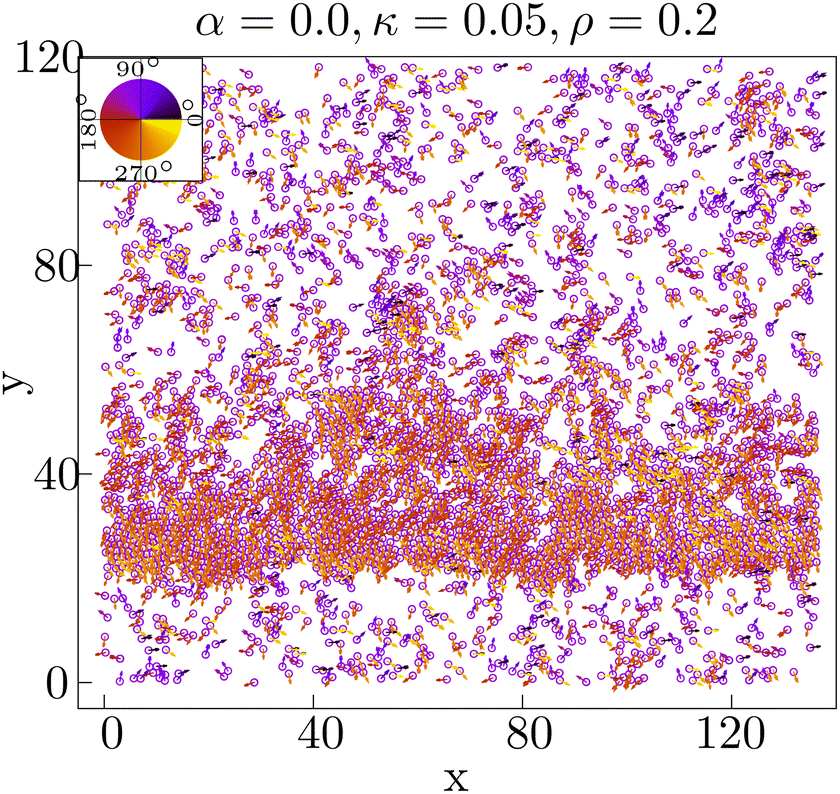 | ||
| Fig. 8 Typical configuration showing band formation at ρ = 0.2, when the adhesive force α is set to zero. The κ is fixed at 0.05. The color wheel corresponds to the polarity direction of individual cells. | ||
In the tgrb1 mutant, which lacks the expression of the adhesion protein TgrB1, the formation of chains is severely impaired, and traveling bands do not form.14 This suggests that the cells were in the state of an isotropic phase due to the loss of both effects of CFL and self-alignment terms.
While we have identified parameter regions that correspond to the experimental observations, the parameter space allowing both chain and traveling band formations is still wide. Specifically, in regions with low values of the parameter κ, the self-alignment effect is weak, yet the CFL term induced band formation, emphasizing the importance of the CFL term in promoting this behavior. Future research should aim to pinpoint the precise parameter values that best explain experimental results.
Our model demonstrates that the tail-following behavior induced by the CFL term and the self-alignment effect work in concert to not only facilitate the formation of chain and traveling band structures but also to produce a variety of other collective behaviors. These two effects are also present in a variety of phenomena, including flocking in birds46,47 or schooling in fish,48 although their physical origins may differ. Therefore, the collective behaviors induced by the combination of these effects may be universal in a wide range of active matter systems.
Author contributions
The project was conceptualised by T. S. The experiments were designed by M. H. and T. S., and implemented by M. H. The theory was designed by B. B. and T. S. The simulation codes were developed by B. B. Data analysis was performed by B. B. and T. S. The draft was written by B. B. and T. S. and critically examined by M. H.Conflicts of interest
There are no conflicts to declare.Appendices
Appendix A: Speed asymmetry of front and rear cells
According to our observation of the movement of a pair of KI cells, the arrangement of the two cells can be broadly divided into two different types, (i) front-rear and (ii) side-by-side. In the later case, to maintain the pair, the cells need to move with a similar speed. Thus the side-by-side arrangement (Fig. 9 (bottom)) has no contribution in the speed asymmetry. In the front-rear arrangement, however, the speed symmetry is generally broken. During CFL, the front–rear arrangement is observed to be prevalent.14 During the evolution of a cell-pair in a front–rear arrangement, the head of the rear cell is generally adhered to the tail of the front cell. However, intermittently, the head of the rear cell moves along the lateral surface of the front cell. Though the cells are still in contact, the tail–head contact may or may not be disrupted. This we term as the intermittent sliding (Fig. 9 (middle)).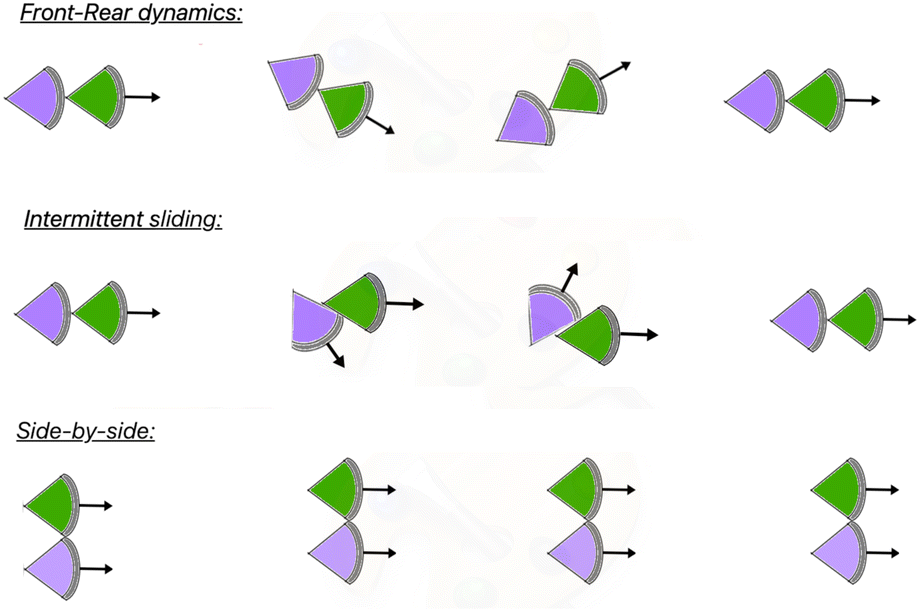 | ||
| Fig. 9 Three types of motions of a cellular pair, i.e. front-rear dynamics, intermittent sliding dynamics and side-by-side motion are schematically shown. | ||
Now we try to understand the mechanism which gives rise to unequal average speeds of cells moving together in a front–rear arrangement. If we follow the trajectory of a typical pair (shown in Fig. 10) we observe that the rear cell trajectory has larger fluctuations compared to the front cell trajectory. Consider the velocities of the front and the rear cell to be vf and vr respectively. We can decompose the velocities in parallel and perpendicular components as (vf‖, vf⊥) and (vr‖, vr⊥) w.r.t. the tangent of the trajectory, ![[t with combining circumflex]](https://www.rsc.org/images/entities/i_char_0074_0302.gif) . Since the motion of the front-cell defines the trajectory direction, the direction of its motion is always along , implying vf⊥ = 0. Thus for the front cell in a pair, at every instance,
. Since the motion of the front-cell defines the trajectory direction, the direction of its motion is always along , implying vf⊥ = 0. Thus for the front cell in a pair, at every instance,
| vf(t) = vf‖(t), | (6) |
| 〈vf〉 = 〈vf‖〉, | (7) |
has to be the same. Thus,| 〈vf‖〉 = 〈vr‖〉. | (8) |
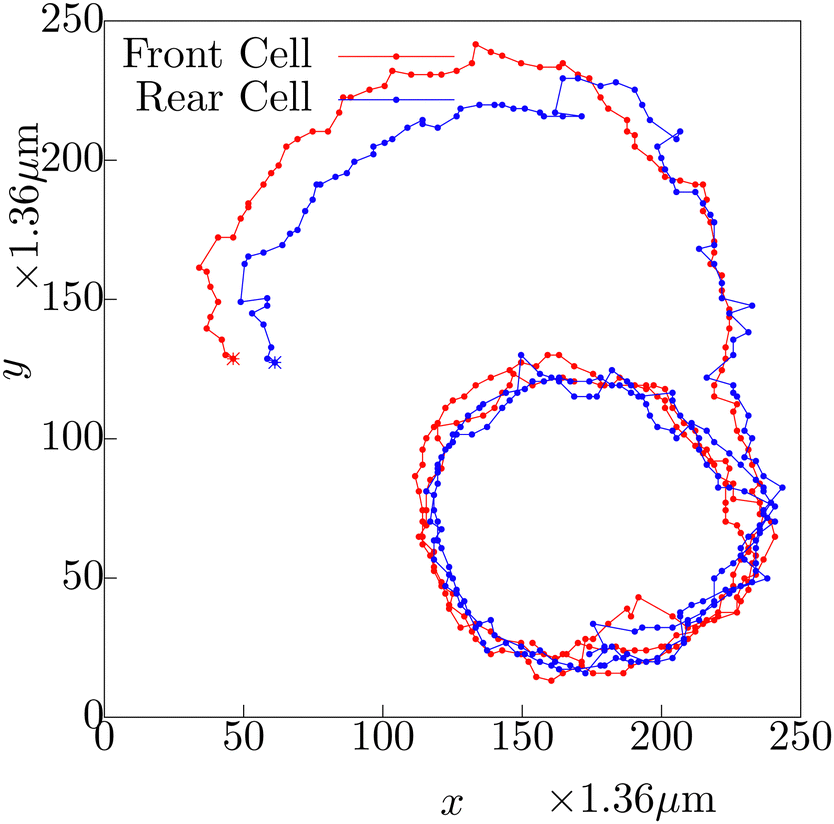 | ||
| Fig. 10 The trajectories of the front cell (red) and the rear cell (blue) during the evolution of a cellular pair, with their starting points marked with asterisk. The trajectory corresponding to the rear cell depicts larger fluctuations. Note that the dots correspond to time points separated by 15 seconds, which is the frame rate of the experimental observation. | ||
However for the rear cell, the perpendicular component is non-zero, which we observe from the intermittent sliding dynamics. Thus for the rear cell, we can write the average speed as,
| 〈vr〉 = 〈[vr‖2 + vr⊥2]1/2〉 | (9) |
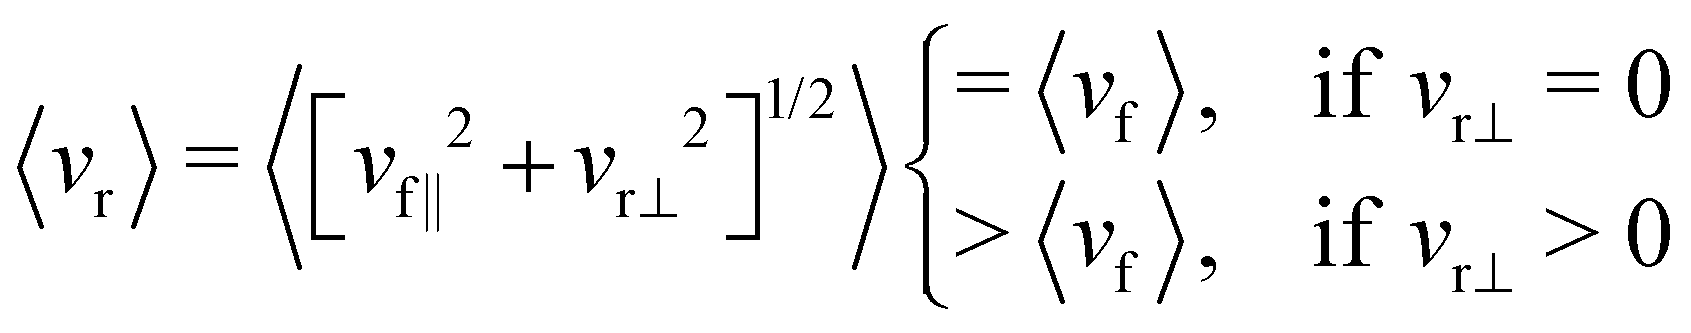 | (10) |
In Fig. 10, we show the typical trajectories of the front cell (red) and the rear (blue) cell during their evolution as a pair. The starting point of the trajectory is marked by the asterisk. Note that, at the initial part of their dynamics as a pair, they were in side-by-side arrangement, and the blue and red lines almost follow each other. After certain time, the blue trajectory falls behind the red, as the cellular pair keeps on moving as a front–rear pair. After the transformation to the front–rear situation, the rear cell (blue) shows larger fluctuations in its trajectory. The same dynamics can be observed in Movie S3, ESI.†
Appendix B: chain elongation
To characterize the direction of the elongated structures and/or chains, we first obtain the eigen direction θeii of cluster i, which corresponds to the largest eigenvalue of the gyration tensor of the cluster. A typical cluster is shown in Fig. 11 (left). The average velocity direction of such a cluster is given by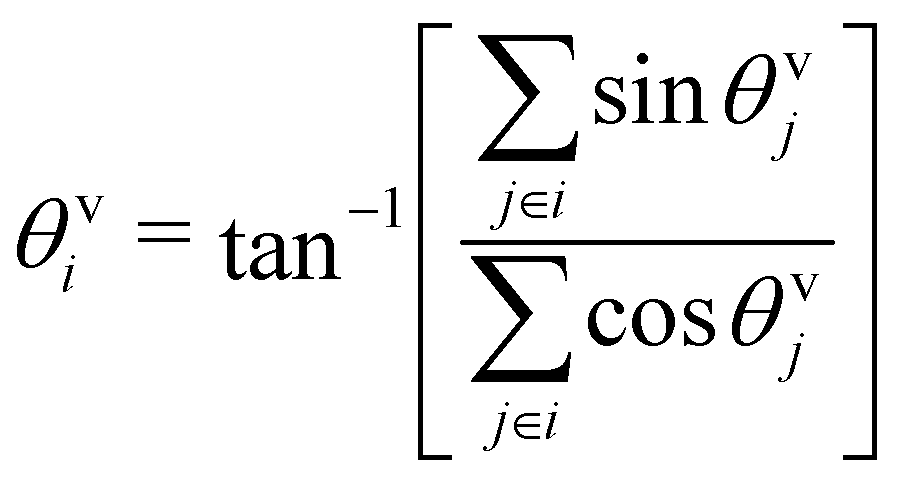 . Thus we define Δθ = 〈|cosδθi|〉i, where δθi = (θeii − θvi). The averaging 〈·〉i is taken over all such clusters i in the same configuration and many (∼5000) such well separated configurations in the steady state. In Fig. 11 (right) we show the phase diagram in the low density (ρ = 0.01) with Δθ color coded. When the cluster is moving along the direction of its elongation, δi is close to zero (or π), correspondingly Δθ is close to unity. On the other hand if the cluster moves perpendicular to its elongation δi is close to ±π/2 making Δθ to be close to zero. Note that, within the chain formation region and beyond in the phase diagram, Δθ becomes greater than 0.7, implying that the angle δi becomes less than π/4, identifying structures elongated along their direction of motion.
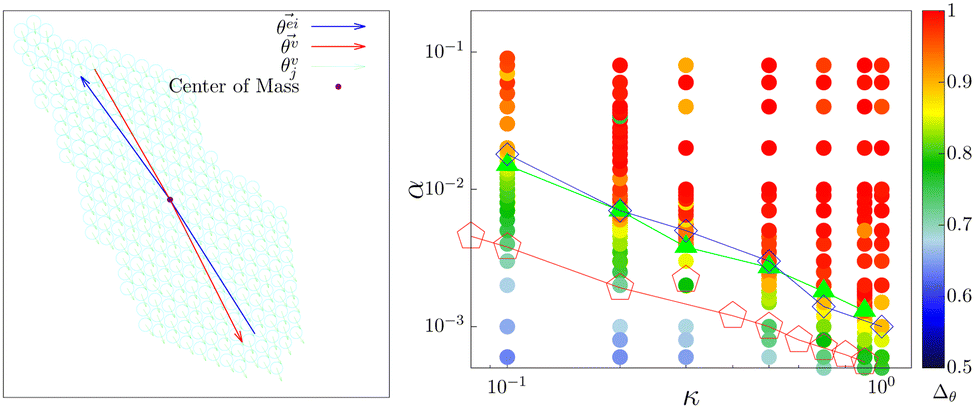 | ||
Fig. 11 (left) A typical cluster is shown. The eigen direction  (blue arrow) corresponding to the largest eigenvalue of the gyration tensor and the velocity direction (blue arrow) corresponding to the largest eigenvalue of the gyration tensor and the velocity direction  (red arrow) of the cluster are depicted. (right) The α–κ phase diagram in the low density ρ = 0.01, with the cosΔθ color coded also shown. (red arrow) of the cluster are depicted. (right) The α–κ phase diagram in the low density ρ = 0.01, with the cosΔθ color coded also shown. | ||
Acknowledgements
We acknowledge T. Ishibashi, R. Nishizawa, G. Ogita, M. Tarama, S. Tarama and V. Semwal for simulating discussions and important insights regarding the project. This was was supported by the core funding at RIKEN Center for Biosystems Dynamics Research, Kakenhi grants 22H05170 (TS) and 19K12770 (MH), and JST CREST Grant JPMJCR1852 (TS).Notes and references
- M. Dicko, P. Saramito, G. B. Blanchard, C. M. Lye, B. Sanson and J. Étienne, PLoS Comput. Biol., 2017, 13, 1–30 CrossRef PubMed.
- A. Grada, M. Otero-Vinas, F. Prieto-Castrillo, Z. Obagi and V. Falanga, J. Invest. Dermatol., 2017, 137, e11–e16 CrossRef CAS PubMed.
- P. Friedl, J. Locker, E. Sahai and J. E. Segall, Nat. Cell Biol., 2012, 14, 777–783 CrossRef PubMed.
- D. Dormann and C. J. Weijer, Curr. Opin. Genet. Dev., 2003, 13, 358–364 CrossRef CAS PubMed.
- A. Haeger, K. Wolf, M. M. Zegers and P. Friedl, Trends Cell Biol., 2015, 25, 556–566 CrossRef PubMed.
- M. Chuai and C. J. Weijer, Curr. Opin. Genet. Dev., 2009, 19, 343–349 CrossRef CAS PubMed.
- E. Theveneau and R. Mayor, Cell. Mol. Life Sci., 2013, 70, 3481–3492 CrossRef CAS PubMed.
- P. Friedl and R. Mayor, Cold Spring Harbor Perspect. Biol., 2017, 9, a029199 CrossRef PubMed.
- E. Scarpa and R. Mayor, J. Cell Biol., 2016, 212, 143–155 CrossRef CAS PubMed.
- K. Sato, T. Hiraiwa, E. Maekawa, A. Isomura, T. Shibata and E. Kuranaga, Nat. Commun., 2015, 6, 10074 CrossRef CAS PubMed.
- K. Sato, T. Hiraiwa and T. Shibata, Phys. Rev. Lett., 2015, 115, 188102 CrossRef PubMed.
- T. Yamamoto, T. Hiraiwa and T. Shibata, Phys. Rev. Res., 2020, 2, 043326 CrossRef CAS.
- B. Stramer and R. Mayor, Nat. Rev. Mol. Cell Biol., 2017, 18, 43–55 CrossRef PubMed.
- M. Hayakawa, T. Hiraiwa, Y. Wada, H. Kuwayama and T. Shibata, eLife, 2020, 9, e53609 CrossRef PubMed.
- T. Hiraiwa, Phys. Rev. Lett., 2020, 125, 268104 CrossRef CAS PubMed.
- T. Hiraiwa, Phys. Rev. E, 2019, 99, 012614 CrossRef CAS PubMed.
- C. Carmona-Fontaine, H. K. Matthews, S. Kuriyama, M. Moreno, G. A. Dunn, M. Parsons, C. D. Stern and R. Mayor, Nature, 2008, 456, 957–961 CrossRef CAS PubMed.
- E. Theveneau, L. Marchant, S. Kuriyama, M. Gull, B. Moepps, M. Parsons and R. Mayor, Dev. Cell, 2010, 19, 39–53 CrossRef CAS PubMed.
- C. J. Weijer, J. Cell Sci., 2009, 122, 3215–3223 CrossRef CAS PubMed.
- T. Fujimori, A. Nakajima, N. Shimada and S. Sawai, Proc. Natl. Acad. Sci. U. S. A., 2019, 116, 4291–4296 CrossRef PubMed.
- D. Li and Y.-l Wang, Proc. Natl. Acad. Sci. U. S. A., 2018, 115, 10678–10683 CrossRef CAS PubMed.
- H. Kuwayama and S. Ishida, Sci. Rep., 2013, 3, 2272 CrossRef PubMed.
- B. A. Camley, Y. Zhang, Y. Zhao, B. Li, E. Ben-Jacob, H. Levine and W.-J. Rappel, Proc. Natl. Acad. Sci. U. S. A., 2014, 111, 14770–14775 CrossRef PubMed.
- B. A. Camley, J. Zimmermann, H. Levine and W.-J. Rappel, Phys. Rev. Lett., 2016, 116, 098101 CrossRef PubMed.
- D. A. Kulawiak, B. A. Camley and W.-J. Rappel, PLoS Comput. Biol., 2016, 12, e1005239 CrossRef PubMed.
- B. Smeets, R. Alert, J. Pešek, I. Pagonabarraga, H. Ramon and R. Vincent, Proc. Natl. Acad. Sci. U. S. A., 2016, 113, 14621–14626 CrossRef CAS PubMed.
- J. Dzubiella, H. Löwen and C. N. Likos, Phys. Rev. Lett., 2003, 91, 248301 CrossRef CAS PubMed.
- E. A. Lisin, O. F. Petrov, E. A. Sametov, O. S. Vaulina, K. B. Statsenko, M. M. Vasiliev, J. Carmona-Reyes and T. W. Hyde, Sci. Rep., 2020, 10, 13653 CrossRef CAS PubMed.
- B. Sabass and U. Seifert, Phys. Rev. Lett., 2010, 105, 218103 CrossRef PubMed.
- I. Sriram and E. M. Furst, Soft Matter, 2012, 8, 3335–3341 RSC.
- F. Jiménez-Ángeles, K. J. Harmon, T. D. Nguyen, P. Fenter and M. Olvera de la Cruz, Phys. Rev. Res., 2020, 2, 043244 CrossRef.
- R. Soto and R. Golestanian, Phys. Rev. Lett., 2014, 112, 068301 CrossRef PubMed.
- J. LaChance, K. Suh, J. Clausen and D. J. Cohen, PLoS Comput. Biol., 2022, 18, 1–28 CrossRef PubMed.
- D. Helbing and P. Molnár, Phys. Rev. E: Stat. Phys., Plasmas, Fluids, Relat. Interdiscip. Top., 1995, 51, 4282–4286 CrossRef CAS PubMed.
- A. V. Ivlev, J. Bartnick, M. Heinen, C.-R. Du, V. Nosenko and H. Löwen, Phys. Rev. X, 2015, 5, 011035 Search PubMed.
- M. Nishikawa, M. Hörning, M. Ueda and T. Shibata, Biophys. J., 2014, 106, 723–734 CrossRef CAS PubMed.
- T. Hiraiwa, A. Nagamatsu, N. Akuzawa, M. Nishikawa and T. Shibata, Phys. Biol., 2014, 11, 056002 CrossRef PubMed.
- Y. Arai, T. Shibata, S. Matsuoka, M. J. Sato, T. Yanagida and M. Ueda, Proc. Natl. Acad. Sci. U. S. A., 2010, 107, 12399–12404 CrossRef CAS PubMed.
- S. Hirose, R. Benabentos, H.-I. Ho, A. Kuspa and G. Shaulsky, Science, 2011, 333, 467–470 CrossRef CAS PubMed.
- S. Hirose, B. Santhanam, M. Katoh-Kurosawa, G. Shaulsky and A. Kuspa, Development, 2015, 142, 3561–3570 CAS.
- J. D. Weeks, D. Chandler and H. C. Andersen, J. Chem. Phys., 1971, 54, 5237–5247 CrossRef CAS.
- C. A. Weber, T. Hanke, J. Deseigne, S. Léonard, O. Dauchot, E. Frey and H. Chaté, Phys. Rev. Lett., 2013, 110, 208001 CrossRef CAS PubMed.
- O. Dauchot and V. Démery, Phys. Rev. Lett., 2019, 122, 068002 CrossRef CAS PubMed.
- The analysis presented here does not specify the nature of the transition and a detailed analysis is underway.
- The animations of chain and band formation are provided for two such phase points in the ESI†.
- M. Nagy, Z. Ákos, D. Biro and T. Vicsek, Nature, 2010, 464, 890–893 CrossRef CAS PubMed.
- M. Yomosa, T. Mizuguchi and Y. Hayakawa, PLoS One, 2013, 8, 1–6 CrossRef PubMed.
- D. Bumann and J. Krause, Behaviour, 1993, 125, 189–198 Search PubMed.
Footnote |
| † Electronic supplementary information (ESI) available: Movie 1: chain formation at low density ρ = 0.01 with (α, κ) = (0.04, 0.014). Movie 2: traveling band formation at high density ρ = 0.2 with (α, κ) = (0.04, 0.014). Movie 3: dynamics of cell-pairs of KI cells at low density. See DOI: https://doi.org/10.1039/d3sm01752d |
| This journal is © The Royal Society of Chemistry 2024 |