
 Open Access Article
 This Open Access Article is licensed under a
 Creative Commons Attribution 3.0 Unported Licence
The role of poroelastic diffusion in the transient wetting behavior of hydrogels†
Amir
Kashani
 and
H. Jeremy
Cho
*
and
H. Jeremy
Cho
*
Department of Mechanical Engineering, University of Nevada, Las Vegas, Las Vegas, NV 89154, USA. E-mail: jeremy.cho@unlv.edu
First published on 1st December 2023
Abstract
Wetting and water absorption of hydrogels is often encountered in many applications. We seek to understand how wetting behavior can be affected by the time-dependent swelling of hydrogels. We measured the advancing contact angles of water droplets on hydrogels of varying thicknesses where thicker gels absorbed water more slowly. We also observed that, above a threshold advancing speed, water droplets would collapse into a lower contact angle state on the surface. We hypothesized that this collapse threshold speed is a result of competition between the poroelastic diffusion of water into the gel and the advance of the spreading droplet, the thickness of the surface, and the diffusion of water into the gel. Taking the ratio of the diffusion and advancing timescales results in a Peclet number with gel thickness as a characteristic length scale. Our results show that above a Peclet number of around 40, droplets will collapse on the surface across all gel thicknesses, confirming our hypothesis. This work provides simple insight to understand a complex time-dependent wetting phenomenon for a widely used hydrogel.
1 Introduction
Hydrogels are hygroscopic porous materials that exhibit a high level of absorbency while maintaining well-defined structures, making these properties fundamental to various applications, such as biomedical applications, drug delivery, wound healing, tissue engineering, biosensors, contact lenses, agriculture, and environmental applications.1,2 In particular, the wetting behavior of hydrogels can have significant implications for adhesion and friction,3,4 which is important to several hydrogel applications. For instance, in contact lenses, tear films must effectively cover and lubricate lenses. The hydrophilicity of contact lenses can influence their interaction with these layers, affecting their stability, comfort, and visual acuity. A very hydrophilic contact lens is more likely to attract water molecules and form a uniform layer of hydration, which can improve their wettability and comfort.5–7 One of the most visible hydrogel applications is contact lenses. A common issue with contact lenses is their propensity to cause dry eye and discomfort8 stemming from the stability of the tear film. Since evaporation is a major contributor to tear film thinning,9 it is conceivable that contact lenses may have locally de-swollen regions where excessive evaporation occurs. Blink kinetics, i.e. the velocity and completeness of blinking, is an important factor to contact lens comfort10,11 and could represent the advancing of the contact line over a hydrogel. The velocity of blinking is largely dictated by the viscosity of the tear film.12 In wound healing, hydrogel dressings with high wettability are desirable as they allow it to closely conform to the wound bed or skin, maintaining a moist environment around the wound to aid the healing process and providing a barrier against infection.13,14 In drug delivery applications, it is desirable to have hydrogels with high wettability as water molecules can penetrate the polymer matrix more easily, leading to more effective drug release.15,16Based on numerous studies, the wettability of hydrogels depends on its swelling state17 where more de-swollen gels tend to be more hydrophobic compared to swollen gels.18 However, there are limited tools to predict, quantify, or model these dependencies. One way to quantify wettability is through the contact angle, which is the angle a droplet makes with the surface at the contact line. The contact angle has a maximum when the droplet is advancing, θadv, and a minimum when the droplet is receding, θrec.19 Typically, wetting behavior is not time-dependent in that advancing and receding contact angles do not change over time. However, in the case of hydrogels that swell with water, during the course of a water droplet being in contact with the surface, water will diffuse into the gel, causing contact angles to decrease over time.20
2 Wetting and diffusion dynamics
This diffusion through hydrogels is a result of water permeating between the polymer strands (molecular “pores”) and the polymer network being elastic and stretchable—a “poroelastic” material. We can derive a poroelastic diffusion coefficient21 through a combination of porous media flow theory and poroelastic theory. Treating the gel as a porous medium through which water can flow in one dimension, we can describe the flow using the well-known Darcy's law where the water flux is driven by a liquid pressure gradient, | (1) |
 | (2) |
![[scr V, script letter V]](https://www.rsc.org/images/entities/char_e149.gif) is its volume. Thus, an increase in pore pressure, P, results in an expansion of the volume (more swollen gel). Recognizing that dε = d/ is the infinitesimal volumetric strain, we can express Darcy's law in terms of a gradient in volumetric strain:
is its volume. Thus, an increase in pore pressure, P, results in an expansion of the volume (more swollen gel). Recognizing that dε = d/ is the infinitesimal volumetric strain, we can express Darcy's law in terms of a gradient in volumetric strain: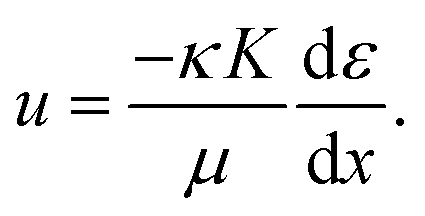 | (3) |
Here, the prefactor κK/μ is the poroelastic diffusion coefficient,
 | (4) |
Measuring Dpe requires obtaining the values of permeability, κ, and stiffness, K, independently. To measure permeability, we previously developed a flow-cell technique to drive water through thin gel samples.22 Using Darcy's law, we are able to calculate the permeability from the measured flow rate and applied hydraulic pressure. We used polyacrylamide (PAAm) hydrogels with methylenebisacrylamide (MBA) as a crosslinker (further details in ESI†). For 1-%-crosslinking (mol crosslinker/mol monomer) used in this study, we measured a permeability (5.2 ± 0.5) × 10−18 m2. Polyacrylamide gels were chosen as they are easily made and are extremely ubiquitous from contact lenses23 to enhanced oil recovery.24 To measure stiffness (bulk modulus), we performed compression testing of hydrogel samples using a spherical indentation tester.25 Using Hertzian theory, we can determine Young's modulus from applied displacement and measured compressile load. Assuming that Poisson's ratio is 1/3 as is typical for hydrogels,25–28 the bulk modulus is equal to the Young's modulus, K = E. For 1-%-crosslinking (mol crosslinker/mol monomer), we measured a bulk modulus of (15.1 ± 1.6) kPa. Since the viscosity of water is known, we can calculate the poroelastic diffusion coefficient to be (8.4 ± 1.2) × 10−11 m2s−1. Previously, we investigated the changes in permeability and stiffness with crosslinking and found that any changes in permeability are nearly inverse with any changes in stiffness.22 Thus, across different crossslinker ratios, the poroelastic diffusion coefficient remains relatively constant, as shown in Fig. S1 (ESI†).
As mentioned earlier, water can diffuse into a gel and affect its wetting properties over time.20 Since we can quantify the poroelastic diffusion coefficient, we can also quantify the characteristic diffusion time, tdiff of water diffusing into the gel as
 | (5) |
 | ||
| Fig. 1 As a droplet advances with a speed of V, water diffuses into the permeable gel substrate with a thickness L. | ||
To verify this time scale, we conducted a simple experiment where we placed a water droplet on a ∼80 μm-thick sample and observed swelling of the gel. For this thickness, the characteristic diffusion time scale is approximately 90 s. As shown in Fig. 2, the diffused water swells the gel underneath the droplet and forms a “foot” in a time scale that is within the same order of magnitude of the tdiff. We further verified this time scale through a series of finite-element-method (FEM) simulations. We applied Fick's second law and linear elastic theory (using our previous methodology29) where the diffusion coefficient is Dpe. We simulated gels of various thicknesses and performed transient simulation of swelling in response to a wet boundary condition on the top of the gel. Remarkably, the time to 90% swelling at the bottom of the gel after exposure at the top coincided with the diffusion time scale, L2/Dpe, to within 6% (Fig. S2, ESI†).
 | ||
| Fig. 2 A hydrogel substrate swells after being in contact with a water droplet, forming a foot. Here, we show (a) the droplet one second after contact, (b) the start of foot creation as water is diffused into the gel after 29 s, and (c) a more visible foot after 198 s. Note that in panels b and c, the droplet has been intentionally recessed to show foot creation. | ||
To probe the wetting behavior, we sought to measure the advancing contact angle of the gel surface. This involves growing a droplet of DI water on the gel using a dispensing needle where the pressure of the liquid was controlled by a microfluidic pressure regulator (Elveflow OB-1). However, due to the simultaneous diffusion occurring, we would expect different values of contact angle depending on advancing speed. Indeed, when very high advancing speeds were applied, we observed that a droplet would collapse, as shown in Fig. 3. This collapse event is a sudden change in the shape of the droplet with a jump in droplet base radius and an immediate lowering of the apparent contact angle. We only observed this collapse when fast advancing speeds were applied.
 | ||
| Fig. 3 (a) Advancing of a droplet on top of a 0.5 mm-thick (Lwet) gel substrate before the collapse. (b) At some point, due to the high advancing speed, a sudden decrease in the contact angle occurs, which is referred to as the collapse of the droplet (Video S1, ESI†). | ||
To understand the reason for this collapse, we calculated a range of possible spherical droplet geometries on top of a foot-shaped surface modeled using a sinusoidal S-curve where the droplet conserves a fixed advancing contact angle over the surface (Fig. 4). As the droplet contact line advances over the lip of the periphery edge of the foot, the apparent contact angle increases as a result of the surface sloping downward. We noticed that there is a local maximum in droplet volume at this foot periphery edge. At this critical point, there would be no way to add an infinitesimal amount of volume and expect an infinitesimal increase in droplet base radius since the volume decreases since the slope of volume versus base radius is negative immediately after the maximum point. Thus, the only possible way to continue to add volume is for the base radius to jump to a much higher value (arrow in Fig. 4), hence the collapse phenomenon. In agreement with our experiments, the apparent contact angle decreases immediately after collapse as there is no downward-sloping foot periphery edge to increase it over the intrinsic advancing contact angle. We have performed this analysis for several contact angles and found similar results (Fig. S3, ESI†). In addition, we have included an animation sequence of the simulated collapse phenomenon (Video S2, ESI†). We also confirmed that this collapse behavior is unique to swelling gel substrates as we did not observe any collapse on an impermeable surface using our experimental setup (Fig. S4, ESI†). In addition, no evidence of any liquid film formation either at the top or bottom was observed.
 | ||
| Fig. 4 Simulated droplet geometry over a modeled foot shows that collapse over the periphery edge of the foot must occur in order to preserve the volume. An animation of this simulated collapse event is presented in Video S2 (ESI†). Arbitrary units are used for length. | ||
Thus, in order to prevent collapse, the foot should grow radially outward with the advancing droplet. For foot growth to happen, diffusion into the gel must be sufficiently fast to keep pace with the speed of advance. We suspected that the collapse occurs when the time scale of droplet advance becomes shorter than the time scale of diffusion, tadv < tdiff. From simple dimensional analysis, we can define an advancing time scale as
 | (6) |
 | (7) |
When Pe is high, the rate of advance is faster than the rate of diffusion and we would expect droplet collapse to occur. Thus, we hypothesized that above a critical Peclet number, droplet collapse occurs whereas below the critical value, droplets advance stably. We illustrate the hypothesized behavior in Fig. 5 where from a droplet over a formed foot (panels a–c), either the droplet collapses if the advancing speed is too high (d) or the foot grows with the advance, preventing collapse.
 | ||
| Fig. 5 Experimental test procedure and hypothesized results of droplets on a hydrogel substrate. All experiments would start by (a) placing a droplet over the surface. After a period of time approximately equal to the characteristic diffusion time, (b) a foot would form underneath the droplet. As the experiment proceeds, (c) the droplet is allowed to advance over the foot periphery edge, increasing the apparent contact angle due to the downward slope of the foot edge. After this point, either of two things can happen. If diffusion is slow (thick gel; high Pe) compared to the advancing speed, then (d) the droplet should collapse. Alternatively, if diffusion is able to keep pace with advance (thin gel; low Pe), then (e) the droplet should stably advance as the foot grows with the droplet. | ||
3 Study of droplet collapse versus stable advance
To test this hypothesis, we performed experiments varying wet-state gel thickness, Lwet, and advancing speed, V. Since the hydrogel type was not varied, Dpe is approximately a constant (only varying slightly by swelling state). We created gels of thicknesses of 0.25, 0.50, and 0.79 mm in their wet state (equilibrated in DI water) and allowed them to dry in the ambient lab environment, thereby decreasing Lwet to Ldry. From our previous study of these hydrogels,25 we found that the water content within hydrogels is invariant within 1% compared to the swollen state when subjected to typical laboratory humidity changes in the range of 15% to 30% due to its strong type-II or III isotherm behavior. We applied advancing speeds of 0.05, 0.15, 0.25, 0.35, 0.45, 0.55, 0.65, and 0.8 mm min−1. Repeating each combination of thickness and speed at least three times, we performed 75 trials. To initialize each experiment consistently, we formed a droplet and allowed swelling to form a foot (Fig. 2, Fig. 5a and b) by leaving a droplet of fixed base diameter of 4.78 mm for 2 to 3 min depending on sample thickness (thicker samples required longer time for foot development). The base diameter of the droplet was controlled via real-time image capture, image processing, and microfluidic control to effect different droplet advancing speeds. This wetted control ensured that any placed droplets did not fully absorb into the gel—however, the timescale of full droplet absorption would be extremely long compared to our experimental timescales. The accuracy of our control was such that the differences in set point diameter and measured diameter were within 0.02 mm. In addition, contact angles were measured in real time using image processing (Fig. 6 and 7). Maintaining the droplet in a stable base diameter would be the start of foot creation (Fig. 2b). | ||
| Fig. 6 An example of the measured base diameter and contact angle over time for a stable, non-collapsing advancing contact angle. The thickness was 0.5 mm (wet) and the advancing speed was 0.15 mm min−1. The green region shows the sample data from which the average contact angle was calculated. | ||
 | ||
| Fig. 7 An example of the measured base diameter and contact angle over time for the droplet where collapse occurred (Video S1, ESI†). The thickness was 0.5 mm and the advancing speed was 0.35 mm min−1. | ||
Once a foot was developed (Fig. 5a and b), we proceeded to advance the droplet contact line at prescribed speeds to double the droplet base diameter. In all trials, either one of two events occurred: (1) the droplet advanced to twice the initial base diameter with no collapse and a stable advancing contact angle (Fig. 6) or (2) the droplet collapsed at some point in time during the advance (Fig. 7). In the cases where droplets advanced stably, apparent advancing contact angles were measured as functions of thickness and speed as shown in Fig. S5 (ESI†) with full data in Table S1 (ESI†). The thinnest samples had slightly lower contact angles, which may be due to faster swelling causing the droplet to appear more hydrophilic. There was also a trend of contact angle slightly decreasing at higher advancing speeds, which may signify proximity to a collapsed state; however, this trend is not very significant given the uncertainty in measurements. In the cases where droplets collapsed, we observed a sharp decrease in contact angle and the trial was terminated (Fig. 7).
To obtain useful statistics to determine the threshold advancing speed for collapse, we repeated trials at each combination of thickness and speed at least three times. The outcomes, expressed as a ratio of collapse events over number of trials, are shown in Fig. 8. This ratio represents a probability of collapse. From these probabilities we created a heat map to visualize the distribution of probabilities as a function of thickness and speed. We noticed that there is a boundary between the no-collapse region in the bottom-left and the collapse region in the top-right. This boundary resembles an inverse relationship between advancing speed and thickness. This inverse relationship can be derived from the Peclet number, Pe = LV/Dpe. If we set Peclet number to a fixed threshold value as we hypothesized and solve for V, we obtain V = PeDpe/L, which is an inverse function with L. For experimental convenience, we use the wet-state thickness L = Lwet since these thicknesses are more easily measured at the reference wet state. Since Dpe is known for our samples, we fit a value of Pe such that the function V = PeDpe/Lwet overlapped with the boundary between collapse and no-collapse regions. We found this threshold value of Peclet number to be around 40. Thus, we confirm that above a certain Peclet number, collapse of the droplet occurs.
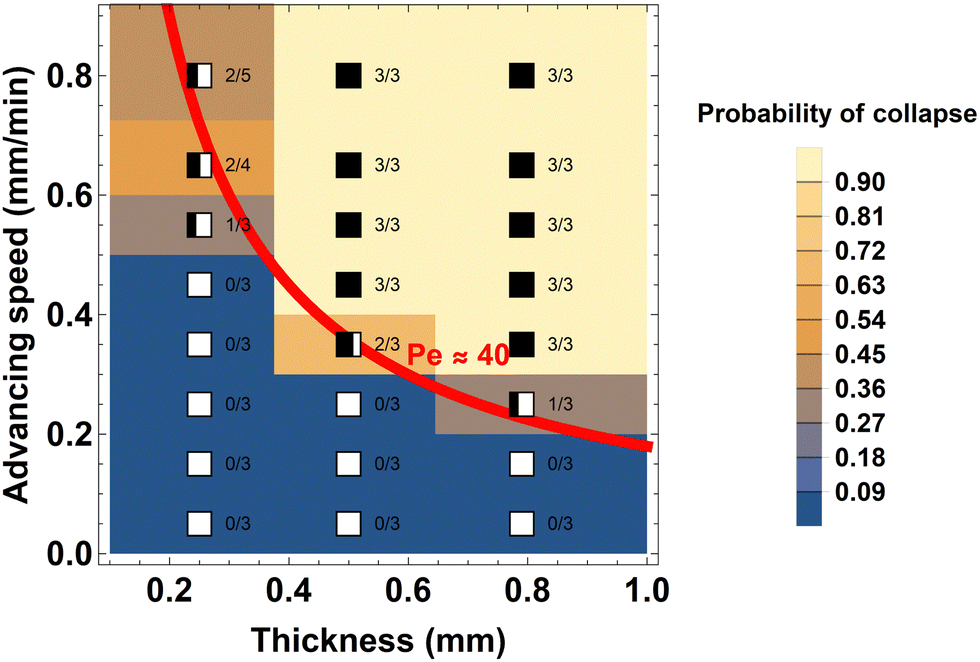 | ||
| Fig. 8 The distribution of probabilities of droplet collapse at various sample thicknesses and advancing speeds shows that a boundary exists between no-collapse (bottom left) and collapse (top right) regions. The first number in each grid cell indicates the number of times collapse occurred and the second number indicates the total number of spots examined on each sample. The color displayed in each rectangle corresponds to the probability value, providing a heat map. The boundary between collapse and no-collapse corresponds to a Peclet of approximately 40. | ||
To gain a more physical understanding of why the competition of diffusion versus advection, as quantified by the Peclet number, dictates collapse versus stable-advance behavior, we performed FEM simulations that resemble our experiments. Here, a dry gel of thickness Ldry = 80 μm was the simulation domain with a wet boundary condition, resembling a droplet, being applied. The droplet base radius was initially set to 0.5 mm for a period of tdiff = Ldry2/Dpe = 79 s to form the foot in accordance with experimental procedures (Fig. 5a and b). A foot does indeed form as shown in Fig. 9a. Interestingly, the foot periphery edge extends outward beyond the contact line due to the fact that diffusion is occurring simultaneously in the downward (negative y) and outward, radial (positive x) directions as indicated by the water flux arrows. After initial foot formation, the boundary condition was expanded at either a rate of 2 mm min−1, 0.2 mm min−1, or 0 mm min−1, corresponding to Peclet numbers of 63, 6, and 0. At a high Peclet number of 63, the rate of advance is high such that diffusion toward the bottom of the gel does not complete, leading to a thin section of swelling (Fig. 9b, blue region) over a large, dry region (red region). Since much of the region underneath the newly wetted top surface remains dry, only a small change in foot geometry results. As our simulations of droplet geometry over a foot show (Fig. 4), collapse would occur over a foot that does not expand with the advance. Thus, the high-Peclet situation in Fig. 9b would likely result in collapse, as our experimental results would suggest. Conversely, in the low Peclet number of 6 case, diffusion is able to keep pace with advance, leading to a more uniform concentration distribution as shown in Fig. 9c. As a result, the gel is much more swollen under the newly wetted region and the foot periphery edge remains ahead of the contact line, leading to a likely stable advance of the droplet, in agreement with our experiments. Finally, as a control where Pe = 0, we observe that diffusion is very slow as the concentration distribution in Fig. 9d is nearly identical to Fig. 9a—though given infinite time, the gel would fully swell with water everywhere assuming evaporation is minimized. This means that the radial spread of water is driven by the moving wetted boundary condition (advancing droplet) and its corresponding diffusion at the downward and outward directions over a length scale of the gel thickness. In the simulation, we did not consider effects of capillary pressure from droplet curvature and gravity affecting transport because these can be shown to be three to five orders of magnitude smaller than the osmotic driving forces that cause water to diffuse into the gel (see ESI,† Section 3). Thus, the rich physical picture that the FEM simulations provide is completely consistent with what we observed in our experiments regarding collapse versus stable advance.
 | ||
| Fig. 9 Finite-element-method results of a gel swelling in response to an advancing droplet above it indicate that the speed of droplet advance in relation to the speed of diffusion within the gel dictates whether the foot will grow with the advance. After (a) performing the foot with a steady droplet, (b) a fast advance will result in little change in foot geometry as water has not sufficiently diffused toward the bottom of the gel leading to concentration heterogeneity indicated by the large, red, dry region underneath the thin, blue, swollen region above it. However, if (c) the droplet advances slower, diffusion is able to reach the bottom of the gel, leading to more uniform water concentrations. Radial spread of water is driven by the advance of the wetted top boundary condition since (d) a non-advancing droplet leads to extremely slow spread of water in the radial (x) direction. | ||
4 Conclusions
Our work demonstrates that the wettability of hydrogels is influenced by a variety of factors, such as gel surface thickness, swelling conditions, rate of diffusion and advancing speed. We show that the occurrence of droplets collapsing at high advancing speeds is a result of a competition between the diffusion of water into the gel surface and the speed of droplet spreading on the surface. We quantified this competition using a Peclet number, which describes the rate of advance over the rate of diffusion. We determined a threshold Peclet number of 40 for polyacrylamide hydrogels; future studies could explore whether similar Peclet numbers result for other swellable materials. This work provides added clarity on a unique wetting phenomenon associated with swellable materials. The insights from this work can inform applications where particular wetting characteristics must be preserved such as for contact lens lubrication, wound healing, and drug delivery.5 Methods and materials
5.1 Hydrogel preparation
The chemicals used in the preparation of the hydrogels are listed below:• Acrylamide (AAm)
• N,N′-Methylenebis(acrylamide) (MBA)
• Ammonium persulfate (APS)
• N,N,N′,N′-Teramethylethane-1,2-diamine (TEMED)
All chemicals used in this paper were purchased from Sigma-Aldrich Co.
All hydrogels were prepared in a similar fashion to our previous work.22,25 We start from aqueous stock solutions of the following chemicals: N,N′-methylene(bis)acrylamide (MBA), ammonium persulfate (APS), and tetramethylethylenediamine (TEMED) at concentrations of 0.1084 g/10.0 mL, 0.0800 g/10.0 mL and 0.250 mL/10.0 mL, respectively. The base acrylamide (AAm) monomer was used in its pure powder form. By mixing specific amounts of these chemicals and DI water, polymers were spontaneously synthesized. During this process, APS served as an initiator, TEMED as an accelerator, and MBA as a crosslinker. Hydrogel stiffness could be varied from 7 to 31 kPa using different crosslinking amounts ranging from 0.5% to 5% (mol MBA per mol AAm). However, according to our previous study,22 we found that the resulting poroelastic diffusion coefficient is largely invariant with crosslinking. Hence, we chose a “middle-of-the-road” crosslinker amount of 2% since it is the center of the previous testing range and would represent where we understand the hydrogel behavior best.
In all hydrogel samples, we started with 0.500 g of AAm monomer, 0.025 mL of TEMED solution, 1.00 mL of APS solution, and 1.00 mL of MBA solution to achieve the target crosslinker ratio (mol crosslinker/mol monomer) of 1.00%. The mixed solutions were poured into molds with 0.79 mm, 0.50 mm, and 0.25 mm thicknesses by using smooth slide glass for the top and bottom surfaces of the mold and subsequently polymerized for 24 hours. Then, the samples were immersed in DI water for one week to remove unreacted chemicals and equilibrate them to the wet state. Finally, samples were kept in the lab ambient air for 24 hours to dry completely. The lab ambient air was at a relative humidity of around 15% to 30% and a temperature of 23 °C. Mirror-like specular reflections were visible on the surface as shown in Fig. S6 (ESI†), indicating that roughness effects were minimal.
5.2 Droplet control and contact angle measurement
Droplets were controlled via a combination of image processing to extract the base diameter (Mathematica) and proportional-integral-derivative (PID) control, of a microfluidic regulator (Elveflow), implemented in LabView. The desired base radius was the PID setpoint and was varied with time depending on the experiment. Contact angles were measured in Mathematica by finding points on the liquid–vapor interface and finding the line tangent to it and intersecting the contact line. This tangent line was then compared to the surface line (line between the two visible contact lien points) to obtain an apparent contact angle. When a foot was visible, care was taken to choose surface line points that were at the foot-droplet interface. Droplet volumes where base radii are on the order of single millimeters were chosen since these are typical for contact angle experiments. At these millimeter length scales, the Bond number is around 0.1–1, ensuring that surface tension phenomena will be visible.5.3 Finite-element-method simulations
FEM simulations were performed using Wolfram Mathematica. The full, 3D, transient Fick's second law was solved with the poroelastic diffusion coefficient: | (8) |
Author contributions
A. K. performed data curation, and investigation. H. J. C. performed conceptualization, software, simulation, supervision, and project administration. Both A. K. and H. J. C. performed formal analysis, methodology, validation, visualization, and writing.Conflicts of interest
There are no conflicts to declare.Acknowledgements
We acknowledge Negin Garakani, Mario Mata, Brandon Ortiz, and Yiwei Gao for their assistance in developing the experimental setup, methods, and materials. We acknowledge funding from the Koshee Foundation, UNLV Faculty Opportunity Award, UNLV Technology Commercialization Award, the ACS Petroleum Research Fund Doctoral New Investigator Grant (66043-DNI5), and the NSF CAREER Award (2239416).References
- S. B. Majee, Emerging Concepts in Analysis and Applications of Hydrogels, IntechOpen, Rijeka, 2016 Search PubMed.
- N. A. Peppas and A. S. Hoffman, Biomaterials science, Elsevier, 2020, pp. 153–166 Search PubMed.
- J. P. Gong, T. Kurokawa, T. Narita, G. Kagata, Y. Osada, G. Nishimura and M. Kinjo, J. Am. Chem. Soc., 2001, 123, 5582–5583 CrossRef CAS PubMed.
- G. Kagata, J. P. Gong and Y. Osada, J. Phys. Chem. B, 2002, 106, 4596–4601 CrossRef CAS.
- P. Eftimov, N. Yokoi, N. Peev and G. A. Georgiev, Int. J. Mol. Sci., 2019, 20, 1313 CrossRef CAS PubMed.
- M. L. Read, P. B. Morgan and C. Maldonado-Codina, J. Biomed. Mater. Res., Part B, 2009, 91, 662–668 CrossRef PubMed.
- L. Cheng, S. J. Muller and C. J. Radke, Curr. Eye Res., 2004, 28, 93–108 CrossRef PubMed.
- J. P. Craig, M. D. P. Willcox, P. Argüeso, C. Maissa, U. Stahl, A. Tomlinson, J. Wang, N. Yokoi and F. Stapleton, Invest. Ophthalmol. Visual Sci., 2013, 54, TFOS123–TFOS156 CrossRef PubMed.
- C.-C. Peng, C. Cerretani, R. J. Braun and C. Radke, Adv. Colloid Interface Sci., 2014, 206, 250–264 CrossRef CAS PubMed.
- R. Braun, P. King-Smith, C. Begley, L. Li and N. Gewecke, Prog. Retinal Eye Res., 2015, 45, 132–164 CrossRef CAS PubMed.
- M. Guillon, P. Theodoratos, K. Patel, R. Gupta and T. Patel, Contact Lens Anterior Eye, 2019, 42, 246–252 CrossRef PubMed.
- A. Recchioni, E. Mocciardini, E. Ponzini and S. Tavazzi, Exp. Eye Res., 2022, 219, 109083 CrossRef CAS PubMed.
- Y. Liang, J. He and B. Guo, ACS Nano, 2021, 15, 12687–12722 CrossRef CAS PubMed.
- S. Aswathy, U. Narendrakumar and I. Manjubala, Heliyon, 2020, 6, e03719 CrossRef CAS PubMed.
- A. Vashist, A. Vashist, Y. Gupta and S. Ahmad, J. Mater. Chem. B, 2014, 2, 147–166 RSC.
- T. R. Hoare and D. S. Kohane, Polymer, 2008, 49, 1993–2007 CrossRef CAS.
- E. Seo, S. Kumar, J. Lee, J. Jang, J. H. Park, M. C. Chang, I. Kwon, J.-S. Lee and Y.-I. Huh, Macromol. Res., 2017, 25, 704–711 CrossRef CAS.
- A. Sidorenko, T. Krupenkin and J. Aizenberg, J. Mater. Chem., 2008, 18, 3841–3846 RSC.
- K.-Y. Law, H. Zhao, K.-Y. Law and H. Zhao, Surface Wetting: Characterization, Contact Angle, and Fundamentals, 2016, pp. 7–34 Search PubMed.
- T. Kajiya, A. Daerr, T. Narita, L. Royon, F. Lequeux and L. Limat, Soft Matter, 2011, 7, 11425–11432 RSC.
- J.-F. Louf and S. S. Datta, Soft Matter, 2021, 17, 3840–3847 RSC.
- Y. Gao and H. J. Cho, Soft Matter, 2022, 18, 7735–7740 RSC.
- P. H. Benz and A. Reboul, (Meth) acrylamide polymers for contact lens and intraocular lens, US Pat., 10371864, 2019 Search PubMed.
- X. Li, Z. Xu, H. Yin, Y. Feng and H. Quan, Energy Fuels, 2017, 31, 2479–2487 CrossRef CAS.
- Y. Gao, N. K. Chai, N. Garakani, S. S. Datta and H. J. Cho, Soft Matter, 2021, 17, 9893–9900 RSC.
- H. M. Wyss, T. Franke, E. Mele and D. A. Weitz, Soft Matter, 2010, 6, 4550–4555 RSC.
- E. Geissler and A. Hecht, Macromolecules, 1981, 14, 185–188 CrossRef CAS.
- D. Andrei, B. Briscoe, P. Luckham and D. Williams, Modern Aspects of Colloidal Dispersions, 1998 Search PubMed.
- H. J. Cho, N. B. Lu, M. P. Howard, R. A. Adams and S. S. Datta, Soft Matter, 2019, 15, 4689–4702 RSC.
Footnote |
| † Electronic supplementary information (ESI) available: Supplementary information, table, and video. See DOI: https://doi.org/10.1039/d3sm01472j |
| This journal is © The Royal Society of Chemistry 2024 |