 Open Access Article
Monte Carlo simulation of the ionization and uptake behavior of cationic oligomers into pH-responsive polyelectrolyte microgels of opposite charge – a model for oligopeptide uptake and release†
Christian
Strauch
 and
Stefanie
Schneider
 *
*
Institute of Physical Chemistry, RWTH Aachen University, Landoltweg 2, 52056 Aachen, Germany. E-mail: schneider@pc.rwth-aachen.de
First published on 11th January 2024
Abstract
External stimuli can tune the uptake and release of guest molecules in microgels. Especially their pH responsiveness makes microgels exciting candidates for drug delivery systems. When both microgel and guest molecules are pH-responsive, predicting the electrostatically driven uptake can be complex since the ionization depends on many parameters. In this work, we performed Metropolis Monte Carlo simulations while systematically varying the pK of the monomers, the concentrations of microgel and guest molecules to obtain a better understanding of the uptake of weak cationic oligomers as a model for oligopeptides into a weak anionic polyelectrolyte microgel. Further, we varied the chain length of the oligomers. The polyelectrolyte networks can take up oligomers when both the network and the oligomers are charged. The presence of both species in the system leads to a mutual enhancement of their ionization. The uptake induces a release of counterions and results in complex formation between the oligomers and the network, leading to the collapse of the networks. Longer oligomers enhance the ionization of the network and, therefore, the complexation. A higher microgel concentration increases the uptake only around the isoelectric point but prevents the uptake due to lower entropy gain at counterion release at higher pH. The results give an insight into the uptake of cationic oligomers into oppositely charged polyelectrolyte microgels and provide hints for the design of anionic microgels as carriers for guest molecules e.g. antimicrobial peptides.
1 Introduction
Microgels, three dimensionally crosslinked polymers swollen by a solvent and in colloidal size range, can change their volume drastically by external stimuli like temperature,1,2 pH3,4 or salt concentration.5,6 This swelling behavior makes them suitable candidates in catalysis7 or water purification8 and as biosensors9,10 or drug delivery systems.11–14 For example, pH-responsive anionic microgels could carry guest molecules like cationic antimicrobial peptides in a protected environment, preventing toxic effects. Some of these peptides can effectively combat antibiotic-resistant bacteria.In general, electrostatic and hydrophobic attraction can promote the uptake.15 While in temperature-sensitive systems, the swelling/deswelling is caused by a change in hydrophobic interactions, in pH-sensitive systems, electrostatic interactions play the dominant role.16 With changing the pH, the charge state of acidic or basic monomer units changes, leading to a change in the electrostatic interactions within the microgel.17 Repulsive electrostatic interactions between monomer units with charges of equal sign, together with entropic effects of confined counterions, force a swelling of a network18,19 whereas attractive interactions between oppositely charged monomers cause a collapse of the microgels.20,21
Changing the electrostatic interactions within microgel can also be used for the uptake and release of guest molecules like peptides,22 nanoparticles, and surfactants.23–26 Many parameters influence the electrostatic interactions. To effectively transport drugs, the microgel and guest molecules must have strong electrostatic attractive interactions across various conditions yet be weak at the targeted release location.
With increasing charge density of microgel or guest molecules, more guest molecules are taken up.27,28 The uptake of guest molecules can even lead to an overcompensation of the network charge, leading to a microgel–guest complex with a net charge opposite to the charge of the polymer network.29,30 Adding salt influences the uptake behavior when electrostatic interactions are the dominant factor.27,31 Salt is screening the electrostatic interactions between opposite charges of microgel and guest molecules, and the uptake is weaker.32,33 The high salt concentration in the human body has to be taken into account when it comes to using these systems for drug delivery.
It has been shown that microgels deswell when they take up guest molecules.34 The deswelling is caused both by an increased attractive electrostatic interaction in the presence of multivalent guest molecules35 and by a decrease of osmotic pressure inside the microgel caused by the entropically driven release of counterions from the microgel.36,37 Furthermore, guest molecules with multivalent charges can act as additional crosslinkers between two chains.
The distribution of guest molecules in the microgels is an essential parameter for their release kinetics. Guest molecules located in the periphery can be released faster from the microgel than molecules located in the core. Gelissen et al. showed that the poly(styrene sulfonate) distribution in a polyampholyte core–shell microgel depends on the chain length of the polyelectrolyte.38 They observed smaller penetration depths in the microgels for longer polyelectrolyte chains, resulting in different internal structures of microgel–polyelectrolyte complexes. Further, they assumed that these different internal structures were the reason for different release efficiencies.
The ionization behavior of monomer units in the microgel and the guest molecules is mutually influenced in systems in which both have titratable units.39 The ionization and uptake of the guest molecules depend on the pH, the pK-values of the titratable units, and the salt concentration. In closed systems, the microgel and guest molecule concentration is also crucial.
Experimentally, the uptake of different polyelectrolytes,40 different proteins,41–43 and antimicrobial peptides44 in polyelectrolyte microgels were investigated. In these works, the influence of pH, hydrophobicity, and ionic strength were the varied parameters. Using micromanipulator-assisted light microscopy and theoretical models, Hansson et al.45 investigated the microgel deswelling caused by the uptake of oligomer peptides by variation of the oligomer length and charge density.
An independent investigation of all parameters would be very complex in experiments. In this work, we performed Metropolis Monte Carlo simulations using the constant-pH method to investigate the uptake behavior of weak basic oligomers in a weak acidic polyelectrolyte network. We systematically varied the pK values, oligomer length, microgel, and oligomer concentration under salt-free and good solvent conditions to investigate their influence on the ionization, uptake, and swelling behavior of polyelectrolyte microgels.
2 Model and simulations
2.1 Model
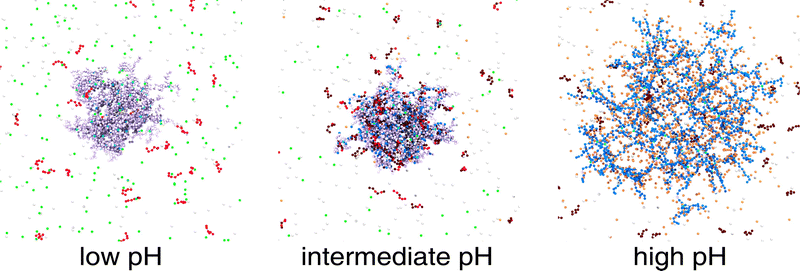
The Monte Carlo simulations were performed using MOLSIM (v.6.4.7)46 with extensions by the authors and carried out on a graphics card. Our model is based on previous work,47,48 in which the microgels were modeled using a bead-spring model for the polymer. The model was extended to adding single chains representing oligomers. For the generation of the network, the crosslinkers were placed on the lattice points of a cropped cubic-diamond lattice. The networks contained Ncl = 71 crosslinks and 184 chains with strand length Nstrand = 10 leading to Nacid = 1840 titratable anionic beads. For a systematic investigation, we used a reference network oligomer system with pK = 7.0 for both titratable units, Nseg = 6 for the chain length of the 368 oligomers leading to Nbase = 2208 cationic beads in total and a cubic simulation box with a length of 750σ (cacid = 0.96 mM) containing no salt. To illustrate the model, the central part of the simulation cell is shown in Fig. 1. In the following, we will briefly describe the method and potentials.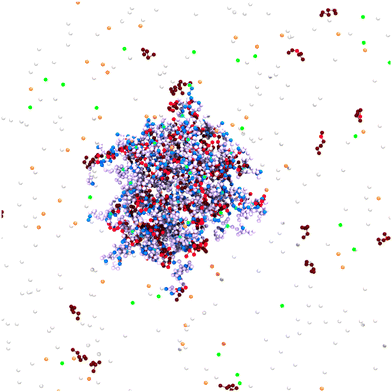 | ||
| Fig. 1 Snapshot of a simulation cell. Network and oligomers were modeled as bead-spring polymers. Counterions were considered as explicit beads. Charged network beads are depicted in blue, and their counterions in orange, while uncharged network beads are in a light purple. Crosslinks are cyan. Charged monomers of the oligomers are shown in red, and their counterions in green, while uncharged oligomer beads are brown. White particles have no charges. The snapshot was generated with VMD.50 | ||
We used the constant-pH method to model the pH-dependent behavior of the network. Titratable beads were able to change their charge during the simulation depending on the pH and their pKi0 value. The pH was treated implicitly by an additional energy term ΔUass for the change in the free energy of the association reaction as shown in eqn (1).49
ΔUass = ±χkBT![[thin space (1/6-em)]](https://www.rsc.org/images/entities/i_char_2009.gif) ln(10)(pH − pKi0) ln(10)(pH − pKi0) | (1) |
The plus sign is for the protonation of titratable beads, while the minus sign is for deprotonation. Otherwise, ΔUass is zero. When a bead is an acidic unit, χ = +1, and χ = −1 for a basic unit. All beads were assigned to a corresponding counterion of opposite charge, changing their charge state together with the network bead to guarantee the electroneutrality of the system. As the pH was modeled implicitly, these counterions should not be considered as protons but monovalent counterions such as Na+ or Cl−. Since no further salt was added, the ionic strength was determined by the concentration of counterions and does not necessarily match with the ionic strength in real experiments especially at low and high pH. However, for the used concentrations and pH values (except the concentration of cacid = 0.11 mM), the concentration of counterions is much higher than the concentration of ions that would minimally be introduced by adjusting the pH.
The probability of acceptance of a Monte Carlo move was defined by the Metropolis acceptance criterion in eqn (2), where the total energy difference ΔUtot of the system is the sum of ΔUass and the energy difference of the potential energy ΔUpot.
| pacc = min(1,exp(−ΔUtot/(kBT))) | (2) |
 | (3) |
 | (4) |
 and kB is the Boltzmann constant. The simulations were performed at a temperature of T = 298 K and with a Bjerrum length of lb = 3.58σ (with σ = 2.0 Å) to model an aqueous solution. Accordingly, the dielectric permittivity of εr = 78.3 was chosen for these conditions.
The total bond potential Ubond is the sum of all bond and crosslink energies uij,bond. A harmonic spring potential described the bond energy according to eqn (5). As force constant, k = 3.89kBTσ−2 was used and the zero-force distance req between two bonded beads was 2.5σ.
 | (5) |
2.2 Investigated parameters
In this work, we varied the pK values of network and oligomer beads, the size of the simulation box to investigate the influence of network and oligomer concentration, and also the chain length of the oligomers. The pK values were varied around a value of 7.0 to obtain different ΔpK values. The corresponding pK values to the ΔpK can be found in Table 1. The ratio of titratable beads of the oligomers to the network beads was 1.2 to enable a possible overcompensation of network charge. A detailed table with all simulation parameters can be found in Table S1 (ESI†).| ΔpK | pKacid | pKbase |
|---|---|---|
| −4 | 9.0 | 5.0 |
| −2 | 8.0 | 6.0 |
| 0 | 7.0 | 7.0 |
| 2 | 6.0 | 8.0 |
| 4 | 5.0 | 9.0 |
2.3 Investigated quantities
The uptake and swelling behavior of the polyelectrolyte microgels are mainly determined by the number of charges of the network and of the oligomer chains. Therefore, the degree of ionization, which in eqn (6) is defined by the number of charged beads of a species divided by the total number of particles of that species, provides quantitative results for the degree of ionization, α, of the beads in the networks and oligomer chains. | (6) |
 | (7) |
3 Results and discussion
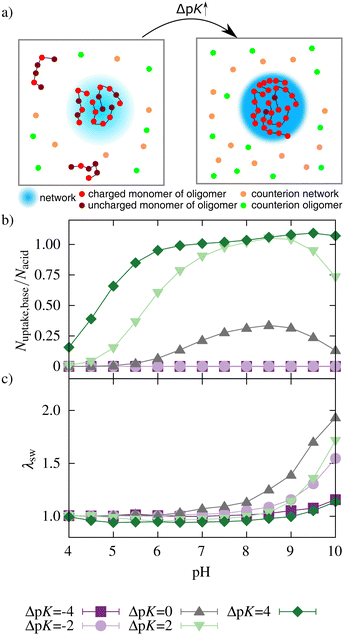
In the following, we investigated the ionization, the oligomer uptake, and the swelling behavior for a reference system and for systems with varied pK values of the network- and oligomer-beads, oligomer length, network, and oligomer concentrations. Principally, the network is unionized, and the oligomers are highly charged at low pH. At intermediate pH, both are charged, and oligomers are taken up into the network. At high pH, the oligomer charge is small, and network charges are mainly compensated by monovalent counterions. This behavior is schematically shown in Fig. 2.3.1 Influence of pK values
Both acidic beads of the network and basic beads of the oligomers mutually influence their ionization. Fig. 3(a and b) show this mutual influence for different ΔpK (with ΔpK = pKbase − pKacid). For ΔpK = −4, the ionization behavior showed no mutual influence of acid and base. Therefore, the ionization of the network and oligomer chains was inhibited compared to a corresponding monomer at infinite dilution. This hindrance can be attributed to the repulsive electrostatic interactions between similarly charged beads, a phenomenon commonly recognized in the context of polyelectrolytes.51–53 For ΔpK = −2, an enhancement in the ionization of oligomers taken up could be observed for intermediate and high pH. However, the average number of monomers taken up is almost zero (see Fig. 4). Therefore, the ionization of the network was nearly unaffected by the addition of the oligomers.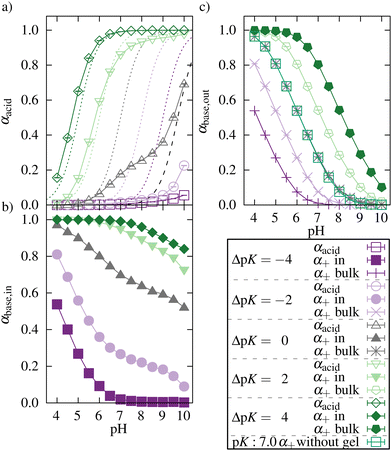 | ||
| Fig. 3 Degree of ionization of (a) networks, (b) oligomers taken up by the network, and (c) oligomers outside the network for different ΔpK. Lines only serve as guides to the eye. The ionization curves for the acidic monomer at infinite dilution (no interactions) are shown as dashed lines for all pK values. The black dashed line represents the fitted ionization curve (see Fig. S1, ESI†) for a polyelectrolyte network system (pK = 7.0) in the absence of oligomers based on the results of Hofzumahaus et al.51 | ||
For ΔpK = 0, the ionization of the acidic network monomers was still inhibited compared to a diluted system of monomers. Nevertheless, the presence of the oligomers enhanced the ionization of the network compared to a pure polyelectrolyte network system (results obtained from work by Hofzumahaus et al.51). Simultaneously, the ionization of oligomers was also enhanced by the presence of the network. Further, the degree of ionization of oligomers taken up was significantly higher than the ionization of the oligomers outside the network (Fig. 3c).
Nevertheless, compared to alternating polyampholyte networks,47,48 this enhancement is lower. In contrast to an alternating polyampholyte microgel system in which the network comprises both acidic and basic monomers, the uptake of the oligomers into the purely acid network is associated with a larger decrease in entropy. Hence, the effect of mutual enhancement of the ionization is reduced. For ΔpK > 0, acids and bases mutually enhanced their ionization over a broad pH range.
We investigated the ionization of the oligomers alone (in the absence of the polyelectrolyte network) and compared it to the ionization of the oligomers outside the network in the presence of the network oligomer complex. We did this for pK = 7.0 and a concentration equal to the oligomer concentration in the reference system. For the whole range of pH values, we did not observe any differences.
As mentioned before, the degree of ionization of an oligomer depends on the pH and on its electrostatic environment, leading to different degrees of ionization for oligomers taken up into the network and oligomers outside the network. Further, a rather homogeneous distribution of oligomers in the core of the network was observed (see Fig. S4, ESI†). The local minima and maxima in the curves arise from the diamond-lattice topology of the network. In accordance with the concentration profiles, the ionization of the oligomers was higher in the core of the network and decreased at distances beyond the radius of gyration.
For the uptake into the network, the network needs to be charged to electrostatically attract the oligomer and the oligomer needs to carry more than one charge per oligomer to make the replacement of monovalent ions by the oligomer electrostatically favorable. This can be corroborated by the results shown in Fig. 4 and 5.
Fig. 4b shows no uptake for ΔpK < 0. With increasing ΔpK, the number of oligomers taken up increased, and uptake was observed in a broader pH regime due to a higher degree of ionization of the network and of the oligomer chains. This increase in ionization and uptake is schematically illustrated in Fig. 4a.
Generally, the network is deionized at low pH, and the oligomers are deionized at high pH. Therefore, the uptake occurs at intermediate pH values. Density functions of the reference system (see Fig. S8, ESI†) show that the oligomers within the network are rather homogeneously distributed in the core of the network. At distances beyond the radius of gyration, the concentration of oligomers decays. Counterions compensate for the network charges only at high pH. Their distribution is also rather homogeneous within the network.
For ΔpK = 4, a plateau in the uptake between pH 6.5 and 7.5 and a further increase at pH 8 can be seen. As the degree of ionization of a single oligomer decreases with higher pH, more chains are taken up to compensate for the network charges.
The uptake of oligomers and their electrostatic attraction prevents the network from swelling (Fig. 4b). For ΔpK = 2 and ΔpK = 4, the attractive interactions between the network and oligomers lead to a further deswelling compared to a neutral network without oligomers. A decrease in the effective charge of the network can explain this deswelling. At lower pH, even charge reversal of the network–oligomer complex was observed for ΔpK = 2 and ΔpK = 4 (see Fig. S2, ESI†). Further, the deswelling of the network can be explained by the bridging of network chains by the oligomers. At high pH, the two effects diminished with a decreasing number of oligomers and an increasing number of counterions in the network, and the network swelled (see Fig. S3, ESI†).
The networks show a similar degree of swelling for ΔpK = −2 and ΔpK = 2, although the pK values differ, and the effective charge is lower for ΔpK = −2 (see ESI2,†). However, the network is preferentially ionized in the dangling chains for ΔpK = −2.51 Since the network is rather small, their contribution is high to the total swelling of the network.
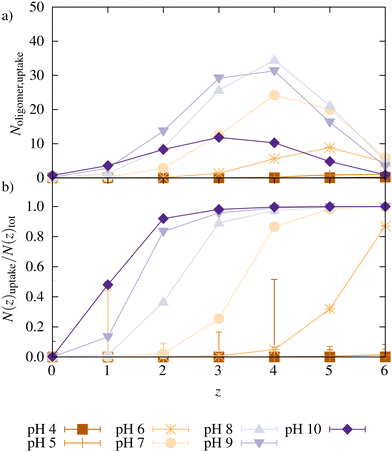
Fig. 5 shows the number of oligomers taken up as a function of their charge z for the reference systems at different pH. Also, the ratio of oligomers with a charge z taken up and the total number of oligomers with that charge is plotted. At low pH, almost no oligomers were taken up, as already seen in Fig. 3. The large error bars for N(z)uptake for z = 4 at pH 4 are caused by a very small value of corresponding N(z)tot. At pH 6, only chains with charge z ≥ 4 were taken up. When the pH was increased, chains with a lower charge were also taken up.
Additionally, with increasing pH, the maximum for oligomers taken up is shifted to smaller z since the degree of ionization of the oligomers decreases with higher pH (a distribution of all oligomers can be found in ESI5,†). Relatively to their total number in the system, oligomers with higher charges were preferred over less charged oligomers for uptake. With increasing pH, the degree of ionization increases, the network charge increases, and more charges of opposite sign (oligomers or monovalent counterions) are needed for charge compensation. Simultaneously, there are fewer oligomers with a high charge. Both effects facilitate the uptake of oligomers with a lower charge.
3.2 Influence of concentration
The concentrations of the network monomers and the oligomer chains can be changed simultaneously by varying the size of the simulation box. A smaller box size refers to a higher concentration (see Fig. 7a–e) of both oligomer and network monomers. Fig. 6 shows schematically the influence of monomer and oligomer concentration on the ionization, oligomer uptake, and network swelling behavior, while Fig. 7 shows the quantitative results.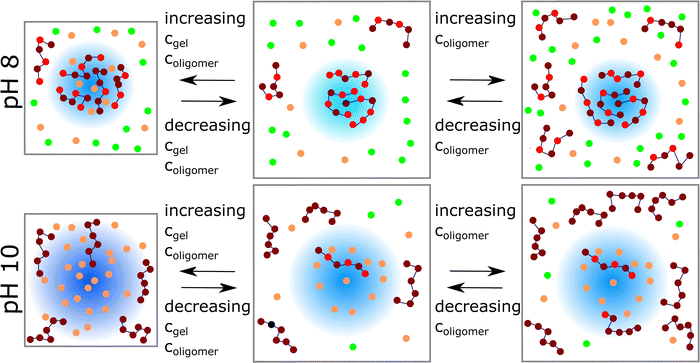 | ||
| Fig. 6 Left: Schematic presentation of the uptake behavior at different microgel and oligomer concentrations (orange: counterions of the network, green: counterions of oligomers. A darker blue color of the network in the right box represents a higher ionization of the network). Snapshots were generated with VMD.50 | ||
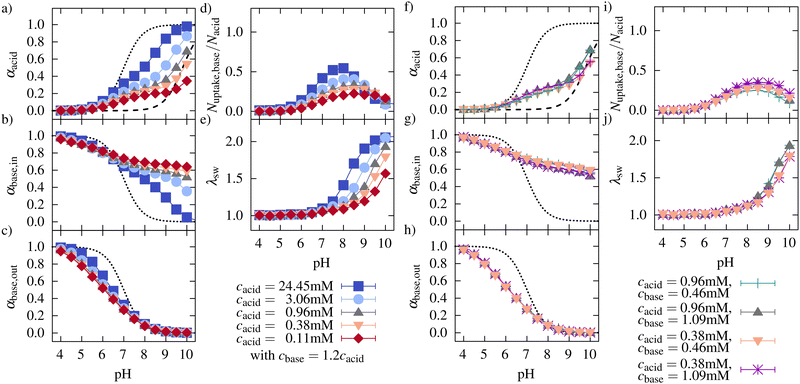 | ||
| Fig. 7 Left: Degree of ionization of (a) the acidic monomers in the network, (b) the oligomers taken up, (c) the oligomers in solutions, (d) the ratio of basic monomers taken up to the number of acidic monomers, and (e) the swelling behavior for network/oligomer systems with different concentrations. The dotted lines in (a)–(c) represent the ionization of systems without interactions between the monomers, and the dashed line in (a) represents the ionization behavior of a polyelectrolyte network without oligomers based on Hofzumahaus et al.51 Right: (f)–(j) Show the same plots as on the left side while keeping the oligomer concentration constant. | ||
At very low pH, the network charge is negligible, and the oligomer chains are mainly found outside the network. The ionization of the oligomer increases with increasing concentration due to the enhanced screening originating from the oligomer counterions and due to the smaller entropy loss for the oligomer counterions when they are restricted to the network chain. This effect would also be expected without the network present. At intermediate pH, the network begins to be charged, and the onset of the network ionization moves to lower pH.
The degree of ionization of the network monomers at a constant pH increases with concentration. This is true up to very high pH. This effect would also be expected without the oligomer present. Nevertheless, at low and intermediate pH, as expected, the degree of ionization is larger in the presence of the oligomer than for the network alone (see dashed line in Fig. 7a). For the oligomers taken up by the network, at low concentrations, the degree of ionization is enhanced significantly by the presence of the oppositely charged network (intermediate and high pH). This enhancement is caused by the attractive electrostatic interaction between the network monomers and the monomers of the oligomer as well as by the fact that compensating a charge by an oppositely charged macro-ion has a lower entropic cost than the same compensation by several monovalently charged small counterions.
Lowering the concentration leads to a strong decrease in the ionization of the network in the investigated pH range. This decrease can be explained by the higher entropic gain for counterion release at low concentrations leading to a decrease of the charge compensation of the network charges by counterions. As a consequence, the ionization of the network is inhibited. Therefore, uptake and swelling were decreased compared to higher concentrations. Further, due to the higher entropic gain for the counterion release at smaller concentrations, the compensation of network charges by the oligomers at a high degree of ionization in the network is facilitated for lower concentrations. Therefore, the maximum uptake of oligomers is shifted to higher pH.
In general, increasing concentration leads to an increased concentration of small ions, which contribute to the screening of the electrostatic interactions. Therefore, the deviation of the ionization from the ideal titration curves (infinite dilution) is reduced, and all titration curves move closer to the ideal curve with increasing concentration.
When salt is added, these effects will still be smaller. As we mentioned in Section 2.1, the ionic strength in our simulations is lower than the ionic strength in most systems looked at experimentally. When the addition of salt during the titration is kept to a minimum, nevertheless, the investigated monomer concentration is higher than the resulting salt concentration caused by the addition of HCl or NaOH for adjusting the pH, and counterion partitioning still plays a dominant role in the ionization behavior of these systems.
An independent variation of the oligomer concentration and the network concentration was achieved by varying the simulation box size and adjusting the number of oligomers so that the oligomer concentration was kept constant. We did this for two different oligomer concentrations and two different monomer concentrations (see Fig. 7f–j). At intermediate pH, the degree of ionization of the network did not change with the microgel concentration when the oligomer concentration was kept constant but increased with the oligomer concentration at constant microgel concentration. This indicates that the attractive interaction between oligomers and network monomers is the main driving force for ionization in this pH regime. Furthermore, the number of oligomers taken up is similar.
However, at higher pH, the degree of ionization in the network differs for equal oligomer concentration and different monomer concentration (see Fig. 7f). In this regime, the degree of ionization is similar for equal monomer concentrations. Due to an increasing number of counterions and a decreasing number of charged monomers in the oligomer chains, the effect of the counterion partitioning on the ionization of the network dominates compared to the effect of oligomer concentration.
Comparing the number of oligomers taken up for different oligomer concentrations and the same monomer concentration shows increased uptake of oligomers with increasing oligomer concentration. At the same time, the degree of ionization of the oligomers inside the network decreases, while the ionization of oligomers in solution was not affected by the higher oligomer concentration. The degree of ionization of the network was increased for higher oligomer concentration, but the higher amount of oligomers compensated for the network charges.
Further, the investigated oligomer concentrations did not significantly influence the swelling behavior of the network in the investigated concentration range. The degree of swelling can be well described as a function of the effective charge (see ESI10,†). The effective charge is independent of microgel and oligomer concentration at low and intermediate pH. At high pH, the effective charge depends on the microgel concentration and is independent of the oligomer concentration.
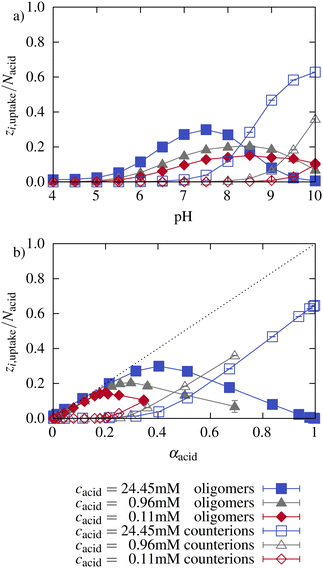
Fig. 8 illustrates the number of oligomer charges and monovalent counterions found inside the network. At low pH, almost no counterions (hollow symbols) are inside the network. The number of oligomer charges inside the network increases with pH and with the associated increasing ionization of the network. The number of charges per oligomer chain decreases with increasing pH (see Section 3.1). The lower the charge per oligomer, the lower the entropy gain upon counterion release from the network. As a consequence, at high pH, the network charge is mainly compensated by monovalent counterions instead of oligomers. The effect is stronger for higher microgel concentrations. This illustrates that both the electrostatic interactions with the network as well as the partitioning of counterions significantly impact the ionization of the oligomers.
Further, Fig. 8 shows the number of charges of oligomers and counterions inside the network normalized by the total number of network beads as a function of the network ionization. At low pH, the number of oligomer charges increased linearly with the network ionization closely following the dotted line, which corresponds to a complete compensation of the charges and a neutral microgel oligomer complex. At higher network ionization, a maximum of oligomer charges inside the network is reached. Beyond the maximum, the oligomer charges inside the network decrease, and counterions compensate for part of the network charges. The slope of the increase depends marginally on the concentration. As already described earlier, at a higher microgel concentration, the network ionization reaches high values already for relatively low pH values at which the oligomers are still considerably charged. Therefore, the maximum of the oligomer charge found inside the network is moved to higher network ionization with increasing concentration. Note that the pH is different at the same degree of ionization for the different concentrations.
3.3 Influence of oligomer length
To investigate the influence of the oligomer length (number of segments) on the uptake, we investigated a number of systems in which the number of segments per oligomer was varied from Nseg = 2 to 48. The total number of oligomer beads and all other parameters of the reference system were kept constant. Results for the variation of the oligomer length are shown in Fig. 9. Fig. 9a shows a schematic representation of the uptake of oligomers of different chain lengths into a microgel. Fig. 9b shows the ionization behavior of the network for the oligomers of different lengths. With an increasing number of segments, the ionization of the network was enhanced since the oligomer chains could compensate more charges at a lower entropic cost.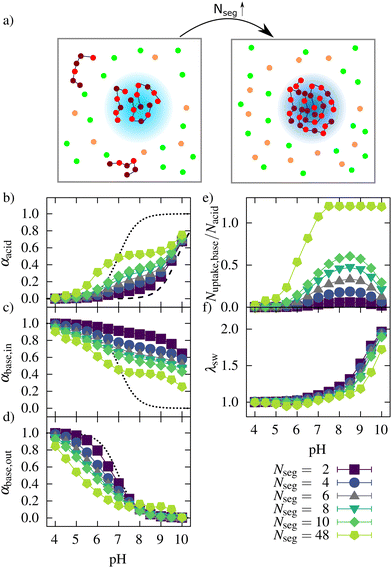 | ||
| Fig. 9 (a) Schematic presentation of the uptake behavior for different oligomer lengths (orange: counterions of the network, green: counterions of oligomers. A darker blue color of the network in the right box represents a higher ionization of the network). Degree of ionization of (b) the acidic monomers in the network, (c) the oligomers taken up, (d) the oligomers in solutions, (e) the ratio of basic monomers taken up to the number of acidic monomers, and (f) the swelling behavior for network/oligomer systems with different lengths of the oligomers. The dotted lines in (b)–(d) represent the ionization of systems without interactions between the monomers, and the dashed line in (b) represents the ionization behavior of a polyelectrolyte network without oligomers based on Hofzumahaus et al.51 | ||
At low pH, the ionization of the oligomer chains decreased with increasing oligomer length. This decrease could be observed both inside and outside the network (see Fig. 9c and d). Outside the network, this is explained by an increased positive charge density, inhibiting further ionization, which is well known for weak polyelectrolyte chains.51–53 Inside the network, at low pH, most of the oligomer beads are charged. Not all charges of the oligomers can be compensated by the network charges because the degree of ionization of the network is low at this pH, leading to a net-positive charged microgel–oligomer complex (see ESI2,†) for Nseg = 48 at low pH.
The higher ionization of the oligomers with Nseg = 48 outside the network can be seen as an artifact of the used method for distinguishing between oligomers inside and outside the network. In most sampled configurations, all chains were taken up. In the other configurations, a maximum of up to two chains were not counted as taken up. However, their location was close to the network, leading to a higher ionization due to attractive electrostatic interactions.
The number of basic monomers (see Fig. 9e) taken up increased with the number of oligomer segments. For Nseg = 48, all chains were taken up at intermediate and high pH, showing that the larger oligomers could move to the inner part of the gel. This could be important for the uptake of larger antimicrobial peptides as well. Regarding the number of charges taken up (ESI6,†) instead of the number of basic monomers taken up, show that the highest number of charges also were taken up for Nseg = 48.
However, for short oligomers, the pH with the maximum number of basic monomers taken up does not change with increasing segment numbers. For Nseg = 48, the maximum number was reached at pH 7.5 since all chains were incorporated. This maximum depends on the complexation energy, which depends on the charge of the oligomers. The higher number of charges within one chain shifts the maximum to a higher pH. The maximum depends also on the entropy gain in counterion release. For chains with more segments, the entropy loss due to complexation with the network is lower than for shorter chains and for monovalent counterions. Therefore, for higher Nseg, more charges were taken up at the maximum, and also, the degree of ionization of the network was higher at the maximum (see ESI7,†). However, with a higher amount of charged basic monomers taken up, the degree of ionization of the network monomers also increased. Therefore, the number of both positive and negative counterions increased, leading to a higher ionic strength in these systems and reduced entropy gain for counterion release. These two effects seem to weaken each other in the salt-free case, so the pH of maximum basic monomers taken up is not strongly dependent on oligomer length.
The swelling curves (Fig. 9f) show a collapse over a broader pH regime if the number of segments increases. Also, with increasing oligomer lengths, the increased uptake leads to a further deswelling of the network at low pH. As mentioned before, increased attractive electrostatic interactions in the network/oligomer system and an entropy gain due to counterion release can explain this. Regarding the effective charge (see ESI2,†), the network was, with increasing oligomer length, less charged. The system with Nseg = 48 was even overcharged in the pH range between 4 and 7.
3.4 Relation to experimental uptake and release studies
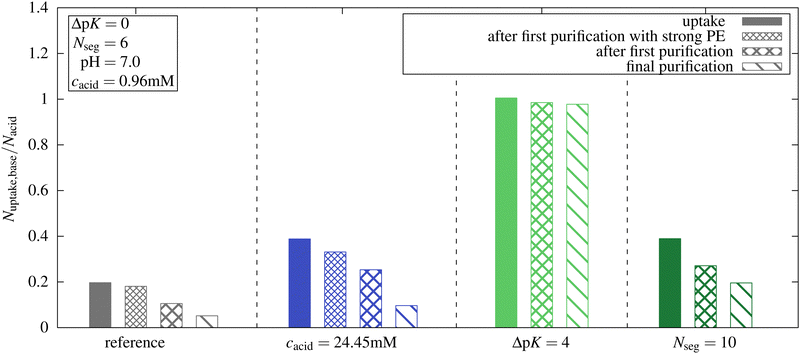
In experimental studies, the uptake of guests in microgels is usually measured after a purification step like redispersing in distilled water with following centrifugation.38 To mimic experimental uptake and release investigations, we explored the release of oligomers by performing a new simulation with a total number of oligomer chains equal to the number of chains taken up in the first simulation. Although the impact of oligomer concentration could have been examined by investigating a range of oligomer concentrations for each system, we chose this approach to establish a stronger connection with experimental procedures.We performed these simulations for the reference system and three other systems with only one parameter changed compared to the reference system at pH 7. We investigated the highest microgel concentration from Section 3.2, the system with ΔpK = 4, and the system with oligomer length Nseg = 10.
The uptake results are shown in Fig. 10, and the degree of ionization of the network is listed in Table 2. Simulation snapshots of the reference system at pH 7 for the first uptake simulation and the “purification” simulation are provided in Fig. S11 (ESI†). While, compared to the reference system, almost the same number of oligomers taken up was obtained for ΔpK = 4, a significantly smaller number was obtained in all ΔpK = 0 systems. Note, that for the ΔpK = 4 system pKacid = 5 and αacid was close to 1.
| α acid(reference) | α acid(cacid = 24.45 mM) | α acid(ΔpK = 4) | α acid(Nseg = 10) | |
|---|---|---|---|---|
| Uptake | 0.178 | 0.316 | 0.991 | 0.484 |
| First purification | 0.110 | 0.240 | 0.984 | 0.205 |
| Final purification | 0.066 (7 steps) | 0.156 (9 steps) | 0.980 (3 steps) | 0.156 (5 steps) |
For all systems with ΔpK = 0, a reduction of uptake was observed when reducing the total number of oligomers to the number of oligomers that were inside the microgel in the previous simulation of the uptake. With fewer oligomers in the whole system, a new equilibrium with some oligomers outside the networks and a reduced ionization of the networks were established. Concurrently, an increase in the ionization of the oligomers taken up was observed.
We performed further “purification simulations” with the number of oligomer chains based on the results of the previous purification step. This procedure was continued until, at maximum, one chain was not taken up at the end of the simulation. For all systems with ΔpK = 0, a further decrease in the uptake of oligomers and in the ionization of the network was observed.
For the reference system, after the final purification step, only 26.3% of the chains that were taken up in the first simulation remained inside the network. In the absence of the other species, both the oligomer and the network would remain almost uncharged at pH = 7 and the present concentration. The oligomer concentration has a large impact on the ionization of the network, because only in the presence of the oligomer the network charges can be compensated by charged oligomers, and the entropic penalty for the confinement of monovalent ions is reduced. At higher concentrations, a larger number of basic monomers were taken up at pH 7. After the purification, a higher proportion of basic monomers remained inside the network compared to the reference system due to a higher degree of ionization of the network. However, compared to the initial uptake simulation, only 24.8% of the basic monomers were retained within the network.
For ΔpK = 4 after purification, almost 97% of the initially taken-up chains remained inside the network. Here again, the network pK is different, and network ionization, therefore, is higher than in the reference system. Further, due to a high ionization of the basic monomers (αbase,out ≈ 0.8 see Fig. 3c), the highly charged oligomers can enhance the ionization of the network leading to the microgel–oligomer-complex.
The effect of compensating the network charges by charged oligomers is enhanced with increasing oligomer length, leading to an enhancement of the network ionization. For the longer chains Nseg = 10, approximately 50% of the initial oligomers taken up remain inside the network after purification.
For comparison, we fixed the degree of ionization after performing the uptake simulations by randomly distributing the corresponding charged monomers, keeping the charge state and position in the network constant during the simulation. After one purification step for these strong polyelectrolyte systems, about 89% of the initially taken-up chains remain inside the network. In this scenario, the network cannot respond to the reduced oligomer concentration by a protonation (deionization) and releasing counterions by replacing them with oligomers, which remains a strong enough driving force for complex formation. In contrast, if the network has weak charges, almost 50% less oligomers were taken up by the network.
With higher microgel concentrations, the counterion release by replacing them with oligomers is a weaker driving force. Therefore, only about 81% of the oligomers of the first simulations were taken up. Compared to the loss of uptake of about 65% if the network has weak charges, it shows that the reduction in ionization of the network still influences the uptake behavior.
4 Conclusion
The uptake of weak cationic oligomers in weak anionic networks was investigated by Metropolis Monte Carlo simulations. The polymers were simulated under good solvent conditions without hydrophobic interactions. The attractive interactions between oligomers and the network led to complex formation and network collapse at intermediate pH. We investigated different systems by changing the pK values, the oligomer length, and the concentration. Oligomers with higher chain lengths and increasing the pK of the oligomers while decreasing the pK of the network monomers led to increased uptake of oligomers.At higher concentrations of both network and oligomers, the mutual enhancement of ionization was increased at low pH, and the oligomer uptake was facilitated. At high pH, however, the osmotic pressure caused by the counterions is higher in a more concentrated system. Consequently, counterion release from the network becomes less favorable and instead of oligomers, the counterions compensated for the network charges. Increasing the oligomer concentration at constant microgel concentration increased the uptake but influenced the swelling only marginally.
To mimic a purification step in experiments, we performed multiple simulations based on the number of oligomers of the previous step, until the solution contained almost no oligomers. We observed a significant loss of oligomers taken up for pK-values of acids and bases. The absence of further chains weakened the mutual enhancement of the network and oligomers, leading to a reduction in the ionization of the network. Although this reduction in ionization of the network was also observed for longer oligomers, more oligomers remained inside the network. In contrast, when both, acidic and basic monomers were highly charged, we observed that almost all oligomers remained inside the network.
Summarized, our results give an insight into the effect of different parameters on the uptake behavior of weak oligomers in polyelectrolyte microgels. In the future, hydrophobic interactions and different salt concentrations will be considered. Especially the latter plays an important role in drug delivery applications. Considering that we used a very simple generic polybase model for the oligopeptide here, we plan to extend our studies to more detailed models of the oligopeptides54 in the future, enabling us to investigate specific oligopeptides more quantitatively.
Conflicts of interest
There are no conflicts of interest to declare.Data availability
Primary research data available. See DOI: https://doi.org/10.22000/1892.Acknowledgements
The authors gratefully acknowledge the computing time provided to them at the NHR Center NHR4CES at RWTH Aachen University (project number p0020253). This is funded by the Federal Ministry of Education and Research, and the state governments participating on the basis of the resolutions of the GWK for national high performance computing at universities (www.nhr-verein.de/unsere-partner). Financial support of the Deutsche Forschungsgemeinschaft within SFB 985 – Functional Microgels and Microgel Systems is gratefully acknowledged.Notes and references
- C. D. Jones and L. A. Lyon, Macromolecules, 2000, 33, 8301–8306 CrossRef CAS.
- M. Zeiser, I. Freudensprung and T. Hellweg, Polymer, 2012, 53, 6096–6101 CrossRef CAS.
- J. Zhao, N. A. Burke and H. D. Stöver, RSC Adv., 2016, 6, 41522–41531 RSC.
- T. Hoare and R. Pelton, Langmuir, 2004, 20, 2123–2133 CrossRef CAS PubMed.
- F. Horkay, I. Tasaki and P. J. Basser, Biomacromolecules, 2000, 1, 84–90 CrossRef CAS PubMed.
- B. H. Tan, K. C. Tam, Y. C. Lam and C. B. Tan, Polymer, 2005, 46, 10066–10076 CrossRef CAS.
- M. Nöth, L. Hussmann, T. Belthle, I. El-Awaad, M. D. Davari, F. Jakob, A. Pich and U. Schwaneberg, Biomacromolecules, 2020, 21, 5128–5138 CrossRef PubMed.
- M. Behbahani, Y. Bide, S. Bagheri, M. Salarian, F. Omidi and M. R. Nabid, Microchim. Acta, 2016, 183, 111–121 CrossRef CAS.
- S. Su, M. M. Ali, C. D. M. Filipe, Y. Li and R. Pelton, Biomacromolecules, 2008, 9, 935–941 CrossRef CAS PubMed.
- L. V. Sigolaeva, S. Y. Gladyr, A. P. H. Gelissen, O. Mergel, D. V. Pergushov, I. N. Kurochkin, F. A. Plamper and W. Richtering, Biomacromolecules, 2014, 15, 3735–3745 CrossRef CAS PubMed.
- T. Hoare and R. Pelton, Langmuir, 2008, 24, 1005–1012 CrossRef CAS PubMed.
- G. Liu, X. Li, S. Xiong, L. Li, P. K. Chu, K. W. Yeung, S. Wu and Z. Xu, Colloid Polym. Sci., 2012, 290, 349–357 CrossRef CAS.
- Y. Li, Q. N. Bui, L. T. M. Duy, H. Y. Yang and D. S. Lee, Biomacromolecules, 2018, 19, 2062–2071 CrossRef CAS PubMed.
- Y. Chen and P. Sun, Polymers, 2019, 11, 285 CrossRef PubMed.
- F. Carnal, A. Clavier and S. Stoll, Environ. Sci.: Nano, 2015, 2, 327–339 RSC.
- C. D. Jones and L. A. Lyon, Macromolecules, 2003, 36, 1988–1993 CrossRef CAS.
- A. Fernandez-Nieves, A. Fernandez-Barbero, F. De Las Nieves and B. Vincent, J. Phys.: Condens. Matter, 2000, 12, 3605 CrossRef CAS.
- A. Fernández-Nieves, A. Fernández-Barbero, B. Vincent and F. J. D. L. Nieves, Macromolecules, 2000, 33, 2114–2118 CrossRef.
- R. Schroeder, A. A. Rudov, L. A. Lyon, W. Richtering, A. Pich and I. I. Potemkin, Macromolecules, 2015, 48, 5914–5927 CrossRef CAS.
- A. V. Dobrynin, R. H. Colby and M. Rubinstein, J. Polym. Sci., Part B: Polym. Phys., 2004, 42, 3513–3538 CrossRef CAS.
- B. S. Ho, B. H. Tan, J. P. Tan and K. C. Tam, Langmuir, 2008, 24, 7698–7703 CrossRef CAS PubMed.
- T. Hoare and R. Pelton, Biomacromolecules, 2008, 9, 733–740 CrossRef CAS PubMed.
- S. Schimka, N. Lomadze, M. Rabe, A. Kopyshev, M. Lehmann, R. V. Klitzing, A. M. Rumyantsev, E. Y. Kramarenko and S. Santer, Phys. Chem. Chem. Phys., 2017, 19, 108–117 RSC.
- M. Bradley and B. Vincent, Langmuir, 2008, 24, 2421–2425 CrossRef CAS PubMed.
- M. Bradley, B. Vincent and G. Burnett, Colloid Polym. Sci., 2009, 287, 345–350 CrossRef CAS.
- M. Bradley, D. Liu, J. L. Keddie, B. Vincent and G. Burnett, Langmuir, 2009, 25, 9677–9683 CrossRef CAS PubMed.
- H. Bysell, P. Hansson and M. Malmsten, J. Phys. Chem. B, 2010, 114, 7207–7215 CrossRef CAS PubMed.
- L. Nyström, R. Nordström, J. Bramhill, B. R. Saunders, R. Álvarez Asencio, M. W. Rutland and M. Malmsten, Biomacromolecules, 2016, 17, 669–678 CrossRef PubMed.
- A. M. Rumyantsev, S. Santer and E. Y. Kramarenko, Macromolecules, 2014, 47, 5388–5399 CrossRef CAS.
- L. Pérez-Mas, A. Martín-Molina and M. Quesada-Pérez, Soft Matter, 2020, 16, 3022–3028 RSC.
- Z. Wang, Y. Li, L. Chen, X. Xin and Q. Yuan, J. Agric. Food Chem., 2013, 61, 5880–5887 CrossRef CAS PubMed.
- T. Hoare and R. Pelton, J. Phys. Chem. B, 2007, 11895–11906 CrossRef CAS PubMed.
- H. Kobayashi, R. Halver, G. Sutmann and R. G. Winkler, Polymers, 2017, 9, 15 CrossRef PubMed.
- J. Yin, S. Shi, J. Hu and S. Liu, Langmuir, 2014, 30, 9551–9559 CrossRef CAS PubMed.
- V. Chimisso, C. Fodor and W. Meier, Langmuir, 2019, 35, 13413–13420 CrossRef CAS PubMed.
- E. Y. Kramarenko, A. R. Khokhlov and K. Yoshikawa, Macromolecules, 1997, 30, 3383–3388 CrossRef CAS.
- M. Ghasemi, S. Friedowitz and R. G. Larson, Soft Matter, 2020, 16, 10640–10656 RSC.
- A. P. Gelissen, A. Scotti, S. K. Turnhoff, C. Janssen, A. Radulescu, A. Pich, A. A. Rudov, I. I. Potemkin and W. Richtering, Soft Matter, 2018, 14, 4287–4299 RSC.
- D. Srivastava, E. Santiso, K. Gubbins and F. L. B. D. Silva, Langmuir, 2017, 33, 11417–11428 CrossRef CAS PubMed.
- J. Kleinen and W. Richtering, J. Phys. Chem. B, 2011, 115, 3804–3810 CrossRef CAS PubMed.
- K. Nakamae, T. Nizuka, T. Miyata, M. Furukawa, T. Nishino, K. Kato, T. Inoue, A. S. Hoffman and Y. Kanzaki, J. Biomater. Sci., Polym. Ed., 1997, 9, 43–53 CrossRef CAS PubMed.
- W. Xu, A. A. Rudov, R. Schroeder, I. V. Portnov, W. Richtering, I. I. Potemkin and A. Pich, Biomacromolecules, 2019, 20, 1578–1591 CrossRef CAS PubMed.
- S. K. Wypysek, S. P. Centeno, T. Gronemann, D. Wöll and W. Richtering, Macromol. Biosci., 2023, 2200456 CrossRef CAS PubMed.
- H. Bysell, P. Hansson, A. Schmidtchen and M. Malmsten, J. Phys. Chem. B, 2010, 114, 1307–1313 CrossRef CAS PubMed.
- P. Hansson, H. Bysell, R. Månsson and M. Malmsten, J. Phys. Chem. B, 2012, 116, 10964–10975 CrossRef CAS PubMed.
- J. Reščič and P. Linse, J. Comput. Chem., 2015, 36, 1259–1274 CrossRef PubMed.
- C. Hofzumahaus, C. Strauch and S. Schneider, Soft Matter, 2021, 17, 6029–6043 RSC.
- C. Strauch and S. Schneider, Soft Matter, 2023, 19, 938–950 RSC.
- C. E. Reed and W. F. Reed, J. Chem. Phys., 1992, 96, 1609–1620 CrossRef CAS.
- W. Humphrey, A. Dalke and K. Schulten, J. Mol. Graphics, 1996, 14, 33–38 CrossRef CAS PubMed.
- C. Hofzumahaus, P. Hebbeker and S. Schneider, Soft Matter, 2018, 14, 4087–4100 RSC.
- J. Landsgesell, L. Nová, O. Rud, F. Uhlk, D. Sean, P. Hebbeker, C. Holm and P. Košovan, Soft Matter, 2019, 15, 1155–1185 RSC.
- C. Holm, J. Joanny, K. Kremer, R. Netz, P. Reineker, C. Seidel, T. A. Vilgis and R. Winkler, Polyelectrolyte theory, Springer, 2004 Search PubMed.
- R. Lunkad, A. Murmiliuk, Z. Tošner, M. Štěpánek and P. Košovan, Polymers, 2021, 13, 214 CrossRef CAS PubMed.
Footnote |
| † Electronic supplementary information (ESI) available. See DOI: https://doi.org/10.1039/d3sm01426f |
| This journal is © The Royal Society of Chemistry 2024 |

