 Open Access Article
Creative Commons Attribution 3.0 Unported Licence
Conformation and dynamics of partially active linear polymers†
Marin
Vatin
 *ab,
Sumanta
Kundu
 abc and
Emanuele
Locatelli
 ab
ab
aDepartment of Physics and Astronomy, University of Padova, Via Marzolo 8, I-35131 Padova, Italy. E-mail: vatinmarin@gmail.com
bINFN, Sezione di Padova, Via Marzolo 8, I-35131 Padova, Italy
cInternational School for Advanced Studies (SISSA), 34136, Trieste, Italy
First published on 31st January 2024
Abstract
We perform numerical simulations of isolated, partially active polymers, driven out-of-equilibrium by a fraction of their monomers. We show that, if the active beads are all gathered in a contiguous block, the position of the section along the chain determines the conformational and dynamical properties of the system. Notably, one can modulate the diffusion coefficient of the polymer from active-like to passive-like just by changing the position of the active block. Further, we show that a slight modification of the self-propulsion rule may give rise to an enhancement of diffusion under certain conditions, despite a decrease of the overall polymer activity. Our findings may help in the modelisation of active biophysical systems, such as filamentous bacteria or worms.
1 Introduction
The field of active matter deals with systems that move autonomously by consuming some source of fuel; this brings them out of equilibrium with respect to the surrounding environment.1 Such a feature has sparked a lot of theoretical interest, for a few different reasons. First, the autonomous motion, also called self-propulsion, acts at the level of the individual constituents and is thus strongly different from other non-equilibrium processes. Second, the phenomenology that emerged is very rich and vastly different from equilibrium.2 Third, several systems of great biological interest are active, such as molecular motors, bacteria and other micro-organisms, cells and even individuals at the macro-scale.3,4 Last but not least, simple models2,4,5 allowed to gain a great deal of insight on the physics of active systems, paving the way to new experiments.6,7Within active matter, the class of active filaments comprises those systems where a polymeric substrate is brought out of equilibrium by the action of fuel consuming units, e.g. molecular motors. Thus, it encompasses a noteworthy spectrum of different systems, such as interphase chromatin,8 cytoskeleton9 and actomyosin networks,10 microtubule assays11–13 and, as an extension, active nematics,14 cilia15–17 and flagella,18,19 unicellular micro-organisms20–23 as well as complex, macroscopic worms,24–27 with recent research exploring the development of artificial systems.28,29 Particle-based micro- and mesoscopic models for active filaments are called “active polymers” and come in different flavors. Indeed, one can drive the system out-of-equilibrium by imposing a different temperature to a fraction of the constituents,30,31 using a colored noise32,33 or using a self-propulsion force. Within the latter category, one can distinguish between active brownian polymers,34–36i.e. a collection of active brownian particles with no correlation along the backbone, transversely propelled active polymers,37 where the force is perpendicular to the local tangent and polar (or tangential) active polymers,35,38,39 where the direction of the self-propulsion is parallel to the backbone tangent and has no internal dynamics. Notably, the latter model shows interesting properties both in three and two dimensions: it has been applied to microtubule assays11,40 and active nematics41–43 and, in 2D, displays a rich phase diagram38,44 as well as interesting properties at high density, e.g. the emergence of collective states characterized by topological defects.45
An intriguing application is the modelization of micro- and macro-organisms. Filamentous bacteria and other micro-organisms have indeed been modeled as active polymers: for example, it was recently shown that the collective properties of Malaria sporozoites can be rationalized by the combination of activity and polymeric properties, such as the persistence length.22 Further, recently a polymeric model was able to rationalize the formation of a collective state observed in different worm species, called “blob”, and formed by many entangled individuals.27 In this case, the key ingredient was provided by the peculiar pattern of the worms head; such patterns seem to be also key factors to model the motion of similar organisms.46 A further application concerns the modeling of chromatin dynamics, with a focus on collective motion.47,48
We consider here partially active polymer chains which, at variance with conventional (or fully) active polymers, possess only a fraction of active monomers. We choose to adopt the tangential activity because of the peculiar and remarkable interplay between activity and the polymer conformation. In this setting, one has to choose how to arrange the active fraction p along the backbone. For example, a regular pattern of active and passive beads was considered in a recent work,49 where it was shown to induce peculiar structures. Going beyond regular patterns, a completely random arrangement is the most general option. However, one of the aims of this paper is to highlight the existence of a special subset of arrangements, contiguous active blocks, and to characterize their influence on the conformation and dynamics of the filaments. We will show that the distance of the active block along the polymer contour, measured from one of the ends of the polymer, strongly influences its conformation and dynamics: in a population of identical, isolated, partially active polymers, for which the contour position of the active block is placed at random along the polymer backbone, a non-zero dynamical heterogeneity emerges. This heterogeneity is not present when the active monomers are arranged completely at random.
The inspiration for such a choice comes, similarly to other works,30,50 from chromatin: chromatin is organized, within the same gene, in “compartments”, i.e. more or less contiguous sections with different physical and functional properties.51 In particular, “active” chromatin marks the active genes, whose information determines the phenotype of the cell; it is believed to be out-of-equilibrium, due to the action of the transcription machinery.52,53
This paper is structured as follows: after a brief description of the polymer model employed (Section 2.1), of the simulation details (Section 2.2) and of the definitions used throughout the paper (Section 2.3), we first show the emergence of the dynamical heterogeneity, connected to a block arrangement of active monomers (Section 3.1). Then, focusing on the specific case of a single active block, we study in detail how the contour position modifies the conformation of the chain (Sections 3.2 and 3.3) at its scaling exponent (Section 3.4). Moving to the dynamics, we further elucidate how the diffusion coefficient is affected by the position of the active block showing that, in a special case, the fully active behaviour can be recovered (Sections 3.5 and 3.6). Finally, we show that, by employing a slightly different self-propulsion rule, under specific conditions the diffusion properties show a great enhancement, despite a decrease of the active fraction and of the overall activity 3.7.
2 Models and methods
2.1 Active polymer model
We model the polymer as a fully flexible, self-avoiding bead-spring linear chain consisting of N monomers, suspended in a bulk fluid in three dimensions. The self-avoidance between any pair of monomers is implemented via a truncated and shifted Lennard-Jones (LJ) potential: | (1) |
![[r with combining right harpoon above (vector)]](https://www.rsc.org/images/entities/i_char_0072_20d1.gif) i −
i − ![[r with combining right harpoon above (vector)]](https://www.rsc.org/images/entities/i_char_0072_20d1.gif) j| is the Euclidean distance between the monomers i and j positioned at
j| is the Euclidean distance between the monomers i and j positioned at ![[r with combining right harpoon above (vector)]](https://www.rsc.org/images/entities/i_char_0072_20d1.gif) i and
i and ![[r with combining right harpoon above (vector)]](https://www.rsc.org/images/entities/i_char_0072_20d1.gif) j, respectively. We take the thermal energy as the unit of energy, kBT = 1. In addition, the finitely extensible nonlinear elastic (FENE) bonding potential54
j, respectively. We take the thermal energy as the unit of energy, kBT = 1. In addition, the finitely extensible nonlinear elastic (FENE) bonding potential54 | (2) |
![[r with combining right harpoon above (vector)]](https://www.rsc.org/images/entities/i_char_0072_20d1.gif) i, acts an active force
i, acts an active force![[f with combining right harpoon above (vector)]](https://www.rsc.org/images/entities/i_char_0066_20d1.gif) ai = fa ai = fa![[t with combining circumflex]](https://www.rsc.org/images/entities/i_char_0074_0302.gif) i i | (3) |
![[t with combining circumflex]](https://www.rsc.org/images/entities/i_char_0074_0302.gif) i = (
i = (![[r with combining right harpoon above (vector)]](https://www.rsc.org/images/entities/i_char_0072_20d1.gif) i+1 −
i+1 − ![[r with combining right harpoon above (vector)]](https://www.rsc.org/images/entities/i_char_0072_20d1.gif) i−1)/|
i−1)/|![[r with combining right harpoon above (vector)]](https://www.rsc.org/images/entities/i_char_0072_20d1.gif) i+1 −
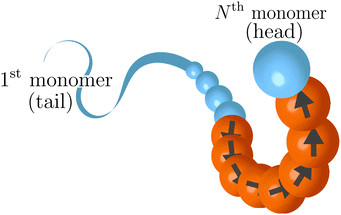
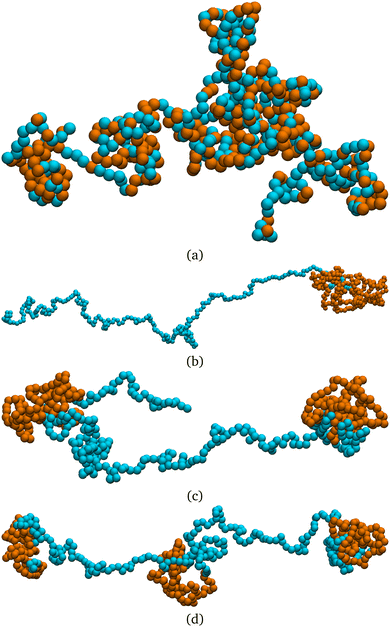
i+1 − ![[r with combining right harpoon above (vector)]](https://www.rsc.org/images/entities/i_char_0072_20d1.gif) i−1| is the normalized tangent vector. The magnitude of the active force on each active monomer fa is constant. We will further consider, in the last part of the paper, an alternative model, named “model 2”. In this alternative model for any monomer i we compute the active force using again eqn (3); however, the magnitude of fai is split equally between monomer i, i − 1 and i + 1. This is done wherever the local tangent can be defined. Excluding the boundaries of the active section, the magnitude of the self-propulsion is the same in the two models; instead, the direction of the active forces, given the same polymer conformation, will be in general different. Notice that, in “model 2”, the first neighbours outside the active regions are slightly active: for example, if p = 1, the first and the last monomers are self-propelled with a force fa/3. In both cases, the strength of the activity is controlled, as usual, by varying a dimensionless parameter called the Péclet number Pe = |fa|σ/kBT. We remark that the introduction of the tangential self-propulsion breaks the symmetry of the polymer and allows to define a head and a tail of the chain. Throughout the paper, we will follow the convention illustrated in Fig. 1, that reports the “model 1” case. We consider here the case where only a fraction p of the monomers is active, while the remaining monomers are passive. The active monomers along the chain are organized in contiguous sections, or blocks, characterized by their starting contour position. We will mainly focus on the case where only one active block is present; for the sake of highlighting the special nature of this arrangement, we will also briefly consider polymer chains with two and three sections, as well as the case of randomly arranged, un-clustered active sites. We report, in Fig. 2 a few snapshots, exemplifying the different types of the active sites' organization considered in this work.
i−1| is the normalized tangent vector. The magnitude of the active force on each active monomer fa is constant. We will further consider, in the last part of the paper, an alternative model, named “model 2”. In this alternative model for any monomer i we compute the active force using again eqn (3); however, the magnitude of fai is split equally between monomer i, i − 1 and i + 1. This is done wherever the local tangent can be defined. Excluding the boundaries of the active section, the magnitude of the self-propulsion is the same in the two models; instead, the direction of the active forces, given the same polymer conformation, will be in general different. Notice that, in “model 2”, the first neighbours outside the active regions are slightly active: for example, if p = 1, the first and the last monomers are self-propelled with a force fa/3. In both cases, the strength of the activity is controlled, as usual, by varying a dimensionless parameter called the Péclet number Pe = |fa|σ/kBT. We remark that the introduction of the tangential self-propulsion breaks the symmetry of the polymer and allows to define a head and a tail of the chain. Throughout the paper, we will follow the convention illustrated in Fig. 1, that reports the “model 1” case. We consider here the case where only a fraction p of the monomers is active, while the remaining monomers are passive. The active monomers along the chain are organized in contiguous sections, or blocks, characterized by their starting contour position. We will mainly focus on the case where only one active block is present; for the sake of highlighting the special nature of this arrangement, we will also briefly consider polymer chains with two and three sections, as well as the case of randomly arranged, un-clustered active sites. We report, in Fig. 2 a few snapshots, exemplifying the different types of the active sites' organization considered in this work.
2.2 Simulation details
We study isolated, partially active polymers in bulk by means of Langevin Dynamics simulations using the open source code LAMMPS,55 with in-house modifications to implement the tangential activity; we neglect hydrodynamic interactions. Bulk conditions are implemented with periodic boundary conditions: in order to exclude the effect of self-interaction of the chain across the periodic boundary, the box side is chosen so that the each size is slightly larger than the polymer's contour length. The equations of motion are integrated using the velocity Verlet algorithm, with elementary time step Δt = 10−3. We set m = 1, σ = 1, kBT = 1 as the units of mass, length, and energy, respectively; the unit of time is . In order to ensure the overdamped regime,56 we set the friction coefficient γ = 20τ−1.
We study polymers of different length 100 ≤ N ≤ 750, different percentage of active sites 0.1 ≤ p ≤ 0.5 and different valued of the activity 0.1 ≤ Pe ≤ 10, although we will mostly focus on the high activity case Pe = 10. For a given set of parameters, after reaching a steady state, production runs have been performed for, at least, 7.5 × 10⁶τ. Polymer conformations have been sampled at a rate of 107Δt = 104τ, that is larger than the decorrelation time of the end-to-end vector. Furthermore, if not specifically mentioned, M = 25 independent trajectories were simulated, in order to improve the statistical significance.
2.3 Metric and dynamical properties
In this section, we will introduce the different metric and dynamical properties that will be considered in our study.The metric properties of a polymer describe its size and shape; as standard practice, we compute the eigenvalues and eigenvectors of the gyration tensor
 | (4) |
 and α and β stand for the three Cartesian coordinates. We compute the three eigenvalues λ1, λ2, λ3 (λ1 ≥ λ2 ≥ λ3) for each polymer conformation in steady state. From these three values, one can compute the gyration radius as Rg2 = λ1 + λ2 + λ3; Rg gives an estimate of the spatial extension of the polymer. Further, the relative shape anisotropy δ* and the prolateness S*57 can be computed. The relative shape anisotropy is given by
 | (5) |
 | (6) |
The prolateness is zero for spherical objects, assumes negative values for oblate (disk-like) shapes and positive values for prolate shapes. The shape anisotropy vanishes for high symmetric configurations and is positive otherwise. Furthermore, we will consider the correlation of the tangent vector along the chain
C(s) = 〈![[t with combining circumflex]](https://www.rsc.org/images/entities/i_char_0074_0302.gif) (s0 + s)· (s0 + s)·![[t with combining circumflex]](https://www.rsc.org/images/entities/i_char_0074_0302.gif) (s0)〉 (s0)〉 | (7) |
![[t with combining circumflex]](https://www.rsc.org/images/entities/i_char_0074_0302.gif) (s) = t(s)/|t(s)| is the corresponding unit vector. The average is done on the initial contour position s0, on time (in steady state) and on the independent realizations. We will compute this function in the passive part of the chain, as an indirect estimator of the shape and of the (effective) semi-flexibility of the chain.
(s) = t(s)/|t(s)| is the corresponding unit vector. The average is done on the initial contour position s0, on time (in steady state) and on the independent realizations. We will compute this function in the passive part of the chain, as an indirect estimator of the shape and of the (effective) semi-flexibility of the chain.
Concerning the dynamical properties, we will characterize the mobility of the active polymers via the mean square displacement (MSD) of the polymer center of mass, located at ![[r with combining right harpoon above (vector)]](https://www.rsc.org/images/entities/i_char_0072_20d1.gif) cm, defined as
cm, defined as
 | (8) |
 | (9) |
 | (10) |
 | (11) |
3 Results
3.1 Dynamical heterogeneity of a population of isolated partially active polymers
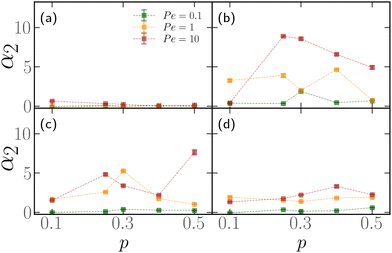
First, we show that active blocks introduce dynamical heterogeneity at the population level. We consider four different settings: (a) the active monomers are distributed at random along the chain, (b) the active monomers are arranged in one active block, (c) the active monomers are arranged in two, non-overlapping active blocks, (d) the active monomers are arranged in three, non-overlapping active blocks. For each case, we consider different values of the fraction of the active monomers p ∈ [0.1,0.5]. We take care that, in all cases, the effective number of active monomers is the same, so that the overall activity is equal; in particular, in case (a), a monomer can't be picked twice in the random selection process and in cases (c) and (d) there is no overlap between the active blocks. We further consider three values of the Péclet number Pe = 0.1, 1, 10. For a given set of values of p and Pe, we simulate a population of M* = 100 polymer chains of fixed length N = 500 monomers. Within case (a), different polymers have a different random arrangement; within cases (b)–(d), the contour position of the first monomer of the active block(s) is chosen, for each of the M* polymers, at random. The results are reported in Fig. 3, where we show the non-Gaussian parameter α2, defined in Section 2.3 as a function of the fraction of active monomers p for different values of Pe; the four panels refer to the four cases (a)–(d). We observe the emergence of a non-zero dynamical heterogeneity for cases (b)–(d); conversely, (a) shows negligible heterogeneity, in a population of the same size, for all values of p or Pe considered. This suggests that arranging the active monomers at random does not lead to qualitative difference in the dynamics of the different polymers. The same is not true for the (b)–(d) cases, where the non-Gaussian parameter α2 is sensibly larger than one when the activity of the individual monomers is large enough (i.e. Pe ≳ 1).We also notice that the difference in the dynamics is reflected in the polymer conformations. One can notice in Fig. 2, that the conformations in the cases (b)–(d) are markedly different from the case (a). In particular, in Fig. 2a the chain exhibits a coil-like polymer conformation; on the contrary, when the active monomers are grouped in contiguous sections (Fig. 2b–d) the active regions substantially shrink, while the passive regions elongate. As we will see in detail in the case of polymers with a single active block, this depends on the size of the section itself and on the position of its first monomer, leading to conformational heterogeneity. Both scenarios are different from the fully active case, that is characterized by globule-like conformations.39,59
From a dynamical perspective, the coil-like configuration in case (a) can be understood as follows. At small values of p, placing the monomers at random along the chain does not lead to clustering of the active sites, for an overwhelming large number of realizations. In this regime, the tangential activity will still influence the local conformation of the polymer; however, the active forces, acting on monomers that are separated along the contour, will not be correlated and will not influence the conformation on the scale of the whole chain. Upon increasing the value of p, more and more small clusters will appear, until the fully active case is recovered; indeed, the conformation shown in Fig. 2, at p = 0.5, already resembles the globule-like state.39 The same argument can be further carried to the dynamics: as long as the effect of the self-propulsion remains local, different random arrangements will not lead to different dynamical behaviour.
Finally, notice that α2 becomes smaller as the number of active blocks increases. The random arrangement can be seen as a limiting case and it has, indeed, negligible non-Gaussianity. This can be understood in a statistical sense; the detailed calculations are reported in the ESI† (Section 1). In brief, the set of possible arrangements is maximal for N·p clusters of size 1, i.e. the random case. Contiguous section are possible as they represent a subset of all the possible random arrangements, but are overwhelmingly rare; even though their dynamical and conformational properties are markedly different from the ones of the average random arrangement, their importance is negligible.
From this point on, we will focus on the case of a single active block at high values of Pe (Pe = 10); data concerning different values of Pe are reported in the ESI.† We make this choice essentially for two reasons. First, the set of possible arrangements for a single active block is the smallest and one can introduce a parameter that greatly helps rationalizing the rich dynamical scenario. Second, as shown, the effects of the heterogeneous activity are, in this case, more evident.
3.2 Contour position of the active block determines shape and size of the chain
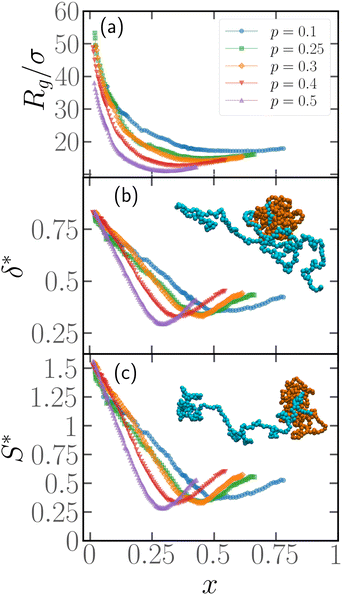
In order to quantify the position of the active block along the contour, we introduce the parameter x = Np/N, Np being the number of passive monomers between the head of the polymer (see Section 2.1) and the first monomer of the active section; alternatively, it is the minimum contour distance between the head of the polymer and the edge of the active section. The minimum value of x is x = 1/N as, for the end monomers, a tangent vector can't be defined and, thus, they are always passive; the maximum value is x = 1 − p − 1/N ≈ 1 − p for large N. In general, if x ≈ 0, the active section is close to the head of the polymer; upon increasing x, the active section shifts towards the tail.We present, in Fig. 4, how the metric properties, i.e. the gyration radius Rg, the shape anisotropy δ* and the prolateness S*, depend on the parameter x. We consider here polymer chains of length N = 500, Pe = 10, and different values of p. We expect a polymer of size N = 500 to be in the scaling regime (see Section 3.4). The results reported are obtained from the same set of simulations described in Section 3.1, i.e. a population of M* polymers with one active block, whose position has been chosen at random along the chain. This implies that very few chains over the total will be characterized by the same value of x; in order to better visualize the trends, the data in Fig. 4 has been smoothed by means of a convolution filter. All the curves show non-monotonic trends, regardless of the smoothing.
We start from Fig. 4a, where the gyration radius as a function of x is reported. We observe that Rg decreases from its maximum value at x = 1/N upon increasing x; the minimum value is reached at x = xmin ≈ (1 − p)/2, and at higher values of x, Rg increases again, becoming non-monotonic. Similar trends are visible in Fig. 4b and c for the asphericity and the prolateness, respectively; we notice that the minimum is more pronounced. We also notice that the prolateness is always positive; the polymers, upon increasing x, transition from a very elongated shape to a more spherical one and become elongated again above xmin. At variance with Rg, the maximum value at x = 1/N in Fig. 4b and c appears almost independent on p; this indicates that the shape of the active polymers remains the same in the limit x → 1/N, within the range of values 0.1 ≤ p ≤ 0.5 considered in this work. As a further comment, notice that the active block is, for the values of p considered, long enough such that the active section attains a globule-like configuration, due to buckling-like instability39,59 and it is thus pretty compact and spherical. Thus, the overall prolateness of the chain is essentially due to the passive section.
Notice that, for xmin = (1 − p)/2, the center of the active block is located exactly halfway along the contour of the polymer: the non-monotonicity in Fig. 4 indicates that any shift of the location of the active block from the middle of the chain leads to the elongation of the entire polymer chain. However, the curves are not symmetric about xmin, a further consequence of the broken symmetry introduced by the tangential activity; thus it is the position of the active block with respect to the head of the chains that determines the overall conformation.
To exemplify, the snapshot reported in Fig. 2b refers to a polymer with x = 1/N; in the insets of Fig. 4 we report snapshots of polymers with x = (1 − p)/2 (inset of Fig. 4b) and x = 1 − p (inset of Fig. 4c). The simplest case is x = 1/N, where the active block pulls the passive section, that elongates. For x = 1 − p the active block also ends up pulling the passive section, which rationalizes the observed elongation; however, it does so in a much less efficient way, resulting in a partial folding. Further, for x = (1 − p)/2, the active block is positioned between two, equally sized blocks; both are pulled around by the active section, which leads to complete folding and a more spherical shape. Notably, some of these features still persist if the polymer chain has two or three active blocks (see Section 7, ESI†).
3.3 Effective persistence of the passive section
In order to complement the analysis carried out so far, we aim to characterize the typical conformations of the passive section. We will focus here on the longest passive section, of length Nlp and we will consider the tangent–tangent correlation function C(s), defined in Section 2.3, as a function of the contour distance s/N.Looking at the conformations, e.g.Fig. 2 and 4, the passive section appears always stretched and elongated, albeit to different degrees at different values of x. One way to recast this property is to introduce an effective rigidity. To provide a quantitative description of this phenomenon, we indeed look at the tangent–tangent correlation function within the largest passive section. The results are presented in Fig. 5 for N = 100, 300, p = 0.2, and different values of x. We observe that C(s) depends strongly on x: when the parameter x is small, the tangent vectors remain correlated throughout the whole passive section. However, upon increasing x, the correlation decays more rapidly: it is easy to see that, at high enough values of x, the correlation length becomes negligible. This analysis thus allows us to assess how the positioning of the active sections along the chain influences the effective persistence length of the passive section: the closer the active cluster is to the head of the chain, the higher the effective persistence length. We therefore expect that upon increasing the degree of polymerization N, chains characterized by a small value of x will grow with a large scaling exponent, similar to rigid rods. On the contrary, chains characterized by a large value of x will grow with a scaling exponent, comparable to the passive one for self-avoiding chains.
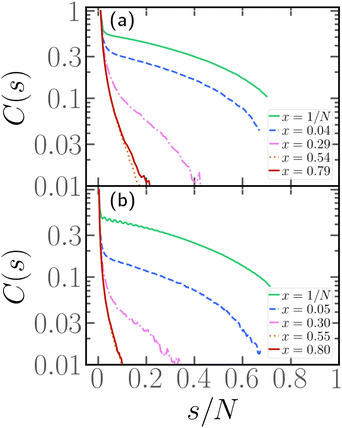 | ||
| Fig. 5 Tangent–tangent correlation function as a function of the contour distance s within the longest passive section for p = 0.2, Pe = 10, and (a) N = 100, (b) N = 300. | ||
3.4 Scaling properties for polymer chains with one active block
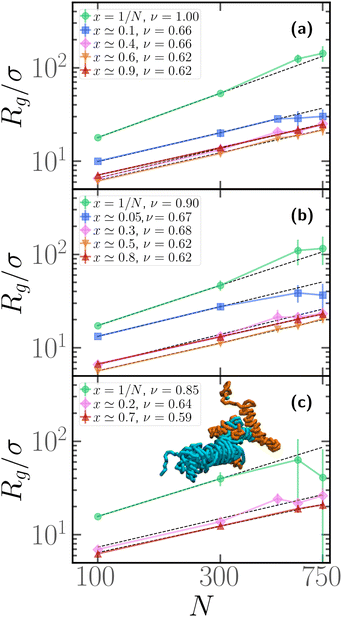
We now assess how the contour position of the active block affects the scaling properties of the gyration radius, i.e. how Rg depends on the degree of polymerization N. We report the results in Fig. 6; in each panel, we report the gyration radius as a function of the degree of polymerization N for different values of x. In this case, we performed, for each value of x, M = 25 independent realizations, i.e. M independent copies with the same arrangement of active monomers. Notice that the value of x, reported in the legend, is only approximately similar for polymers with different N. In our simulations, we fixed for convenience the contour positions, in an arbitrary fashion; due to the presence of the “head” bead, which is always passive, there is a 1/N contribution to the value of x that was disregarded. In the different panels, we report results for different values of the fraction of active monomers p. We observe that the gyration radius follows, for all values of x and p, a power law Rg ∼ Nν; however, clearly, upon changing x, the scaling exponent ν changes drastically. In all three panels, we observe that if x = 1/N the scaling exponent is quite high, compared to the passive exponent ν = 0.588 of self-avoiding polymers; this is in agreement with the extremely high value of the prolateness, observed in Fig. 4 at fixed N and with the effective persistence of the passive section, reported in Section 3.3. Notice, however, that the exponent slightly decreases upon increasing p. Indeed, upon increasing p, the contribution of the active section, which attains a globule-like conformation, becomes more important.Upon shifting the active block along the contour to larger values of x, the scaling exponent becomes ν ≃ 0.62, slightly larger than the passive scaling exponent ν = 0.588. As observed in Section 3.2, the passive sections must be rather elongated, in order to justify the overall prolateness of the chain; this may be sufficient, overall, to account for the scaling exponent observed. In agreement with the data reported in Fig. 4 at fixed N, the non-monotonicity of Rg is visible also in panels (a) and (b) of Fig. 6, and curves at fixed x ≃ 0.5 display the lowest value of Rg.
Finally, we highlight a significant deviation of the gyration radius from the global trend for x = 1/N, with N ≥ 600 in Fig. 6c (p = 0.2, 0.3); these data, that deviate from the power law, are accompanied by large error bars. This phenomenon is due to self-entanglements: if the polymers are long enough and the active block is placed very close to the head of the chain, we obtain a spontaneous and abundant knot formation. A fraction of the polymers display numerous knots within the same chain but remain very elongated, others get tangled and end up in a very compact state (see inset of Fig. 6c); the size of the error bars reflects this heterogeneity. The same phenomenology was also observed in sufficiently long isolated active rings60 and was also attributed to entanglement. This particularly intriguing phenomenon is not the focus of this article and will be addressed in more detail in a future work. We have not considered the data points corresponding to these situations (x = 1/N, N ≥ 600) for the fit presented in Fig. 6.
3.5 Dynamics of polymer chains with one active section
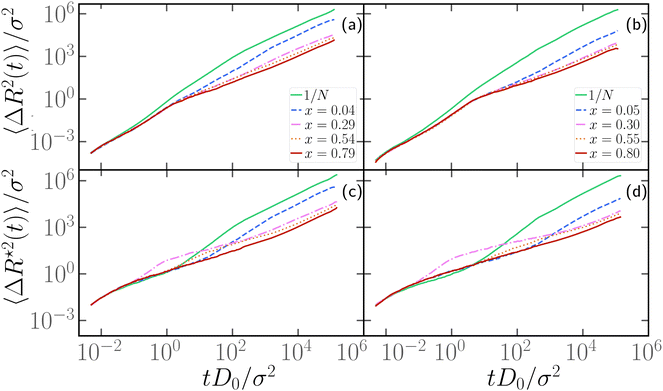
We now turn to the discussion of the dynamics of the partially active polymer. As seen in the fully active case, the introduction of the tangential activity ties conformation and dynamics together. We first discuss the dynamics by looking at the mean square displacement of the center of mass (see Section 2.3) as a function of the rescaled time tD0/σ2, reported in panels a, b of Fig. 7 for N = 100 and N = 300, respectively; D0 refers to the diffusion coefficient of a single passive monomer. Also, in this case, as in Section 3.4, we consider M = 25 independent realizations, with the same arrangement of active monomers. We have fixed p = 0.2 and Pe = 10 in Fig. 7; results for different values of p are reported in the ESI† (Section 2). In both panels of Fig. 7 we observe that the extreme case x = 1/N exhibits the largest MSD. All the curves overlap up to tD0/σ2 ∼ 1 showcasing a common super-diffusive regime; then, for tD0/σ2 > 1, polymers characterized by a large value of x slow down and become diffusive. Notice that the MSD shows a sub-diffusive regime, that becomes more evident upon increasing N. This signals that, at intermediate time scales, the polymers tend to have relatively long “tumbling” periods, when they rotate around their center of mass. Instead, polymers with a relatively small value of x, up to extreme value x = 1/N remain super-diffusive for a much longer time; in contrast with the large x case, changing the position of the active block along the contour by a few monomers changes the diffusion coefficient significantly (see also Section 3.6).We further look at the monomeric MSD; we focus on the MSD of the central monomer of the chain (see 2.3) for convenience. In fact, the average over all monomers, also known as g1(t) in the literature, would depend critically on the value of p and would not really highlight the dynamics of either region, active or passive. We report the results of 〈ΔR*2(t)〉/σ2 as a function of the rescaled time tD0/σ2, in Fig. 7c and d. We observe that the MSD of the central monomer depends strongly on x. We showed in Fig. 7a and b that the position of the active block along the contour modifies the overall dynamics. On top of this, depending on the value of x, the central monomer can be either passive or active; in particular, referring to the values of x reported in Fig. 7c and d, the central monomer is active only for the value x ≃ 0.29–0.30. At the lowest value of x, x = 1/N, 〈ΔR*2(t)〉/σ2 shows, after an initial sub-diffusive regime, a strong super-diffusion followed again by normal diffusion, signaling the transition to the center of mass dynamics. The short-time sub-diffusive regime lasts longer upon increasing x, if the central monomer remains passive. However, when the central monomer becomes active (x ≃ 0.29–0.30), a more complex behaviour emerges: after the short-time sub-diffusive regime, a brief super-diffusive regime appears, followed by a new, rather long-lasting sub-diffusive regime, roughly three decades in time. This sub-diffusive regime overlaps with the sub-diffusive regime observed for the center of mass dynamics (Fig. 7a and b). We argue that, at shorter times, the crossover to sub-diffusion is related to the dynamics of the single monomer: the length scale marked by this crossover is compatible with the typical activity-induced persistence length.39 Instead, the cross-over time to the active diffusive regime markedly depends on the polymer size; interestingly, the length scale associated with this crossover is much larger than the gyration radius of the chain. Both observations may highlight a further interplay between local and global conformation, that could be interesting to investigate in the future.
Upon increasing x further, the super-diffusion shifts to later times and the intermediate sub-diffusive regime shrinks; at sufficiently high values of x, they are both suppressed and a passive-like behaviour is recovered. Interestingly, this latter feature distinguishes 〈ΔR*2(t)〉/σ2 from the MSD of the center of mass, which shows an anomalous sub-diffusive behaviour for all values of x considered.
3.6 Contour position and size of the active block determine the mobility of the chain
As hinted by the data reported in Fig. 7, the long-time diffusion coefficient D/D0 of partially active linear polymers with one active block depends on the contour position of such active block. We show more in detail this dependency in Fig. 8 for polymer chains of length N = 100 (panel a), N = 300 (panel b), N = 600 (panel c), for different values of p.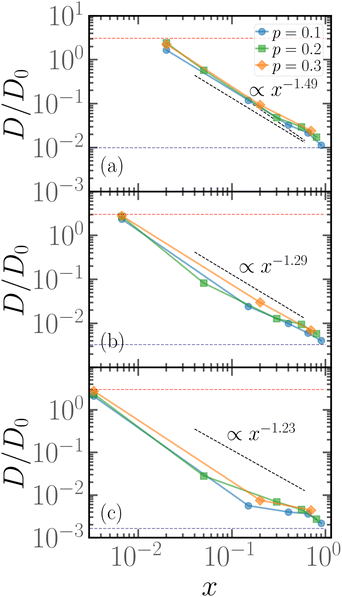 | ||
| Fig. 8 Diffusion coefficient D of the polymer chains as a function of the parameter x for (a) for N = 100; (b) for N = 300; (c) for N = 600. The red dashed line refers to the diffusion coefficient of a fully active chain of Pe = 10, as predicted by eqn (6) of ref. 39; the blue dashed line refers to the Rouse diffusion coefficient of a passive chain D0/N, D0 = kBT/mγ being the diffusion coefficient of a single passive monomer. | ||
We can observe that, upon increasing x, the diffusion coefficient decreases as a power law, whose exponent depends on the size of the polymer. Interestingly, at x = 1/N the diffusion coefficient is compatible with the value predicted in ref. 39 for fully active polymers; conversely, for large values of x the diffusion coefficient becomes compatible with the passive Rouse theory prediction. Thus the contour position modulates the mobility of the chain, at least in the range of values of p considered. Further, we can also observe that the data for different values of p roughly fall on the same curve; this happens for polymers of different lengths N = 100, 300, 600. The data follow a power-law trend; as the curve modulates between the N-independent fully active case and the 1/N passive case, the resulting power-law exponent depends on N. However, this common power law trend indicates that the parameter x captures the effect of the contour position of the active block on the long-term dynamics, regardless of the size of the active block or the size of the chain.
We can recast the same data in a different fashion, by considering the long time diffusion coefficient as a function of the degree of polymerization N for different values of x, reported in Fig. 9 for p = 0.1 (panel a), p = 0.2 (panel b). We see here more clearly that, when x = 1/N, the diffusion coefficient is compatible with the theoretical prediction of ref. 39, valid for a fully active polymer at Pe = 10; it is also independent of N. The discrepancy between numerical data and prediction is, not surprisingly, smaller at p = 0.2; however, it is remarkable that the fully active mobility can be achieved, in good approximation, with as low as 1/10 of the original number of active monomers. Further, we observe that the passive-like 1/N dependence of the diffusion coefficient is recovered at sufficiently large values of x; the value of x, at which this happens, seems to decrease upon increasing p. However, as also evident from Fig. 8, the diffusion coefficient is a factor of three or more larger than the purely passive case; only for p = 0.1 and x = 1 − p, i.e. the largest value of x possible, the diffusion coefficient is truly compatible with the passive Rouse prediction. Naturally, upon increasing p, the mobility of the chain becomes increasingly larger than the Rouse value even at x = 1 − p, as all the possible arrangements of the N·p active monomers will become increasingly similar, among themselves and with the fully active case.
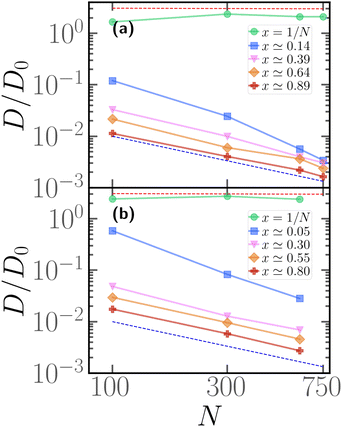 | ||
| Fig. 9 Diffusion coefficient D/D0 as a function of the degree of polymerization N for several values of the parameter x and (a) for p = 0.1, (b) for p = 0.2. The red dashed line refers to the diffusion coefficient of a fully active chain of Pe = 10, as predicted by eqn (6) of ref. 39; the blue dashed line refers to the Rouse diffusion coefficient of a passive chain D0/N. | ||
In order to understand the dependence of the diffusion coefficient on the position of the active block, we consider the autocorrelation function χ(t) of the end-to-end vector of the active block itself. The function χ(t) encodes the temporal dependence of the total self-propulsion force that, at such high values of Pe, drives the dynamics; the longer it takes for such total force to decorrelate, the higher will be the diffusion coefficient. We report, in Fig. 10, the function χ(t) as a function of the normalized time tD0/σ2, for different values of x at fixed p = 0.2, Pe = 10, and N = 100 (panel a) and N = 300 (panel b); data referring to different values of p are reported in the ESI† (Section 3). We can observe, in both panels, that the autocorrelation function decays more slowly for x = 1/N than for higher values of x. Thus, the end-to-end vector of the active block and, thus, the total self-propulsion force, maintains the same direction for a longer time when it is as close as possible to the head of the polymer. As soon as a few passive monomers are added in front of the active block, χ(t) decays more sharply and shows an anti-correlation at some characteristic time. This suggests that the end-to-end vector of the active block tends to point in the opposite direction after a certain characteristic time, in a sort of tumbling motion. Interestingly, the typical time, associated with such “tumbling” motion, increases with N and with p (see ESI,† Section 3). Finally, we apply the stochastic model, introduced in ref. 39 and 56, to partially active polymers; we report the results in the ESI† (Section 6). We observe that the trends reported are captured only qualitatively by the model; possibly, a more complex stochastic model, that takes into account the heterogeneity of the polymer, is necessary.
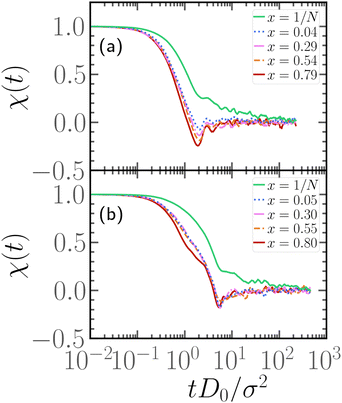 | ||
| Fig. 10 Autocorrelation function of the end-to-end vector of the active block, for different values of x at fixed Pe = 10, p = 0.2, and (a) N = 100, (b) N = 300. | ||
3.7 Enhancing chain mobility via head activity
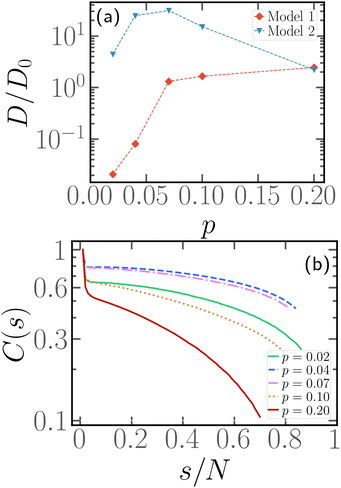
Fig. 8 and 9 clearly show that, if a block of active monomers is placed close to the head of the chain, the whole polymer's mobility is comparable to the one of its fully active counterpart. As mentioned, this result is remarkable and counter-intuitive, since the total active force on the center of mass is here as low as 1/10 of its reference value (i.e. the fully active case).In this limit, x = 1/N and small values of p, it is interesting to notice that a slight variation in the self-propulsion rule may have very important effects on the conformation and dynamics of the polymer. We employ the second model (“model 2”), introduced in Section 2.1, in the limit of p ≤ 0.1 and x = 1/N. We show, in the ESI† (Section 5), that the two models become equivalent for p > 0.1. Thus, we focus on the limit of a very small number of active monomers; in particular we limit ourselves here to the case N = 100. We show in Fig. 11a a comparison between the normalised diffusion coefficient D/D0 as a function of p for both “model 1” and “model 2”. We observe that, in the former case, the diffusion coefficient decreases monotonically with decreasing p. Indeed, both the magnitude and the correlation time of total active force (see Fig. S7 for the time correlation function of the end-to-end vector of the active block ![[R with combining right harpoon above (vector)]](https://www.rsc.org/images/entities/i_char_0052_20d1.gif) ae, ESI†) decrease upon decreasing p. Instead, in the latter case, upon increasing p, D/D0 first increases and, after the maximum at p ≈ 0.07, it decreases back to the fully active value. Interestingly, at p = 0.2, the two models have the same diffusion coefficient, which supports their equivalence for a sufficiently large number of active monomers. By construction, the magnitude of the active force has to decrease upon decreasing p in both cases; the distribution of Rae, reported in the ESI† (Fig. S8), indeed shows this trend. However, within “model 2”, the time correlation function (Fig. S7b, ESI†) shows a non monotonic behaviour. Interestingly, these two ingredients are not sufficient to quantitatively predict the diffusion coefficient: the stochastic model, mentioned in the previous section,39,56 only reproduces the numerical results qualitatively (see Section 6, ESI†). We argue that the reason for this non-monotonic behaviour lies in an enhancement of the effective persistence length, related to the head activity. For very small values of p, the size of the active block falls below the persistence length: the active monomers will thus tend to be aligned (see Fig. S8 of the ESI†) and will drag the rest of the chain with them. Indeed, Fig. 11b shows the tangent–tangent correlation function within the passive section for the same systems as in Fig. 11a and “model 2” self-propulsion. We observe that tangent vectors remain correlated over the entire length of the passive chain for the two values of p with the highest mobility. This suggest the picture of an active polymer with a rod-like conformation, whose anisotropy may further enhance its decorrelation time and its diffusion coefficient. We stress that this enhancement should happen, upon increasing N, at vanishing p; indeed, the effective persistence length should depend on the value of Pe and not on N. Finally, as the major effect of “model 2” is to introduce activity at the edges of the active block, we argue that the two models are effectively equivalent for x > 1/N as, in that case, the edge of the block does not correspond to the head of the polymer.
ae, ESI†) decrease upon decreasing p. Instead, in the latter case, upon increasing p, D/D0 first increases and, after the maximum at p ≈ 0.07, it decreases back to the fully active value. Interestingly, at p = 0.2, the two models have the same diffusion coefficient, which supports their equivalence for a sufficiently large number of active monomers. By construction, the magnitude of the active force has to decrease upon decreasing p in both cases; the distribution of Rae, reported in the ESI† (Fig. S8), indeed shows this trend. However, within “model 2”, the time correlation function (Fig. S7b, ESI†) shows a non monotonic behaviour. Interestingly, these two ingredients are not sufficient to quantitatively predict the diffusion coefficient: the stochastic model, mentioned in the previous section,39,56 only reproduces the numerical results qualitatively (see Section 6, ESI†). We argue that the reason for this non-monotonic behaviour lies in an enhancement of the effective persistence length, related to the head activity. For very small values of p, the size of the active block falls below the persistence length: the active monomers will thus tend to be aligned (see Fig. S8 of the ESI†) and will drag the rest of the chain with them. Indeed, Fig. 11b shows the tangent–tangent correlation function within the passive section for the same systems as in Fig. 11a and “model 2” self-propulsion. We observe that tangent vectors remain correlated over the entire length of the passive chain for the two values of p with the highest mobility. This suggest the picture of an active polymer with a rod-like conformation, whose anisotropy may further enhance its decorrelation time and its diffusion coefficient. We stress that this enhancement should happen, upon increasing N, at vanishing p; indeed, the effective persistence length should depend on the value of Pe and not on N. Finally, as the major effect of “model 2” is to introduce activity at the edges of the active block, we argue that the two models are effectively equivalent for x > 1/N as, in that case, the edge of the block does not correspond to the head of the polymer.
4 Conclusions
In summary, we studied how the arrangement of a certain fraction of active monomers influences the conformation and dynamics of partially active linear polymers. Within the ensemble of all the possible arrangements, we focused on the specific case of a single, contiguous block of active sites. The reason is twofold. First, we showed that, on a population level, random arrangements are all dynamically equivalent; on the contrary, arranging the active sites in contiguous blocks gives rise, in a population of non-interacting chains, to a dynamic heterogeneity. The population sample was constructed by placing the active blocks randomly along the contour; the polymers were, apart from this detail, identical, i.e. same values of N, Pe, and p. This heterogeneity persists when more than one active block is present; however, we found, in the single block case, that the parameter x, given by the minimum contour distance of the first active monomer from the “head” of the chain over the total contour length, provides a way to rationalize the conformational and dynamical properties of these partially active chains. In fact, we show that chains characterized by a small value of x are much more elongated and much more mobile with respect to their counterpart characterized by large values of x. In other words, the contour position of the active block determines the chain conformation and dynamics; looking at a random population, this explains the emergence of dynamical heterogeneity. Interestingly, conformation and dynamics show here a different relationship, with respect to the fully active case. In the latter, at fixed N, the polymer becomes more compact and its mobility increases. Here, overall, diffusivity and shape are not connected so distinctly: indeed, while the diffusion coefficient decreases monotonically upon increasing x, the shape and size of the chains show a non-monotonicity, the minimum being located when the active block is exactly in the middle of the chain. Albeit we do not show in detail the effect of activity, we argue that the phenomenology observed should be robust. The contour position also influences the scaling properties: the measured scaling exponent ν of the gyration radius is ν ≃ 1 for x = 1/N, while it decreases for larger values of x to a value slightly larger than the passive, self-avoiding reference ν = 0.588. In general, the value of ν will always result from the weighted average between the active block, which tends to be globule-like and the passive sections, which tends to be very extended. Further, in the same perspective, we show that the diffusion coefficient remains N-independent, and compatible with the fully active case, only for very small values of x; upon adding a few passive monomers between the “head” end of the chain and the beginning of the active section, D becomes again a decreasing function of N. The increase of the diffusion coefficient at very small values of x can be connected to an anomalous behaviour of the time correlation function of the self-propulsion force, that disappears upon increasing x. We further observe that the partially active polymers may become sensitive to specific details of the self-propulsion when the head monomer becomes active. Indeed we introduce a variation of the tangential propulsion that, for x = 1/N, renders the head monomer active. Interestingly, with this modified self-propulsion rule, the chain mobility may be enhanced by decreasing the fraction of active sites. This counter-intuitive result is connected with the effective persistence length, induced by the tangential activity; when the active block is very short, the monomers align, causing a collective stretching of the chain that increases its decorrelation time and its diffusion. Such effect is not present in the conventional “tangential” model and disappears for sufficiently large values of p or, equivalently, a sufficiently large number of active monomers. Finally, we highlight that a simple stochastic model is not able to quantitatively reproduce the dependence of the polymer dynamics on the position of the active block; more complex models that take into account the heterogeneity of the chain may be needed.These results show that partially active polymers display a very rich dynamical scenario; understanding their properties will be most useful in guiding the modelisation of filamentous micro-organism and worms. Further, understanding the properties of partially active polymers may also guide the design of artificial, soft robots, optimizing the use of active sections in order to improve control and cost. From a more polymeric perspective, it would be interesting to investigate how the position of a block of active monomers influences the entanglement in very dense conditions.61,62 Finally, as mentioned in the introduction, chromatin is distinctly characterized by “sections”, among which the active one is bound to be out-of-equilibrium due to the action of ATP-driven molecular motors: understanding the phenomenology of polymer chains with active sections will be important, in order to include the non-equilibrium effects in chromatin models.
Author contributions
Conceptualization, E. L., S. K. and M. V.; investigation, E. L. and M. V.; formal analysis, M. V.; writing – original draft preparation, M. V.; writing – review and editing, E. L. and S. K.; supervision, E. L.; funding acquisition, E. L. All authors have read and agreed to the published version of the manuscript.Conflicts of interest
There are no conflicts to declare.Acknowledgements
This work has been funded by the project “LOCA_BIRD2222_01” of the University of Padova. E. L. acknowledges support from the MIUR grant Rita Levi Montalcini. The computational results presented have been achieved using the Vienna Scientific Cluster (VSC); CloudVeneto is also acknowledged for the use of computing and storage facilities. S. K. acknowledges financial support from PNRR Grant CN_00000013_CN-HPC, M4C2I1.4, spoke 7, funded by NextGenerationEU.Notes and references
- M. C. Marchetti, J.-F. Joanny, S. Ramaswamy, T. B. Liverpool, J. Prost, M. Rao and R. A. Simha, Rev. Mod. Phys., 2013, 85, 1143 CrossRef CAS
.
- S. Ramaswamy, Annu. Rev. Condens. Matter Phys., 2010, 1, 323–345 CrossRef
.
- T. Vicsek and A. Zafeiris, Phys. Rep., 2012, 517, 71–140 CrossRef
.
- S. Ramaswamy, J. Stat. Mech.: Theory Exp., 2017, 2017, 054002 CrossRef
.
- J. Tailleur and M. Cates, Phys. Rev. Lett., 2008, 100, 218103 CrossRef CAS
.
- G. Vizsnyiczai, G. Frangipane, C. Maggi, F. Saglimbeni, S. Bianchi and R. Di Leonardo, Nat. Commun., 2017, 8, 15974 CrossRef CAS PubMed
.
- H. Massana-Cid, C. Maggi, G. Frangipane and R. Di Leonardo, Nat. Commun., 2022, 13, 2740 CrossRef CAS PubMed
.
- D. Saintillan, M. J. Shelley and A. Zidovska, Proc. Natl. Acad. Sci. U. S. A., 2018, 115, 11442–11447 CrossRef CAS PubMed
.
- D. A. Fletcher and R. D. Mullins, Nature, 2010, 463, 485–492 CrossRef CAS PubMed
.
- G. H. Koenderink, Z. Dogic, F. Nakamura, P. M. Bendix, F. C. MacKintosh, J. H. Hartwig, T. P. Stossel and D. A. Weitz, Proc. Natl. Acad. Sci. U. S. A., 2009, 106, 15192–15197 CrossRef CAS PubMed
.
- V. Schaller, C. Weber, C. Semmrich, E. Frey and A. R. Bausch, Nature, 2010, 467, 73–77 CrossRef CAS PubMed
.
- Y. Sumino, K. H. Nagai, Y. Shitaka, D. Tanaka, K. Yoshikawa, H. Chaté and K. Oiwa, Nature, 2012, 483, 448–452 CrossRef CAS PubMed
.
- A. Shee, N. Gupta, A. Chaudhuri and D. Chaudhuri, Soft Matter, 2021, 17, 2120–2131 RSC
.
- A. Doostmohammadi, J. Ignés-Mullol, J. M. Yeomans and F. Sagués, Nat. Commun., 2018, 9, 3246 CrossRef PubMed
.
- E. Loiseau, S. Gsell, A. Nommick, C. Jomard, D. Gras, P. Chanez, U. Dortona, L. Kodjabachian, J. Favier and A. Viallat, Nat. Phys., 2020, 16, 1158–1164 Search PubMed
.
- J. Elgeti and G. Gompper, Proc. Natl. Acad. Sci. U. S. A., 2013, 110, 4470–4475 CrossRef CAS PubMed
.
- B. Chakrabarti, S. Fürthauer and M. J. Shelley, Proc. Natl. Acad. Sci. U. S. A., 2022, 119, e2113539119 CrossRef CAS
.
- R. Chelakkot, A. Gopinath, L. Mahadevan and M. F. Hagan, J. R. Soc., Interface, 2014, 11, 20130884 CrossRef PubMed
.
- S. K. Anand, R. Chelakkot and S. P. Singh, Soft Matter, 2019, 15, 7926–7933 RSC
.
- R. Balagam and O. A. Igoshin, PLoS Comput. Biol., 2015, 11, e1004474 CrossRef PubMed
.
- M. K. Faluweki and L. Goehring, J. R. Soc., Interface, 2022, 19, 20220268 CrossRef
.
- P. Patra, K. Beyer, A. Jaiswal, A. Battista, K. Rohr, F. Frischknecht and U. S. Schwarz, Nat. Phys., 2022, 18, 586–594 Search PubMed
.
- C. Kurzthaler, S. Mandal, T. Bhattacharjee, H. Löwen, S. S. Datta and H. A. Stone, Nat. Commun., 2021, 12, 7088 Search PubMed
.
- A. Deblais, S. Woutersen and D. Bonn, Phys. Rev. Lett., 2020, 124, 188002 CrossRef CAS PubMed
.
- A. Deblais, A. Maggs, D. Bonn and S. Woutersen, Phys. Rev. Lett., 2020, 124, 208006 CrossRef CAS PubMed
.
- C. Nguyen, Y. Ozkan-Aydin, H. Tuazon, D. I. Goldman, M. S. Bhamla and O. Peleg, Front. Phys., 2021, 9, 734499 CrossRef
.
- V. P. Patil, H. Tuazon, E. Kaufman, T. Chakrabortty, D. Qin, J. Dunkel and M. S. Bhamla, Science, 2023, 380, 392–398 CrossRef CAS PubMed
.
- Y. Ozkan-Aydin, D. I. Goldman and M. S. Bhamla, Proc. Natl. Acad. Sci. U. S. A., 2021, 118, e2010542118 CrossRef CAS PubMed
.
- E. Zheng, M. Brandenbourger, L. Robinet, P. Schall, E. Lerner and C. Coulais, Phys. Rev. Lett., 2023, 130, 178202 CrossRef CAS PubMed
.
- J. Smrek, I. Chubak, C. N. Likos and K. Kremer, Nat. Commun., 2020, 11, 26 CrossRef CAS PubMed
.
- A. Agrawal, N. Ganai, S. Sengupta and G. I. Menon, Biophys. J., 2020, 118, 2229–2244 CrossRef CAS PubMed
.
- A. Ghosh and N. Gov, Biophys. J., 2014, 107, 1065–1073 CrossRef CAS PubMed
.
- D. Osmanović and Y. Rabin, Soft Matter, 2017, 13, 963–968 RSC
.
- A. Kaiser and H. Löwen, J. Chem. Phys., 2014, 141, 044903 CrossRef CAS PubMed
.
- R. G. Winkler and G. Gompper, J. Chem. Phys., 2020, 153, 040901 CrossRef CAS PubMed
.
- S. K. Anand and S. P. Singh, Phys. Rev. E, 2020, 101, 030501 CrossRef CAS PubMed
.
- K. Prathyusha, F. Ziebert and R. Golestanian, Soft Matter, 2022, 18, 2928–2935 RSC
.
- R. E. Isele-Holder, J. Elgeti and G. Gompper, Soft Matter, 2015, 11, 7181–7190 RSC
.
- V. Bianco, E. Locatelli and P. Malgaretti, Phys. Rev. Lett., 2018, 121, 217802 CrossRef CAS PubMed
.
- A. Sciortino, L. J. Neumann, T. Krüger, I. Maryshev, T. F. Teshima, B. Wolfrum, E. Frey and A. R. Bausch, Nat. Mater., 2023, 22, 260–268 CrossRef CAS PubMed
.
- A. Joshi, E. Putzig, A. Baskaran and M. F. Hagan, Soft Matter, 2019, 15, 94–101 RSC
.
- G. A. Vliegenthart, A. Ravichandran, M. Ripoll, T. Auth and G. Gompper, Sci. Adv., 2020, 6, eaaw9975 CrossRef PubMed
.
- R. Zhang, S. A. Redford, P. V. Ruijgrok, N. Kumar, A. Mozaffari, S. Zemsky, A. R. Dinner, V. Vitelli, Z. Bryant and M. L. Gardel,
et al.
, Nat. Mater., 2021, 20, 875–882 CrossRef CAS PubMed
.
- Ö. Duman, R. E. Isele-Holder, J. Elgeti and G. Gompper, Soft Matter, 2018, 14, 4483–4494 RSC
.
- K. Prathyusha, S. Henkes and R. Sknepnek, Phys. Rev. E, 2018, 97, 022606 CrossRef CAS PubMed
.
- D. Krishnamurthy and M. Prakash, Proc. Natl. Acad. Sci. U. S. A., 2023, 120, e2304981120 CrossRef CAS PubMed
.
- A. Mahajan, W. Yan, A. Zidovska, D. Saintillan and M. J. Shelley, Phys. Rev. X, 2022, 12, 041033 CAS
.
- I. Eshghi, A. Zidovska and A. Y. Grosberg, Phys. Rev. Lett., 2023, 131, 048401 CrossRef CAS PubMed
.
- S. K. Anand and S. P. Singh, Phys. Rev. E, 2018, 98, 042501 CrossRef
.
- I. Chubak, C. N. Likos, K. Kremer and J. Smrek, Phys. Rev. Res., 2020, 2, 043249 CrossRef CAS
.
- M. R. Hübner, M. A. Eckersley-Maslin and D. L. Spector, Curr. Opin. Genet. Dev., 2013, 23, 89–95 CrossRef PubMed
.
- C.-H. Chuang, A. E. Carpenter, B. Fuchsova, T. Johnson, P. de Lanerolle and A. S. Belmont, Curr. Biol., 2006, 16, 825–831 CrossRef CAS PubMed
.
- A. Zidovska, D. A. Weitz and T. J. Mitchison, Proc. Natl. Acad. Sci. U. S. A., 2013, 110, 15555–15560 CrossRef CAS PubMed
.
- K. Kremer and G. S. Grest, J. Chem. Phys., 1990, 92, 5057–5086 CrossRef CAS
.
- A. P. Thompson, H. M. Aktulga, R. Berger, D. S. Bolintineanu, W. M. Brown, P. S. Crozier, P. J. in't Veld, A. Kohlmeyer, S. G. Moore and T. D. Nguyen,
et al.
, Comput. Phys. Commun., 2022, 271, 108171 CrossRef CAS
.
- M. Fazelzadeh, E. Irani, Z. Mokhtari and S. Jabbari-Farouji, Phys. Rev. E, 2023, 108, 024606 CrossRef CAS PubMed
.
- A. Narros, A. J. Moreno and C. N. Likos, Macromolecules, 2013, 46, 3654–3668 CrossRef CAS PubMed
.
- K. Vollmayr-Lee, W. Kob, K. Binder and A. Zippelius, J. Chem. Phys., 2002, 116, 5158–5166 CrossRef CAS
.
- M. Foglino, E. Locatelli, C. Brackley, D. Michieletto, C. Likos and D. Marenduzzo, Soft Matter, 2019, 15, 5995–6005 RSC
.
- E. Locatelli, V. Bianco and P. Malgaretti, Phys. Rev. Lett., 2021, 126, 097801 CrossRef CAS PubMed
.
- A. R. Tejedor, R. Carracedo and J. Ramrez, Polymer, 2023, 125677 CrossRef CAS
.
- W. Savoie, H. Tuazon, I. Tiwari, M. S. Bhamla and D. I. Goldman, Soft Matter, 2023, 19, 1952–1965 RSC
.
Footnote |
| † Electronic supplementary information (ESI) available: Theoretical calculation of the number of possible arrangements. Additional data on size and shape parameters, for different values of N and different values of Pe. Additional information on the end-to-end autocorrelation function. Size and shape parameters for multiple active blocks. See DOI: https://doi.org/10.1039/d3sm01162c |
| This journal is © The Royal Society of Chemistry 2024 |

