Reaction-induced morphological transitions in a blend of diblock copolymers and reactive monomers: dissipative particle dynamics simulation†
Yoshinori
Tomiyoshi
 *a,
Yutaka
Oya
 b,
Toshihiro
Kawakatsu
 c and
Tomonaga
Okabe
 d
d
aCenter for Soft Matter Physics, Ochanomizu University, Bunkyo-ku, Tokyo 112-8610, Japan. E-mail: tomiyoshi.yoshinori@ocha.ac.jp
bDepartment of Materials Science and Technology, Tokyo University of Science, Katsushika-Ku, 125-8585, Tokyo, Japan
cDepartment of Physics, Graduate School of Science, Tohoku University, Sendai 980-8578, Japan
dDepartment of Aerospace Engineering, Graduate School of Engineering, Tohoku University, Sendai 980-8578, Japan
First published on 6th December 2023
Abstract
The dissipative particle dynamics (DPD) method is applied to the morphological transitions of microphase-separated domains in a mixture of symmetric AB-diblock copolymers and reactive C-monomers, where polymerization and cross-linking reactions take place among C-monomers. The initial structure for the DPD simulation is an equilibrated cylindrical domain structure prepared by the density-biased Monte Carlo method with density profiles obtained from the self-consistent field theory. By introducing a cross-linking reaction among reactive C-monomers, we confirmed that the DPD simulation reproduces the morphological transitions observed in experiments, where the domain morphology changes due to segregation between A-blocks of diblock copolymers and cross-linking networks of C-monomers. When the cross-linking reaction of C-monomers is sufficiently fast compared to the deformation of the domains, the initial cylindrical domains are preserved, while the distance between the domains increases. On the other hand, when the formation of the cross-linking network is slow, the domains can deform and reconnect with each other in the developing cross-linking network. In this case, we observe morphological transitions from the initial domain morphology with a large-curvature interface to another domain morphology with a smaller-curvature interface, such as the transition from the cylindrical phase to the lamellar phase. We calculated the spatial correlations in the microphase-separated domains and found that such correlations are affected by the speed of the formation of the cross-linking network depending on whether the bridging between microphase-separated domains occurs in a nucleation and growth process or in a spinodal decomposition process.
1 Introduction
Controlling the properties of polymeric materials by blending polymers is of crucial importance in designing various composites. One of the successful examples is a thermosetting/thermoplastic polymer blend.1–3 Epoxy resins have been widely used for industrial products including electronic and adhesive materials4,5 and fiber-reinforced composites like CFRP (carbon-fiber-reinforced plastics)6,7 because the epoxy resins have desirable mechanical and physical characteristics such as high thermal conductivity and insulation, except their toughness. It is well known that while epoxy resins possess large rigidity for many engineering applications, they allow cracks to grow and propagate easily, which leads to their undesirable brittleness. To overcome this brittleness of the epoxy resins, block copolymers have attracted great attention as a thermoplastic modifier to control the structure of nanoscale domains by their self-assembly.8–12 The improvement of the fracture toughness has been observed in the experiments. Wu et al.8 reported that in the blend of epoxy and PBO–PEO (polybutylene oxide-b-ethylene oxide), the microphase-separated structure of branched worm-like micelles shows 19 times improved strain energy release rate, which characterizes the toughness, compared to the unmodified epoxy without PBO–PEO. Kishi et al.11 also reported that in epoxy/acrylic block copolymers (PMMA-b-PnBA-b-PMMA, poly(methyl methacrylate)-b-poly(n-butyl acrylate)-b-poly(methyl methacrylate)), the nano-cylindrical structures exhibit a fracture toughness of 2530 J m−2, which is twenty-fold compared to the unmodified epoxy thermosets. These observations undoubtedly indicate the importance of the precise prediction of the microphase-separated structures undergoing curing or cross-linking reactions to improve the functionalities of the epoxy resins.To understand the mechanism of the microphase-separated structures of the epoxy/block copolymer blend, we focus on a pioneering experimental work reported by Lipic et al.13,14 Their study employed a sample containing poly(ethylene oxide)-b-poly(ethyl ethylene-alt-propylene) (PEO–PEP) modifiers added to the diglycidyl ether of bisphenol-A (DGEBA) type epoxy thermosets. The authors reported that, depending on the volume fraction of modifiers and the temperature, the epoxy/block copolymer blend formed microphase-separated structures such as lamellar, gyroidal, hexagonal cylindrical, and spherical structures before the curing reaction. During the curing reaction, these microphase-separated structures transform into different morphologies, e.g., from a sphere to a cylinder. Their study demonstrates that “reaction-induced phase separation”15,16 plays an important role in these morphological transitions.
As far as we know, few works have paid attention to reaction-induced morphological transitions for microphase-separated structures in view of the particle-based simulation, although several works studied reaction-induced “macrophase” separations.17–20 In the present paper, by using dissipative particle dynamics (DPD) with a simple cross-linking reaction scheme, we simulate the epoxy/block copolymer blend in the mesoscopic scale. To simply mimic the target system studied by Lipic et al.,14 we investigate the morphological transitions in a blend of AB-diblock copolymers and reactive C-monomers, as explained in the next section. We first perform self-consistent field theory (SCFT) calculations to confirm the phase diagram obtained in the experiment. With the aid of the density profile of microphase-separated structures obtained from SCFT, we prepare well-ordered initial conditions for efficient DPD simulations. Starting from these initial conditions, we simulate the reaction-induced morphological transitions induced by the cross-linking reaction of reactive monomers. We also investigate the transient dynamics of the morphological transitions for various cross-linking conditions.
2 Model and simulation
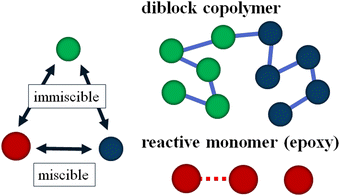
To simulate our target system studied by Lipic et al.14 in the mesoscopic scale, we employ the standard DPD method21,22 and we assume that our system consists of three types of DPD particles: A and B particles in the symmetric diblock copolymers (PEO–PEP) and reactive C particles (epoxy) as reactive solvent monomers as shown in Fig. 1. The reactive C particle forms a cross-linking network structure. We assume that the mixing of A particles in the diblock copolymer and the reactive C particles is athermal.In the following section, we briefly review the DPD method used in the present article. This method has been applied to predict the kinetics of microphase separations of diblock copolymers,23 and has recently been used for modeling polymer networks24,25 and a thermoset resin curing simulation.26 The motion of the DPD particles is described by Newton's equations of motion
 | (1) |
 | (2) |
FDij = −γωD(|rij|)(![[r with combining circumflex]](https://www.rsc.org/images/entities/b_char_0072_0302.gif) ij·vij) ij·vij)![[r with combining circumflex]](https://www.rsc.org/images/entities/b_char_0072_0302.gif) ij ij | (3) |
FRij = σωR(|rij|)θij(t)![[r with combining circumflex]](https://www.rsc.org/images/entities/b_char_0072_0302.gif) ij, ij, | (4) |
![[r with combining circumflex]](https://www.rsc.org/images/entities/b_char_0072_0302.gif) ij = rij/|rij|, and vij ≡ vi − vj. γ is the friction coefficient and σ is the noise strength which satisfies the fluctuation-dissipation theorem, σ2 = 2γkBT, and θij is the Gaussian white noise characterized by
ij = rij/|rij|, and vij ≡ vi − vj. γ is the friction coefficient and σ is the noise strength which satisfies the fluctuation-dissipation theorem, σ2 = 2γkBT, and θij is the Gaussian white noise characterized by| 〈θij(t)〉 = 0, | (5) |
 | (6) |
 | (7) |
As the conservative force, we adopt the soft repulsion force defined by
 | (8) |
| aii = 75kBT/ρ, | (9) |
| aij = aii + 3.27χij | (10) |
| FBij = krij, | (11) |
In addition to the standard DPD methodology explained above, we introduce a simple reaction algorithm for stochastic bond creation to reproduce the cross-linking process of reactive monomers. The reaction procedure is as follows:
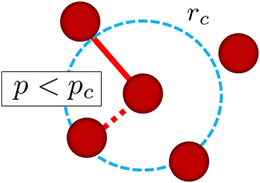
1. For each reactive monomer, we list up surrounding reactive monomers within a given distance rc.
2. We randomly choose one reactive monomer from the surrounding monomers listed up in step 1.
3. We create a permanent chemical bond between these monomers when p < pc where p is the uniform random number in [0,1].
In this study, each reactive monomer can have up to 4 bonds. The above procedure is applied at every μ DPD time steps and for all monomers except for those with 4 bonds. Fig. 2 shows a schematic picture of the cross-linking reaction in this simulation explained above. A similar method for the cross-linking reaction was used in ref. 17 and 24.
Before starting DPD simulations, we apply the SCFT for investigating the possible microphase-separated structures depending on the volume fraction of the A segment and the repulsive interaction between segments, and also apply the density-biased Monte Carlo method27 for preparing well-ordered microphase-separated structures as initial conditions for DPD simulations. We use COGNAC and SUSHI in OCTA28 as the DPD simulator and the SCFT simulator, respectively. About the theoretical details of SCFT and the density-biased Monte Carlo method, readers can refer to ref. 27 and 29.
3 Equilibrium microphase-separated structures before curing reactions
In this section, we discuss the equilibrium microphase-separated structures in a blend of symmetric AB-diblock copolymers and C-homopolymers before the cross-linking reaction takes place. It should be noted that in this section, we regard A and C monomers as the same species since their mixing is athermal. A theoretical phase diagram for such a blend of AB-diblock copolymers and A homopolymer system was obtained by Matsen31,32 using the SCFT. Semenov and Likhtman33,34 also studied a similar system in the strong segregation regime by using the strong segregation theory (SST) for Nd < Nh, where Nd and Nh are the molecular weights of the diblock copolymer and the homopolymer, respectively. Here we investigate the system similar to these studies but Nd = 10 and Nh = 1, and focus on the weak and intermediate segregation regimes. The diblock copolymer with Nd = 10 and reactive monomers with Nh = 1 correspond to the PEO–PEP and epoxy (BPA348), respectively, as mentioned in ref. 14. Since such a situation was not studied in ref. 32–35, we newly constructed a phase diagram of the blend of AB-diblock copolymers and homopolymers by using the SCFT, where the gyroid phase was not considered for simplicity as well as in our DPD simulations.Fig. 3 shows the phase diagram predicted by our SCFT calculation. Our phase diagram is qualitatively similar to the experimental result obtained by Lipic et al.14 It should be noted that in the intermediate segregation regime with 20 < χN < 30, the location of the phase boundary between the lamellar and cylindrical phases and that between the cylindrical and spherical phases are independent of the incompatible parameter χN. Similar behavior is known to occur in the diblock copolymer melts (shown by the dashed curves in Fig. 3) but in a much stronger segregation region.36,37 Moreover, the phase boundaries in the blend of the diblock copolymer and homopolymers locate at higher volume fraction regions than those in the diblock copolymer melts, because the homopolymers can fill the interstitial regions between the cylindrical domains or the spherical domains and relax the space-filling constraints imposed on the diblock copolymer melts.33 We also note that the stable region of the spherical phase is much wider than the experimental result since the SCFT simulation does not include the thermal fluctuation effect which destabilizes the spherical phase. The density profile obtained by the SCFT simulation is used for efficiently generating the initial conditions of microscopic phase-separated structures for the DPD simulation using the density-biased Monte Carlo method mentioned in ref. 27.
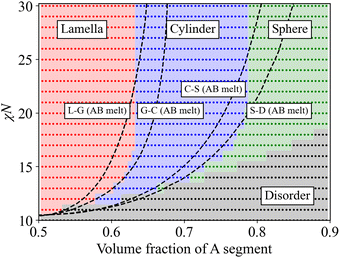 | ||
| Fig. 3 Phase diagram obtained using the SCFT. The horizontal axis represents the volume fraction of the A segment for AB-diblock copolymer melts, and the total volume fraction of A segments and C segments for a blend of AB diblock polymers and C homopolymers. The dotted regions colored by red, blue, green, and gray represent lamellar, cylindrical, spherical, and disordered phases of the blend, respectively. We do not consider the gyroid morphology for simplicity in this study. Coexistence regions are omitted as these regions are too narrow to be shown. The dashed curves show the phase boundaries of the diblock copolymer melts between L–G, G–C, C–S, and S–D, where L, G, C, S, and D represent lamellar, gyroid, cylindrical, spherical and disordered phases, respectively. These boundaries of the diblock copolymer melts are taken from ref. 30. | ||
In the following sections, we show the results of the DPD simulation to investigate the effect of the cross-linking reaction on the initial domain morphologies. The total number of DPD particles are 139![[thin space (1/6-em)]](https://www.rsc.org/images/entities/char_2009.gif) 986, which are placed in a simulation box with (Lx, Ly, Lz) = (44.0, 30.4, 34.9) for the cylindrical phase. A symmetric AB-diblock copolymer chain is composed of 5 A-particles and 5 B-particles, and thus a single block copolymer chain is composed of Nd = 10 DPD particles. The total number density of the DPD particles is fixed to ρ = 3, and the total number of block copolymer chains and reactive C monomers are (9797, 41
986, which are placed in a simulation box with (Lx, Ly, Lz) = (44.0, 30.4, 34.9) for the cylindrical phase. A symmetric AB-diblock copolymer chain is composed of 5 A-particles and 5 B-particles, and thus a single block copolymer chain is composed of Nd = 10 DPD particles. The total number density of the DPD particles is fixed to ρ = 3, and the total number of block copolymer chains and reactive C monomers are (9797, 41![[thin space (1/6-em)]](https://www.rsc.org/images/entities/char_2009.gif) 998) which correspond to the number fraction of the A particles and C particles as ϕA + ϕC = 0.65. The interaction parameters between AA, BB, CC, and AC-type pairs are set to aAA = aBB = aCC = aAC = 25, while the interaction parameters for AB and BC-type pairs are set to aAB = aBC = 46, which corresponds to χN = 64 using eqn (10). However, it should be noted that χN effectively reduces to (χN)eff = 23–29 by considering the fluctuation effect due to a finite chain length according to the following relations:23
998) which correspond to the number fraction of the A particles and C particles as ϕA + ϕC = 0.65. The interaction parameters between AA, BB, CC, and AC-type pairs are set to aAA = aBB = aCC = aAC = 25, while the interaction parameters for AB and BC-type pairs are set to aAB = aBC = 46, which corresponds to χN = 64 using eqn (10). However, it should be noted that χN effectively reduces to (χN)eff = 23–29 by considering the fluctuation effect due to a finite chain length according to the following relations:23
 | (12) |
 | (13) |
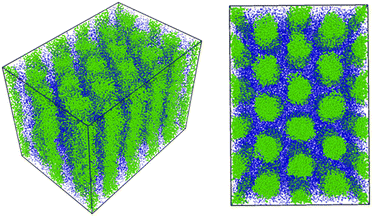 | ||
Fig. 4 The cylindrical phase as the initial condition for the DPD simulation obtained using the density-biased Monte Carlo method mentioned in ref. 27. Reactive C-monomers are not shown for visibility. We confirmed that these morphologies are stable in the simulation for 600![[thin space (1/6-em)]](https://www.rsc.org/images/entities/char_2009.gif) 000 steps. 000 steps. | ||
4 Cross-linking reaction
In the following subsections, we show the dynamics of domains triggered by the reaction-induced phase separations during the cross-linking reactions among reactive C-monomers in our DPD simulation. For the case of the rapid reaction where the cross-linking reaction is so fast that the initial domains cannot deform, we show that the domain morphology is fixed as it was in the initial structure. On the other hand, for the slow reaction case where morphological domains can deform and reconnect with each other, the initial microphase-separated structure transforms into other structures depending on the degree of convergence of the cross-linking reaction. These dynamics are then further studied in detail.4.1 Domain growth dynamics
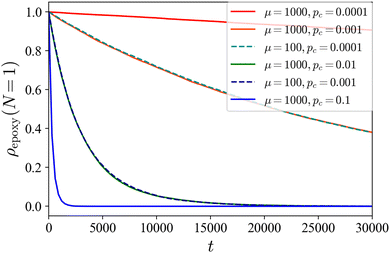
According to Lipic et al.,14 the reaction-induced morphological transitions were experimentally observed for a mixture of PEO–PEP and epoxy (BPA348), and the mechanism of these transitions is explained in their paper as follows: in the initial equilibrium state, the PEO sub-chain of the diblock copolymer and the epoxy are miscible. When the cross-linking reaction occurs, the molecular weight of the epoxy networks becomes larger, which results in a decrease in the translational entropy of the epoxy molecules. This decrease of the translational entropy leads to the segregation between the PEO block and the epoxy network. At the same time, the curvature of the interface of PEO–PEP reduces because the effective volume fractions of PEO blocks swollen by the epoxy decreases as a result of their segregation. The mechanism explained above is consistent with the morphological transition from the gyroid to the lamellar phase, and that from the spherical to the cylindrical phase during the curing process observed in the experiment.14In the following discussion, we show that the above explanation is confirmed by our DPD simulations. First, we verify whether our simple cross-linking reaction scheme works. Fig. 5 shows the temporal change in the ratio of the number of unreacted C-monomers to the total number of C monomers in the system ρepoxy(N = 1) during the cross-linking reactions for the case of initial cylindrical phase. In our scheme, as the value of pc decreases, the rate at which the number of unreacted monomers decreases slows down. In addition, when the product of μ−1 and pc is kept constant, ρepoxy(N = 1) decreased similarly. We use μ = 100 throughout our study.
To observe the reaction-induced morphological transitions during the cross-linking reaction, we prepare the cylindrical phase as the initial condition. We did not observe the morphological transition when we prepared the lamellar phase as the initial condition (not shown). In our study, three different cases are shown: (i) the moderate cross-linking reaction with pc = 0.01, (ii) the slow cross-linking reaction with pc = 0.0001, and (iii) the rapid cross-linking reaction with pc = 1.0. This is justified by the following estimation: the relaxation time τ of the chain conformation with N = 10 in our system is roughly estimated as τ ∼ 100.23 Now we define the reaction rate, i.e., the occurrence probability of the reaction during the unit time pc,unit = pc/(μδt) according to the relation shown in Fig. 5. We can regard pc,unit as a reciprocal of the characteristic time for the growth of the cross-linking network, and then a dimensionless constant τpc,unit gives 16, 0.16, and 0.0016 for pc = 1.0, 0.01, and 0.0001, respectively. Therefore, if τpc,unit ∼ 1, the growth of the cross-linking network is on the same order of the relaxation of the chain, which corresponds the case (i). For the case of τpc,unit ≪1 (≫1), the network growth is much slower (faster) than the relaxation of the chain, which corresponds to cases (ii) ((iii)). We discuss case (iii) in the next subsection.
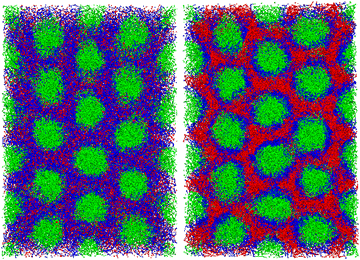
Fig. 6 shows the morphological transition in case (i). In this case, the cylindrical domains quickly transform into irregular lamellar structures. On the other hand, when the reaction probability is low as in case (ii), an ordered lamellar structure appears as shown in Fig. 7. We provide movies of temporal evolution of domain morphologies in each case as shown in the ESI.† In the provided movies, the reactive C-monomers are not shown for visibility of domains formed by diblock copolymers. It should be noted that these morphological transitions occur even if the mixing of the A-block of the diblock copolymer and the reactive C monomers is athermal. These morphological transitions can be purely caused by the decrease in the translational entropy of reactive monomers owing to the cross-linking reactions, even if there is no repulsive interaction among particles. In the case where the mixing of the A-block of the block copolymer and the reactive C monomer is not athermal, the partial compatibility may cause a nontrivial change in the result,39 which is beyond the scope of this study.
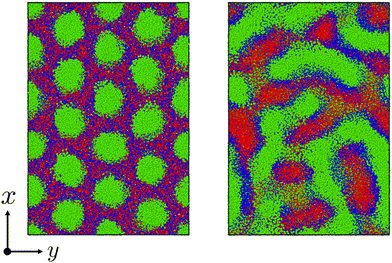 | ||
| Fig. 6 The time evolution of the domain morphology starting from the cylindrical phase under the cross-linking reaction with the moderate reaction probability pc = 0.01. (left) t = 0, (right) t = 6000. In these figures, only particles are visualized without bonds. To view the temporal evolutions of domain morphologies, see the movie in the ESI.† | ||
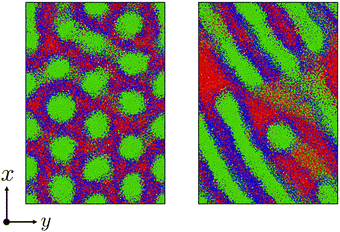 | ||
Fig. 7 Similar to Fig. 6 but with a low reaction probability pc = 0.0001. (left) t = 26![[thin space (1/6-em)]](https://www.rsc.org/images/entities/char_2009.gif) 400, (right) t = 48 400, (right) t = 48![[thin space (1/6-em)]](https://www.rsc.org/images/entities/char_2009.gif) 000. To view the temporal evolutions of domain morphologies, see the movie in the ESI.† 000. To view the temporal evolutions of domain morphologies, see the movie in the ESI.† | ||
Fig. 8 shows the instantaneous one-dimensional density profiles for each type of monomer. To calculate the continuous density distribution for each type of monomer from their coordinates, we use the extrapolation method, in which the density distributions on lattice points are calculated using the linear extrapolation function
 | (14) |
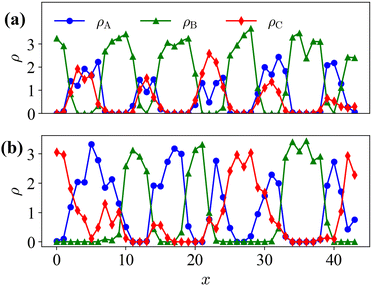 | ||
Fig. 8 Instantaneous one-dimensional density profile for each type of monomer along the x-axis at y = Ly/2 and z = Lz/2. (a) Initial condition t = 0 (Fig. 6(left)), and (b) t = 48![[thin space (1/6-em)]](https://www.rsc.org/images/entities/char_2009.gif) 000 for the case of pc = 0.0001 (Fig. 7(right)). 000 for the case of pc = 0.0001 (Fig. 7(right)). | ||
4.2 Domain spacing by cross-linking networks
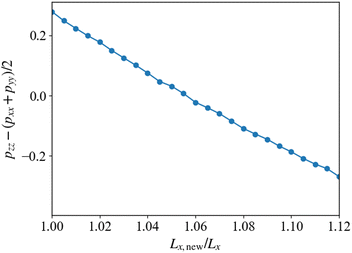
In this subsection, we discuss the morphological behavior after the cross-linking reaction with pc = 1.0, which we mentioned as case (iii) in the last subsection. When the formation of the cross-linking network is fast, we observe that the initial morphologies are preserved because the cross-linking network does not allow the cylindrical domains to deform and reconnect. Fig. 9 shows the cylindrical phase before and after the cross-linking reaction takes place. After the cross-linking reaction, the A-blocks of the diblock copolymer strongly segregate from the network matrix because the monomers lose their translational entropy due to the cross-linking reaction. In the experiment conducted by Lipic et al.,14 when the cross-linking reaction proceeds while the cylindrical domain morphology is preserved, a change in domain spacing (spacing between neighboring cylinders) is observed. To confirm the change in the domain spacing after the cross-linking reaction in DPD simulation, we estimate the most stable system size of the simulation box by measuring the anisotropy of the pressure. In order to measure anisotropy of the pressure, we first prepare an equilibrium system where Pxx = Pyy = Pzz is satisfied, and then we measure the pressure difference Pzz − (Pxx + Pyy)/2 after the cross-linking reaction by changing the system size in the parallel direction to the original cylindrical domains. After such preparation, we adjust the system sizes appropriately to find the isotropic equilibrium state.Fig. 10 shows the pressure difference after the cross-linking reaction. The simulations are performed by changing the system size Lx in the direction parallel to the cylindrical axis, where the total volume of the simulation box is kept constant. The horizontal axis shown in Fig. 10 represents the ratio of the simulated system size Lx,new to its original size before the cross-kinking reaction occurs, Lx. The vertical axis shows the anisotropy in the pressure tensor, whose zero value means that the system realizes an isotropic state with the deformed simulation box with Lx,new/Lx. When this ratio is unity, the anisotropy of the pressure tensor deviates from zero, which indicates that the structural anisotropy emerges due to the cross-linking reaction. To recover the isotropy of the pressure, we enlarge the system size Lx and Ly, and simultaneously reduce Lz to keep the system volume constant. Using this procedure, we obtain a state where an isotropic pressure is realized when Lx,new ≈ 1.055Lx. This suggests that the system expands in the direction parallel to xy-plane, that is, the plane perpendicular to the cylindrical axis, and shrinks along the direction parallel to the cylindrical axis (z-axis) during the cross-linking reaction. This behavior originates from the segregation between the B-block of the diblock copolymers and the monomers driven by the cross-linking reaction. When the cross-linking reaction occurs, the segregation becomes stronger because the monomers lose their translational entropy for mixing. This segregation causes an effective repulsive interaction between cylindrical domains. The enhancement of this immiscibility between the two phases inside and outside the cylindrical domains leads to an increase in the domain periodicity in the xy-plane. However, such a repulsion of the domains is compensated by the elastic force of the cross-linking network formed from the monomers. A balance between the repulsion force and the elastic attractive force determines the new equilibrium state. The similar behavior was observed in the experiment.13
4.3 Morphological order for slow reactions
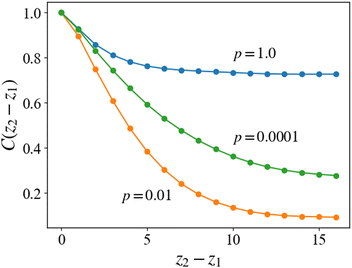
Here we discuss the dependence of the ordering kinetics on the reaction probability. In the previous subsections, we show the dynamics of morphological transition from the cylindrical structure to the lamellar structure during the cross-linking reaction, and we observe that the reaction probability pc determines whether the system transforms into a regular (well-ordered) or irregular lamellar structure. To evaluate the dependence of ordering of the domain structure on the reaction probability pc, we define the following correlation function: | (15) |
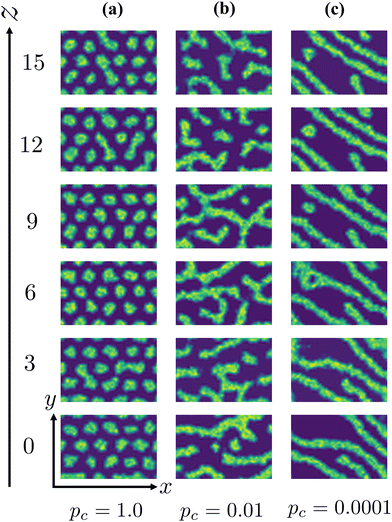
For the case of pc = 1, which corresponds to the case of Fig. 9, the two-dimensional structure retains high correlation even for the two-dimensional cross-sections far from each other. The cross-linking network formed under the rapid reaction condition, as mentioned in the last subsection, does not allow the cylindrical domains to deform, and the cylindrical domains are preserved by the surrounding networks, as shown in Fig. 12(a). This leads to high correlation along the z-axis in the same manner as in the equilibrium state.
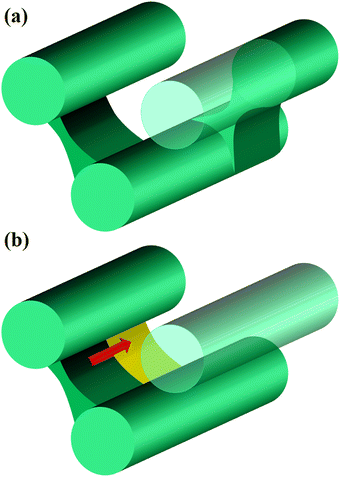
For the cases of pc = 0.01 and 0.0001, the formation of cross-linking networks is rather slow and the domains can deform and reconnect with each other, leading to a reaction-induced cylinder-lamellar transition. As a result, the morphological transitions from cylinderical to lamellar structures are observed for both cases with pc = 0.01 and pc = 0.0001. However, the case with pc = 0.0001 shows a correlation higher than the case with pc = 0.01. This result suggests that ordering in the lamellar domains is promoted when the reaction is slow (pc = 0.0001), while the lamellar domains are irregular when the reaction probability is moderate (pc = 0.01), as shown in Fig. 12(b) and (c). These different behaviors are similar to those of reaction-induced viscoelastic phase separation.40Fig. 13 depicts the intuitive explanation of the two processes of the connections of cylinders during cross-linking reactions. In the case of the moderate reaction rate, reactive monomers surrounding the cylindrical domains form a cross-linking network, whereby the translational entropy decreases rapidly and uniformly along the cylindrical domains, which causes an instability of the domain morphology similar to the spinodal decomposition (Fig. 13(a)). This leads to the random connections between cylindrical domains, where a given domain connects to some neighboring domains along the cylindrical axis. These random connections result in irregular lamellar structures in the case of moderate reaction probability. On the other hand, in the case of the slow reaction rate, the formation of the cross-linking networks proceeds gradually. When the cross-linking networks develop locally, a rung between neighboring cylinders is formed through an activation process due to thermal fluctuation. Once a rung is formed, it expands quickly along the cylindrical domain, leading to a formation of sheet-like domains. (Fig. 13(b)). As a result, a cylindrical domain is connected with fewer rungs to its neighboring cylinders in a regular manner compared to the case of the moderate reaction probability.
5 Conclusions
In the present study, we perform DPD simulation to investigate the reaction-induced morphological transitions in a blend of symmetric diblock copolymers and reactive monomers. To prepare the true equilibrium state as an appropriate initial condition for the DPD simulation, we perform the SCFT calculation combined with the density-biased Monte Carlo method. Our SCFT simulation predicts the phase diagram that is consistent with the experimental results in the intermediate segregation regime with the incompatibility parameter χN. The experimentally observed morphological transitions during the cross-linking reaction from the microphase-separated structures with a high curvature to that with a lower curvature are well reproduced in our DPD simulation. Moreover, the experimental result of the increase in the domain space after the cross-linking reaction is successfully reproduced.By simulating the cross-linking reactions with various reaction probabilities, we find that the morphological transitions undergo two different mechanisms, that is, nucleation and growth in the case of the slow reaction, and spinodal decomposition in the case of the moderate reaction. These mechanisms deeply relate to the reaction-induced instability and to the spatial arrangement and regularity of the microphase-separated domains after the cross-linking reaction. Our simulations offer a possible understanding of the dynamical pathway of the transition in domain morphologies, which contributes to applications in nanotechnology engineering.
Conflicts of interest
There are no conflicts to declare.Acknowledgements
The financial support from the Cross-ministerial Strategic Innovation Promotion Program (SIP) “Materials Integration for Revolutionary Design System of Structural Materials” (Funding agency: JST) is gratefully acknowledged.References
- A. F. Yee and R. A. Pearson, J. Mater. Sci., 1986, 21, 2462–2474 CrossRef CAS.
- R. A. Pearson and A. F. Yee, J. Mater. Sci., 1986, 21, 2475–2488 CrossRef CAS.
- R. A. Pearson and A. F. Yee, J. Mater. Sci., 1989, 24, 2571–2580 CrossRef CAS.
- A. Allaoui, Compos. Sci. Technol., 2002, 62, 1993–1998 CrossRef CAS.
- Z. Ahmadi, Prog. Org. Coat., 2019, 135, 449–453 CrossRef CAS.
- T. Okabe, T. Takehara, K. Inose, N. Hirano, M. Nishikawa and T. Uehara, Polymer, 2013, 54, 4660–4668 CrossRef CAS.
- B. A. Alshammari, M. S. Alsuhybani, A. M. Almushaikeh, B. M. Alotaibi, A. M. Alenad, N. B. Alqahtani and A. G. Alharbi, Polymers, 2021, 13, 2474 CrossRef CAS PubMed.
- J. Wu, Y. S. Thio and F. S. Bates, J. Polym. Sci., Part B: Polym. Phys., 2005, 43, 1950–1965 CrossRef CAS.
- E. Serrano, M. D. Martin, A. Tercjak, J. A. Pomposo, D. Mecerreyes and I. Mondragon, Macromol. Rapid Commun., 2005, 26, 982–985 CrossRef CAS.
- L. Ruiz-Pérez, G. J. Royston, J. P. A. Fairclough and A. J. Ryan, Polymer, 2008, 49, 4475–4488 CrossRef.
- H. Kishi, Y. Kunimitsu, J. Imade, S. Oshita, Y. Morishita and M. Asada, Polymer, 2011, 52, 760–768 CrossRef CAS.
- H. Kishi, Y. Kunimitsu, Y. Nakashima, T. Abe, J. Imade, S. Oshita, Y. Morishita and M. Asada, EXPRESS Polym. Lett., 2015, 9, 23–35 CrossRef.
- M. A. Hillmyer, P. M. Lipic, D. A. Hajduk, K. Almdal and F. S. Bates, J. Am. Chem. Soc., 1997, 119, 2749–2750 CrossRef CAS.
- P. M. Lipic, F. S. Bates and M. A. Hillmyer, J. Am. Chem. Soc., 1998, 120, 8963–8970 CrossRef CAS.
- K. Yamanaka and T. Inoue, Polymer, 1989, 30, 662–667 CrossRef CAS.
- K. Yamanaka, Y. Takagi and T. Inoue, Polymer, 1989, 30, 1839–1844 CrossRef CAS.
- H. Liu, H.-J. Qian, Y. Zhao and Z.-Y. Lu, J. Chem. Phys., 2007, 127, 144903 CrossRef PubMed.
- A. A. Gavrilov, D. V. Guseva, Y. V. Kudryavtsev, P. G. Khalatur and A. V. Chertovich, Polym. Sci., Ser. A, 2011, 53, 1207–1216 CrossRef CAS.
- S. Thomas, M. Alberts, M. M. Henry, C. E. Estridge and E. Jankowski, J. Theor. Comput. Chem., 2018, 17, 1840005 CrossRef CAS.
- C. Li and A. Strachan, Polymer, 2018, 149, 30–38 CrossRef CAS.
- P. J. Hoogerbrugge and J. M. V. A. Koelman, Europhys. Lett., 1992, 19, 155–160 CrossRef.
- R. D. Groot and P. B. Warren, J. Chem. Phys., 1997, 107, 4423–4435 CrossRef CAS.
- R. D. Groot and T. J. Madden, J. Chem. Phys., 1998, 108, 8713–8724 CrossRef CAS.
- G. Kacar, E. A. J. F. Peters and G. de With, Soft Matter, 2013, 9, 5785 RSC.
- M. Langeloth, T. Sugii, M. C. Böhm and F. Müller-Plathe, J. Chem. Phys., 2015, 143, 243158 CrossRef PubMed.
- Y. Kawagoe, G. Kikugawa, K. Shirasu and T. Okabe, Soft Matter, 2021, 17, 6707–6717 RSC.
- T. Aoyagi, F. Sawa, T. Shoji, H. Fukunaga, J. Takimoto and M. Doi, Comput. Phys. Commun., 2002, 145, 267–279 CrossRef CAS.
- https://octa.jp/ .
- Nanostructured Soft Matter, ed. A. V. Zvelindovsky, Springer, Netherlands, 2007 Search PubMed.
- M. W. Matsen, J. Chem. Phys., 2020, 152, 110901 CrossRef CAS PubMed.
- M. W. Matsen, Phys. Rev. Lett., 1995, 74, 4225–4228 CrossRef CAS PubMed.
- M. W. Matsen, Macromolecules, 1995, 28, 5765–5773 CrossRef CAS.
- A. N. Semenov, Macromolecules, 1993, 26, 2273–2281 CrossRef CAS.
- A. E. Likhtman and A. N. Semenov, Macromolecules, 1997, 30, 7273–7278 CrossRef CAS.
- M. W. Matsen, Macromolecules, 2003, 36, 9647–9657 CrossRef CAS.
- A. N. Semenov, Sov. Phys. JETP, 1985, 61, 733–742 Search PubMed.
- E. W. Cochran, C. J. Garcia-Cervera and G. H. Fredrickson, Macromolecules, 2006, 39, 2449–2451 CrossRef CAS.
- W. Liu, H.-J. Qian, Z.-Y. Lu, Z.-S. Li and C.-C. Sun, Phys. Rev. E, 2006, 74, 021802 CrossRef.
- A. A. Gavrilov and A. V. Chertovich, Macromolecules, 2017, 50, 4677–4685 CrossRef CAS.
- Y. Oya, G. Kikugawa, T. Okabe and T. Kawakatsu, Adv. Theory Simul., 2022, 5, 2100385 CrossRef CAS.
Footnote |
| † Electronic supplementary information (ESI) available: Movies of the morphological transitions under the cross-linking reaction discussed in Section 4.1. See DOI: https://doi.org/10.1039/d3sm00959a |
| This journal is © The Royal Society of Chemistry 2024 |

