
 Open Access Article
 This Open Access Article is licensed under a Creative Commons Attribution-Non Commercial 3.0 Unported Licence
Adsorptive denitrogenation of model fuel with silica gel†
Peipei
Wang
 a,
Jian
Liu
a,
Difan
Zhang
a,
Daniel
Chambers
b,
Shuyun
Li
a and
Daniel
Santosa
*a
a,
Jian
Liu
a,
Difan
Zhang
a,
Daniel
Chambers
b,
Shuyun
Li
a and
Daniel
Santosa
*a
aPacific Northwest National Laboratory, Richland, WA 99354, USA. E-mail: daniel.santosa@pnnl.gov
bNortheastern University, Boston, MA 02115, USA
First published on 13th August 2024
Abstract
Utilization of wet waste to produce renewable fuels, including aviation fuel, is key to a sustainable energy portfolio. Currently, hydrothermal liquefaction (HTL) and subsequent hydrotreating steps can successfully produce drop-in fuels which meet standards for gasoline and diesel. A remaining obstacle for development of sustainable aviation fuels (SAF) is the presence of nitrogen containing compounds (NCCs). Aviation fuels have more stringent regulations on permissible concentrations of NCCs, which have been associated with fuel instability for use in jet engines and the emission of harmful pollutants into the environment. Currently, NCCs are removed through the hydrodenitrogenation (HDN) process, which requires severe operating conditions along with significant H2 and energy consumption, resulting in yield lost due to cracking. Alternatively, adsorptive denitrogenation (ADN) is being investigated as a more energy efficient process. This work achieved over 99% nitrogen removal, supported by computational work showing nitrogen adsorption correlates with surface acidity. Among the adsorbents screened, silica gel exhibited high adsorption capacity of 150 mg g−1 for pyridine and 80 mg g−1 for indole, coupled with impressive regeneration performance through thermal treatment. The recyclability of the silica gel showed good adsorption efficiency of NCCs for up to five cycles. This research demonstrates mechanism of nitrogen removal using adsorption technologies for future waste-derived aviation fuel.
1 Introduction
1.1 HTL and nitrogen compounds
The demand for energy has been steadily increasing alongside the rapid growth of the global economy.1 To reconcile growing energy demands and goals for net-zero carbon emissions, fossil fuels must be supplemented with drop-in sustainable fuels.2 This is particularly true for aviation fuel blend stocks. One promising technique to produce SAFs is HTL, which allows for the effective utilization of wet waste biomass without prior drying. An important consideration when deriving fuel products from protein-containing feedstocks, is that the biocrude will contain high concentrations of NCCs and various aromatic compounds.3,4 Fuel specifications are more lenient regarding NCC content in ground transportation fuels; however the presence of NCCs in jet fuels are not permitted due to poor thermal stability, freeze point, and specific energy properties.5 Additionally, NCCs can clog burners and injectors within petroleum processing units, resulting in gum residue build-up.6,7 NCCs in fuel can be categorized as basic nitrogen compounds (e.g., heterocyclic aromatics such as pyrazines, pyridines, anilines, and quinolines) and “neutral” nitrogen compounds (e.g., indoles, carbazoles, and pyrroles).2–14 The “neutral” NCCs are less basic heterocyclic aromatic compounds where nitrogen's lone pair is resonance delocalized within an aromatic ring. More basic NCCs have a lone pair that is orthogonal to the aromatic π-system.1.2 Separation methods
Currently, NCCs from fossil-based fuels are traditionally converted to hydrocarbons through the HDN process, which requires harsh operating conditions as high as 150 bar and more than 400 °C along with significant H2 and energy consumption.8–10 Furthermore, NCCs can also be removed by solvent extraction.11 This method has not gained popularity attributed to its complexity and large amount of solvent required. The solvents used not only contribute to the overall cost of the process, but also raises concerns about the environmental impact associated with the disposal or recycling of the used solvent. Adsorptive removal of NCCs is considered as the most promising alternative method to HDN due to its milder process. Additionally, if target NCC concentrations are not attainable through HDN in any particular case, an adsorptive process may be considered useful in tandem with an HDN process.1.3 Adsorption
Many kinds of adsorbents have been evaluated, including MOF, activated carbon, silica gel, zeolite, activated aluminium, activated clay and polymeric resins.12–14 Mushrush et al. employed silica gel to eliminate nitrogen from various diesel fuels, achieving impressive organic nitrogen extraction rates ranging from 97.8% to 99.7%. Interestingly, silica gel demonstrated notable selectivity for nitrogen-containing compounds, despite its exclusive physisorption of these compounds.15 Limited studies have explored the application of MOFs with actual industrial feed materials. It was reported that functionalized MOF has the capability to remove indole and quinoline from model oils, with success attributed to hydrogen bonding between the neutral nitrogen and sulfonic or carboxylic groups on the MOF.16 However, more work is required to investigate MOF usage for fuel adsorption, because of its high cost, and inability to regenerate.17CuY zeolite effectively decreased the nitrogen content in commercial diesel oil from 83 ppm to 0.1 ppm through the formation of π-complexes between nitrogen compounds and the zeolite.18 It was reported that Amberlyst-15, a highly acidic resin, successfully eliminated basic nitrogen compounds from hydrotreated jet fuel.19 In other studies, ion-exchange resins were found to remove 41% of the neutral nitrogen compounds from fuel oil.20 The efficiency of denitrogenation through adsorption using activated carbon relies on both its surface area and chemical composition. The findings indicate that activated carbon with elevated oxygen content interacts with nitrogen compounds through acid–base and hydrogen-bonding interactions. Activated carbon surfaces with lower oxygen content engage in weaker π–π interactions.21 Activated alumina demonstrated a capability to eliminate 99.29% of basic nitrogen from gasoline.22 In conjunction with experimental investigation, computational modelling has also been employed to provide insights into the removal of NCCs. For instance, molecular simulations have been used to assess extractive denitrogenation by deep eutectic solvents23 and ionic liquids;24 along with ADN by solid adsorbent materials such as polymers, oxides, and MOFs.25–27 Density functional theory (DFT) modelling also provides an accurate evaluation of the interactions between the hosts (sorbent materials, solvents) and guests (NCCs). The adsorption energies of several NCCs were quantified by DFT calculations in zeolites,28 MOFs,29 and ionic liquids.30 The binding energies derived from these computations has allowed for a deeper understanding of different denitrogenation processes, facilitating the development of efficient materials and processes for targeted denitrogenation.
1.4 Adsorbent work in this study
The goal of this work was to develop technology for the removal of NCCs from HTL-derived upgraded fuels using ADN, employing a cost-effective adsorbent and a simple method. In this paper, different adsorbents were thoroughly investigated for the removal of NCCs using batch adsorption tests. The adsorption equilibrium, kinetics, and optimal ratio of adsorbent to oil for the removal of NCCs were evaluated, along with the potential for adsorbent regeneration. In addition, computational modelling was performed by DFT calculations on representative sorbents to understand their atomic-level binding to NCCs. A preliminary economic analysis was done to estimate the potential cost of using silica gel as the adsorbent to remove NCCs without regeneration.2 Experimental procedures
2.1 Screening of adsorbents
The detailed information about the source of the chemicals and materials was included in the ESI.† The screening of adsorbents through a batch adsorption screening tests their ability to adsorb specific compounds from a surrogate fuel. In this case, the surrogate fuel was prepared using pyridine and indole dissolved in decane. The concentrations of pyridine and indole in the surrogate fuel were 0.57 wt% (1000 ppm basic N) and 0.42 wt% (500 ppm neutral N), respectively. To conduct the batch test in a vial, Fuel/adsorbent (g/g) at 2/1 and 100/1 were tested. The mixture was then stirred at a speed of 300 rpm for a duration of 24 hours. During this time, the adsorbent interacted with the surrogate fuel, allowing for the adsorption of the target compounds (pyridine and indole) onto the surface of the adsorbent. After the 24 h period, the mixture was separated by syringe filtration and then the resulting liquid phase was analysed by GC-FID and trace nitrogen analysis to determine the amount of pyridine and indole that had been adsorbed.2.2 Isotherm test from batch experimental procedure
The purpose of adsorption isotherm test in batch mode is to investigate the adsorption behaviour. Equilibrium experiments were performed using a series of surrogate fuel solutions with varying concentrations of pyridine (0.024–0.57 wt%) and indole (0.019–0.42 wt%). A known weight of surrogate fuel was added to separate 20 ml glass vials, along with a predetermined mass of the adsorbent. The vials were then sealed to prevent evaporation or contamination, then placed on aluminium blocks fitted to heated stir plates at 20, 40, or 60 °C for 24 h. The adsorbent studied include various zeolites, activated carbon, silica gels, and Amberlyst resins. The fuel/adsorbent ratio and the equilibrium time may vary depending on the characteristics of the system, the concentration of functional groups on the surface, and the porosity of the sorbent. After equilibration, about 1 ml of liquid was extracted and filtered using a syringe filter. The concentration of the target molecule in the liquid phase was then measured using GC equipped with FID.The amount of NCCs adsorbed onto the adsorbent material is determined by calculating the difference between the initial and final concentrations of NCCs. The data is then used to plot the adsorption isotherm, which represents the relationship between the equilibrium concentration of the target substance and the amount adsorbed onto the adsorbent material. Data analysis, such as fitting the experimental data to Langmuir model, was performed to extract relevant parameters such as maximum adsorption capacity and adsorption affinity.
2.3 Kinetic test from batch experimental procedure
In addition to adsorption isotherms, kinetic experiments were also conducted to study the rate at which adsorption or desorption occurs over time and to understand the possible adsorption mechanisms. 2 g different adsorbents were added into 100 g surrogate fuel containing 0.57 wt% pyridine and 0.42 wt% indole. The mixture was then stirred at room temperature (300 rpm) for 24 h. Periodically, 0.5 ml liquid samples were extracted and filtered, for subsequent GC-FID analysis. More frequent sampling was done early in the experiment to capture initial adsorption/desorption behaviour.2.4 Computational method
DFT calculations were performed to optimize the adsorption configurations of NCCs on adsorbent surfaces and quantify their interaction energies. All DFT calculations were carried out using ORCA31 at the PBE0/6-311G(d,p) level of theory,32 with Grimme's D3 van der Waals correction33 The electronic energy was converged self-consistently to thresholds of 10−8 a.u. All geometries were optimized until atomic forces were less than 0.02 eV Å−1 and the resulting optimized structures were verified as local minima by vibrational frequency analysis. A pre-optimization using xTB software with GFN2-xTB method34 was performed to obtain reasonable initial structures before DFT optimizations in ORCA. The SMD implicit solvent model35 of n-decane was considered in DFT calculations to mimic the surrogate fuel examined in our experiments.3 Result and discussion for adsorption batch test
3.1 Adsorption selectivity
Eleven adsorbent materials were evaluated with diverse physicochemical properties for the purpose of nitrogen (N) removal (see Table 1 and Fig. S1†). Notably, some of these adsorbents stood out by achieving an impressive N removal rates of over 99% as shown in Table 1. To encapsulate the range, four representative adsorbents were selected from this group, each falling into a distinct category: Amberlyst 36 (Am36), silica gel (S736-1), zeolite beta, and activated carbon (AC). Am36 was selected over Am15 for further studies despite comparable extraction efficiencies because Am-15 is a macroreticular polystyrene resin which swells more when it interacts with suitable solvents. Swelling of the resins could pose issues with process development when scaling-up.![[thin space (1/6-em)]](https://www.rsc.org/images/entities/char_2009.gif) :1, 40 °C 24 h
:1, 40 °C 24 h
| Adsorbents | N removal (%) | Final N conc. (ppm) |
|---|---|---|
| Amberlyst-15 | 99.9 | 1.4 |
| Amberlyst-16 | 20.6 | 1254 |
| Amberlyst-36 | 99.9 | 1.4 |
| Amberlyst-45 | 12.2 | 1388 |
| SiO2 gel (S736) | 99.7 | 4.1 |
| SiO2 gel (S745) | 98.9 | 15 |
| Zeolite beta | 99.9 | 1.4 |
| Zeolite 4A | 37.3 | 990 |
| Zeolite Y | 99.9 | 1.4 |
| Activated alumina | 98.8 | 16 |
| Activated carbon | 90.1 | 130 |
Fig. 1 shows the adsorption of pyridine and indole with different surrogate fuel-to-adsorbent ratios. The primary objective was to assess and compare the nitrogen removal (Fig. 1(a)) and adsorption capacity (Fig. 1(b)) of the four different adsorbents under the specified conditions. By varying the fuel-to-adsorbent ratio from 50/1, 10/1 to 2/1, the efficacy of each adsorbent can be assessed, and an optimal fuel-to-adsorbent ratio can be established. Overall, NCC removal increased with decreasing fuel-to-adsorbent ratio. Nitrogen removal drops below 90% with fuel-to-adsorbent ratios of 50/1. Conversely, the nitrogen adsorption capacity showed a decline as the fuel/adsorbent ratio decreased. Taking Am36 as a representative example, the amount of nitrogen adsorbed decreased from 64 mg g−1 to 3 mg g−1 as the fuel/Am36 ratio decreased from 50/1 to 2/1. This observation can be attributed to the excess Am36 present at the 2/1 ratio, indicating that Am36 was not fully saturated under these conditions.
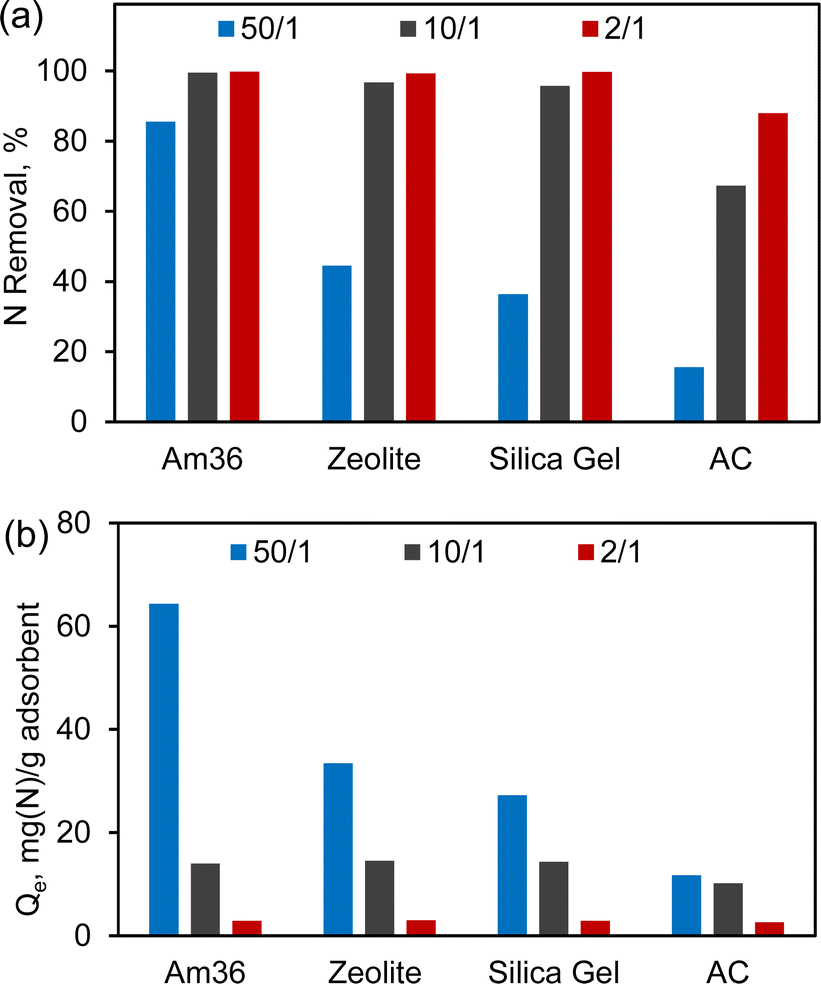 | ||
| Fig. 1 Nitrogen heteroatom removal (a) and adsorption capacity (Qe) (b) over different adsorbents with different fuel/adsorbent ratio. Adsorption under 40 °C and 24 h. | ||
3.2 Adsorption isotherm
To gain deeper insights into the adsorption behaviour of pyridine and indole, the adsorption isotherms were investigated across the four representative adsorbents at varying temperatures (Fig. S2†). The isotherm profiles of these four adsorbents at room temperature were subsequently summarized in Fig. 2(a) and (b). The pyridine and indole isotherm data were fitted to the Langmuir model using eqn (1) and shown in Fig. 2(c) and (d), the resulting Langmuir parameters such as maximum adsorption capacity (Qm) and adsorption affinity (k) being calculated and summarized in Table 2.36| 1/Qe = 1/Qm + 1/kQmCe | (1) |
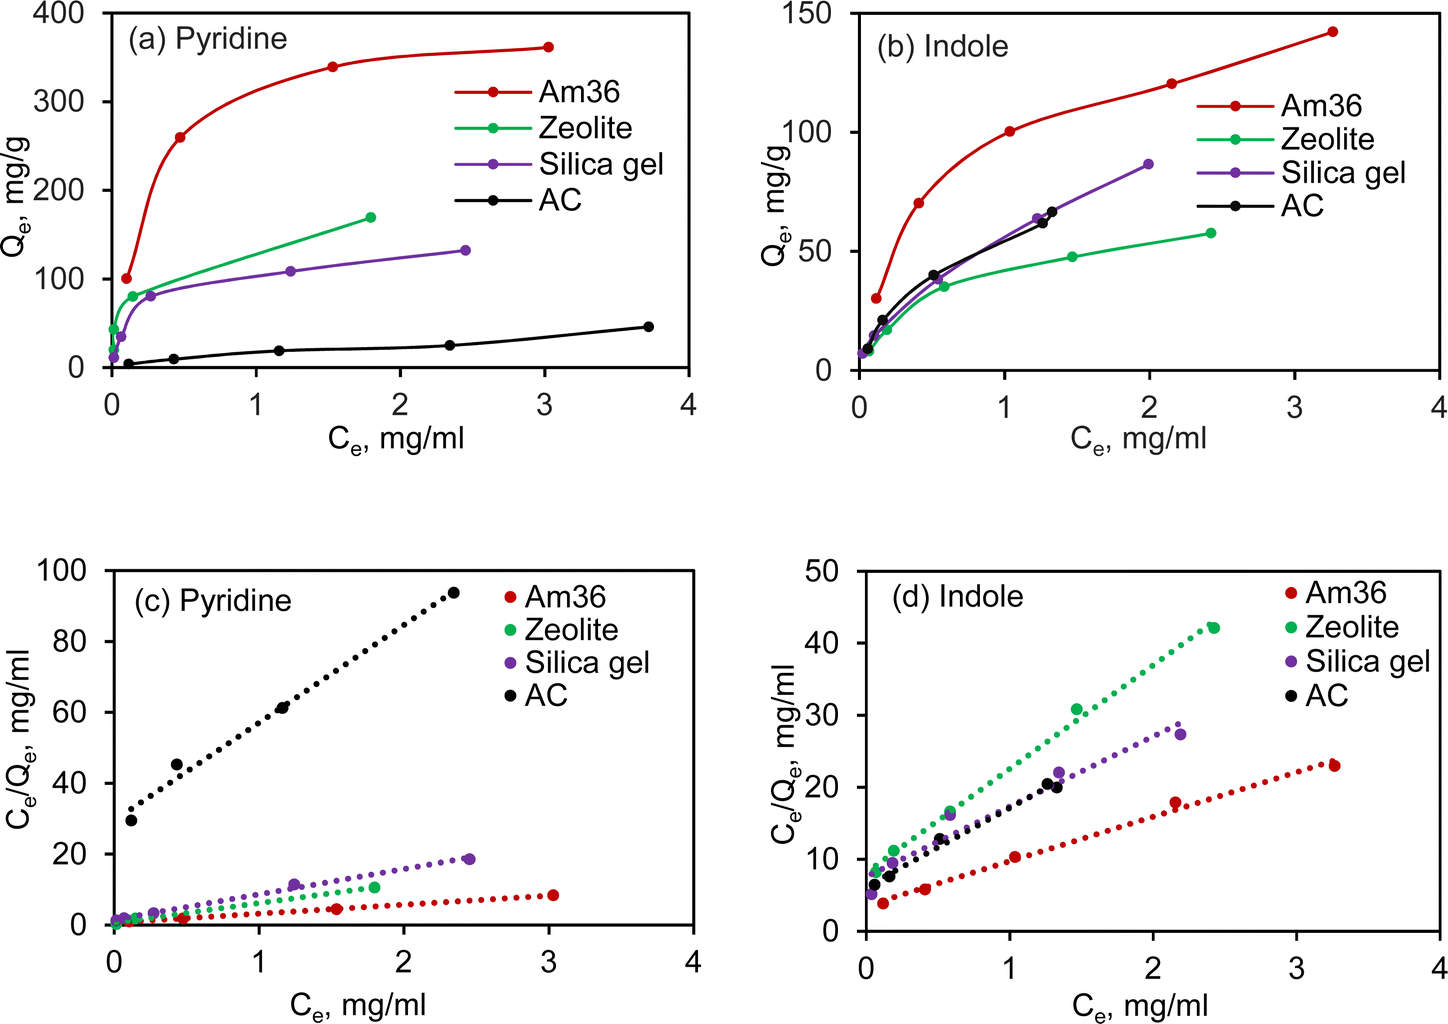 | ||
| Fig. 2 Equilibrium adsorption isotherms of (a) pyridine and (b) indole adsorption, and Langmuir plots (c) pyridine and (d) indole over Amberlyst 36, zeolite, silica gel and activated carbon at room temperature. Ce is the concentration of pyridine in milligrams (mg) per milliliter (ml) of decane. Qe is weight of pyridine in mg per gram of adsorbent. | ||
| Adsorbents | Pyridine Qm (mg g−1) | k (L g−1) | Indole Qm (mg g−1) | k (L g−1) |
|---|---|---|---|---|
| Am36 | 390.38 | 4.21 | 161.84 | 1.73 |
| Zeolite | 141.23 | 6.79 | 69.53 | 2.50 |
| Silica gel | 152.34 | 7.04 | 80.06 | 2.94 |
| AC | 36.26 | 0.93 | 98.59 | 1.56 |
Notably, among the adsorbents, Am36 exhibited the highest adsorption capacity for pyridine and indole. Zeolite also demonstrated notable adsorption capabilities. Silica gel, on the other hand, displayed a Qm of 152.3 mg g−1 for pyridine and 80.0 mg g−1 for indole, with the highest k value of 7.04 L g−1 and 2.94 L g−1 for pyridine and indole, respectively. Activated carbon had the lowest adsorption capacity towards pyridine among the tested adsorbents, but higher indole adsorption capacity compared to pyridine. Some of these phenomena will be discussed in greater detail in Section 3.6.
Overall, silica gel and zeolite exhibits faster adsorption towards both pyridine and indole, which might be attributed to the high surface area, large pore volume, and coupled with the acidity/polarity of the sorbent material. The adsorption rate follows the order of silica gel > zeolite > Am36 > AC. Isotherm data (Fig. S2†) supports the primary hypothesis that stronger interaction occurs between NCCs and more acidic surfaces such as Am36 and zeolite which contain acidic functional groups on the surface. Adsorption capacity and rates increased with increasing temperature, and weaker interactions occurred between NCCs and the least acidic surfaces (silica gel, activated carbon).
3.3 Adsorption kinetics
The adsorption kinetics are closely related to adsorption efficiency, which varies due to differences in adsorbents chemical structures. As illustrated in Fig. 3 and S3,† the adsorption kinetics of pyridine and indole were investigated by plotting adsorption capacity against time. Both pyridine and indole exhibited similar trends in adsorption capacity and rate compared to the data derived from the isotherm data. For Am36, adsorption gradually increased with increasing adsorption time and reached equilibrium after 24 hours. Am36, on the other hand, displayed the slower adsorption rate but the highest adsorption capacity. This phenomenon is due to NCCs chemical affinity for the for the sulfonic acid functional groups (ca. 5.4 mmol g−1) on the surface of the resin. Although Am36 offers a slower adsorption rate, Am36 compensates with a highest adsorption capacity among all 4 representative adsorbents. This makes Am36 an excellent choice for certain applications that require prolonged retention of adsorbate species, provided that greater residence times are permissible during this particular chromatographic separation. In the case of zeolite, silica gel, and activated carbon, there was a rapid initial increase in adsorption capacity within the first 10 min and equilibrium was reached within 1 h. Activated carbon exhibited the slowest adsorption rate and capacity for both pyridine and indole. Notably, both zeolite and silica gel demonstrated a higher absorption rate than activated carbon, however silica gel exhibits the highest adsorption capacity within the first 10 minutes, making it the best candidate for application and consequently enhancing throughput.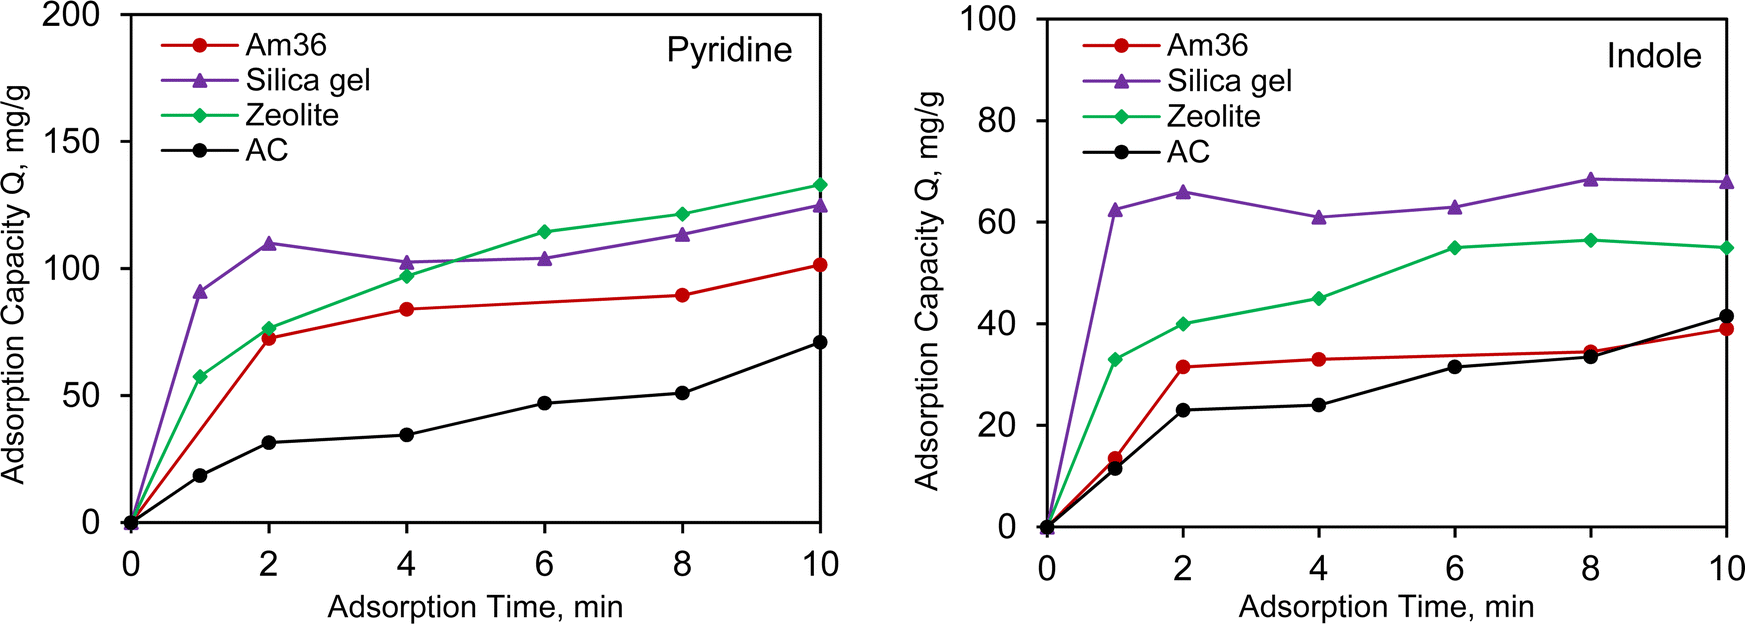 | ||
| Fig. 3 Effect of adsorption time on the adsorbed amounts of (left) pyridine and (right) indole. The initial concentration of pyridine and indole in surrogate fuel was 1000 ppm N from pyridine, 500 ppm N from indole, surrogate fuel/adsorbent = 50:1, 20 °C. | ||
The pseudo-first-order and pseudo-second-order kinetic models were fitted to the kinetic data using eqn (2) and (3).36
| ln(qe − qt) = lnqe − kl × t | (2) |
| t/qt = 1/k2 × qe2 + t/qe | (3) |
3.4 Adsorbent surface-area & acidity
The physicochemical properties of adsorbents, including surface functional groups, pore structure, and pore size, exert a significant influence on the adsorption and desorption of target NCCs.38 These specific physicochemical properties for the selected adsorbents can be found in Table 3 and Fig. S4.† The table provides valuable information about the physicochemical properties of the adsorbents, including data on acidity, surface area, pore size, and pore volume for each adsorbent, enabling a comprehensive understanding of their characteristics and suitability for specific applications in the removal of target NCCs. Fig. S5† illustrates a representative NH3-TPD plot, revealing notable disparities in acid site abundance between zeolite and both SiO2 gel and activated carbon across a broad spectrum of acid strengths. Zeolite shows total acid content of 0.7 mmol g−1,39,40 It shows a substantial surface area of 611 m2 g−1, a moderate averaged pore size of 0.67 nm, and a total pore volume of 1.1 cm3. Silica gel contains few and weak acid sites and its NH3 adsorption peak is evident at 200 °C, exhibiting much lower values for its total acid content compared to zeolite, but offers a specific surface area of 405 m2 g−1, a pore size of 9.5 nm, and a pore volume of 0.9 cm3. In contrast, activated carbon possesses a limited quantity of acid sites, resulting in minimal acidity throughout the entire temperature range examined, but provides a remarkable surface area of 1082 m2 g−1, a pore size of 1.2 nm and pore volume of 0.7 cm3. Am 36 degrades under NH3-TPD conditions, leading to inaccurate results. Therefore, NH3-TPD analysis was not performed for this sample. Am36 possesses a total acid content of 5.4 mmol g−1 according to published technical information.41 It possesses a specific surface area of 33 m2 g−1, a relatively large pore size of 24 nm and pore volume of 0.2 cm3. The overall pyridine and indole removal increased with increasing acid strength (Am36 > zeolite > silica gel) not very relevant to surface area and pore size. However, activated carbon with higher surface area and low acidity, showed comparable performance towards indole removal. Therefore, it is believed that surface area and porosity are the keys to removing less basic nitrogen compounds via hydrogen bonds and van der Waals force.8,29,42:1, 20 °C 24 h
| Adsorbents | Total acid (mmol g−1) | BET (m2 g−1) | Pore size (nm) | Pore volume (cm3) | Pyridine removal (%) | Indole removal (%) |
|---|---|---|---|---|---|---|
| Am36 | 5.4 | 33 | 24 | 0.2 | 99.8 | 98.8 |
| Zeolite | 0.7 | 611 | 0.67 | 1.1 | 99.3 | 91.6 |
| Silica gel | 0.03 | 405 | 9.5 | 0.9 | 98.9 | 89.2 |
| AC | 0 | 1082 | 1.2 | 0.7 | 58.6 | 84.7 |
3.5 Aviation fuel adsorption
Aviation fuel, also known as jet fuel, is a specialized type of fuel for aircraft engines. Jet fuels are complex hydrocarbon that may contain nitrogen and sulphur containing compounds among other impurities.43–46 The complexity of these compounds makes selective removal of nitrogen and sulphur challenging without altering the fuel's overall composition. This difficulty is due to competitive adsorption, where different species compete for active sites on adsorbents or catalyst surfaces. For example, sulphur compounds can occupy active sites, limiting sites available for nitrogen compound adsorption and reducing the efficiency of nitrogen removal processes in NCCs.8,27 Although since nitrogen is generally more basic than sulfur, adsorptive processes which are dominated by hydrogen-bonding/acid–base chemistries should hypothetically favor NCC sequestration over the sequestration of sulfur containing compounds.Fig. S6, Tables S2 and S3† provide information of SAF feed and the performance of different adsorbents in terms of N and S removal. Am36 demonstrated high effectiveness in N removal (99.8%), but the S removal is relatively lower (22.2%). Zeolite shows excellent performance in both N (99.6%) and S (44.3%) removal. Silica gel effectively removed N (99.3%) and S (41.7%). While activated carbon has a relatively low removal rate for nitrogen (79.3%), it performs better for the removal of S containing atoms (54.8%). The adsorption data from the SAF reveals a similar trend for nitrogen (N) removal when compared to surrogate fuel: Am36 > zeolite > silica gel > AC. This consistency in the trend across actual fuel and surrogate fuel indicates that our results obtained from using the surrogate fuel can be used to predict the performance using actual fuel.
3.6 Molecular insight into NCC adsorption
To provide a better understanding on the adsorptive binding of pyridine and indole to different sorbent surfaces in experiments, the adsorption configurations of pyridine and indole were obtained on the surfaces of Am36, silica gel and AC by DFT geometric optimization, as illustrated in Fig. 4(a)–(c). Due to the impractical computational expense for modelling the entire sorbent nanostructures in DFT, truncated cluster models were used to represent different adsorbent surfaces. A similar method has been successfully applied to previous denitrification studies.25 For both pyridine and indole, their major interactions with the three sorbent surfaces are intermolecular electrostatic and van der Waals interactions. In Am36, hydrogen bonds were clearly observed between the sulfonic acid (–SO3H) functionality and the two NCCs: the N of pyridine as an acceptor, the H of indole as a donor, respectively. In silica gel, only pyridine formed a hydrogen bond with the hydroxyl (–OH) functionality, while indole found no acceptor for a hydrogen bond. Not surprisingly, no hydrogen bond was found on the AC planar surface for either pyridine or indole. However, it is noted that both pyridine and indole are adsorbed on AC surface in a configuration parallel to the planar surface that improves their p–p molecular orbital interactions.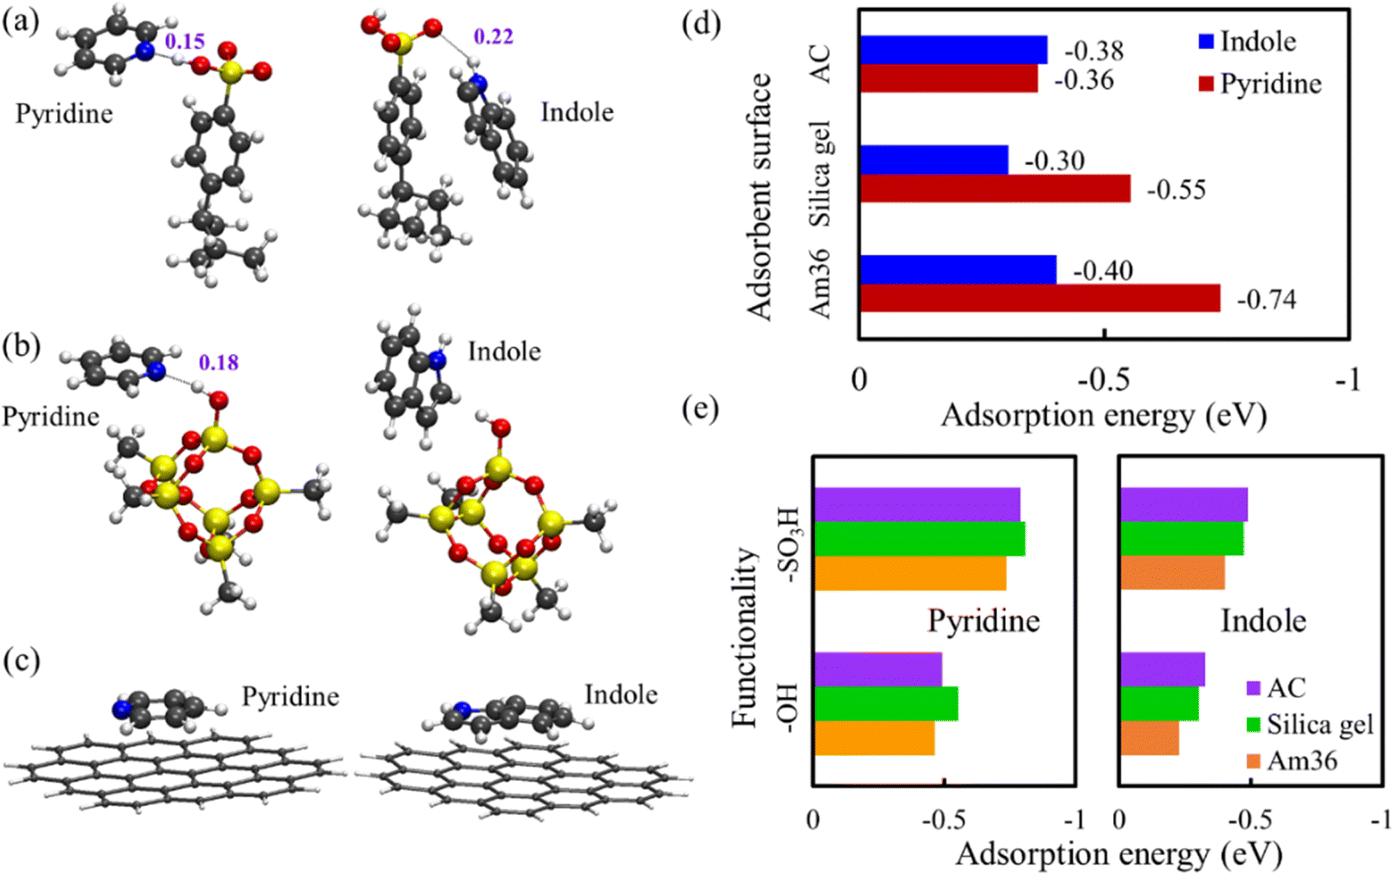 | ||
| Fig. 4 The adsorption configurations of pyridine and indole on the surface of (a) Amberlyst, (b) silica gel, and (c) activated carbon cluster models. Numbers in the plot indicate the hydrogen bonding distance (nm), if exists, between NCCs and adsorbents. Atom color scheme: C (gray), H (white), O (red), N (blue), Si (yellow). Their corresponding adsorption energies are illustrated in (d). (e) The adsorption energies of pyridine and indole interacting with functional groups on different hypothetical surface substrates. | ||
Then the adsorption energies of pyridine and indole were quantified on these surfaces in Fig. 4(d). For pyridine, Am36 demonstrates the strongest adsorption strength due to a strong hydrogen bond, while AC has the weakest interaction lacking hydrogen bonds. The hydrogen bond between pyridine and silica gel surface is weaker than that between pyridine and Am36, but it is much stronger than the p–p interaction between pyridine and AC. On the other hand, for indole, Am36 still shows the strongest binding among the three sorbent surfaces because of a hydrogen bond with moderate strength, but AC shows a comparable binding strength because of the p–p interaction. The interaction between indole and silica gel is slightly weaker since there is neither a hydrogen bond nor p–p interaction. However, the differences in the adsorption energies of the three sorbents are much smaller for indole (<0.1 eV) compared with pyridine (0.36 eV). The overall trend of the computed adsorption strength is consistent with experimental characterizations that Am36 > silica gel > AC. Our modelling also suggests that the adsorption of pyridine and indole in these sorbents is mostly weak interaction, except that pyridine/Am36 displays stronger interaction.
In addition, a hypothetical situation was computationally explored where the two functionalities (–SO3H, –OH) were placed on different surfaces (Am36, silica gel, AC), respectively. As illustrated in Fig. 4(e), changing the substrates of functional groups indeed modifies their adsorption strengths, but the magnitude of change is quite limited for all cases (typically <0.1 eV). Therefore, the selection of appropriate functionality on the sorbent surface remains to be key to change the sorbent/NCC interaction. Still, the choice of substrates can fine-tune the adsorption strength, and it also impacts the pore networks of solid sorbents (e.g., porosity) or the rigidity of polymeric resins, which eventually influences the transport of NCCs and their kinetics during ADN. It is also noted that although Am36 provides the strongest binding, it can also make desorption with single solvent more difficult. Since AC shows low affinity to NCCs, silica gel may be an appropriate trade-off between adsorption capacity and desorption difficulty.
3.7 Silica gel regeneration
Our results have effectively demonstrated SiO2 gel as the optimal adsorbent for commercial use, owing to its high adsorption capacity and rapid adsorption rate. Regeneration of adsorbents is typically a better approach than disposal after each use cause disposing the adsorbent may have adverse environmental impact.47 The regeneration of silica gel can be achieved through either solvent extraction or post-calcination methods. Since silica gel eliminates nitrogen-containing compounds through electrostatic interaction and hydrogen bonding, this enables facile regeneration of silica by pure or mixed solvent systems.38 Despite successful regeneration of the silica gel, this solid–liquid extraction approach introduces complexities to the subsequent solvent recovery and recycling processes, making it challenging for commercial application. Thermal regeneration was also assessed as an alternative to solvent extraction of the adsorbents.48,49 Specifically, post-calcination of the silica gel was used to remove adsorbed moisture, fuel, and other NCC impurities after every adsorption cycle. The efficiency of regeneration can be influenced by factors such as temperature, duration of heating, and the specific characteristics of the silica gel used. The silica gel adsorbed with surrogate fuel was calcined under 450 °C to 600 °C for 2 h, respectively. Those temperatures were commonly used for regenerate silica-based adsorbents after NCCs adsorption.50,51 However, at 600 °C, the regeneration process becomes more aggressive, altering the pore structure, surface chemistry, and thus the performance of the silica gel.50,52–54 According to Fig. 5(a), silica gel recovered at 600 °C exhibited comparable pyridine removal but slightly lower indole removal compared to both fresh SiO2 and SiO2 regenerated at 450 °C. The decrease in surface area (Table S4†) resulted in a reduction of surface active sites, and the density of Si–OH groups could also be diminished at temperatures higher than 600 °C.53 Therefore, the optimal regeneration temperature depends on the specific requirements of the application and the type of silica gel being used.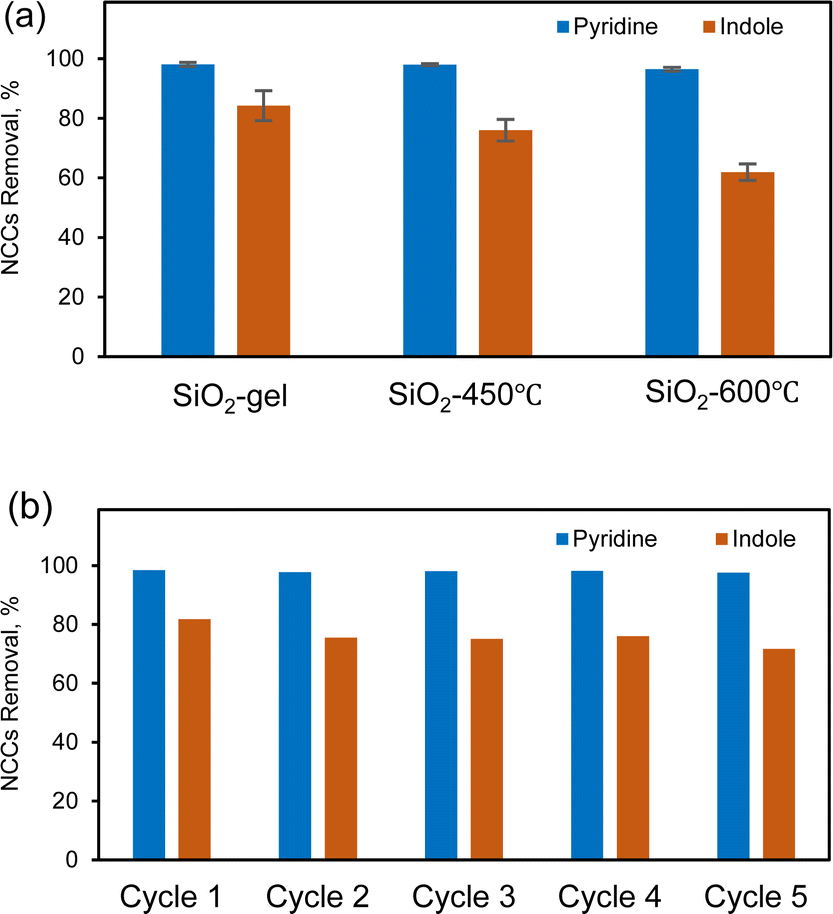 | ||
| Fig. 5 NCCs were removed using fresh silica gel and post-calcination regenerated silica gel under 450 °C and 600 °C. Adsorption was conducted using regenerated silica gel at 450 °C for 5 cycles. The adsorption process involved treating 1000 ppm N from pyridine and 500 ppm N from indole, with a fuel/adsorbent ratio of 10:1, at 40 °C for 24 h. | ||
In Fig. 5(b), it is observed that at 450 °C, the regenerated silica gel process can effectively remove both pyridine and indole for five cycles without observable changes in extraction efficiency. We analyzed the acidity (NH3-TPD) and porosity/BET surface area (Table S5†) of the catalyst after each reaction cycle, correlating these properties with the removal efficiency of the two model nitrogen compounds. The BET surface area exhibited a slightly decline from 431.6 m2 g−1 to 428.4 m2 g−1 over the five cycles. The NH3-TPD analysis initially shows values of 0.03 mmol g−1, however, there were no NH3 peaks in the MS after the first calcination, which may be attributed to the low acidity sites being below the detection limit. Higher initial acidity and surface area were associated with removal efficiencies of 97% for pyridine and 81% for indole. However, as both acidity and surface area decreased, the removal efficiencies for both pyridine and indole also decreased, reaching 95% for pyridine and 72% for indole by the 5th cycle. Yet, calcined silica even with lower concentrations of surface Si–OH groups, and NCCs are still attracted by dipole–dipole interactions. These results establish the critical role of maintaining adsorbent acidity and surface area in achieving high removal efficiencies of nitrogen compounds over sequential regeneration and recycling steps. This highlights the need for strategies to preserve these properties during adsorbent regeneration. We will discuss the methods and costs associated with dealing with NOx emissions from the generation process in Section 3.8.
3.8 Estimation of a baseline cost
We based the economic analysis on the 2022 state of technology (SOT) study, which focused on producing SAF from wet waste using hydrothermal liquefaction (HTL) technology.55 The 2022 SOT study designed an HTL plant with a capacity of 110 dry ton biomass per day, coupled with a centralized biocrude upgrading plant processing approximately 3000-barrel biocrude per day, which is equivalent to combined biocrude production of ten 110 dry ton per day HTL facilities. The SAF fraction was produced from the hydrotreating and hydrocracking in the upgrading plant and a deep HDN method was proposed to remove the nitrogen below 2 PPM for the SAF requirement. In this study, we assumed the same upgrading scale for SAF productions, with all the costs expressed in 2020 U.S. dollars. A common linear velocity of feed in liquid phase adsorption is about 0.003 m s−1.56 The equilibrium adsorption capacity of our silica gel toward pyridine was estimated to be 115 mg g−1 at 1000 ppm based on the measured adsorption isotherm. The volumetric flow rate of the SAF product stream in the 2022 SOT biorefinery process model with HDN is 1453 gal per h (about 1.528 × 10⁻³ m3 s−1, mass flow is 9376 lb h−1). Given the linear velocity, the estimated cross section area is about 0.51 m2 and the diameter of the adsorption bed is 0.806 m assuming a cylindrical shape. If the adsorption bed needs to be regenerated every 48 h, the estimated loaded silica gel is 3913 lb (1778.6 kg). Assuming the silica gel will be used for 1 time, the replacement rate was calculated to be 81.5 lb h−1. The unit cost of silica gel was estimated to be $0.68 lb−1 based on the information from online international vendor and the annual adsorbent cost is about $440k.The bed length can be estimated to be 6.34 m with a packing density of silica gel at 550 kg m−3.56 In order to realizing a semi-continuous process, there will be another identical adsorption bed to handle the denitrogenating while the first adsorption bed is under regeneration. The cost of each adsorber made of carbon steel is estimated to be $55043 in year 2020 cost based on the dimensions.57 The Ergun-equation is used to calculate the pressure drop across the packed adsorption bed:
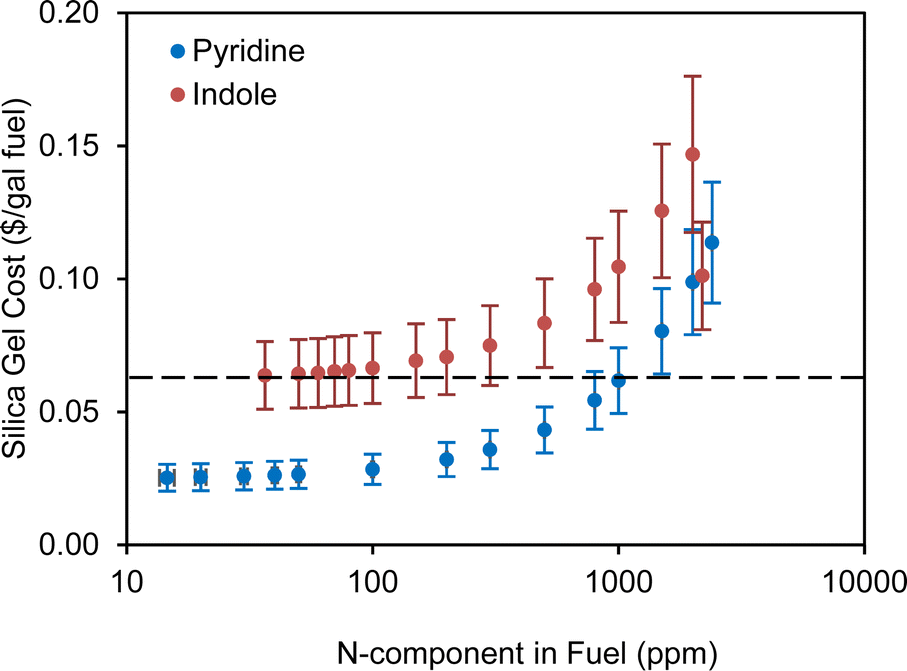 | ||
| Fig. 6 Silica gel cost estimation for the NCCs in fuel with different concentrations. The adsorption capacities were calculated based on equilibrium data. | ||
The cost to remove NOx was calculated based on the unit cost from a selective catalytic reduction (SCR) equipment in a large processing center which can achieve a cost of $2000 per ton NOx at large scale.59 If we choose 1000 ppm pyridine as an example of the nitrogen contents in the SAF stream, the estimated NOx content is about 4.51 lb h−1 (9.376 lb h−1 pyridine and assuming equal amount of NO and NO2) based on the information mentioned above. The annual cost of removing NOx is estimated to be $33k with a 7920 h of operating time. Below, we conducted an economic analysis on 1000 ppm pyridine removed by silica gel. The costs of the ADN were done for other concentrations of pyridine content with similar assumptions and different costs related to the concentration of nitrogen contents was considered.
The annual operating costs for the ADN of 1000 ppm pyridine include the cost of steam (about $80), the cost of electricity used by the pumps ($8266), the cost of adsorbent replacement ($440k), the cost of de-NOx ($33k), and the labor cost ($198k). The total annual operating cost is about $679k and the normalized operating cost from ADN is about $0.06 per gal SAF fuel. The cost of adsorbent replacement and de-NOx will change at different concentrations of pyridine in the feed stream. The summary results of operating cost of ADN at different concentrations of pyridine are shown in Fig. 6 with ±20% uncertainties of the estimation. We also tried to replace the HDN in the biorefinery level HTL model with ADN and to compare the impacts of the different methods of denitrogenating on the minimum fuel selling price (MFSP). A simple scheme of the comparison is shown in Fig. 7. The same feed stream of biocrude from the upstream HTL process at 1100 dry tpd sludge will be fed to both processes. The NCC is 1000 ppm pyridine and the SAF yields are 98% (based on thermogravimetric analysis of the used silica gel adsorbent) and 98.8% (determined from lab scale experiment) ADN and HDN, respectively. It seems that the cost of ADN is slightly less than that of the HDN which is due to the reduction of H2 usage and the replacement of HDN reactor with much less expensive adsorber operating at ambient condition. The MFSP of the ADN case can be further reduced by reusing the silica gel. However, the yield of SAF will play a more important role in determining the MFSP so the loss of fuel need to be minimized by developing NCC selective adsorbent. Compared to HDN, ADN is an add-on modular technology on top of the current upgrading plant, and it does not require change to the existing process such as H2 plant when nitrogen content increases/decreases from the designed level.
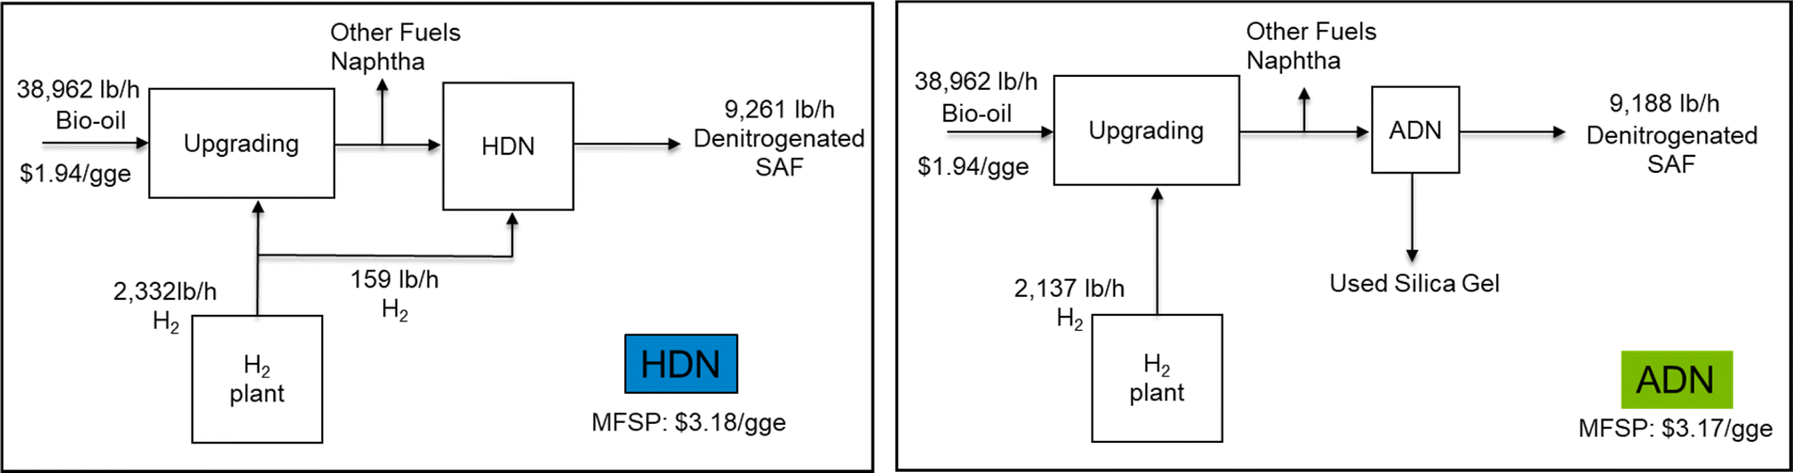 | ||
| Fig. 7 Comparison of the impacts on the MFSP from the different denitrogenation methods in the process of converting wet waste to SAF and other fuels using HTL technology. | ||
4 Conclusion
Silica gel proved to be the optimized adsorbent, exhibiting a remarkable 99% removal efficiency for NCCs in surrogate fuel and displaying excellent regeneration properties. The significance of acidity is evident when comparing Am36 with zeolite, silica gel, and AC all of which possess substantial surface area and high porosity. The adsorption capacity is observed in correlation with the acidity on the surface. Acid–base reactions between nitrogen compounds and the acidic groups on the adsorbent play a vital role, affecting both pyridine and indole adsorption. Additionally, hydrogen-bonds contribute to improved adsorption performance, particularly for less basic compounds like indole, as exhibited in our studies of activated carbon which has high porosity without acidic functionality at the material's surface. SAF fraction meets spec (∼2 ppm nitrogen?) after batch adsorbent testing. Lower performance with real fuel is likely due to competitive adsorption with S-compounds and the substituents present on actual NCCs present in real fuel samples. A simple cost estimation of using silica gel to remove NCCs from SAF without reuse draw a boundary concentration of 2000 ppm for NCCs to meet the $0.05 per gal cost of ADN.Author contributions
Peipei Wang: writing – original draft, data curation, formal analysis; Jian Liu: supervision, writing – review & editing; Difan Zhang: software, data curation, writing – original draft; Daniel Chambers: software, data curation; Shuyun Li: data curation. Daniel Santosa: funding acquisition, methodology, project administration, writing – review & editing.Conflicts of interest
There are no conflicts to declare.Acknowledgements
This work was funded by Bioenergy Technologies Office (BETO) of the U.S. Department of Energy's office of Energy Efficiency and Renewable Energy, under Contract DE-AC05-76RL01830. Acknowledgment is extended to Marie Swita for GC-FID analysis, Stephen Davidson for NH3-TPD analysis and Joshua Thompson (previously ORNL, now Chevron) for his helpful discussions and support.References
- V. Smil, Energy at the Crossroads: Global Perspectives and Uncertainties, MIT press, 2005 Search PubMed.
- R. S. Capaz, E. Guida, J. E. Seabra, P. Osseweijer and J. A. Posada, Biofuels, Bioprod. Biorefin., 2021, 15, 502–524 CrossRef CAS.
- J. Zhang, J. Xu, J. Qian and L. Liu, Pet. Sci. Technol., 2013, 31, 777–782 CrossRef CAS.
- M. C. Loeffler and N. C. Li, Fuel, 1985, 64, 1047 CrossRef CAS.
- N. Dowe, Presented in Part at the Conference: Presented at the 2023 U.S. Department of Energy's Bioenergy Technologies Office (BETO) Project Peer Review, 3-7 April 2023, Denver, Colorado, United States, 2023 Search PubMed.
- P. R. Robinson, in Practical Advances in Petroleum Processing, Springer, 2006, pp. 1–78 Search PubMed.
- B. Batts and A. Z. Fathoni, Energy Fuels, 1991, 5, 2–21 CrossRef CAS.
- G. H. C. Prado, Y. Rao and A. de Klerk, Energy Fuels, 2017, 31, 14–36 CrossRef CAS.
- M. S. Haider, D. Castello and L. A. Rosendahl, Biomass Bioenergy, 2020, 139, 105658 CrossRef CAS.
- S. L. González-Cortés, Y. Qian, H. A. Almegren, T. Xiao, V. L. Kuznetsov and P. P. Edwards, Appl. Petrochem. Res., 2015, 5, 181–197 CrossRef.
- W. T. Chen, L. Tang, W. Qian, K. Scheppe, K. Nair, Z. Wu, C. Gai, P. Zhang and Y. Zhang, ACS Sustainable Chem. Eng., 2016, 4, 2182 CrossRef CAS.
- I. Ahmed, N. A. Khan, Z. Hasan and S. H. Jhung, J. Hazard. Mater., 2013, 250–251, 37–44 CrossRef CAS PubMed.
- M. Almarri, X. L. Ma and C. S. Song, Ind. Eng. Chem. Res., 2009, 48, 951–960 CrossRef CAS.
- S. M. Anisuzzama, D. Krishnaiah, S. Abang and G. M. Labadin, J. Appl. Sci., 2014, 14, 3156 CrossRef.
- G. W. Mushrush, M. A. Quintana, J. W. Bauserman and H. D. Willauer, J. Environ. Sci. Health, Part A: Toxic/Hazard. Subst. Environ. Eng., 2011, 46, 176–180 CrossRef CAS PubMed.
- G. C. Laredo, P. M. Vega-Merino, J. A. Montoya-De La Fuente, R. J. Mora-Vallejo, E. Meneses-Ruiz, J. J. Castillo and B. Zapata-Rendón, Fuel, 2016, 180, 284–291 CrossRef CAS.
- G. C. Laredo, P. M. Vega-Merino, J. Ascención Montoya-de la Fuente, R. J. Mora-Vallejo, E. Meneses-Ruiz, J. Jesús Castillo and B. Zapata-Rendón, Fuel, 2016, 180, 284–291 CrossRef CAS.
- A. J. Hernández-Maldonado and R. T. Yang, Angew. Chem., 2004, 116, 1022–1024 CrossRef.
- D. C. Cronauer, D. C. Young, J. Solash, K. Seshadri and D. A. Danner, Ind. Eng. Chem. Process Des. Dev., 1986, 25, 756–762 CrossRef CAS.
- L.-L. Xie, A. Favre-Reguillon, X.-X. Wang, X. Fu and M. Lemaire, J. Chem. Eng. Data, 2010, 55, 4849–4853 CrossRef CAS.
- N. Li, J. Zhu, X. Ma, Q. Zha and C. Song, AIChE J., 2013, 59, 1236–1244 CrossRef CAS.
- Y. Feng, Pet. Sci. Technol., 2004, 22, 1517–1525 CrossRef CAS.
- K. Kumar, A. Bharti, A. Kumar, S. K. Ghosh and A. Kumar, J. Mol. Liq., 2023, 382, 121862 CrossRef CAS.
- R. Abro, M. Abro, S. Gao, A. W. Bhutto, Z. M. Ali, A. Shah, X. Chen and G. Yu, RSC Adv., 2016, 6, 93932–93946 RSC.
- P. K. Gurunathan, D. Zhang, V.-A. Glezakou, R. Rousseau, H. Wang, A. L. Church, W. Beatrez, M. Z. Hu and S.-J. Lee, ACS Sustain. Chem. Eng., 2021, 9, 13406–13413 CrossRef CAS.
- N. Li, J. Zhu, X. Ma, Q. Zha and C. Song, AIChE J., 2013, 59, 1236–1244 CrossRef CAS.
- Y. Wu, J. Xiao, L. Wu, M. Chen, H. Xi, Z. Li and H. Wang, J. Phys. Chem. C, 2014, 118, 22533–22543 CrossRef CAS.
- A. J. Hernández-Maldonado and R. T. Yang, Angew. Chem., Int. Ed., 2004, 43, 2321 CrossRef.
- I. Ahmed and S. H. Jhung, J. Hazard. Mater., 2016, 301, 259–276 CrossRef CAS PubMed.
- R. Lü, Z. Qu and J. Lin, J. Mol. Liq., 2013, 180, 207–214 CrossRef.
- F. Neese, F. Wennmohs, U. Becker and C. Riplinger, J. Chem. Phys., 2020, 152, 224108 CrossRef CAS PubMed.
- C. Adamo and V. Barone, J. Chem. Phys., 1999, 110, 6158–6170 CrossRef CAS.
- S. Grimme, J. Antony, S. Ehrlich and H. Krieg, J. Chem. Phys., 2010, 132, 154104 CrossRef PubMed.
- C. Bannwarth, S. Ehlert and S. Grimme, J. Chem. Theory Comput., 2019, 15, 1652–1671 CrossRef CAS PubMed.
- A. V. Marenich, C. J. Cramer and D. G. Truhlar, J. Phys. Chem. B, 2009, 113, 6378–6396 CrossRef CAS PubMed.
- M. Naushad, Z. A. ALOthman and G. Sharma, Inamuddin, Ionics, 2015, 21, 1453–1459 CrossRef CAS.
- Y.-S. Ho and G. McKay, Process Biochem., 1999, 34, 451–465 CrossRef CAS.
- W. A. Al-Amrani, M. A. K. M. Hanafiah and A.-H. A. Mohammed, Environ. Sci. Pollut. Res., 2022, 29, 76565–76610 CrossRef CAS PubMed.
- H. Wang and Y. Zou, Catal. Lett., 2003, 86, 163–167 CrossRef CAS.
- A. Fink, C. H. Gierlich, I. Delidovich and R. Palkovits, ChemCatChem, 2020, 12, 5710–5719 CrossRef CAS.
- P. Siril, H. E. Cross and D. Brown, J. Mol. Catal. A: Chem., 2008, 279, 63–68 CrossRef CAS.
- I. Ahmed, M. Tong, J. W. Jun, C. Zhong and S. H. Jhung, J. Phys. Chem. C, 2016, 120, 407–415 CrossRef CAS.
- C. Song, Catal. Today, 2003, 86, 211–263 CrossRef CAS.
- D. D. Link, J. P. Baltrus and P. Zandhuis, Energy Fuels, 2007, 21, 1575–1581 CrossRef CAS.
- R. K. Adams, S. Zabarnick, Z. J. West, R. C. Striebich and D. W. Johnson, Energy Fuels, 2013, 27, 2390–2398 CrossRef CAS.
- S. Velu, C. Song, M. H. Engelhard and Y.-H. Chin, Ind. Eng. Chem. Res., 2005, 44, 5740–5749 CrossRef CAS.
- D. A. Gkika, A. C. Mitropoulos and G. Z. Kyzas, Sci. Total Environ., 2022, 822, 153612 CrossRef CAS PubMed.
- M. Shahadat and S. Isamil, RSC Adv., 2018, 8, 24571–24587 RSC.
- S. Kulkarni and J. Kaware, Int. J. Innov. Res. Sci. Eng. Technol., 2014, 1, 61–64 Search PubMed.
- X. Hong, Y. Li, C. Gao, Y. Zhao and K. Tang, Adsorpt. Sci. Technol., 2018, 36, 1595–1611 CrossRef CAS.
- S. Suganuma, K. Arita, F. Nakano, E. Tsuji and N. Katada, Fuel, 2020, 266, 117055 CrossRef CAS.
- R. Ratnawulan, A. Fauzi and A. Hayati, Mater. Sci. Eng., 2018, 335, 012008 Search PubMed.
- F. Kleitz, W. Schmidt and F. Schüth, Microporous Mesoporous Mater., 2003, 65, 1–29 CrossRef CAS.
- R. Zheng, Z. Ren, H. Gao, A. Zhang and Z. Bian, J. Alloys Compd., 2018, 757, 364–371 CrossRef CAS.
- L. J. Snowden-Swan, S. Li, Y. Jiang, M. R. Thorson, A. J. Schmidt, T. E. Seiple, J. M. Billing, D. M. Santosa, T. R. Hart and S. P. Fox, Wet Waste Hydrothermal Liquefaction and Biocrude Upgrading to Hydrocarbon Fuels: 2021 State of Technology, Pacific Northwest National Lab. (PNNL), Richland, WA (United States), 2022 Search PubMed.
- A. Gabelman, Chem. Eng. Prog., 2017, 113, 48–53 CAS.
- E. J. L. Center, Cost Reports and Guidance for Air Pollution Regulations, United States Environmental Protection Agency, 2021 Search PubMed.
- E. Erdim, Ö. Akgiray and İ. Demir, Powder Technol., 2015, 283, 488–504 CrossRef CAS.
- Nitrogen Oxides (NOx) Control Regulations, US Environmental Protection Agency, 2024, Accessed 2024, https://www3.epa.gov/region1/airquality/nox.html Search PubMed.
Footnote |
| † Electronic supplementary information (ESI) available. See DOI: https://doi.org/10.1039/d4se00574k |
| This journal is © The Royal Society of Chemistry 2024 |