
 Open Access Article
 This Open Access Article is licensed under a
 Creative Commons Attribution 3.0 Unported Licence
Future costs of hydrogen: a quantitative review†
Florian
Frieden
 *ab and
Jens
Leker
ac
*ab and
Jens
Leker
ac
aInstitute of Business Administration at the Department of Chemistry and Pharmacy, University of Münster, Leonardo Campus 1, 48149 Münster, Germany. E-mail: florian.frieden@uni-muenster.de
bFutureCamp Climate GmbH, Aschauer Straße 30, 81549 München, Germany
cHelmholtz Institute Münster, Forschungszentrum Jülich GmbH, 48149 Münster, Germany
First published on 25th March 2024
Abstract
Hydrogen is the key energy carrier of the future. Numerous industrial processes incorporate hydrogen in their transformation towards climate neutrality. To date, the high cost of producing hydrogen from renewable sources has been a major barrier to its widespread adoption. Inspired by these two aspects, many researchers have published cost predictions for hydrogen. This review provides an overview of the extant literature of more than 7000 publications in the last two decades concerned with the topic. After removing articles that do not provide explicit hydrogen production cost projections for the 2020 to 2050 time horizon, 89 articles remain and are analyzed in detail. The review identifies 832 cost forecast data points among these studies and categorizes the data points according to various parameters such as production region, production process and publication year of the study. Through a linear regression, a main trajectory for the development of hydrogen production costs can be derived. The costs of hydrogen from electrolysis are reduced on the basis of this trajectory, starting from the reference 5.3 € per kg, in 2020, to 4.4 € per kg, in 2030, and to 2.7 € per kg in 2050. The costs for natural gas-based hydrogen are almost constant on a globally aggregated basis. There are also major regional and process-related differences. In 2050, Asia has the lowest average costs of the regions analyzed at 1.8 € per kg and production by alkaline electrolysis with average costs of 2.0 € per kg appears to be the most cost-effective electrolysis technology. Although studies show a high degree of variation, it is evident from this review that the trend within certain investigation parameters is well defined. Therefore, researchers and practitioners can use this review to set up further analyses that depend on future hydrogen costs.
 Florian Frieden | Florian Frieden holds a MSc degree in Business Chemistry and a BSc degree in Chemistry from the University of Muenster (Germany). He is currently a PhD student at the University of Muenster (Germany), Institute of Business Administration at the Department of Chemistry and Pharmacy, and a consultant at FutureCamp Climate. His research interests include pathways for the transition towards renewable energy systems especially in the context of industrial applications. |
 Jens Leker | Jens Leker received his doctoral degree in 1993 from the University of Kiel (Germany). He is currently a full professor at the University of Muenster (Germany), where he is director of the Institute of Business Administration at the Department of Chemistry and Pharmacy. Jens is also a professorial researcher at the Helmholtz Institute Muenster. His research focuses on innovation and technology management and the economic and ecologic analysis of energy storage technologies. He is a member of the German Chemical Society, a fellow of the International Society of Professional Innovation Management (ISPIM), and Editor-in-Chief of the Journal of Business Chemistry. |
1 Introduction
Beneath synthetic methanol, Fischer–Tropsch fuels or ammonia, hydrogen is regarded as the energy carrier of the future, as it is used as an educt for the previously mentioned energy carriers and is relatively easy to produce.1,2 Drawbacks are its small molecule which enables hydrogen to diffuse through storage media and, more important, its low volumetric energy density of 0.53 kW h dm−3 (at 200 bar; cf. natural gas: 2.3 kW h dm3 at 200 bar).3–6 Nevertheless, hydrogen production and demand will grow rapidly in the future. Clean hydrogen production is estimated to increase from 0.8 Mt/a today to 154 Mt/a in 2030 and 614 Mt/a by 2050.7 This in turn will require huge investments of hundreds of billions of euros per year.7 Investment flows need to be channeled effectively to produce hydrogen cost-efficiently and thus contribute to sustainable transformation. Therefore, it is crucial to predict optimal production technologies, locations and parameters.The estimation of future hydrogen production costs concerns many researchers due to its high anticipated importance in the future.8–11 Studies have been published on various issues such as the comparison of production processes, the dependence on energy costs, efficiency, capacity factors and many specific cases studies for different applications and locations.12–25 However, predicted production costs in 2050 range from 0.36 to more than 10 € per kg.24,26,27
To gain a better understanding of the various predicted costs, a review of the studies is essential. In the recent past two review studies have been published on the topic, but Maggio et al. focused on a rather small part of the available studies and Miyagawa and Goto mostly looked at older studies and the outlook to 2020.8,9
This study is intended to deliver a holistic review which focuses on quantitative results of previous studies about hydrogen costs for the forecast horizon 2020–2050 and provide insights for academia and practitioners. It reviews the extant literature on cost projections for the production of hydrogen and provides an in-depth analysis of 89 studies which have been filtered from a 7309-study baseline dataset. The studies are categorized and 832 hydrogen production cost data points are compiled to get deeper insights into the forecast of hydrogen production costs.
The review contributes to the research field by (1) providing a holistic overview of unit and currency harmonized hydrogen cost forecasts until 2050 and processing the data to depict the most likely cost ranges, (2) aggregation and analysis of various parameters, such as the forecasting methods, processes examined, production regions, etc. and (3) discussing the results in the light of key findings and measures to be derived.
2 Methods
The process of identifying relevant studies which are concerned with the prediction of hydrogen costs in the future, was started with an extensive search in the Scopus literature database. Table 1 summarizes the search parameters used. The resulting 7309 studies have been prescreened using ASReview, which resulted in 146 studies for further analysis.28 To train the algorithm of ASReview 732 abstracts were analyzed. The algorithm reorganizes the dataset based on the analyzed abstracts. Fitting abstracts will be prioritized by the algorithm. After at least 10% of articles and at least 50 abstracts in a row, which were not relevant, the search was terminated. In the following detailed analysis only papers with at least one quantitative forecast for any year between 2020 and 2050 were processed onwards. During this 69 further studies were removed from the dataset as they did not include relevant information. Thus, 77 studies were implemented in the base dataset of this study. In addition, studies from grey literature have been included manually, since many academic studies reference these studies. To be considered for inclusion, grey literature reports had to meet two criteria: they must have been cited in academic studies and contain quantitative hydrogen production forecast data. Also, a comparative analysis of the academic and grey literature is intended in this review. As a result, a total of 89 studies were included in the final dataset.| Search operator | Hydrogen and (cost* or price*) and (forecast* or scenario* or foresight or vision or roadmap or project* or prognos* or outlook or predict*) |
| Field of search | Title, Abstract, Keywords |
| Publication years | January 2000–July 2023 |
All studies in the final dataset have been analyzed to extract relevant information via the following protocol. First, bibliographic data like title, authors, journal, publication year, etc. was collected. Second, the type of study has been analyzed and every study was categorized into one of the following four types: explicit forecasts, studies on global hydrogen trade, studies focusing on the mobility sector and case studies. Explicit forecasts were defined as studies that focus on the prediction of hydrogen productions costs in the future without or subordinate secondary objectives. Studies in the global trade cluster focus on optimal global hydrogen demand coverage. Therefore, optimized production locations and transports are important factors in these studies. Mobility sector studies prioritize hydrogen production and distribution for mobility purposes. Case studies deal with particular situations relating to the production of hydrogen. Third, the methodology of the studies has been analyzed and clustered into the following clusters: bottom-up, learning curve, expert elicitation and historic data regression. The clusters and their interpretation are based on the procedure of Mauler et al.29 Fourth, the analyzed production process of hydrogen and the possible inclusion of carbon capture and storage was extracted. The type of electrolyzer and electricity source were also extracted for studies investigating electrolysis-based processes. Fifth, stated hydrogen production costs for the time horizons 2020, 2021, 2022, 2025, 2030, 2035, 2040, 2045 and 2050 were extracted. Sixth, the analyzed production country or region was transferred into the analysis dataset. Seventh and if applicable import countries or regions and transport costs as well as transport type and aggregate state or carrier of hydrogen was extracted. Furthermore, for all studies underlying interest rates, efficiency rates of electrolyzers and electricity costs were extracted if they were given in the studies.
To enable a reasonable comparison of the production costs the levelized cost of hydrogen (LCOH) is used, which is widely used in the literature to make costs of energy carriers comparable.30 Moreover, different units of measurement have been unified using the physical and chemical parameters of hydrogen to € per kg as reference unit. Also, cost statements of older studies have been adapted using the country-specific inflation rates to get the equivalent value in 2023 and currencies have been unified to euro using currency exchange rates of August 2023 (cf.Table 2).
| Currency | Exchange rate |
|---|---|
| USD/EUR | 0.92 |
| AUD/EUR | 0.59 |
| CAD/EUR | 0.68 |
| GBP/EUR | 1.17 |
| NZD/EUR | 0.54 |
| CNY/EUR | 0.13 |
Some studies state hydrogen prices at the point of application instead of production costs. To solve this issue these studies were either analyzed for hidden data on related costs or, if no cost data was available, prices were transferred to the analysis dataset. This issue has only occurred in studies in the mobility sector category, where prices for consumers are more important. So, the other categories are not affected.
Studies that reported multiple forecast values for different forecast horizons or production technologies were transferred as multiple data points into the final analysis dataset. Studies that reported ranges were transferred using the arithmetic mean of given cost ranges. If multiple cases are given in a single study, the base case was extracted. Table 3 gives an overview of all studies in the final analysis dataset. The raw data extracted from the underlying studies can be found in the ESI.†

|
3 Results & discussion
3.1. Analysis across all study categories and method clusters
To get a first insight into the dataset all data points without regard to different investigation clusters are set up. Fig. 1 shows the forecasted costs as boxplots. The orange line represents the median value, a star depicts the arithmetic mean and outliers are given as “+” symbols. At the top of the figure a small table gives the exact values of the median, arithmetic mean (which is calculated including outliers) and the number of data points included. | ||
| Fig. 1 Boxplots of hydrogen production costs for different forecast horizons. “*” represents the arithmetic mean. “+” represents outliers. | ||
Most data points are available for the year 2030. This is in line with governmental interim targets for a hydrogen industry. For the year 2050, the dataset contains numerous data points that align with the long-term objectives of various governments.102,103 All mean and median values of the individual forecast horizons show a monotonously decreasing curve. Moreover, it is important to note that hydrogen production costs are predicted to almost halve by 2050 and will fall by a third by 2030, if 2020 costs are used as a reference. Actual hydrogen production costs reported in a recent study are given in Table 4.
| Energy source | Hydrogen production costs (€ per kg) | Hydrogen production costs arithmetic mean (€ per kg) |
|---|---|---|
| Natural gas | 1.38–5.52 | 3.45 |
| Natural gas with CCUS | 1.84–6.44 | 4.14 |
| Wind onshore | 3.40–11.04 | 7.22 |
| Wind offshore | 4.42–11.04 | 7.73 |
| PV | 3.50–10.40 | 6.95 |
Fig. 1 suggests high cost reductions in the near future and slower cost reductions by 2050. The highest data point in the dataset is from Maynard and Abdullah at 60.72 € per kg in 2025. This data point comes from the calculation of a very specific case study and in the ramp-up phase of the project under consideration, where an offshore wind farm produces electricity for a proton exchange membrane electrolyzer.93 The lowest data point is given by Fusaro et al. at 0.36 € per kg in 2050. Very low energy costs from renewable energies and utilization of alkaline electrolyzers generate this extreme value.24 Both data points highlight the need to dig deeper and examine specific clusters of approaches.
3.2. Analysis of forecasts by publication years
An influential factor affecting cost forecasts is the time difference between the time of publication and the forecast horizon, as assumptions for the distant future are more difficult to determine. Therefore, the influence of this aspect is examined. Fig. 2 depicts the average forecasted costs of hydrogen depending on the publication year. For clarity, only the last 6 years have been plotted, as these years also have the highest density of forecasts. There are only a few data points from the year 2019 and forecast year 2040 is missing completely. Thus this publication year was neglected.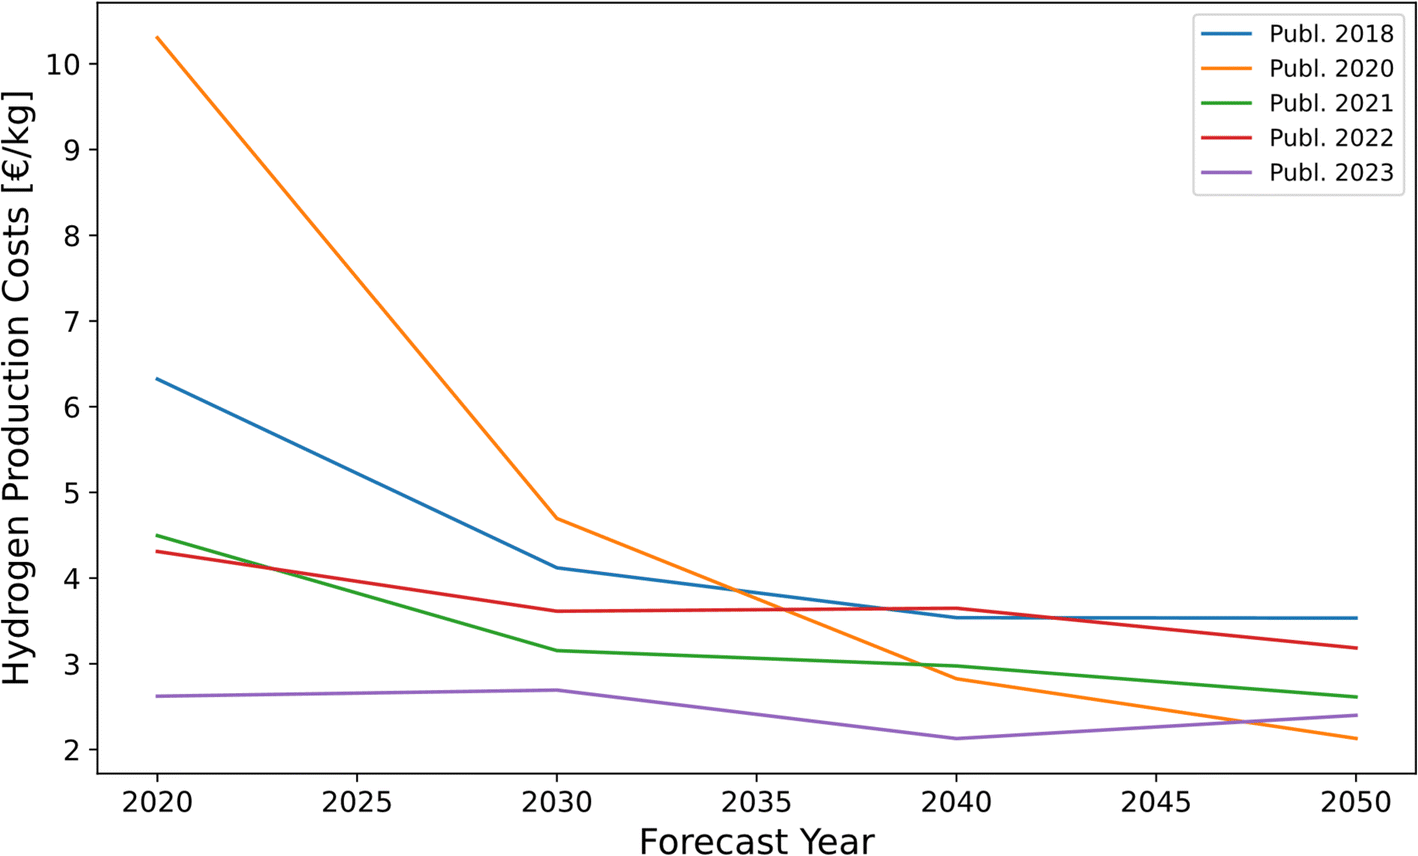 | ||
| Fig. 2 Arithmetic mean values of forecasted hydrogen production costs depending on their year of publication which is given by the color code. | ||
Except for the forecast value for 2020, which is strongly influenced by outliers, all forecasts of different publication years seem to predict relatively similar and no significant tendency towards lower forecasts can be identified. This is interesting, as the basic hypothesis would be that a forecast becomes more accurate with a smaller forecast horizon and the results therefore differ from the forecasts of older studies. However, this effect cannot be identified on the basis of the graphs. In addition, the recently launched long-term support programs for hydrogen would also suggest that new studies predict lower costs, as the framework conditions improve.102,103 But, the influence of vague funding commitments in the studies examined is rather low, as most of them are based on more fundamental assumptions and do not explicitly include funding. The consistently lower costs forecast in 2023 could indicate that government support programs are beginning to have an effect through the scale-up of production facilities which lead to lower cost forecasts. As most of the values for 2020 from later studies are not real values but modelled values with more recent assumptions, this thesis is underlined. However, future years need to be examined to support this observation.
3.3. Analysis of forecasts by production country
Although production costs of hydrogen at a detailed level barely depend on national regulations, many studies are assigned to specific countries. This usually reflects certain assumptions about energy costs, production potentials of renewable energies or overhead costs. Fig. 3 shows boxplots of predicted hydrogen costs for major hydrogen producing countries in 2030 and 2050. For reasons of clarity, not all country-specific boxplots are shown. Both in Germany and China median and mean values decline significantly between 2020 and 2050. In contrast, the mean value of production costs in the USA is not changing significantly between 2020 and 2050, and median values show a projected change in costs only between 2030 and 2050. These divergent statements of the two parameters illustrate the high ranges between the data of the studies. This effect is likely due to outliers in the forecast for 2020, 2030 and 2050. Without these values, the arithmetic means for 2020, 2030 and 2050 in the USA would be 2.93 € per kg (median: 2.86 € per kg), 2.99 € per kg (median: 2.83 € per kg) and 2.64 € per kg (median: 1.84 € per kg), respectively. It is evident that the data, excluding the three outliers, fits much better into the overall picture. The forecast would show an almost monotonous decrease in production costs. | ||
| Fig. 3 Boxplots of hydrogen production costs for different countries. “*” represents the arithmetic mean. “+” represents outliers. | ||
The forecasts for China show the lowest average cost of production of the three regions presented both in 2020 and in the future. Both China and Germany are predicted to have a high cost reduction of 53% and 52%, respectively (median: 45% and 35%, respectively), which puts these countries slightly ahead of the global average of 49% (median: 43%).
In Fig. 3, there is an anomaly where the variance in the forecasts for Germany and China for 2030 and 2050 decreases. This is counter-intuitive as the forecasts should diverge more strongly over a longer period.
However, many studies use IEA data as the basis for assuming energy costs for their long term forecasts. Since energy prices play a major role in all hydrogen production methods, this is highly influential. This means that more similar assumptions are used for the long term forecasts rather than near term forecasts. The effect could explain the decreasing variances of the long term forecasts.
To put the data in Fig. 3 into perspective, Fig. 4 shows the analogous graph for regional clusters. These clusters are composed of region-specific studies and associated country-specific studies. The graph shows that production costs in Europe are currently the highest. The modelled costs of production in the Middle East and Africa (MEA) is also high for 2020. This is probably due to the few reference plants that can be used as a basis in this region. In addition, the dataset is very small and therefore less significant. However, the region shows an extremely high reduction in production costs, which is mostly driven by low expected energy costs in the future. With an average predicted cost reduction of 60% (median: 74%) the reduction is significantly higher than the global average.
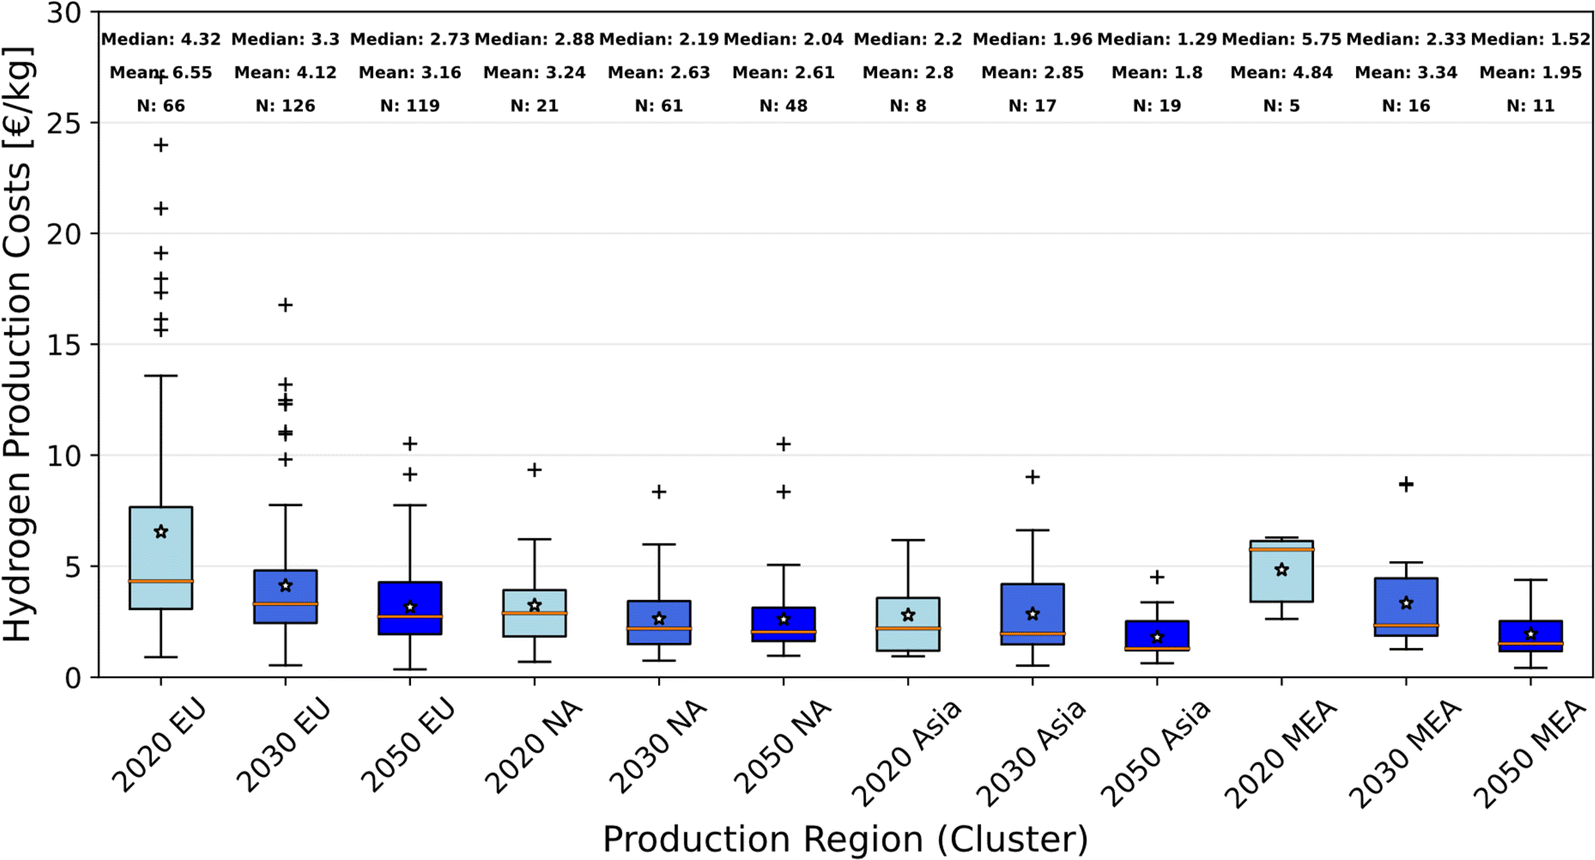 | ||
| Fig. 4 Boxplots of hydrogen production costs for different world regions. “*” represents the arithmetic mean. “+” represents outliers. EU: Europe, NA: North America, Asia: Asia excluding Middle East, MEA: Middle East and Africa. | ||
A comparison of the regions shows that Europe will continue to have significantly higher production costs for hydrogen in the future. However, there are still major cost reductions to be made in Europe. Between 2020 and 2050 the average production cost in Europe is predicted to decrease by 52% (median: 37%), which is the second highest reduction after MEA. Furthermore, there are significantly more studies and thus data points available for this region. Also, the technologies studied differ between the regions. In Europe 85% of data points for 2020, 2030 and 2050 refer to electrolysis and 9% refer to steam methane reforming (SMR) or steam methane reforming combined with carbon capture and storage (SMR + CCS). In North America only 51% of data points refer to electrolysis and 18% to SMR or SMR + CCS. SMR processes have lower reduction potentials due to their maturity and cannot benefit from future energy cost reductions through renewable energies. This could be an explanation why the costs of hydrogen in North America are predicted to decrease less sharply than in Europe. However, the large investment package “Inflation Reduction Act” (IRA) could reduce or close this gap.105 But, since this act is quite new, the effects cannot yet be included in the studies. Though SMR processes already show the lowest hydrogen productions costs out of all processes analyzed. This will be displayed in the next chapter.
In contrast to the other regions, production costs in Asia are already set at a low level and are still decreasing significantly. According to many underlying studies, this is due to high and yet unexploited potentials for the generation of renewable energies, as well as generally favorable ancillary conditions in many countries of this region. Interestingly, all regions except Asia show the strongest cost reduction rate in the period 2020–2030, while in Asia the largest cost reduction is evident during the period 2030–2050.
It should be noted that the regions shown in the figures exhibit production costs for 2020 that are more in line with the lower end of the range of actual production costs in Table 4. However, the boxplots for Germany and the EU closely match the IEA's values.104 The influence of production technologies on costs, which is emphasized in the IEA data, will be examined in the next chapter.
3.4. Analysis of forecasts by production process
The type of process studied for the production of hydrogen has a major influence on costs, which is why this parameter will also be examined in this review. The most studied production processes are electrolysis, steam methane reforming and steam methane reforming coupled with CCS. Therefore, these are analyzed in depth and an overview is given in Fig. 5. In addition, studies were also conducted on pyrolysis (median: 1.63 € per kg, mean: 1.51 € per kg), natural gas decomposition (median: 1.73 € per kg, mean: 1.73 € per kg) (+ CCS (median: 1.80 € per kg, mean: 1.78 € per kg)), coal gasification (median: 2.35 € per kg, mean: 2.35 € per kg) (+ CCS (median: 2.27 € per kg, mean: 2.27 € per kg)), autothermal reforming (median: 1.67 € per kg, mean: 1.72 € per kg) (+ CCS (median: 1.46 € per kg, mean: 1.47 € per kg)), chemical looping partial oxidation of methane (median: 2.38 € per kg, mean: 2.47 € per kg) (+ CCS (median: 2.24 € per kg, mean: 2.22 € per kg)), biomass gasification (median: 2.48 € per kg, mean: 2.48 € per kg) and thermochemical and photoelectrochemical water splitting with various reactor types (median: 2.50 € per kg, mean: 2.50 € per kg). All values given above refer to 2050, as values for each technology are only available at this point in time. But since the number of studies on these processes is very low, a higher-level analysis of these studies would not be meaningful.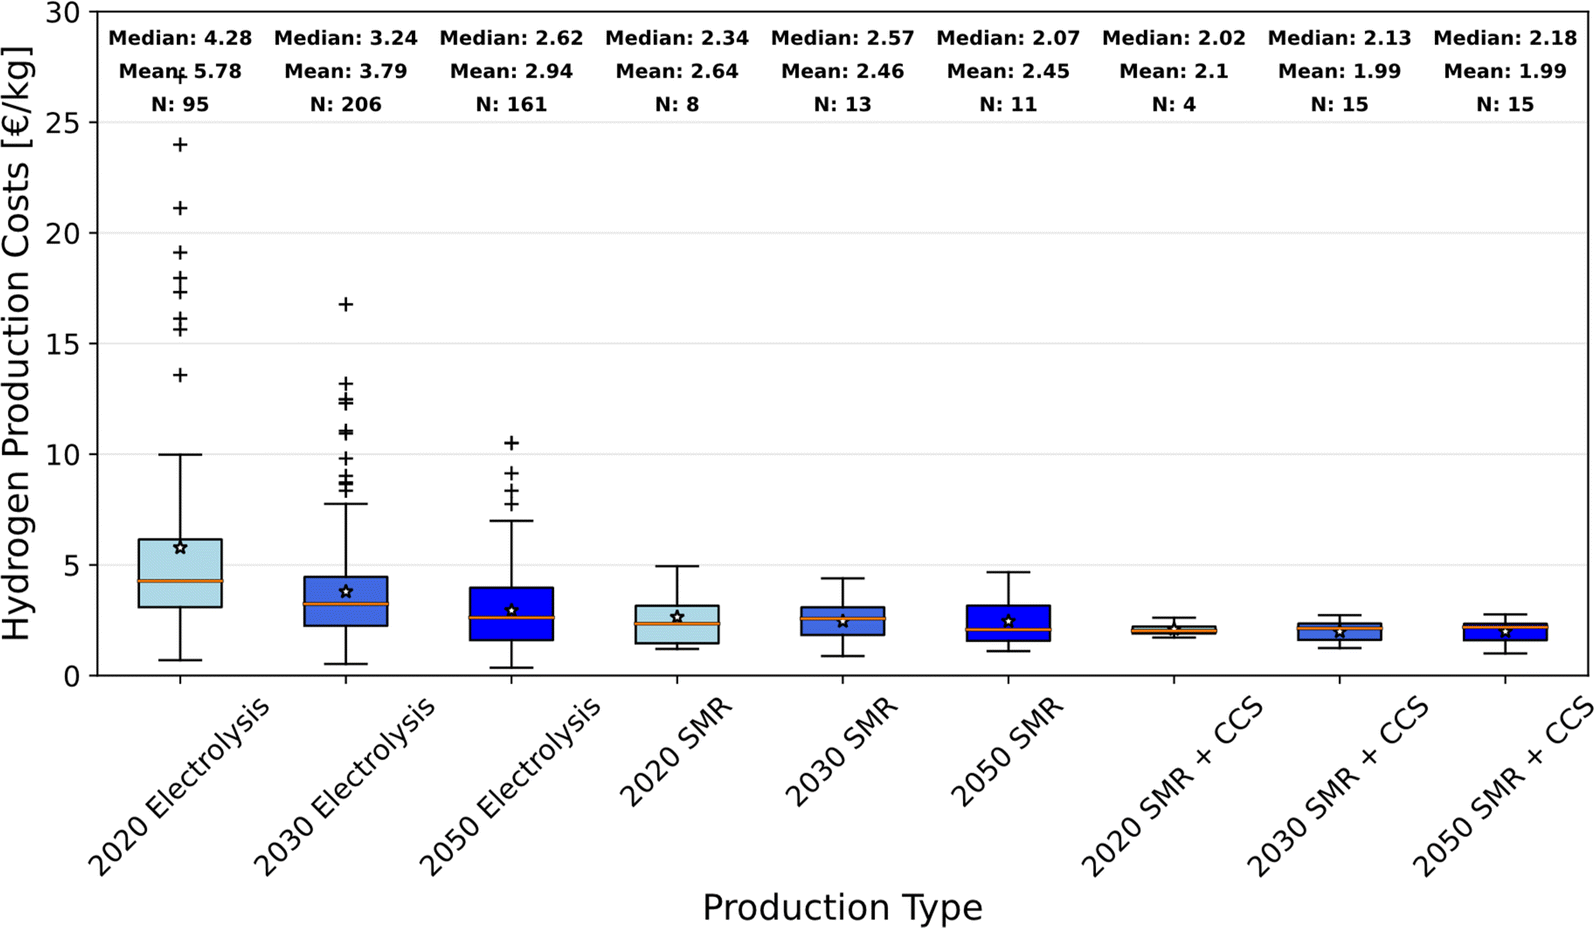 | ||
| Fig. 5 Boxplots of hydrogen production costs for different production processes. “*” represents the arithmetic mean. “+” represents outliers. | ||
First, it is important to note that most forecast studies refer to electrolysis. These account for 76% of the studies reviewed. 8% of the studies report data for SMR + CCS and 4% of the studies report data for SMR. On the one hand, this limits the validity of the conclusions that can be drawn from the cost considerations for SMR-based processes. On the other hand, the disproportionately high interest of researchers in electrolysis shows which technology is being studied more intensively and thus has a higher potential for optimization and ultimately cost reductions. However, research interest is always determined by an interaction between remaining research potential and public interest in a technology. Recently, water electrolysis was pushed to public interest due to the accelerated transition towards sustainable production technologies. Additionally, SMR is an established technology with lower remaining research potential. Therefore, the high number of long-term cost forecasts for electrolysis is not surprising.
According to the studies evaluated, hydrogen produced by electrolysis currently has by far the highest production costs. The costs are more than twice as high as for hydrogen from SMR or SMR + CCS processes. By 2030, however, the costs for hydrogen from electrolysis will drop rapidly, and thereafter the production costs will continue to fall. But still, in 2050, hydrogen from water electrolysis is projected to be more expensive than natural gas based hydrogen. In contrast to the sharp cost decline for electrolysis, both for SMR and SMR + CCS the reviewed studies do not indicate significant cost reductions. Both processes suffer from the assumption of rising costs for natural gas in the future. In addition, the latter process also bears the costs of CCS, which is still very expensive and will significantly reduce the energy efficiency of SMR reactors in the future. It is therefore particularly surprising that the hydrogen costs of SMR + CCS processes are even lower than SMR-based hydrogen in the studies. It should be noted that the overall ranges of SMR diverge further. The cost range of SMR is distorted by 2 studies. Without these two studies,19,45 the corresponding average production cost of SMR in 2020 would be 1.88 € per kg. They have a similarly high impact on the values in 2030 and 2050. Another possible explanation may be that SMR + CCS plants represent a new technology combination and newly built plants have a higher efficiency than decades-old SMR plants. It is important to note that costs for SMR-based processes have been extracted without the cost component of CO2 certificates, if the costs were stated separately or an included CO2 price was specified.
The variance of forecasted costs is much higher for electrolysis compared to SMR and SMR + CCS. This is due to the calculation of hydrogen production cost, which is relatively easy for SMR processes, where efficiency parameters and the energy demand of reactors is established. For electrolysis assumptions for efficiencies depend on the type of electrolyzer and still vary for particular electrolyzer technologies. Moreover, production costs of hydrogen highly depend on electricity costs. Since both grid electricity and pure renewable electricity of multiple regions are aggregated in the analysis shown in Fig. 5, the hydrogen costs from electrolysis depict high variations. To get a deeper insight, Fig. 6 shows the productions costs of hydrogen produced via electrolysis depending on the production region analogous to Fig. 4.
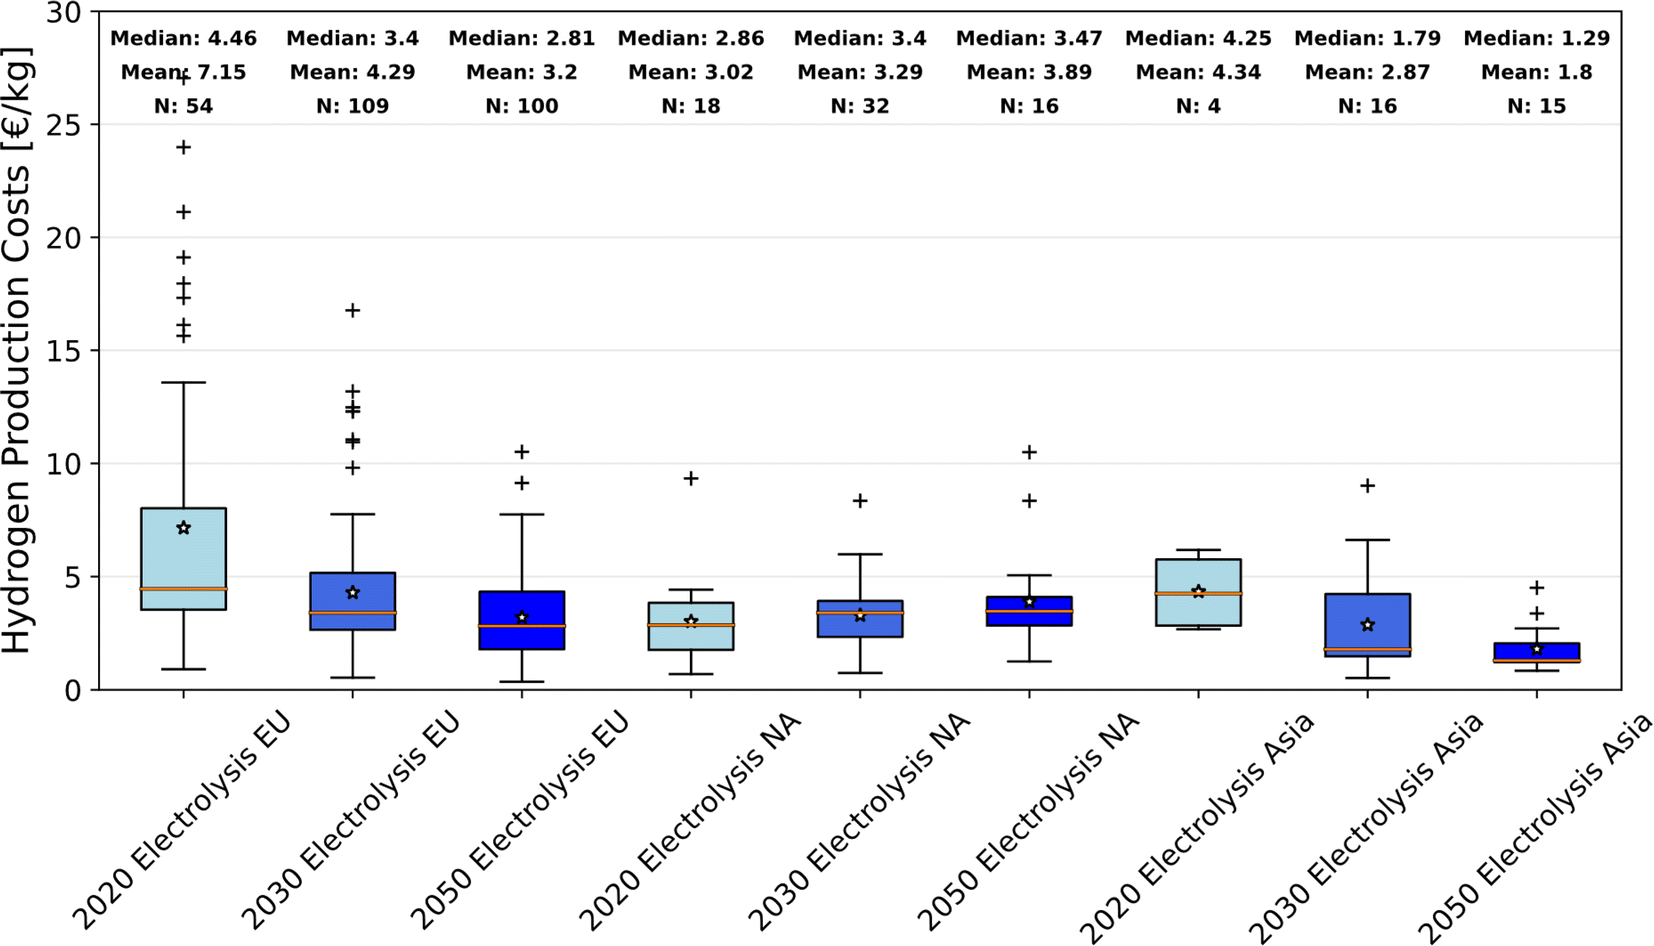 | ||
| Fig. 6 Boxplots of hydrogen production costs via electrolysis in different production regions. “*” represents the arithmetic mean. “+” represents outliers. | ||
In Fig. 6 the Middle East and Africa region is neglected because of its low number of data points. In comparison to Fig. 4 it becomes clear that hydrogen production cost forecasts for Europe are dominated by analyses about electrolysis. The corresponding boxplots are very similar.
In contrast the median and mean values for electrolytic hydrogen in North America are increasing which is counterintuitive and not in line with the overall hydrogen costs forecasts for North America given in Fig. 4. Compared to Fig. 4, it is also evident that significantly fewer forecasts for electrolytic hydrogen have been developed for this region which underlines the point made in chapter 3.3. This explains why the boxplots of Fig. 6 do not line up with their corresponding boxplots in Fig. 4. Still, increasing hydrogen production costs do not correspond to general expectations since capital costs for electrolyzers and energy costs of renewable energies are expected to fall in the future. Also efficiencies of electrolyzers should increase in terms of a learning curve. Especially falling capital costs and higher efficiencies are highly expected in the time horizon until 2050 and should lead to lower costs compared to 2020.
In Asia, these aforementioned factors contribute to a rapid reduction in the production costs of electrolytic hydrogen. By 2030, Asia is forecasted to produce the least expensive hydrogen from electrolyzers among the three regions analyzed. Furthermore, by 2050, electrolytic hydrogen from this area will be cost-competitive with today's grey hydrogen (cf.Table 4).
Following on from Fig. 6, and in order to gain a better understanding of the production costs of the different electrolysis technologies, these are shown in Fig. 7.
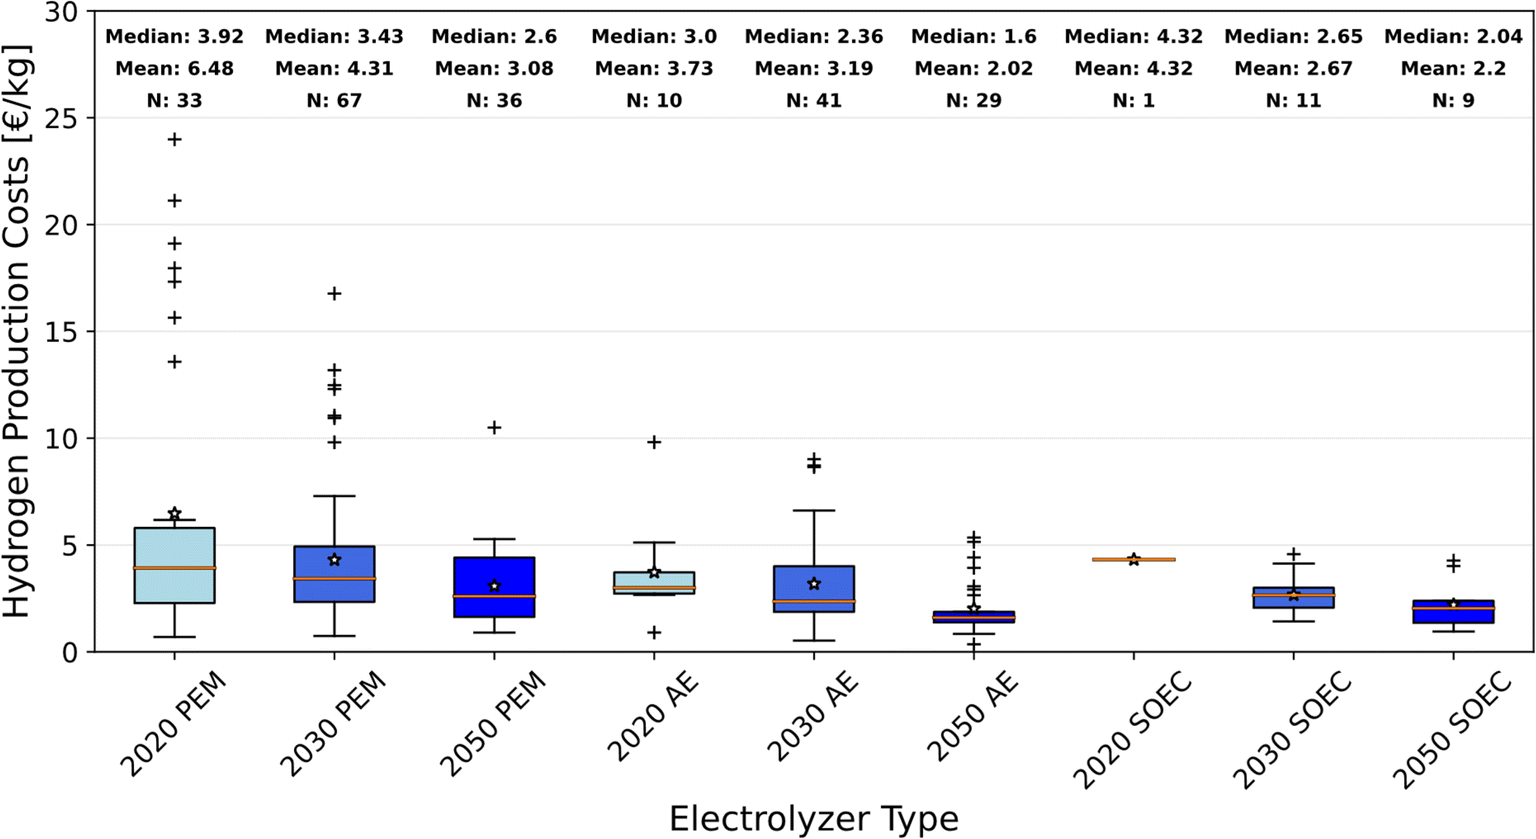 | ||
| Fig. 7 Boxplots of hydrogen production costs via electrolysis for different production technologies. “*” represents the arithmetic mean. “+” represents outliers. PEM = Polymer Electrolyte Membrane, AE = Alkaline Electrolysis, SOEC = Solid Oxide Electrolysis Cells. | ||
PEM and AE are already used industrially and have been analyzed more frequently than SOEC. It is to be expected that SOEC will be associated with specific costs more and more often in the future. According to Fig. 7, the production costs for hydrogen from AE are falling much more sharply than for PEM, and will eventually be cheaper than SOEC hydrogen. At this point, it seems that the low production costs of AE and the high efficiency of SOEC outweigh the advantages of PEM, such as fast start-up times and high flexibility. This statement is particularly noteworthy as PEM has been extensively analyzed and is often perceived by the public to be superior. Due to their high flexibility, PEM electrolyzers are often analyzed in very specific case studies. If the cluster of case studies is removed, the average values for PEM are as follows: 2020: 10.12 € per kg, 2030: 4.09 € per kg, 2050: 2.97 € per kg. It is evident that the type of study significantly impacts the analysis results.
3.5. Analysis of forecasts by study type
In the previous analyses, all types of studies were aggregated. However, case studies are often very specific and can only provide a limited representative picture of the future. Likewise, the studies in the “Mobility Sector” cluster are highly focused and contain a small portion of end consumer prices, which cannot be directly related to production costs. Fig. 8 displays the dataset split by type of study and for clarity reasons, only forecasts for 2030 and 2050 are displayed. As expected case studies and the studies in the mobility cluster exhibit the highest variance. These studies also represent the highest average forecasted production cost. In contrast to the case study cluster, which also shows wide scattering, there are no projected costs below 1.25 € per kg in 2050 in the mobility cluster, which means that hydrogen will be relatively expensive for end consumers even in the far future. The case study cluster contains very low data points, which are due to specific very optimized production scenarios, which might not be suitable to supply larger hydrogen demands or depend on limited local conditions. The lowest production costs in 2030 and 2050 are shown in the “global trade” cluster. These studies often refer to well-suited locations with favorable framework conditions such as cheap natural gas or high potentials for renewable energy production. Thus, the costs of hydrogen production are very low, but hydrogen in these studies is usually not produced at the location of demand. Therefore, transport costs would have to be added to these costs to determine the costs at the point of consumption, which is not in the scope of this study. | ||
| Fig. 8 Boxplots of hydrogen production costs for different clusters of study types. “*” represents the arithmetic mean. “+” represents outliers. | ||
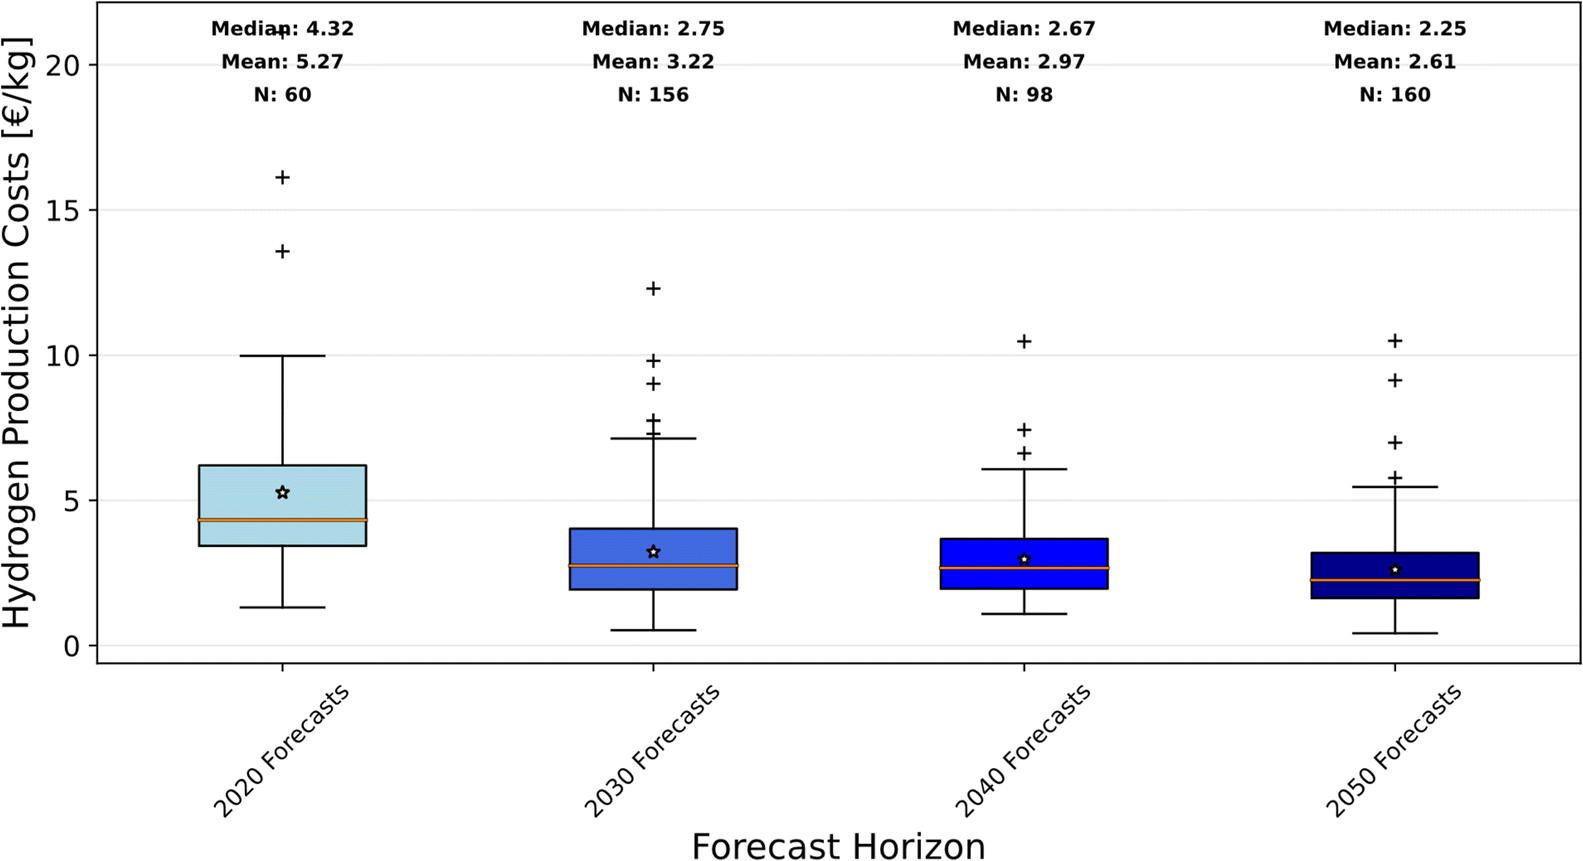
The study type with the largest number of data points in the dataset examined is the forecast cluster, which explicitly contains studies with general forecasts of hydrogen costs in the future. The cost decline, as indicated before, is higher in the period 2020–2030 than in the period 2030–2050, despite the latter being a longer time horizon. The declining cost reduction is underlined by Fig. 9. Between 2020 and 2030 the reduction rate is 39% (median: 36%) while the next ten-year period exhibits a reduction of only 8% (median: 3%) and the reduction between 2040 and 2050 is expected to be 12% (median: 16%). The lowest data point represents 0.42 € per kg hydrogen in 2050 given by Brändle et al. for pyrolysis hydrogen from Qatar.13 In comparison with the overall dataset, it is noticeable that the forecast papers assume a slightly higher cost reduction. Here, a reduction of 50% (median: 48%) is shown between 2020 and 2050, while the overall dataset shows a reduction of 49% (median: 43%) in this period.
 | ||
| Fig. 9 Boxplots of hydrogen production costs for the cluster of forecast studies for different forecast horizons. “*” represents the arithmetic mean. “+” represents outliers. | ||
3.6. Analysis of forecasts by forecasting method
A comparison of forecasts depending on the forecasting method is given in Fig. 10. This analysis shows that methods have a strong impact on results. The projections of the historical data regressions point to significantly lower hydrogen production costs. On the other hand, conclusions can only be drawn to a limited extent from the small dataset for this type of study.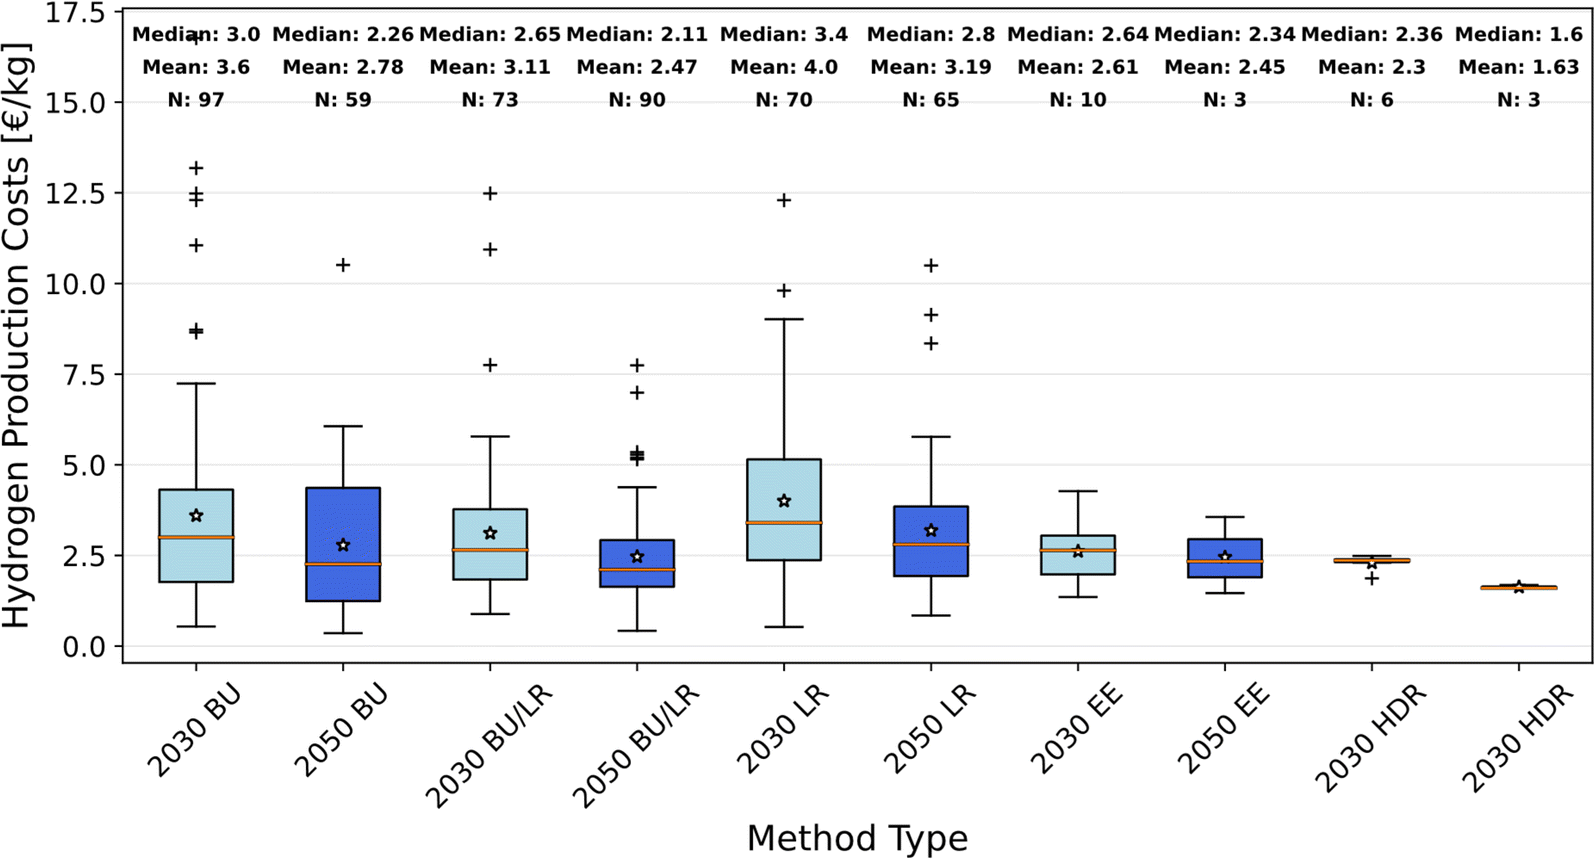 | ||
| Fig. 10 Boxplots of hydrogen production costs for different forecasting methods. “*” represents the arithmetic mean. “+” represents outliers. BU: bottom-up analysis, BU/LR: combination of bottom-up analysis and learning curve approach, LR: learning curve approach, EE: expert elicitation, HDR: historic data regression. | ||
When filtering the historical data regression studies from the dataset, the mean values still show a difference of 35% (median: 22%) for 2030 and 23% (median: 25%) for 2050 between the highest and lowest predicted value, depending on the prediction method. This underlines the need to survey and examine the forecasting method used. All forecasting methods show a cost reduction in their median and mean values between 2030 and 2050, which is consistent with the overall trend across all study types and methods on a global basis.
3.7. Comparison of forecasts from academia and grey literature
In addition to studies from the academic literature, forecasts from the grey literature were also integrated into the dataset of the review. Since the economy has a high interest in the use of hydrogen, high-quality studies are produced, which are enriched with the know-how of actual hydrogen producers. Therefore, these studies have a good rationale as well. Fig. 11 shows a comparison of cost forecasts from academic studies and forecasts from the grey literature. For 2020 and 2050 academic and grey literature report similar hydrogen production costs. The difference is only 13% and 3% respectively. However, grey reports indicate a steep cost reduction curve until 2030. In these studies, average production costs fall by 47% between 2020 and 2030. While academic literature predicts a decrease of production costs of 34%. Furthermore, grey literature indicates rising production costs after 2030 until 2050 of 13%, while academic literature assumes a cost reduction of 23%. These effects explain why both types result in similar costs in 2050. Nevertheless, there is a fundamental difference here: scientific studies assume that costs will fall monotonically throughout the investigation period, while grey reports predict a disproportionate decrease of production costs up to 2030, after which costs are expected to rise. Notably, grey reports do not contain any outliers, indicating that the study results are relatively consistent. This could be due to the fact that grey reports often rely on expert opinions or use them for core assumptions. Expert opinions tend to converge towards a consensus, whereas academic studies strictly follow their methods, resulting in greater variations in their results. Fig. 10 underlines this hypothesis as the expert elicitation is the only forecast method that shows no outliers. | ||
| Fig. 11 Comparison of forecasts for hydrogen production costs from academic and grey literature. “*” represents the arithmetic mean. “+” represents outliers. | ||
In this aggregated form, the rationale behind the cost increase after 2030, is due to very high demand. Which leads to sites with inferior production conditions also producing hydrogen, so that costs rise on average. This effect has also been described in the scientific literature in some studies.
3.8. Aggregation and outlook
One of the main purposes of this review is to aggregate the available literature on future production costs of hydrogen and to derive noticeable trends and anomalies. Therefore, Fig. 12 displays the collected data points broken down by production technology studied and gives a linear data fit of each production type. Data points above 15 € per kg have been truncated in the figure to allow the important areas of the graph to be magnified. In order to focus on the general production forecasts, only these studies were used for the regression. This is intended to make the results more meaningful. As these studies also provide the majority of data points, significant results can be achieved. As described above, a significant cost reduction for SMR and SMR + CCS is not evident. In fact, both technologies reveal a slight increase in costs. The linear regressions of the data points given for the technologies result in rising hydrogen production costs of 0.0072 € per kg per year for SMR and minimally decreasing costs of 0.0002 € per kg per year for SMR + CCS. This is probably due to rising raw material prices, which mostly offset any efficiency gains. In contrast, the data for hydrogen production by water electrolysis show a reduction rate of 0.0876 € per kg per year. The data regressions imply that hydrogen produced via electrolysis will be cheaper than SMR or SMR + CCS hydrogen in 2057 and 2059 respectively. Thus, hydrogen from electrolysis is significantly more expensive for more than 30 years, but will be the cheapest option in the long-term. Of course, these production processes heavily rely on natural gas and electricity. It is difficult to estimate the future costs of these resources accurately. However, from a macroeconomic perspective, natural gas is more likely to be affected by price increases due to its constant scarcity than electricity from renewable energies. The current trend suggests that renewable energies will become increasingly cheaper in the future, and they could only become more expensive due to increased demand. For natural gas, however, this price driver is also relevant. | ||
| Fig. 12 Scatter plot showing the predicted production costs for different hydrogen production technologies and a corresponding linear fits. The colored frames indicate the 95% confidence interval. | ||
As already described above, costs for CO2-certificates were not included. Therefore, real costs for SMR will rise in the future, depending on CO2-certificate prices set by regulators. Thus, cost parity could be achieved much sooner.
As an example, for the cheapest option today, SMR, the hydrogen production costs in the European Union would rise dramatically when incorporating current prices of the European Emission Trading System (EU ETS). In 2023, allowance prices in the EU ETS are around 85 € per t CO2.106 If this value is calculated with an emission of roughly 8.9 kg CO2 per kg H2, which are emitted in the production process of SMR, the production costs of hydrogen through SMR increase by 0.75 € per kg H2.107 As emissions are inherent in the process and certificate prices are likely to rise in the future, this value is still low looking forward.
This means that SMR-based hydrogen will remain the cheapest production method for a relatively long time, but governments can counteract this fact with CO2 taxes and achieve cost parity for electrolysis hydrogen much sooner. However, this will tend to increase the cost of hydrogen in the short and medium term. From a cost perspective, the production of hydrogen from natural gas for the scale-up of a hydrogen economy makes economic sense. However, this counteracts the background of the sustainable transformation, which makes the hydrogen economy necessary in the first place. Thus, two alternatives can be considered, depending on geographical and regulatory circumstances. First, countries with large natural gas reserves can use SMR + CCS to produce cheap hydrogen and inject the produced CO2 back into the earth. Second, countries with good local conditions for renewable energy production can use them to produce CO2-neutral hydrogen economically in the near future, which will become even cheaper in the long-term due to technological progress. This will allow these countries to advance towards the sustainable transformation and develop the infrastructure for green hydrogen early. Countries that do not meet both conditions, but still want to build a large hydrogen economy, can try to develop the cheapest and most efficient hydrogen logistics possible to source hydrogen from other regions, thus reducing overall economic costs. However, it is important to take into account the transport costs, which can make up a significant proportion of the total costs depending on the type of transport and distance. For example, transportation via pipeline in Europe costs around 0.90 € per kg, while shipping from Saudi Arabia to Central Europe costs around 1.58 € per kg.13 To minimize economic costs, it is therefore necessary to compare the marginal costs of additional imported hydrogen and self-produced hydrogen.
4 Conclusion
Predicted production costs of hydrogen from the scientific and non-scientific literature were compiled and analyzed. 89 studies were aggregated and several parameters including year of publication, analyzed production country and region, analyzed production process, type of forecast, forecast method and scientific vs. grey literature were investigated. This review cannot provide a general value for the production costs of hydrogen in the future, as too many parameters and approaches come together. But it is quite clear from the analysis that the costs of hydrogen from electrolyzers will drop sharply in the near-term and become competitive to hydrogen from SMR or SMR + CCS in the long-term. Furthermore, production costs are highly dependent on the production region both for electrolysis and natural gas-based processes. Europe is predicted to have the highest production costs, which will fall sharply but remain above the global average in the long term. In other economically important regions, costs are predicted to fall below 2 € per kg by 2050. Looking at the global aggregated numbers, a cost reduction of 35% (median: 28%) by 2030 and 49% (median: 43%) by 2050 from 2020 as reference can be assumed. So, hydrogen production costs of around 3 € per kg in 2030 and well below 3 € per kg in 2050 are feasible.This review is limited by some restrictions. First, some data subsets consist of only few data points, which serves as a weak basis for derived conclusions. Most highlighted analyses in this study are based on broader data bases, but some analyses with smaller basis have to be included to give a holistic overview. To inform the reader most figures include the number of data points. Second, analyzed studies have particular research targets which may not only include a forecast for hydrogen production cost. Multiple research targets of studies might lead to distorted results that have been transferred to this review.
This study provides an overview of expected hydrogen production costs and gives insights into the most significant influential factors on a global and cross-technological level. Thereby contributing to hydrogen cost forecasts by aggregating them and thus providing new high-level insights, and to the sustainable transformation of energy systems on a global scale, as academics can use this review as a basis for further analysis and benchmarking. The overview can also be used as a map for researchers to quickly find interesting and suitable studies for their topic. Also, policy makers are informed about the expected results of their efforts to promote hydrogen and decision-makers can expand their knowledge base for managing investment flows. Consequently, concepts can be adapted at an early stage based on this glimpse into the future.
Author contributions
Florian Frieden: conceptualization, data curation, formal analysis, investigation, methodology; validation, visualization, writing – original draft, writing – review & editing. Jens Leker: supervision, writing – review & editing, project administration.Conflicts of interest
Jens Leker has no conflicts of interest to declare. Florian Frieden is an employee at FutureCamp Climate GmbH.References
- V. Dieterich, A. Buttler, A. Hanel, H. Spliethoff and S. Fendt, Power-to-liquid via synthesis of methanol, DME or Fischer–Tropsch-fuels: a review, Energy Environ. Sci., 2020, 13, 3207–3252, 10.1039/D0EE01187H.
- L. Van Hoecke, et al., Challenges in the use of hydrogen for maritime applications, Energy Environ. Sci., 2021, 14, 815–843, 10.1039/D0EE01545H.
- Q.-L. Zhu and Q. Xu, Liquid organic and inorganic chemical hydrides for high-capacity hydrogen storage, Energy Environ. Sci., 2015, 8, 478–512, 10.1039/C4EE03690E.
- Hydrogen and Fuel Cell Technologies Office, Hydrogen Storage, 2023, available at https://www.energy.gov/eere/fuelcells/hydrogen-storage.
- N. Heinemann, et al., Enabling large-scale hydrogen storage in porous media – the scientific challenges, Energy Environ. Sci., 2021, 14, 853–864, 10.1039/D0EE03536J.
- P. P. Edwards, V. L. Kuznetsov and W. I. F. David, Hydrogen energy, Philos. Trans. R. Soc., A, 2007, 365, 1043–1056, DOI:10.1098/rsta.2006.1965.
- International Renewable Energy Agency (IRENA), World Energy Transitions, Outlook 2022: 1.5°C Pathway, 2022 Search PubMed.
- G. Maggio, A. Nicita and G. Squadrito, How the hydrogen production from RES could change energy and fuel markets: A review of recent literature, Int. J. Hydrogen Energy, 2019, 44, 11371–11384, DOI:10.1016/j.ijhydene.2019.03.121.
- T. Miyagawa and M. Goto, Hydrogen Production Cost Forecasts since the 1970s and Implications for Technological Development, Energies, 2022, 15, 4375, DOI:10.3390/en15124375.
- F. Ueckerdt, et al., Potential and risks of hydrogen-based e-fuels in climate change mitigation, Nat. Clim. Change., 2021, 11, 384–393, DOI:10.1038/s41558-021-01032-7.
- G. Glenk and S. Reichelstein, Economics of converting renewable power to hydrogen, Nat. Energy, 2019, 4, 216–222, DOI:10.1038/s41560-019-0326-1.
- M. Davis, A. Okunlola, G. Di Lullo, T. Giwa and A. Kumar, Greenhouse gas reduction potential and cost-effectiveness of economy-wide hydrogen-natural gas blending for energy end uses, Renew. Sustain. Energy Rev., 2023, 171, 112962, DOI:10.1016/j.rser.2022.112962.
- G. Brändle, M. Schönfisch and S. Schulte, Estimating long-term global supply costs for low-carbon hydrogen, Appl. Energy, 2020, 302, 117481, DOI:10.1016/j.apenergy.2021.117481.
- P. E. Dodds, Economics of hydrogen production, in Compendium of Hydrogen Energy, Elsevier, 2015, pp. 63–79 Search PubMed.
- B. Lee, et al., Projected economic outlook and scenario analysis for H2 production by alkaline water electrolysis on the basis of the unit electricity price, the learning rate, and the automation level, Sustainable Energy Fuels, 2019, 3, 1799–1807, 10.1039/C9SE00148D.
- N. Gerloff, Economic analysis of hydrogen production in Germany with a focus on green hydrogen, considering all three major water electrolysis technologies, Sustainable Energy Fuels, 2023, 7, 1893–1907, 10.1039/D3SE00073G.
- J. Sousa, W. Waiblinger and K. A. Friedrich, Techno-economic Study of an Electrolysis-Based Green Ammonia Production Plant, Ind. Eng. Chem. Res., 2022, 61, 14515–14530, DOI:10.1021/acs.iecr.2c00383.
- D. S. Mallapragada, E. Gençer, P. Insinger, D. W. Keith and F. M. O'Sullivan, Can Industrial-Scale Solar Hydrogen Supplied from Commodity Technologies Be Cost Competitive by 2030?, Cell Rep. Phys. Sci., 2020, 1, 100174, DOI:10.1016/j.xcrp.2020.100174.
- S. Shayegan, P. Pearson and D. Hart, Hydrogen for buses in London: A scenario analysis of changes over time in refuelling infrastructure costs, Int. J. Hydrogen Energy, 2009, 34, 8415–8427, DOI:10.1016/j.ijhydene.2009.06.084.
- X. Li, X. Lv, W. Zhang and C. Xu, Can energy storage make off-grid photovoltaic hydrogen production system more economical?, Front. Eng. Manag., 2023, 10, 672–694, DOI:10.1007/s42524-022-0245-x.
- N. Gurieff, B. Moghtaderi, R. Daiyan and R. Amal, Gas Transition: Renewable Hydrogen's Future in Eastern Australia's Energy Networks, Energies, 2021, 14, 3968, DOI:10.3390/en14133968.
- R. C. McKenna, et al., The future role of Power-to-Gas in the energy transition: Regional and local techno-economic analyses in Baden-Württemberg, Appl. Energy, 2018, 212, 386–400, DOI:10.1016/j.apenergy.2017.12.017.
- A. Babarit, et al., Techno-economic feasibility of fleets of far offshore hydrogen-producing wind energy converters, Int. J. Hydrogen Energy, 2018, 43, 7266–7289, DOI:10.1016/j.ijhydene.2018.02.144.
- R. Fusaro, V. Vercella, D. Ferretto, N. Viola and J. Steelant, Economic and environmental sustainability of liquid hydrogen fuel for hypersonic transportation systems, CEAS Space J., 2020, 12, 441–462, DOI:10.1007/s12567-020-00311-x.
- A. Rahil, R. Gammon, N. Brown, J. Udie and M. U. Mazhar, Potential economic benefits of carbon dioxide (CO2) reduction due to renewable energy and electrolytic hydrogen fuel deployment under current and long term forecasting of the Social Carbon Cost (SCC), Energy Reports, 2019, 5, 602–618, DOI:10.1016/j.egyr.2019.05.003.
- A. Ochoa Bique and E. Zondervan, An outlook towards hydrogen supply chain networks in 2050 — Design of novel fuel infrastructures in Germany, Chem. Eng. Res. Des., 2018, 134, 90–103, DOI:10.1016/j.cherd.2018.03.037.
- B. Lane, J. Reed, B. Shaffer and S. Samuelsen, Forecasting renewable hydrogen production technology shares under cost uncertainty, Int. J. Hydrogen Energy, 2021, 46, 27293–27306, DOI:10.1016/j.ijhydene.2021.06.012.
- ASReview, ASReview - Active learning for Systematic Reviews, 2023, available at, https://asreview.nl.
- L. Mauler, F. Duffner, W. G. Zeier and J. Leker, Battery cost forecasting: a review of methods and results with an outlook to 2050, Energy Environ. Sci., 2021, 14, 4712–4739, 10.1039/D1EE01530C.
- G. Pan, et al., Cost and low-carbon competitiveness of electrolytic hydrogen in China, Energy Environ. Sci., 2021, 14, 4868–4881, 10.1039/D1EE01840J.
- C. Stiller, A. M. Svensson, E. Rosenberg, S. Møller-Holst and U. Bünger, Building a hydrogen infrastructure in Norway, World Electr. Veh. J., 2009, 3, 104–113, DOI:10.3390/wevj3010104.
- J. F. Haltiwanger, J. H. Davidson and E. J. Wison, Renewable Hydrogen From the Zn/ZnO Solar Thermochemical Cycle: A Cost and Policy Analysis, J. Sol. Energy Eng., 2010, 132 DOI:10.1115/1.4002511.
- C. Stiller, et al., Pathways to a hydrogen fuel infrastructure in Norway, Int. J. Hydrogen Energy, 2010, 35, 2597–2601, DOI:10.1016/j.ijhydene.2009.04.003.
- C. Corgnale and W. A. Summers, Solar hydrogen production by the Hybrid Sulfur process, Int. J. Hydrogen Energy, 2011, 36, 11604–11619, DOI:10.1016/j.ijhydene.2011.05.173.
- C. Yang and J. M. Ogden, Renewable and low carbon hydrogen for California – Modeling the long term evolution of fuel infrastructure using a quasi-spatial TIMES model, Int. J. Hydrogen Energy, 2013, 38, 4250–4265, DOI:10.1016/j.ijhydene.2013.01.195.
- P. Agnolucci, O. Akgul, W. McDowall and L. G. Papageorgiou, The importance of economies of scale, transport costs and demand patterns in optimising hydrogen fuelling infrastructure: An exploration with SHIPMod (Spatial hydrogen infrastructure planning model), Int. J. Hydrogen Energy, 2013, 38, 11189–11201, DOI:10.1016/j.ijhydene.2013.06.071.
- S. De-León Almaraz, C. Azzaro-Pantel, L. Montastruc and S. Domenech, Hydrogen supply chain optimization for deployment scenarios in the Midi-Pyrénées region, France, Int. J. Hydrogen Energy, 2014, 39, 11831–11845, DOI:10.1016/j.ijhydene.2014.05.165.
- R. Loisel, L. Baranger, N. Chemouri, S. Spinu and S. Pardo, Economic evaluation of hybrid off-shore wind power and hydrogen storage system, Int. J. Hydrogen Energy, 2015, 40, 6727–6739, DOI:10.1016/j.ijhydene.2015.03.117.
- D. Ferrero, M. Gamba, A. Lanzini and M. Santarelli, Power-to-Gas Hydrogen: Techno-economic Assessment of Processes towards a Multi-purpose Energy Carrier, Energy Procedia, 2016, 101, 50–57, DOI:10.1016/j.egypro.2016.11.007.
- S. Rahmouni, N. Settou, B. Negrou and A. Gouareh, GIS-based method for future prospect of hydrogen demand in the Algerian road transport sector, Int. J. Hydrogen Energy, 2016, 41, 2128–2143, DOI:10.1016/j.ijhydene.2015.11.156.
- Hydrogen Council, How Hydrogen Empowers the Energy Transition, 2017 Search PubMed.
- Study on early business cases for H2 in energy storage and more broadly power to H2 applications, Final Report, 2017.
- S. König, et al., Spatially-resolved analysis of the challenges and opportunities of Power-to-Gas (PtG) in Baden-Württemberg until 2040, Energy Procedia, 2017, 135, 434–444, DOI:10.1016/j.egypro.2017.09.511.
- C. Cany, C. Mansilla, P. Da Costa and G. Mathonnière, Adapting the French nuclear fleet to integrate variable renewable energies via the production of hydrogen: Towards massive production of low carbon hydrogen?, Int. J. Hydrogen Energy, 2017, 42, 13339–13356, DOI:10.1016/j.ijhydene.2017.01.146.
- E. Ruffini and M. Wei, Future costs of fuel cell electric vehicles in California using a learning rate approach, Energy, 2018, 150, 329–341, DOI:10.1016/j.energy.2018.02.071.
- R. J. Detz, J. N. H. Reek and B. C. C. van der Zwaan, The future of solar fuels: when could they become competitive?, Energy Environ. Sci., 2018, 11, 1653–1669, 10.1039/C8EE00111A.
- A. Rahil, R. Gammon and N. Brown, Techno-economic assessment of dispatchable hydrogen production by multiple electrolysers in Libya, Journal of Energy Storage, 2018, 16, 46–60, DOI:10.1016/j.est.2017.12.016.
- L. Welder, et al., Spatio-temporal optimization of a future energy system for power-to-hydrogen applications in Germany, Energy, 2018, 158, 1130–1149, DOI:10.1016/j.energy.2018.05.059.
- S. Horvath, M. Fasihi and C. Breyer, Techno-economic analysis of a decarbonized shipping sector: Technology suggestions for a fleet in 2030 and 2040, Energy Convers. Manage., 2018, 164, 230–241, DOI:10.1016/j.enconman.2018.02.098.
- E. S. Hanley, J. P. Deane and B. Ó. P. Gallachóir, The role of hydrogen in low carbon energy futures–A review of existing perspectives, Renewable Sustainable Energy Rev., 2018, 82, 3027–3045, DOI:10.1016/j.rser.2017.10.034.
- J. E. Hoffmann, On the outlook for solar thermal hydrogen production in South Africa, Int. J. Hydrogen Energy, 2019, 44, 629–640, DOI:10.1016/j.ijhydene.2018.11.069.
- B. Emonts, et al., Flexible sector coupling with hydrogen: A climate-friendly fuel supply for road transport, Int. J. Hydrogen Energy, 2019, 44, 12918–12930, DOI:10.1016/j.ijhydene.2019.03.183.
- D. Coleman, M. Kopp, T. Wagner and B. Scheppat, The value chain of green hydrogen for fuel cell buses – A case study for the Rhine-Main area in Germany, Int. J. Hydrogen Energy, 2020, 45, 5122–5133, DOI:10.1016/j.ijhydene.2019.06.163.
- N. Tenhumberg and K. Büker, Ecological and Economic Evaluation of Hydrogen Production by Different Water Electrolysis Technologies, Chem. Ing. Tech., 2020, 92, 1586–1595, DOI:10.1002/cite.202000090.
- T. Longden, F. Jotzo, M. Prasad & R. Andrews, Green hydrogen production costs in Australia: implications of renewable energy and electrolyser costs, 2020 Search PubMed.
- Hydrogen Council, Path to hydrogen competitiveness. A cost perspective, 2020 Search PubMed.
- E. F. Bødal, D. Mallapragada, A. Botterud and M. Korpås, Decarbonization synergies from joint planning of electricity and hydrogen production: A Texas case study, Int. J. Hydrogen Energy, 2020, 45, 32899–32915, DOI:10.1016/j.ijhydene.2020.09.127.
- L. Janke, et al., Techno-Economic Assessment of Demand-Driven Small-Scale Green Hydrogen Production for Low Carbon Agriculture in Sweden, Front. Energy Res., 2020, 8 DOI:10.3389/fenrg.2020.595224.
- B. Lux and B. A. Pfluger, supply curve of electricity-based hydrogen in a decarbonized European energy system in 2050, Appl. Energy, 2020, 269, 115011, DOI:10.1016/j.apenergy.2020.115011.
- H. Böhm, A. Zauner, D. C. Rosenfeld and R. Tichler, Projecting cost development for future large-scale power-to-gas implementations by scaling effects, Appl. Energy, 2020, 264, 114780, DOI:10.1016/j.apenergy.2020.114780.
- F. I. Gallardo, et al., A Techno-Economic Analysis of solar hydrogen production by electrolysis in the north of Chile and the case of exportation from Atacama Desert to Japan, Int. J. Hydrogen Energy, 2020, 46, 13709–13728, DOI:10.1016/j.ijhydene.2020.07.050.
- M. Fasihi and C. Breyer, Baseload electricity and hydrogen supply based on hybrid PV-wind power plants, J. Clean. Prod., 2020, 243, 118466, DOI:10.1016/j.jclepro.2019.118466.
- T. A. Gunawan, et al., At What Cost Can Renewable Hydrogen Offset Fossil Fuel Use in Ireland's Gas Network?, Energies, 2020, 13, 1798, DOI:10.3390/en13071798.
- P. K. Rose and F. Neumann, Hydrogen refueling station networks for heavy-duty vehicles in future power systems, Transp. Res. D: Transp. Environ., 2020, 83, 102358, DOI:10.1016/j.trd.2020.102358.
- S. P. Filippov and A. V. Keiko, Coal Gasification: At the Crossroads. Economic Outlook, Therm. Eng., 2021, 68, 347–360, DOI:10.1134/S0040601521050049.
- Hydrogen Council, Hydrogen Insights, 2021 Search PubMed.
- Prognos, Öko-Institut & Wuppertal-Institut, Klimaneutrales Deutschland 2045, Wie Deutschland seine Klimaziele schon vor 2050 erreichen kann, 2021 Search PubMed.
- V. Vijayakumar, A. Jenn and L. Fulton, Low Carbon Scenario Analysis of a Hydrogen-Based Energy Transition for On-Road Transportation in California, Energies, 2021, 14, 7163, DOI:10.3390/en14217163.
- A. Kim, H. Kim, H. Lee, B. Lee and H. Lim, Comparative Economic Optimization for an Overseas Hydrogen Supply Chain Using Mixed-Integer Linear Programming, ACS Sustainable Chem. Eng., 2021, 9, 14249–14262, DOI:10.1021/acssuschemeng.1c05446.
- C. Sejkora, J. Lindorfer, L. Kühberger and T. Kienberger, Interlinking the Renewable Electricity and Gas Sectors: A Techno-Economic Case Study for Austria, Energies, 2021, 14, 6289, DOI:10.3390/en14196289.
- G. Pan, et al., Cost and low-carbon competitiveness of electrolytic hydrogen in China, Energy Environ. Sci., 2021, 14, 4868–4881, 10.1039/D1EE01840J.
- H. Phoumin, F. Taghizadeh-Hesary, F. Kimura & J. Arima, Energy Sustainability and Climate Change in ASEAN, Springer Singapore, Singapore, 2021 Search PubMed.
- M. H. Ali Khan, et al., Designing optimal integrated electricity supply configurations for renewable hydrogen generation in Australia, iScience, 2021, 24, 102539, DOI:10.1016/j.isci.2021.102539.
- E. Carrera and C. Azzaro-Pantel, Bi-objective optimal design of Hydrogen and Methane Supply Chains based on Power-to-Gas systems, Chem. Eng. Sci., 2021, 246, 116861, DOI:10.1016/j.ces.2021.116861.
- R. Perez, A. Brent and J. Hinkley, Assessment of the Potential for Green Hydrogen Fuelling of Very Heavy Vehicles in New Zealand, Energies, 2021, 14, 2636, DOI:10.3390/en14092636.
- B. Koirala, et al., Integrated electricity, hydrogen and methane system modelling framework: Application to the Dutch Infrastructure Outlook 2050, Appl. Energy, 2021, 289, 116713, DOI:10.1016/j.apenergy.2021.116713.
- R. McKenna, M. D'Andrea and M. G. González, Analysing long-term opportunities for offshore energy system integration in the Danish North Sea, Adv. Appl. Energy, 2021, 4, 100067, DOI:10.1016/j.adapen.2021.100067.
- B. Lux, J. Gegenheimer, K. Franke, F. Sensfuß and B. Pfluger, Supply curves of electricity-based gaseous fuels in the MENA region, Comput. Ind. Eng., 2021, 162, 107647, DOI:10.1016/j.cie.2021.107647.
- S. Song, et al., Production of hydrogen from offshore wind in China and cost-competitive supply to Japan, Nat. Commun., 2021, 12, 6953, DOI:10.1038/s41467-021-27214-7.
- International Energy Agency (IEA), Global Hydrogen Review, 2022 Search PubMed.
- T. Terlouw, C. Bauer, R. McKenna and M. Mazzotti, Large-scale hydrogen production via water electrolysis: a techno-economic and environmental assessment, Energy Environ. Sci., 2022, 15, 3583–3602, 10.1039/D2EE01023B.
- J. L. Janssen, M. Weeda, R. J. Detz and B. van der Zwaan, Country-specific cost projections for renewable hydrogen production through off-grid electricity systems, Appl. Energy, 2022, 309, 118398, DOI:10.1016/j.apenergy.2021.118398.
- J. F. George, V. P. Müller, J. Winkler and M. Ragwitz, Is blue hydrogen a bridging technology? - The limits of a CO2 price and the role of state-induced price components for green hydrogen production in Germany, Energy Policy, 2022, 167, 113072, DOI:10.1016/j.enpol.2022.113072.
- N. Skordoulias, E. I. Koytsoumpa and S. Karellas, Techno-economic evaluation of medium scale power to hydrogen to combined heat and power generation systems, Int. J. Hydrogen Energy, 2022, 47, 26871–26890, DOI:10.1016/j.ijhydene.2022.06.057.
- S. Öberg, M. Odenberger and F. Johnsson, The cost dynamics of hydrogen supply in future energy systems – A techno-economic study, Appl. Energy, 2022, 328, 120233, DOI:10.1016/j.apenergy.2022.120233.
- S. Song, et al., Deep decarbonization of the Indian economy: 2050 prospects for wind, solar, and green hydrogen, iScience, 2022, 25, 104399, DOI:10.1016/j.isci.2022.104399.
- V. M. Maestre, A. Ortiz and I. Ortiz, Transition to a low-carbon building stock. Techno-economic and spatial optimization of renewables-hydrogen strategies in Spain, J. Energy Storage, 2022, 56, 105889, DOI:10.1016/j.est.2022.105889.
- M. J. Ginsberg, M. Venkatraman, D. V. Esposito and V. M. Fthenakis, Minimizing the cost of hydrogen production through dynamic polymer electrolyte membrane electrolyzer operation, Cell Rep. Phys. Sci., 2022, 3, 100935, DOI:10.1016/j.xcrp.2022.100935.
- K. Gomonov, M. Reshetnikova and S. Ratner, Economic Analysis of Recently Announced Green Hydrogen Projects in Russia: A Multiple Case Study, Energies, 2023, 16, 4023, DOI:10.3390/en16104023.
- S. Revinova, I. Lazanyuk, S. Ratner and K. Gomonov, Forecasting Development of Green Hydrogen Production Technologies Using Component-Based Learning Curves, Energies, 2023, 16, 4338, DOI:10.3390/en16114338.
- A. Kim, H. Kim, D. Lim, S. Cheon and H. Lim, Materializing International Trade of Decarbonized Hydrogen Through Optimization in Both Economic and Environmental Aspects, ACS Sustainable Chem. Eng., 2023, 11, 155–167, DOI:10.1021/acssuschemeng.2c05024.
- A. Giampieri, J. Ling-Chin and A. P. Roskilly, Techno-economic assessment of offshore wind-to-hydrogen scenarios: A UK case study, Int. J. Hydrogen Energy, 2023, 52(Part B), 589–617, DOI:10.1016/j.ijhydene.2023.01.346.
- I. Maynard and A. Abdulla, Assessing benefits and costs of expanded green hydrogen production to facilitate fossil fuel exit in a net-zero transition, Renew. Energy Focus, 2023, 44, 85–97, DOI:10.1016/j.ref.2022.12.002.
- A. Dumančić, N. Vlahinić Lenz and G. Majstrović, Can Hydrogen Production Be Economically Viable on the Existing Gas-Fired Power Plant Location? New Empirical Evidence, Energies, 2023, 16, 3737, DOI:10.3390/en16093737.
- X. Huang, Y. Qu, Z. Zhu and Q. Wu, Techno-Economic Analysis of Photovoltaic Hydrogen Production Considering Technological Progress Uncertainty, Sustainability, 2023, 15, 3580, DOI:10.3390/su15043580.
- T. Galimova, M. Fasihi, D. Bogdanov and C. Breyer, Impact of international transportation chains on cost of green e-hydrogen: Global cost of hydrogen and consequences for Germany and Finland, Appl. Energy, 2023, 347, 121369, DOI:10.1016/j.apenergy.2023.121369.
- A. Guzzini, et al., A New Geographic Information System (GIS) Tool for Hydrogen Value Chain Planning Optimization: Application to Italian Highways, Sustainability, 2023, 15, 2080, DOI:10.3390/su15032080.
- C. Moran, et al., A flexible techno-economic analysis tool for regional hydrogen hubs – A case study for Ireland, Int. J. Hydrogen Energy, 2023, 48, 28649–28667, DOI:10.1016/j.ijhydene.2023.04.100.
- Q. V. Dinh, N. van Dinh, H. Mosadeghi, P. H. Todesco Pereira and P. G. Leahy, A geospatial method for estimating the levelised cost of hydrogen production from offshore wind, Int. J. Hydrogen Energy, 2023, 48, 15000–15013, DOI:10.1016/j.ijhydene.2023.01.016.
- J. Egerer, V. Grimm, K. Niazmand and P. Runge, The economics of global green ammonia trade – “Shipping Australian wind and sunshine to Germany”, Appl. Energy, 2023, 334, 120662, DOI:10.1016/j.apenergy.2023.120662.
- H. Liu, L. R. Clausen, L. Wang and M. Chen, Pathway toward cost-effective green hydrogen production by solid oxide electrolyzer, Energy Environ. Sci., 2023, 16, 2090–2111, 10.1039/D3EE00232B.
- U.S. Department of Energy, U.S. National Clean Hydrogen Strategy and Roadmap, 2023 Search PubMed.
- European Commission, Fit for 55: shifting from fossil gas to renewable and low-carbon gases, 2023, available at https://www.consilium.europa.eu/en/infographics/fit-for-55-hydrogen-and-decarbonised-gas-market-package-explained/.
- International Energy Agency (IEA), Global Hydrogen Review, 2023 Search PubMed.
- Inflation Reduction Act, Public Law 117–169, 117th US Congress, 2022 Search PubMed.
- European Energy Exchange AG. EU ETS Auctions, 2023, available at https://www.eex.com/de/marktdaten/umweltprodukte/eu-ets-auktionen.
- P. L. Spath & M. K. Mann, Life Cycle Assessment of Hydrogen Production via Natural Gas Steam Reforming, 2001 Search PubMed.
Footnote |
| † Electronic supplementary information (ESI) available. See DOI: https://doi.org/10.1039/d4se00137k |
| This journal is © The Royal Society of Chemistry 2024 |