
 Open Access Article
 This Open Access Article is licensed under a Creative Commons Attribution-Non Commercial 3.0 Unported Licence
Surface gallium oxide hydroxide species adsorbing carbon dioxide to enhance the photocatalytic activity of silver-loaded calcium titanate for carbon dioxide reduction with water†
Hongxuan
Qiu
 ,
Akira
Yamamoto
and
Hisao
Yoshida
*
,
Akira
Yamamoto
and
Hisao
Yoshida
*
Graduate School of Human and Environmental Studies, Kyoto University, Kyoto 606-8501, Japan. E-mail: yoshida.hisao.2a@kyoto-u.ac.jp
First published on 29th January 2024
Abstract
Photocatalytic conversion of carbon dioxide (CO2) has attracted considerable attention as a new method to build a carbon cycle. Particularly, photocatalytic reduction of CO2 using water as an electron and proton donor to yield carbon monoxide (CO) is quite valuable but challenging, where enhancement of CO2 adsorption on the photocatalyst surface may contribute to increasing the photocatalytic reaction rate. In this viewpoint, the surface modification was examined for an Ag/CTO photocatalyst that can promote CO2 reduction with water selectively, i.e., an Ag/GaOOH/CTO photocatalyst was prepared by a step-by-step loading method. As a result, the GaOOH species deposited on CaTiO3 with Ag NPs endowed the photocatalyst with enhanced CO2 adsorption properties to increase the CO yield more than 5 times. This short paper provides one of the strategies to improve the photocatalytic properties of CO2 reduction with water.
1. Introduction
Carbon dioxide (CO2) is one of the main greenhouse gases. Recently, the concept of carbon neutrality has been much recognized, so effectively converting excess CO2 in the air has become a new research hotspot. Among the possible methodologies, photocatalytic CO2 reduction with water to CO is an anticipated topic since CO can be easily separated from the reaction aqueous media and reprocessed into some carbon-containing products.1 However, artificial photosynthesis from CO2 to CO in aqueous solution is a challenging task because photoexcited electrons used for photocatalytic CO2 reduction can also be consumed for water splitting as a competitive reaction. Meanwhile, silver nanoparticles (Ag NPs) deposited on the photocatalyst surface by simple loading methods have been recognized as an excellent cocatalyst for selective CO2 reduction to yield CO.2As a non-toxic and low-cost photocatalytic material, a CaTiO3 (CTO) photocatalyst has been extensively exploited with modification. Especially, an Ag/CTO photocatalyst was demonstrated to promote CO2 reduction with water to form CO selectively.3,4 So far, we have developed some modification strategies, for example, modification of an Ag NP cocatalyst with other metal oxides such as Co3O4![[thin space (1/6-em)]](https://www.rsc.org/images/entities/char_2009.gif) 5 and addition of a Pr6O11 layer,6 where they interacted with the CTO photocatalyst and Ag NPs and contributed to the electron transfer or stabilization of Ag NPs, and modification with a Ga2O3 photoabsorber to provide additional photoexcited carriers to the Ag/CTO photocatalyst.7
5 and addition of a Pr6O11 layer,6 where they interacted with the CTO photocatalyst and Ag NPs and contributed to the electron transfer or stabilization of Ag NPs, and modification with a Ga2O3 photoabsorber to provide additional photoexcited carriers to the Ag/CTO photocatalyst.7
The adsorption of CO2 on the photocatalytic surface is the important first step of photocatalytic CO2 reduction before the successive surface reaction with protons and photoexcited electrons to form CO and H2O. Some materials feasible for CO2 adsorption to increase the CO production rate have been reported. For instance, Pr(OH)3 loaded on a Ga2O3 photocatalyst can absorb CO2 to become Pr2O2CO3 species in the reaction media and supply CO2 to the Ag cocatalyst beside.8 A Cu/g-C3N4 composite material can increase the yield of CO by adsorbing CO2 on the g-C3N4 surface and then being utilized by the supported Cu cocatalyst.9 A composite of GaOOH and Ga2O3 has been reported for the enhancement of the adsorption and the photocatalytic activity for CO2 reduction,10,11 where it has been proved that GaOOH has a certain ability to adsorb CO2 for the improvement of CO evolution. Therefore, the development of a CO2 adsorbent that is deposited on the photocatalyst surface might be a promising strategy.
In this paper, GaOOH and Ag NPs were loaded by a step-by-step method on the surface of a CTO photocatalyst. The surface GaOOH species were confirmed to have good CO2 adsorption properties to enhance the photocatalytic activity of the Ag/CTO photocatalyst for CO2 reduction with water.
2. Experimental section
2.1 Sample preparation
The synthesis of calcium titanate (CaTiO3) samples was carried out by a solid-state chemical reaction (SSR) method.12 The precursors CaCO3 (rare metallic, 99.9%) and TiO2 (rutile, Kojundo, 99.9%) in a stoichiometric ratio (1:1) were physical mixed in an aluminum mortar with 5 mL of ethanol for 10 min. After that, the white powder mixture taken in an aluminum crucible with a lid was heated in an electric muffle furnace at a rate of 200 K h−1 up to 1473 K, maintained at this temperature for 10 h, and then cooled down at a rate of 100 K h−1 to 773 K, followed by natural cooling down to room temperature. The obtained pale pink powder is denoted as CTO.
As for the surface modification of the photocatalyst, the first step is a deposition of GaOOH on the bare CTO surface. Then 1 mL ammonia solution of 28% (Nacalai) was added into a beaker containing 100 mL of ion-exchanged solution, and the pH value was set at about 12.0. And 725 μL of 0.1 M solution of precursor Ga(NO3)3 (Wako) was added and stirring for 10 min, and then the prepared CTO was added. The temperature of the water bath was maintained at 353 K. After stirring it at 353 K for 3 h, the powder was filtered and dried at 353 K overnight, and the obtained sample is referred to as GaOOH(x)/CTO, where x is the added amount of GaOOH in wt%. In the same procedure, a homemade GaOOH sample was prepared without adding CTO.
The second step is loading Ag NPs by a chemical reduction (CR) method. The obtained GaOOH(x)/CTO or bare CTO sample was added to 100 mL of ion-exchanged solution, followed by addition of 3.0 g of NaH2PO2 (Nacalai) and 187 μL of 0.5 M aqueous solution of AgNO3 (Nacalai) into the solution. After stirring in a water bath for 2 h at 353 K, the resulting powder was filtered and washed twice with 100 mL ion-exchanged water at room temperature. The final sample is referred to as Ag(y)/GaOOH(x)/CTO or Ag(y)/CTO, where y is the loading amount of Ag in wt%.
2.2 Characterization
X-ray diffraction pattern (XRD) was recorded using a Lab X XRD-6000 (Shimadzu) with Cu Kα radiation (40 kV, 30 mA). Ag K-edge and Ga K-edge XAFS measurements were performed in transmission mode at NW-10A and BL-9A, respectively, of KEK-PF (Tsukuba, Japan). Diffuse reflectance (DR) UV-vis spectra were recorded using a V-570 UV/vis/NIR spectrophotometer (JASCO). The morphologies and surface compositions of the samples were observed by scanning electron microscopy (SEM, 3.0 kV, a SU-8220, Hitachi) with energy dispersive X-ray spectroscopy (EDS, 15.0 kV). The loading of elements was estimated using an X-ray fluorescence equipment (XRF, an EDX-8000, Shimadzu). FT-IR spectra were recorded on a FT/IR-4700 spectrometer (JASCO) in diffuse reflectance mode for powder-type samples at room temperature. The Brunauer–Emmett–Teller (BET) specific surface area of several samples was evaluated by N2 adsorption at 77 K with a Monosorb MS-21 (Quantachrome).2.3 Photocatalytic reaction test
Photocatalytic reaction test for CO2 reduction with water was conducted in an inner-irradiation reactor with a 100 W high-pressure Hg lamp with 2.78 mW cm−2 irradiation measured at 360 ± 10 nm. 0.3 g of the sample powder (0.28 g for the reuse) was dispersed in the reactor with 360 mL of ion-exchanged water containing 1.0 M NaHCO3 as a buffer, and then magnetically stirred with a 30 mL min−1 bubbling flow of CO2 under dark conditions for 1.0 h and then the photoirradiation was started, where the reaction temperature was controlled at 290 K with a cooling water system. The amount of gas generated was analyzed at each scheduled time with a gas chromatograph (Shimadzu, a GC-8A, TCD, Shincarbon ST column, Ar carrier). Since the detected gaseous products were limited to H2, O2 and CO, the main reaction equations should be as follows (eqn (1)−(3)):| H2O + 2h+ → ½O2 + 2H+ | (1) |
| CO2 + 2H+ + 2e− → CO + H2O | (2) |
| 2H+ + 2e− → H2 | (3) |
The selectivity of CO (SCO) among the reduced products and the ratio of the electrons and holes used for productions, R(e−/h+), are defined as shown in eqn (4) and (5), respectively.
| SCO (%) = RCO × 100/(RCO + RH2) | (4) |
| R(e−/h+) = (RCO + RH2)/2RO2 | (5) |
Photocatalytic performance test for water splitting was carried out in a similar way to the above experimental process without the addition of NaHCO3 in the solution with a 30 mL min−1 bubbling flow of Ar instead of a CO2 flow.
3. Results and discussion
3.1 Characterization of the samples
The actual loading amounts of Ag and Ga species in the prepared samples were measured by XRF (Table S1†), showing that they are deposited on the CTO almost as expected in the present preparation method.The XRD patterns of the samples are shown in Fig. 1. The diffraction pattern of the bare CTO sample prepared by the SSR method was identical to that of the standard CaTiO3 pattern and no impurity phase was found (Fig. 1a). As for the XRD pattern of the GaOOH(5.0)/CTO sample (Fig. 1b), there was no clear peak for GaOOH. In the Ag/GaOOH/CTO sample (Fig. 1c), no peak assignable to GaOOH was found while the characteristic peaks of Ag were observed at 38.2° and 44.6°.13 Another sample of the homemade GaOOH without CTO showed an XRD pattern with four obvious diffraction peaks at 21.7°, 33.9°, 37.4° and 54.2° (Fig. S1a†), which are well matched with the standard pattern, indicating that this sample contained the GaOOH phase. However, the diffraction intensity of the GaOOH sample was very small and the same as the background noise (Fig. S1a†), indicating that the crystallinity of the prepared material is not very high. Thus, the Ga species deposited on the CTO sample was suggested to be amorphous GaOOH species and its low loading or low crystallinity would make it unclear in the XRD pattern of the Ag/GaOOH/CTO sample.
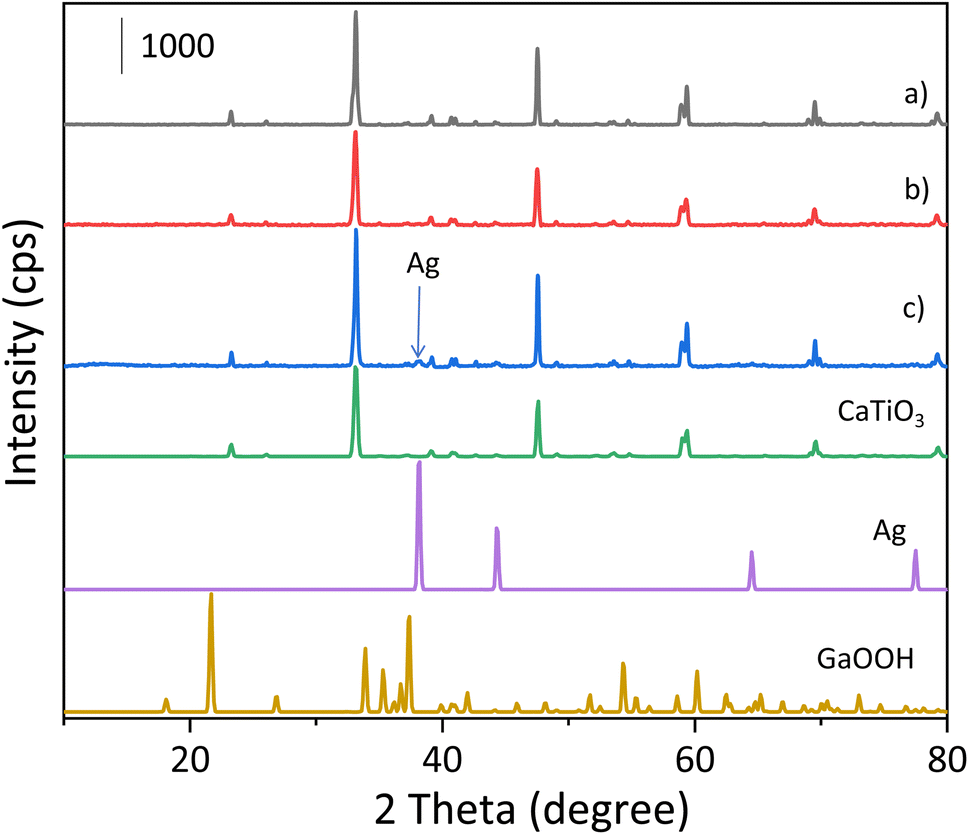 | ||
| Fig. 1 XRD patterns of (a) the bare CTO sample, (b) the GaOOH(5.0)/CTO sample, and (c) the Ag(5.0)/GaOOH(5.0)/CTO sample. The standard patterns from the ICSD database are also shown for CaTiO3 (ICSD#162909), Ag (ICSD#44387), and GaOOH (ICSD#409671). | ||
The chemical states of the surface additives were analyzed by X-ray absorption near-edge structure (XANES, Fig. 2). As for Ag K-edge XANES (Fig. 2A), the spectral shape for the Ag(1.0)/CTO sample is similar to that for Ag foil, which proves that the Ag species prepared by the CR method is close to metallic Ag (Fig. 2Aa). Furthermore, the XANES spectrum of the Ag/GaOOH/CTO sample is similar to that of Ag(1.0)/CTO (Fig. 2Ab), meaning that the surface Ga species loaded in advance has no effect on the chemical state of the successively added Ag species. As for Ga K-edge XANES (Fig. 2B), the curves of the two samples are similar to each other and similar to that of the reference GaOOH sample, which indicates that these Ga species have a similar local structure to that in the GaOOH phase. This revealed that no new chemical compound was generated from Ag and Ga species and the reductant, NaH2PO2, also had no influence on the chemical state of the Ga species on the CTO surface.
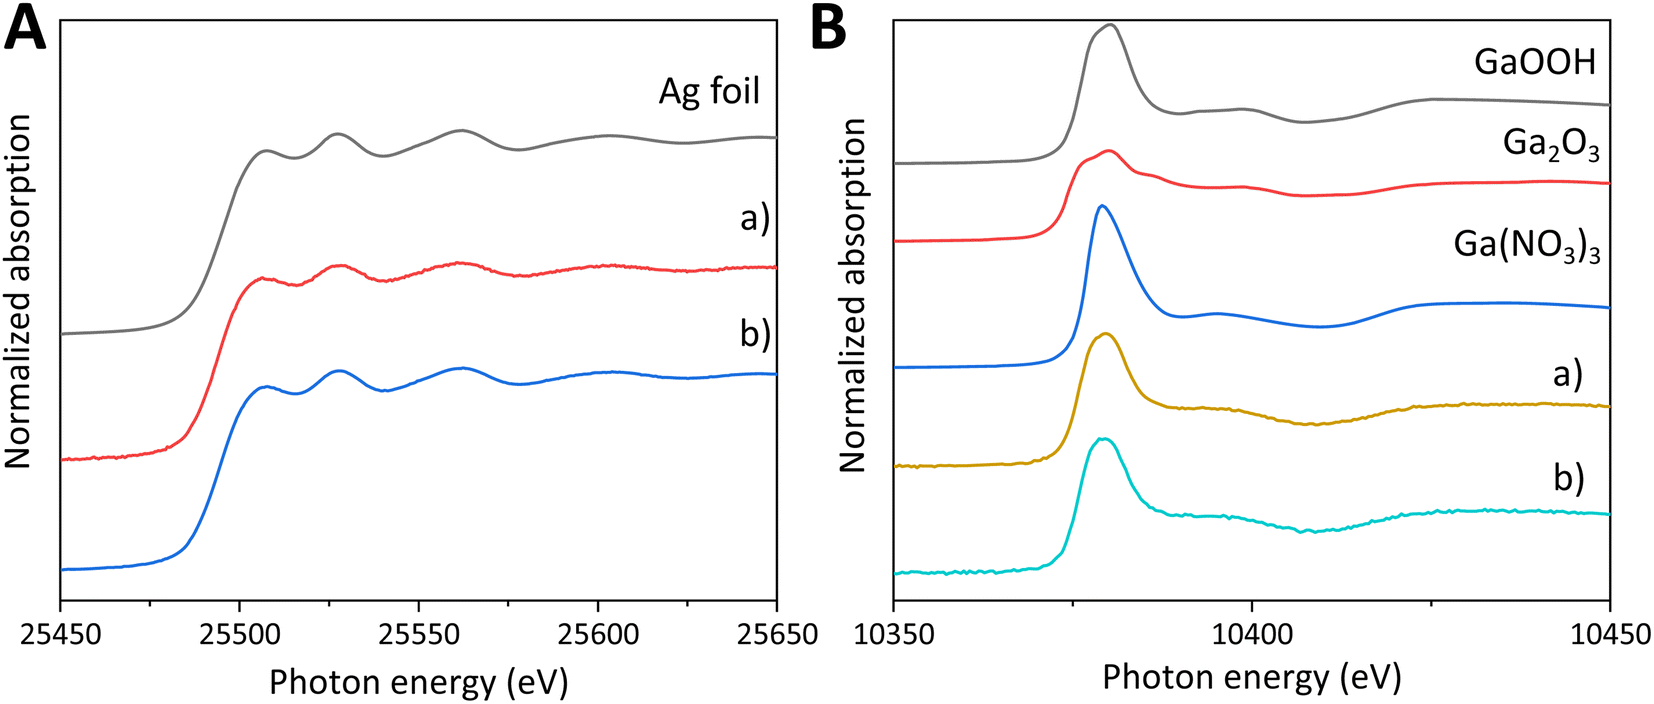 | ||
| Fig. 2 [A] Ag K-edge XANES of the samples, (a) Ag(1.0)/CTO, and (b) Ag(1.0)/GaOOH(1.0)/CTO, and [B] Ga K-edge XANES of the samples, (a) GaOOH(1.0)/CTO, and (b) Ag(1.0)/GaOOH(1.0)/CTO. | ||
The structures and morphologies of the samples were investigated by SEM and the actual positions of metal elements were monitored by SEM-EDS. The CTO prepared by the SSR method consisted of polyhedral shaped particles with different sizes (Fig. 3A). After loading Ag (Fig. 3B), very small white spots with random loading positions can be seen, suggesting that Ag species are deposited as NPs (6.5 nm in Fig. S2A†). When single GaOOH is loaded on the CTO (Fig. 3C), surface thin layer species can be observed as the flocculent structure of GaOOH species, which is consistent with the poor crystallinity of XRD results (Fig. S1†). By loading GaOOH and Ag in this sequence, both thin layer species and fine Ag NPs (7.5 nm in Fig. S2B†) are uniformly loaded on the surface of the CTO crystals (Fig. 3D). According to SEM-EDS observation (Fig. 3E), Ag NPs almost covered the surface of CTO, and some positions of Ag overlapped with that of Ga, indicating that Ag NPs are loaded on both the surface of GaOOH and the undecorated part of the CTO surface.
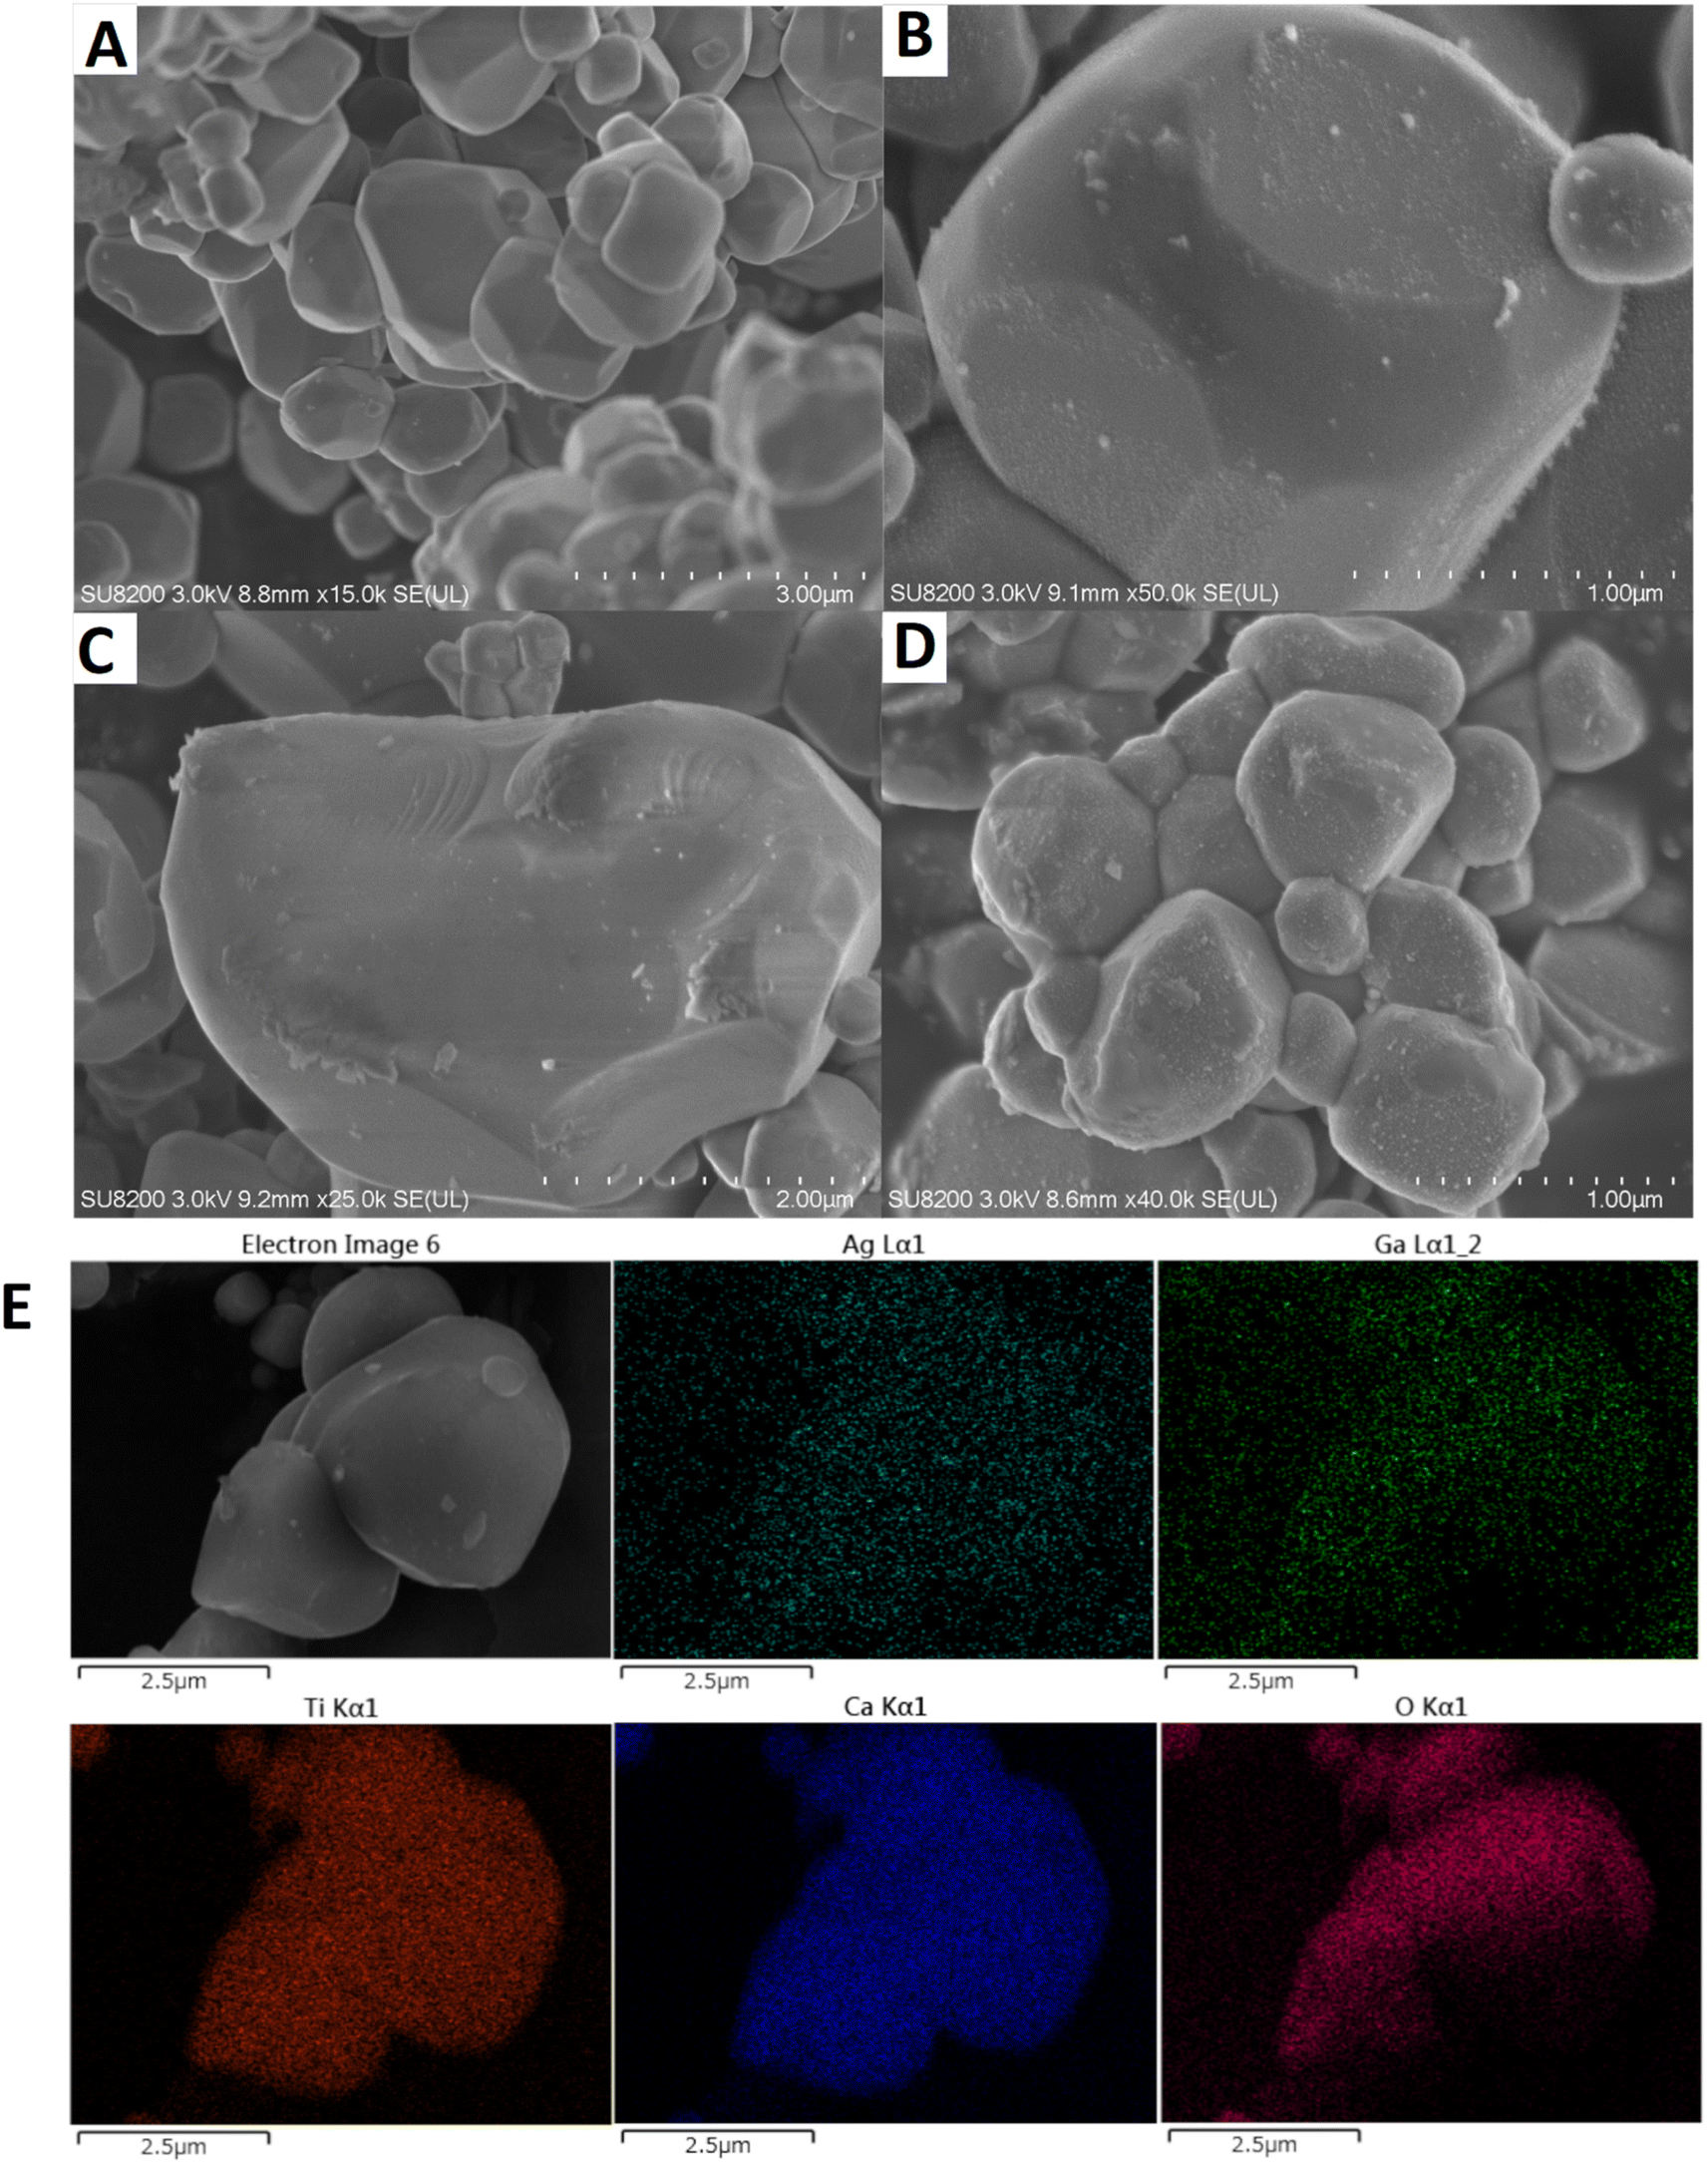 | ||
| Fig. 3 SEM images of the samples, [A] bare CTO, [B] Ag(1.0)/CTO, [C] GaOOH(1.0)/CTO, and [D] Ag(1.0)/GaOOH(1.0)/CTO. [E] SEM image and EDS elemental mappings of the sample D. | ||
The optical properties are investigated by DR UV-vis spectroscopy. The band gap of the CTO sample prepared by the SSR method is estimated to be around 3.5 eV (Fig. 4a), which is similar to a previous report.7 The Ag(1.0)/CTO sample showed the characteristic peaks of Ag NPs centered at around 540 nm assignable to the localized surface plasmon resonance (LSPR) (Fig. 4b),14 which is good evidence for the presence of Ag NPs. The spectrum of the GaOOH/CTO sample (Fig. 4c) has a very small broad peak around 450–550 nm. As for the bare GaOOH, there is a small peak around 400 nm (Fig. 4e).15 Besides, the deposition of GaOOH has no large effect on the main photoabsorption of the CTO crystal in the UV light region (Fig. 4a and c), which is consistent with the limited absorption of GaOOH in the deep UV region (Fig. 4e). The combination of the Ag NPs and GaOOH species provided a characteristic peak centered at 450 nm (Fig. 4d), showing that the Ag NPs interacted with the GaOOH species on the CTO surface and a little affected the properties of the formed Ag NPs.
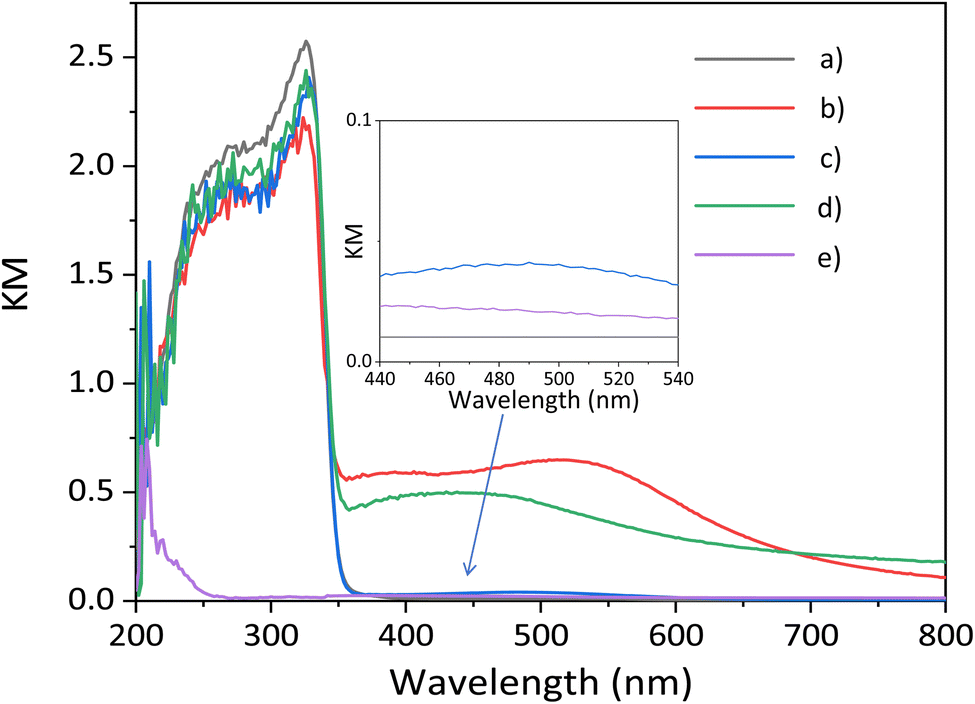 | ||
| Fig. 4 The DR UV-vis spectra of the samples, (a) bare CaTiO3, (b) Ag(1.0)/CTO, (c) GaOOH(1.0)/CTO, (d) Ag(1.0)/GaOOH(1.0)/CTO, and (e) bare GaOOH. | ||
GaOOH was reported to be an adsorptive material for CO2.10,16 To explore the CO2 adsorption properties of the photocatalyst surface, the FT-IR spectra of some treated samples were recorded and are shown in Fig. 5. Samples were treated in a similar way to the reaction test as follows: they were photoirradiated under the reaction conditions, i.e., in an aqueous solution of NaHCO3 with CO2 bubbling, filtered, and dried at room temperature before the measurement (Fig. 5b–d). Although the measurements were carried out under ambient conditions, some differences in the spectra were observed as follows.
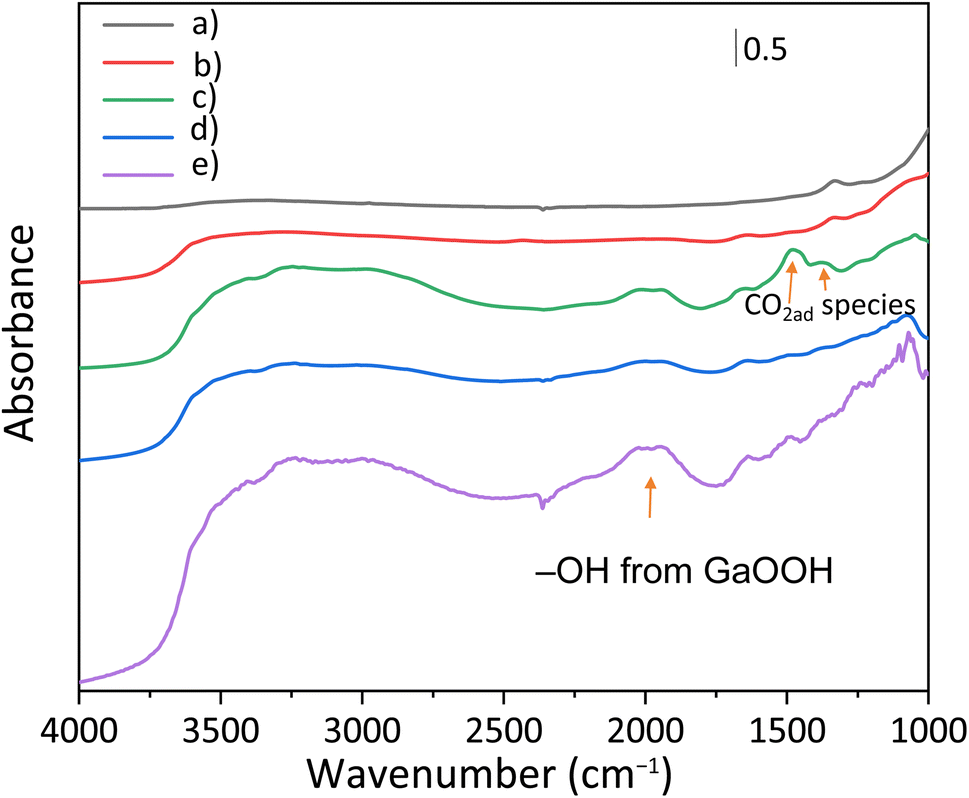 | ||
| Fig. 5 FT-IR spectra of the treated and untreated samples, (a) untreated bare CTO, (b) treated CTO, (c) treated GaOOH(1.0)/CTO, (d) treated Ag(1.0)/GaOOH(1.0)/CTO, and (e) untreated bare GaOOH. As the pretreatment, the samples (b–d) were photoirradiated in a 1.0 M NaHCO3 solution with a bubbling CO2 flow, followed by filtering and drying at room temperature. | ||
For the untreated bare CTO (Fig. 5a), no obvious characteristic peak related to the adsorbed CO2 species was observed. The treated CTO sample also showed a similar spectrum to the bare CTO around 1500 cm−1, but the peak around 3350 cm−1 assignable to OH stretching vibration increased (Fig. 5b).17 The treated GaOOH/CTO (Fig. 5c) and Ag/GaOOH/CTO (Fig. 5d) samples showed absorption bands around 2000 cm−1, assailable to GaOOH.18,19 The bands were observed for the untreated bare GaOOH sample (Fig. 5e). In the treated GaOOH/CTO sample (Fig. 5c), the absorption bands at 1480 and 1370 cm−1 could be derived from vibration modes of the CO3 structures of bicarbonate (HCO3−)20 or carbonate (CO32−) ions.21 Meanwhile, the presence of the deposited Ag NPs reduced the absorption intensity, suggesting that the bicarbonate/carbonate ions would be consumed by the surface reaction accelerated by the Ag NP cocatalyst. Surface CO32− ions were also proposed to be mainly utilized for photocatalytic CO2 reduction.22 Thus, the Ag NPs in the Ag/GaOOH/CTO sample would cooperate with the adsorption properties of GaOOH to increase CO production as discussed later.
3.2 Photocatalytic performance
The above discussion has confirmed the fact that the surface GaOOH species can adsorb CO2 in the reaction solution. Fig. 6 shows the results of the photocatalytic reaction test for CO2 reduction with water in the presence of the samples. The bare CTO sample showed a low photocatalytic activity with a low CO selectivity of only 13.1% (Fig. 6a), consistent with previous results.23 The bare GaOOH sample did not exhibit photocatalytic activity (Fig. 6b).10 The GaOOH/CTO sample shows a similar activity to bare CTO (Fig. 6c), which means that the addition of the GaOOH species on the surface could not improve the photocatalytic activity of the bare CTO for CO2 reduction. In other words, the CO2 adsorption properties of the GaOOH layer are not solely helpful for enhancing the photocatalytic performance of the CTO photocatalyst, i.e., the CO2 adsorbed by the GaOOH cannot be converted to CO without the Ag cocatalyst. As reported, the Ag/CTO photocatalyst exhibited photocatalytic activity for CO2 reduction to form CO with high selectivity such as 95% (Fig. 6d).24 Further, it is noted that the addition of the GaOOH species on the CTO surface before loading Ag NPs significantly increased the CO yield by more than five times (11.1 μmol h−1), and the CO selectivity was also improved (99.5%) (Fig. 6e). A study mentioned that the loading of GaOOH on the Ga2O3 photocatalyst can increase the specific surface area for adsorbing more CO2 for the enhancement of CO evolution.11 However, in the present case, only 1.0 wt% GaOOH cannot greatly increase the specific surface area of the bare CTO (Table S2†). Hence, it is suggested that the CO2 adsorption properties of the surface GaOOH layer can enhance the probability of CO2 reduction by the aid of the Ag cocatalyst. This is consistent with the FT-IR results, i.e., the adsorbed CO32− species on the GaOOH layer reacted and did not remain in the presence of the Ag NP cocatalyst.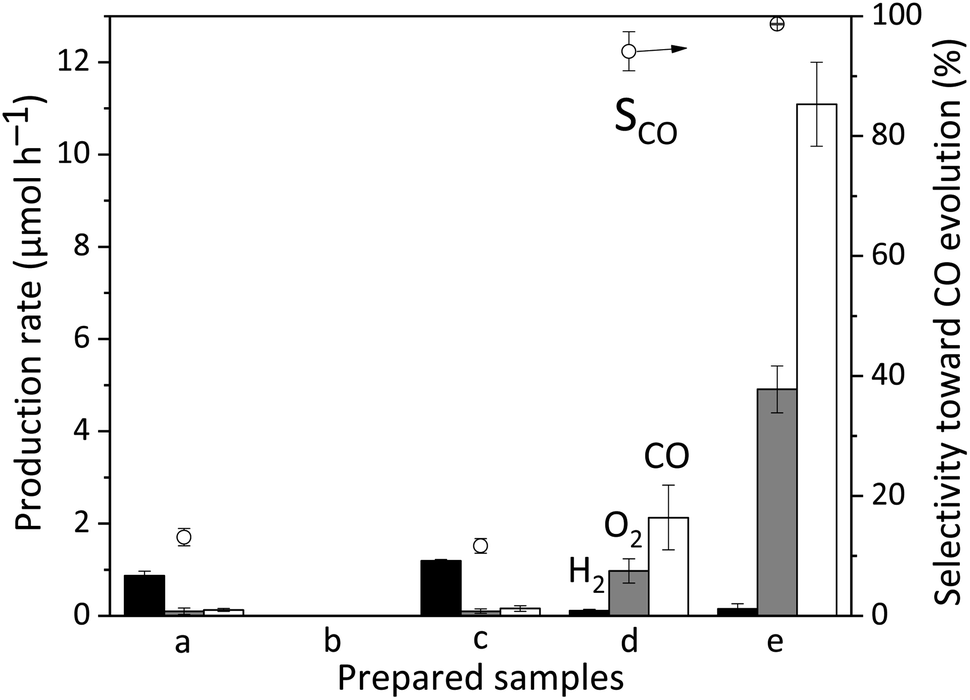 | ||
| Fig. 6 Results of the photocatalytic reaction tests for CO2 reduction with water over the various samples, (a) bare CaTiO3, (b) bare GaOOH, (c) GaOOH(1.0)/CTO, (d) Ag(1.0)/CTO, and (e) Ag(1.0)/GaOOH(1.0)/CTO. Production rates of CO (white bar), H2 (black bar), and O2 (gray bar) and the CO selectivity (SCO%, open circles) are shown for each sample. The data were recorded at 3.5 h after the start of photoirradiation. | ||
The effect of the GaOOH species deposited on the CTO surface for photocatalytic water splitting was also tested in pure water with the bubbling flow of Ar instead of CO2 (Table S3†). Under these conditions, water splitting took place over the bare CTO sample (Table S3† entry 1) although the production rates of H2 and O2 were lower than that with the CO2 bubbling flow (Fig. 6a), which would be due to the different pH conditions. The deposited GaOOH species slightly improved the activity of the bare CTO sample for water splitting in pure water, but the increment was limited (Table S3† entry 2), which was lower than the yield of H2 in the NaHCO3 solution with the bubbling flow of CO2 (Fig. 6c). Even the Ag(1.0)/GaOOH(1.0)/CTO sample showed a similarly low activity for water splitting (Table S3† entry). In summary, Ag and GaOOH are not sufficient for water splitting over the CTO in the pure water. These results clearly support that these additives, Ag and GaOOH, contribute to the adsorption and conversion of CO2 selectively.
The optimal amounts of Ag and Ga have been confirmed and shown in Fig. S3.† With increasing the Ga content, the product yields increased to attain the maximum at 1.0 wt%, followed by gradual decrease, indicating that the suitable number of the GaOOH layers improved the photocatalytic activity for CO2 reduction. To confirm the properties of the surface GaOOH species for CO2 adsorption, FT-IR spectra of the samples containing 0.5 and 1.0 wt% GaOOH were recorded (Fig. S4†). The characteristic peak assignable to CO2 adsorption species increases with the surface GaOOH species increasing, showing the CO2 adsorption properties of the GaOOH species that would promote the photocatalytic CO2 reduction to form CO; on the other hand, excessive GaOOH may limit the reaction field on the CTO surface to decrease the photocatalytic activity (Fig. S3A†). It could be seen from Fig. 3E that the GaOOH species of only 1 wt% almost covered the CTO.
Similarly, with the variation of the Ag loading, the CO and O2 yields showed a typical volcanic shape (Fig. S3B†). The Ag cocatalyst is important for photocatalytic CO2 reduction while its excess loading may lead to metal aggregation, thereby reducing the utilization rate of Ag NPs.23 These results showed that the loading amounts of both GaOOH and Ag NPs are 1.0 wt%.
A long-term reaction test was carried out to confirm the stability of the photocatalyst, which is shown in Fig. 7. The slight decrease of the CO production rate in the initial period may be due to the LSPR characteristics of Ag NPs,25i.e., the LSPR would change the state and properties of the Ag NPs. After that, it becomes stable from 3.5 h, and the R(e−/h+) is around 1.0. Therefore, it is proved that no other carbon-containing substances interfered with the photocatalytic reaction and no other products were formed, and the CaTiO3 photocatalyst loaded with Ag NPs and GaOOH function with a good stability.
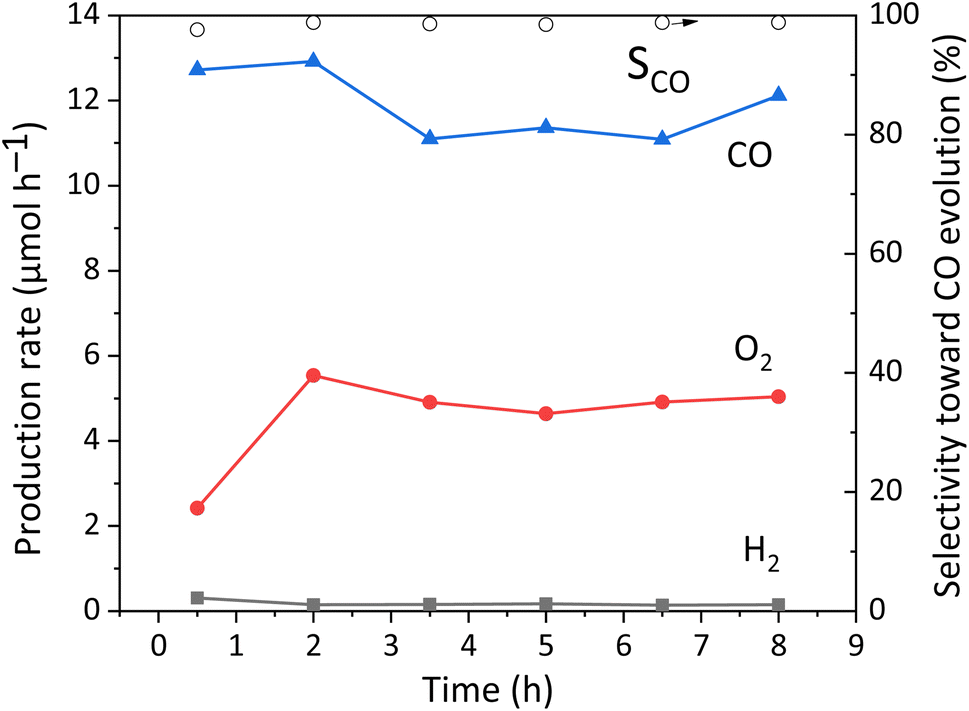 | ||
| Fig. 7 Time course of the production rates for CO (triangles), O2 (closed circles), and H2 (squares), and SCO (open circles) in the photocatalytic reaction test for CO2 reduction with water by using the Ag(1.0)/GaOOH(1.0)/CTO sample. | ||
The SEM images of the used sample revealed that the GaOOH and Ag still covered the CTO surface at the same positions (Fig. S5†), suggesting that the structure of the material is stable. The sample after use was examined for the second use in the photocatalytic reaction test (Table S4†). The activity of the reused sample was slightly weakened but it kept the high selectivity for photocatalytic CO2 reduction.
3.3 Mechanism
The above discussion proposed the reaction mechanism on the CTO photocatalyst loaded with the Ag NPs and GaOOH layers as follows. The adsorbed CO2 on the GaOOH layer is transported to small Ag NPs on the CTO surface where CO2 was reduced by the photoexcited electrons and protons to form CO as a reduced product (Fig. 8). Because GaOOH has a conduction band bottom with a more negative potential (Eg = 4.49 eV and CB = −1.66 eV)26 than that of CTO (Eg = 3.5 eV and CB = −0.8 eV),27 the photogenerated electrons produced by CTO cannot transfer to the GaOOH species, and thus the Ag NPs on the GaOOH layers cannot work as cocatalyst. Although the Ag/CTO photocatalyst originally has a good photocatalytic activity for the selective CO2 reduction with water,28 the CO2 adsorption properties of the surface GaOOH species further improve the photocatalytic activity such as by more than 5 times. In summary, the GaOOH layer on the CTO photocatalyst is an excellent CO2 adsorbing material, and the adsorbed CO2 could be efficiently reduced on the Ag NP cocatalyst deposited nearby on the CTO crystal, resulting in the increase of the yield and selectivity of CO. This work also suggests that the enhancement of CO2 adsorption is also one of the most important factors to improve the heterogeneous photocatalytic CO2 reduction in aqueous solution with CO2 bubbling.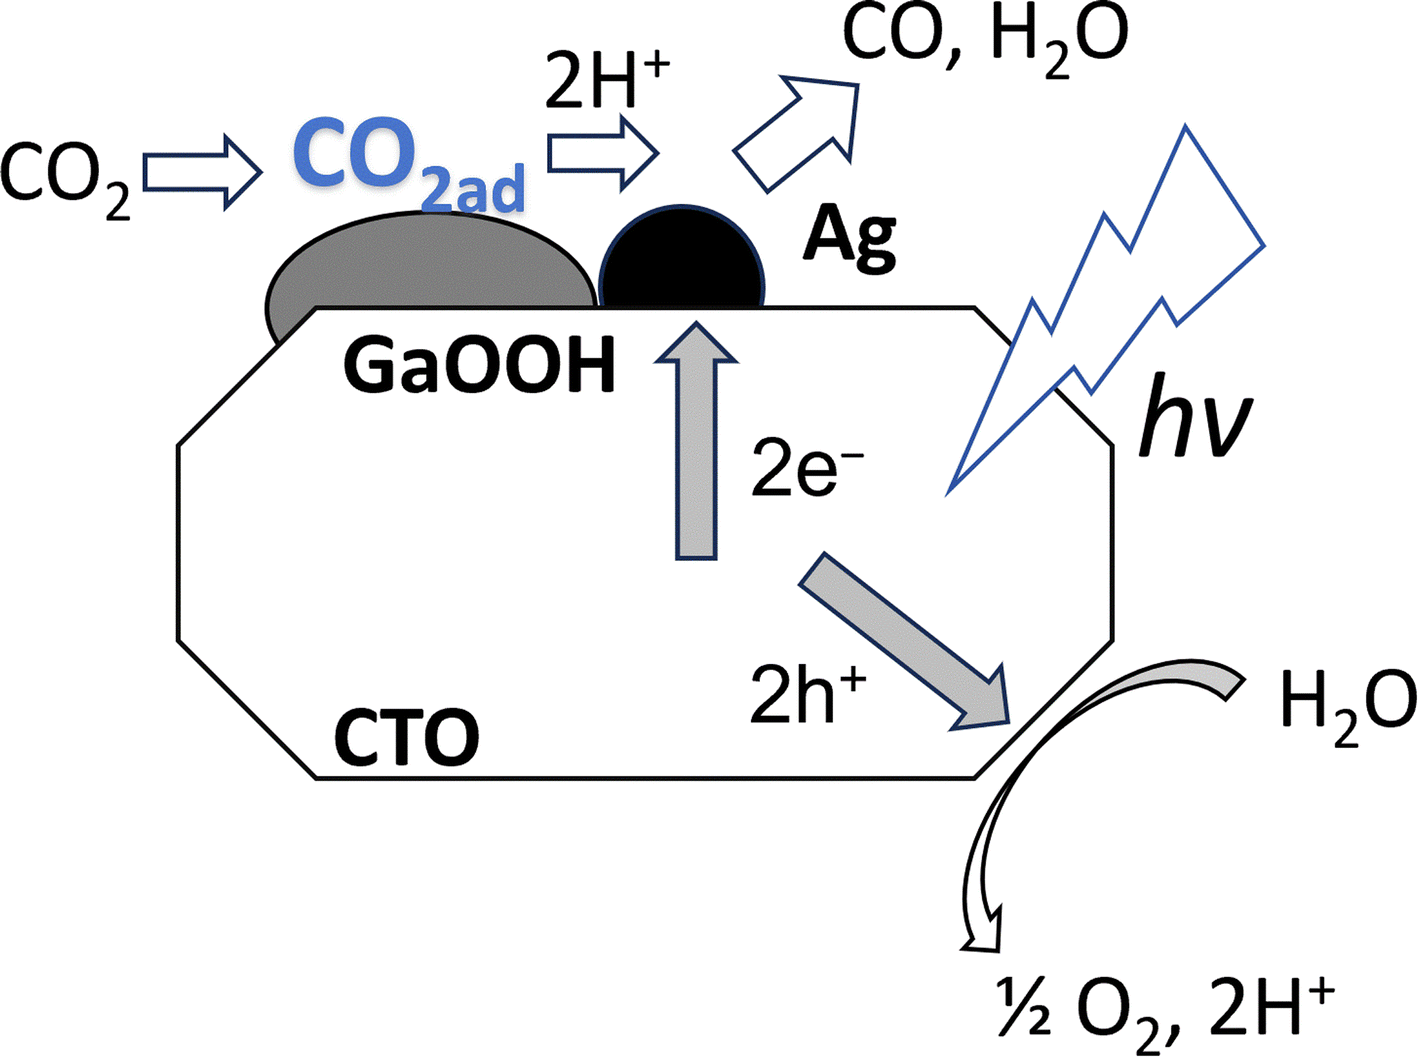 | ||
| Fig. 8 The scheme of photocatalytic CO2 reduction with the Ag(1.0)/GaOOH(1.0)/CTO photocatalyst. | ||
4. Conclusion
In this study, we illustrated a simple step-by-step procedure method to produce an Ag/GaOOH/CTO photocatalyst. The GaOOH sample loaded on the CaTiO3 photocatalyst is a good CO2 adsorber to provide some adsorbed CO2 species. Above all, the presence of both the GaOOH layer and small Ag NPs on the CTO photocatalyst cooperatively enhanced photocatalytic CO2 reduction with water to form CO selectively. This work identifies the function of GaOOH with Ag/CTO, which opens more possibilities for future research.Conflicts of interest
There are no conflicts to declare.Acknowledgements
The XAFS spectra of the samples were recorded at the NW10A and BL-9A of the Photon Factory (PF) with the approval of the Photon Factory Program Advisory Committee (proposal number 2022G549). This study was financially supported by the Joint Usage/Research Center for Catalysis (23DS0423) and a Grant-in-Aids for Scientific Research (B) (21H01975) and Challenging Research (Exploratory, 20K21108) from the Japan Society for the Promotion of Science (JSPS).References
- Y. Li, Y. Liu, X. Wang, S. Luo, D. Su, H. Jiang, H. Zhou, J. Pan and L. Feng, Biomethanation of syngas at high CO concentration in a continuous mode, Bioresour. Technol., 2022, 346, 126407 CrossRef CAS PubMed
.
- K. Iizuka, T. Wato, Y. Miseki, K. Saito and A. Kudo, Photocatalytic Reduction of Carbon Dioxide over Ag Cocatalyst-Loaded ALa4Ti4O15 (A = Ca, Sr, and Ba) Using Water as a Reducing Reagent, J. Am. Chem. Soc., 2011, 133(51), 20863–20868 CrossRef CAS PubMed
- A. Anzai, N. Fukuo, A. Yamamoto and H. Yoshida, Highly selective photocatalytic reduction of carbon dioxide with water over silver-loaded calcium titanate, Catal. Commun., 2017, 100, 134–138 CrossRef CAS
- H. Yoshida, L. Zhang, M. Sato, T. Morikawa, T. Kajino, T. Sekito, S. Matsumoto and H. Hirata, Calcium titanate photocatalyst prepared by a flux method for reduction of carbon dioxide with water, Catal. Today, 2015, 251, 132–139 CrossRef CAS
- H. Qiu, A. Yamamoto, E. Fudo, A. Tanaka, H. Kominami and H. Yoshida, Simultaneous Photodeposition of an Ag–Co Cocatalyst in Different pH Conditions To Improve the Activity of Calcium Titanate Photocatalyst for Carbon Dioxide Reduction with Water, ACS Appl. Energy Mater., 2023, 6(22), 11592–11601 CrossRef CAS
- H. Qiu, A. Anzai, T. Soltani, A. Yamamoto, E. Fudo, A. Tanaka, H. Kominami and H. Yoshida, Praseodymium Oxide Improving the Activity of a Silver-Loaded Calcium Titanate Photocatalyst for Carbon Dioxide Reduction with Water, ACS Appl. Energy Mater., 2023, 6(10), 5396–5406 CrossRef CAS
- H. Qiu, A. Yamamoto and H. Yoshida, Gallium Oxide Assisting Ag-Loaded Calcium Titanate Photocatalyst for Carbon Dioxide Reduction with Water, ACS Catal., 2023, 13(6), 3618–3626 CrossRef CAS
- Z. Huang, K. Teramura, H. Asakura, S. Hosokawa and T. Tanaka, CO2 capture, storage, and conversion using a praseodymium-modified Ga2O3 photocatalyst, J. Mater. Chem. A, 2017, 5(36), 19351–19357 RSC
- Z. Sun, W. Fang, L. Zhao and H. Wang, 3D porous Cu-NPs/g-C3N4 foam with excellent CO2 adsorption and Schottky junction effect for photocatalytic CO2 reduction, Appl. Surf. Sci., 2020, 504, 144347 CrossRef CAS
- Y. Kawaguchi, M. Yamamoto, A. Ozawa, Y. Kato and T. Yoshida, Effects of the crystalline structure of Ga2O3 on the photocatalytic activity for CO production from CO2, Surf. Interface Anal., 2019, 51(1), 79–84 CrossRef CAS
- T. Aoki, M. Yamamoto, T. Tanabe and T. Yoshida, Mixed phases of GaOOH/β-Ga2O3 and α-Ga2O3/β-Ga2O3 prepared by high energy ball milling as active photocatalysts for CO2 reduction with water, New J. Chem., 2022, 46(7), 3207–3213 RSC
- A. Anzai, K. Fujiwara, A. Yamamoto and H. Yoshida, Platinum-loaded lanthanum-doped calcium titanate photocatalysts prepared by a flux method for photocatalytic steam reforming of methane, Catal. Today, 2020, 352, 1–9 CrossRef
- X. Zhao, X. Zhang, D. Han and L. Niu, Ag Supported Z-Scheme WO2.9/g-C3N4 Composite Photocatalyst for Photocatalytic Degradation under Visible Light, Appl. Surf. Sci., 2020, 501, 144258 CrossRef CAS
- U. Ghosh, A. Pal and T. Pal, Plasmon Induced Near-Infrared Active Photocatalysts: A Review, Adv. Mater. Interfaces, 2022, 9(23), 2200465 CrossRef CAS
- B. Zhan, Q. Cui, W. Liu, J. Zhang, F. Zhan, J. Ning and G. Zou, Well Crystallized α-GaOOH Nanocrystals Synthesized through Hydrothermal Routes and Their Properties, Chin. J. Chem., 2009, 27(11), 2175–2177 CrossRef CAS
- Y. Gao, H. Xiao, X. Ma, Z. Yue, B. Geng, M. Zhao, L. Zhang, J. Zhang, J. Zhang, J. Jia and H. Wu, Cooperative adsorption of interfacial Ga-N dual-site in GaOOH@N-doped carbon nanotubes for enhanced electrocatalytic reduction of carbon dioxide, J. Colloid Interface Sci., 2024, 654, 339–347 CrossRef CAS PubMed
- M. Schwanninger, J. C. Rodrigues, H. Pereira and B. Hinterstoisser, Effects of short-time vibratory ball milling on the shape of FT-IR spectra of wood and cellulose, Vib. Spectrosc., 2004, 36(1), 23–40 CrossRef CAS
- J. Yang, Y. Zhao and R. L. Frost, Infrared and infrared emission spectroscopy of gallium oxide α-GaO(OH) nanostructures, Spectrochim. Acta Mol. Biomol. Spectrosc., 2009, 74(2), 398–403 CrossRef PubMed
- Y. Zhao, R. L. Frost, J. Yang and W. N. Martens, Size and Morphology Control of Gallium Oxide Hydroxide GaO(OH), Nano- to Micro-Sized Particles by Soft-Chemistry Route without Surfactant, J. Phys. Chem. C, 2008, 112(10), 3568–3579 CrossRef CAS
- S. E. Collins, M. A. Baltanás and A. L. Bonivardi, Infrared Spectroscopic Study of the Carbon Dioxide Adsorption on the Surface of Ga2O3 Polymorphs, J. Phys. Chem. B, 2006, 110(11), 5498–5507 CrossRef CAS
- M. Yamamoto, S. Yagi and T. Yoshida, Effect of Ag co-catalyst on CO2 adsorption states over Ga2O3 photocatalyst, Catal. Today, 2018, 303, 334–340 CrossRef CAS
- H. Tsuneoka, K. Teramura, T. Shishido and T. Tanaka, Adsorbed Species of CO2 and H2 on Ga2O3 for the Photocatalytic Reduction of CO2, J. Phys. Chem. C, 2010, 114(19), 8892–8898 CrossRef CAS
- T. Ishii, A. Anzai, A. Yamamoto and H. Yoshida, Calcium zirconate photocatalyst and silver cocatalyst for reduction of carbon dioxide with water, Appl. Catal. B Environ., 2020, 277, 119192 CrossRef CAS
- T. Soltani, X. Zhu, A. Yamamoto, S. P. Singh, E. Fudo, A. Tanaka, H. Kominami and H. Yoshida, Effect of transition metal oxide cocatalyst on the photocatalytic activity of Ag loaded CaTiO3 for CO2 reduction with water and water splitting, Appl. Catal. B Environ., 2021, 286, 119899 CrossRef CAS
- E. Kazuma, N. Sakai and T. Tatsuma, Nanoimaging of localized plasmon-induced charge separation, Chem. Commun., 2011, 47(20), 5777–5779 RSC
- M. Yang, D. Ren, S. Sun, J. Cui, Q. Yang, Y. Luo and S. Liang, One-pot construction of unprecedented direct Z-scheme ZnS/GaOOH heterojunction for photodegradation of antibiotics, Appl. Surf. Sci., 2022, 576, 151742 CrossRef CAS
- A. Kumar, V. Navakoteswara Rao, A. Kumar, M. Venkatakrishnan Shankar and V. Krishnan, Interplay between Mesocrystals of CaTiO3 and Edge Sulfur Atom Enriched MoS2 on Reduced Graphene Oxide Nanosheets: Enhanced Photocatalytic Performance under Sunlight Irradiation, ChemPhotoChem, 2020, 4(6), 427–444 CrossRef CAS
- Y. Zheng, M. Fan, K. Li, R. Zhang, X. Li, L. Zhang and Z.-A. Qiao, Ultraviolet-induced Ostwald ripening strategy towards a mesoporous Ga2O3/GaOOH heterojunction composite with a controllable structure for enhanced photocatalytic hydrogen evolution, Catal. Sci. Technol., 2020, 10(9), 2882–2892 RSC
Footnote |
| † Electronic supplementary information (ESI) available. See DOI: https://doi.org/10.1039/d3se01390a |
| This journal is © The Royal Society of Chemistry 2024 |