 Open Access Article
A deep decarbonization framework for the United States economy – a sector, sub-sector, and end-use based approach†
Saurajyoti
Kar
 a,
Troy R.
Hawkins
*a,
George G.
Zaimes
a,
Doris
Oke
a,
Troy R.
Hawkins
*a,
George G.
Zaimes
a,
Doris
Oke
 a,
Udayan
Singh
a,
Xinyi
Wu
a,
Hoyoung
Kwon
a,
Shannon
Zhang
a,
Guiyan
Zang
a,
Udayan
Singh
a,
Xinyi
Wu
a,
Hoyoung
Kwon
a,
Shannon
Zhang
a,
Guiyan
Zang
 a,
Yan
Zhou
a,
Amgad
Elgowainy
a,
Yan
Zhou
a,
Amgad
Elgowainy
 a,
Michael
Wang
a and
Ookie
Ma
b
aArgonne National Laboratory, USA. E-mail: thawkins@anl.gov
bOffice of Energy Efficiency and Renewable Energy, U.S. Department of Energy, USA
First published on 31st January 2024
Abstract
Achieving the United States' target of net-zero greenhouse gas emissions by 2050 will require technological transformations and energy sector mitigation. To understand the role of dynamically evolving technologies, identify synergies and dissonance and the effect of allocating limited low-carbon biomass resources in decarbonizing the U.S. economy, we developed the Decarbonization Scenario Analysis Model. A Life Cycle Assessment based approach is implemented considering the U.S. economy as the functional unit, to estimate greenhouse gas mitigation potential for projected energy demand based on several sector-level and cross-sectoral decarbonization pathways. Direct and supply-chain emissions are accounted, resulting from changes in patterns of energy generation and consumption, technology breakthroughs, and reductions in fugitive emissions over time at the granularity of economic sectors, sub-sectors, and end-use. Decarbonization strategies are implemented over a reference case developed using Energy Information Administration (EIA AEO) projection of economic activities for 2020–2050. Based on the considered scenarios, 80–90% economy-wide decarbonization relative to the 2020 reference case is projected. Electrification, low-carbon fuels, and reduction of fugitive emissions play the most significant role to decarbonization. The majority of the remaining emissions are accounted to the supply-chain and end-use emissions from natural gas and diesel fossil-based fuels in heavy duty transportation and heavy industries, highlighting the need for developing low-carbon and carbon-negative alternatives to mitigate those fossil-based carbon emissions.
1. Introduction
Reducing atmospheric greenhouse gas emissions and atmospheric concentrations is of pivotal importance for climate change mitigation and energy transitions. The Sixth Assessment Report of the Intergovernmental Panel on Climate Change (IPCC) projects that the economy-wide greenhouse gas emissions would need to reduce to the tune of 40% by 2030 compared to 1990 levels, to limit the increase in global average temperature by 1.5 °C.1 The United States government has targeted reduction of about 50% emissions below 2005 levels in 2030 to achieve net-zero emissions in 2050. Experts in this field and various modeling analyses suggest that this would require rapid transformation of existing energy sector and economic activities, particularly via rapid adoption of alternative low carbon technologies across the economy.Past modeling of climate change mitigation has primarily hinged on top-down economic equilibrium models. Many of these models used idealized solutions to arrive at the lowest cost pathway for emissions reduction.2,3 These analyses suggested that a global carbon tax was the optimal approach to accelerate the process of decarbonization. But differences among economies, technology availability, and renewable resource availability among various geographic locations and countries can make identifying one solution fits all impractical and inequitable. These approaches were often less granular and used a limited suite of mitigation options.
More recent analyses have begun to shift to the use of national models with a more detailed individual, technological, sectoral, spatial, and temporal resolution.4 Several reasons necessitate understanding economy-wide decarbonization pathways with a high-resolution sector-specific and temporal lens. First, several low-carbon technologies and energy efficiencies of the economy are expected to evolve over time. Quantifying the decarbonization potential by year entails identifying relevant technological improvements, assessing their implementation potential and the scale of adopting energy efficient and low-carbon fuel technologies. Second, many low-carbon electricity technologies are also variable in nature. For instance, to reach the 50% emission mitigation target of United States by 2030, an increase in yearly deployment rate by two to seven times for wind and solar infrastructure is envisaged.5 This requires incorporating capacity dispatch features in these scenario analyses. Third, sectors such as heavy-duty transportation, agriculture, and energy-intensive industries are less amenable to electrification, and as such are known as hard-to-decarbonize sectors. Many past analyses highlight the complexity of mitigating emissions from these sectors.6–8 For the U.S. economy, increase in industrial efficiency is considered for industries by Lempert et al., 2019, while natural gas industries and petroleum for transportation are projected to remain most significant energy sources in 2050 decarbonized energy system by Williams et al., 2015. Fourth, Peng et al. have shown that state- and national-level policies can be leveraged at only marginally higher costs to reach decarbonization goals.9 With the given complexity, holistic modeling approaches are needed that can allow rapid and granular assessment of carbon mitigation pathways per economic sector over the targeted period.
Though these country-level modeling studies have been published, some key limitations still exist. A majority of these studies do not have open-access code and data availability, and the only study to have transparent data was not peer-reviewed (as of 2021).4 These studies may additionally rely upon subnational Integrated Assessment Models (IAMs), which while regionally granular still require extensive assumptions built-up and may be time-intensive to validate and interpret results. These studies are also not designed from a life cycle perspective and therefore may not account for many material flows in circular economies.10 While these studies indicate the need for technology breakthroughs, they do not fully account for the actual readiness of these technologies.11 Finally, because of a deeper focus on the energy sector, these studies tend to overlook soil carbon sequestration and land-use change emissions. Given the substantial role of carbon-reducing bioenergy in deep decarbonization scenarios, this is a critical process gap. The current study aims to bridge the gap between bio-physical IAMs and policy design considering a top-down, scenario-based approach.
The developed Decarbonization Scenario Analysis Model (decarbonization model) dynamically captures the evolving U.S. economy's energy demand for 2020 to 2050, while implementing various decarbonization mitigations, and coupling dynamic life cycle assessment to quantify and project the implications of the decarbonization choices. The functional unit and scope of the model is the U.S. economy, with the capacity to drill-down on individual economic sector-level results across multiple dimensions and environmental metrics in a fully accessible and transparent data portal. Decarbonization model aims at informing stakeholders and assist decision makers in industry and government for quantifying the decarbonization potential over the years of a wide range of greenhouse gas mitigation technologies when deployed at the scale of the U.S. economy with the best available estimate of technology development trajectories. A modular framework is designed that allows understanding implications of individual decarbonization scenarios based on technology penetration targets and decarbonization strategies. A reference case of the U.S. economy is constructed projecting the economy wide energy demand and greenhouse gas emissions to which the decarbonization strategies are compared.
2. Material and methods
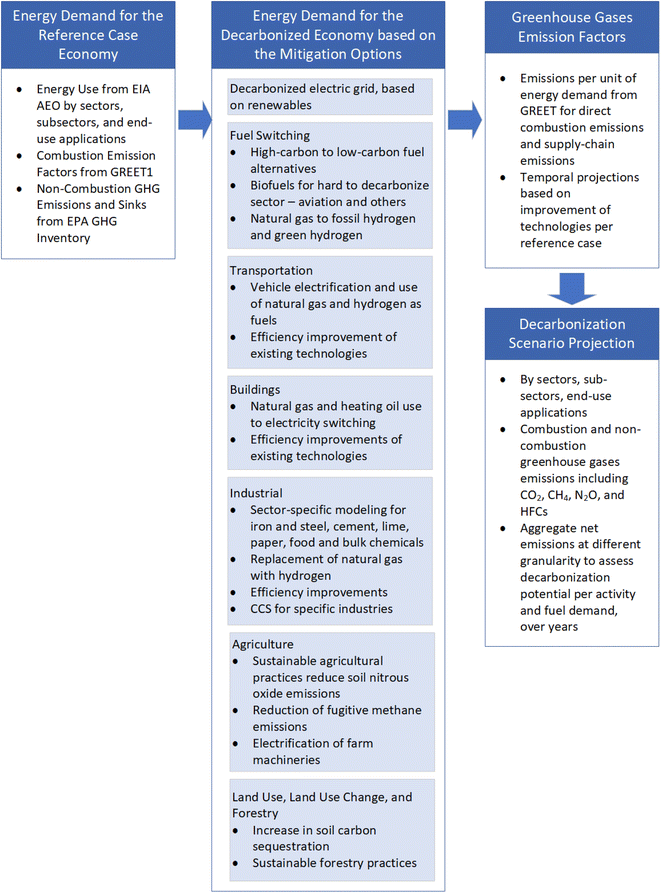
A combination of bottom-up models, literature, and governmental reports derived decarbonization target are considered for developing the model. The technology adoptions considered are expected to have a high acceptance rate by 2050. Fig. 1 shows the model flow diagram with its data sources.For estimating the economy-wide greenhouse gas impact of the reference case and decarbonization scenario energy demand, a life cycle-based approach is implemented. The life cycle analysis boundary includes well-to-wheel and end-use of the specified energy demand. For stationary and non-stationary energy demand, the feedstock and fuel production stage, transmission and distribution, and end use as combustion or conversion to material production is considered. In addition, supply-chain emissions of fuel production and transmission are considered. The emission factors (grams greenhouse gas emissions per megajoules energy demand) are implemented at the resolution of (high to low): economic sectors, sub-sectors, end use applications, and energy carrier types. For the electricity grid, transmission and distribution losses are also considered. The emission factors used for estimating the greenhouse gas emissions per unit energy or fuel used are derived from the Greenhouse Gases, Regulated Emissions, and Energy Use in Transportation (GREET) model.12Table 1 provides details on all input models and data sources and their use cases in developing the decarbonization model.
| Model/dataset | Underlying model acronym | Sector(s) | Description | Data used |
|---|---|---|---|---|
| Energy information administration annual energy outlook | EIA AEO | Residential, commercial, industrial, transportation, electric power, agriculture | The annual energy outlook presents long-term annual projections of U.S. energy supply, demand, and prices through 2050 based on results from EIA's national energy modeling system (NEMS) | Energy demand by sector, subsector, end use application, energy carrier, and energy carrier type for years 2020 to 2050. Data used to design the reference case. Energy demand data corresponds to the direct emissions from the economic activities |
| Environmental protection agency's greenhouse gas inventory | EPA GHGI | Residential, commercial, industrial, transportation, electric power, agriculture | Annual EPA report, providing a comprehensive accounting of all greenhouse gas emissions sources in the United States | Non-combustion emissions data by sector, subsector, and end use application for the years 2020. Future year projections are either kept constant, or for a few cases, emissions are calibrated by change in shipment |
| Environmental protection agency's facility level information on GreenHouse gases model | EPA FLIGHT | Residential, commercial, industrial, transportation, electric power, agriculture | EPA dataset that provides detailed emissions coverage on facility-level greenhouse gas releases. EPA's FLIGHT is based on data collected through the GHGRP and contains information for large emitters (>25![[thin space (1/6-em)]](https://www.rsc.org/images/entities/char_2009.gif) 000 Mt CO2e per year) 000 Mt CO2e per year) |
Cross-walk between EPA's aggregated data as considered in EPA GHGI and location specific data, for validation only. Facility-level emissions data can be used in future for more detailed emissions accounting |
| The greenhouse gases, regulated emissions, and energy use in technologies model12 | GREET | All sectors | A publicly available life-cycle analysis model evaluating the life-cycle energy and environmental effects of a wide range of technologies in transportation, power, and material products | Emission factors for direct combustion GHG emissions and supply chain emissions are used to estimate the activity based emissions for the reference case and the mitigation cases. Time series data for certain pathways are extracted from GREET life cycle assessment model using excel based automation |
| VISION model19 | VISION | Transportation | VISION provides estimates of energy use, oil use and carbon emission impacts of advanced light- and heavy-duty vehicle technologies and alternative fuels through the year 2050 | Transportation sector's mitigation scenario projected for 2020 to 2050 based on several decarbonization targets, including electrification of light-duty vehicles, improving efficiency, and identifying achievable targets for heavy-duty vehicles |
| Decarbonizing electricity grid to a target of 100% clean electricity by 2035 (ref. 16) | ReEDS | Electric power | ReEDS is a capacity expansion and dispatch model that is primarily used for the contiguous U.S. electric power sector | Decarbonization of electricity grid pathways through reduction of high-carbon energy feedstocks such as coal, and increasing capacitation of low-carbon options such as natural gas, and renewable technologies, for sustaining existing electrical grid demand and increased electricity demand to satisfy electrification based mitigation scenarios in the other economic sectors. Data used to design electricity sector mitigation scenario, and further derived aggregated electric-grid carbon intensity is used for calculating emissions of mitigation scenarios' electric-based activities |
| Demand-side solutions in the US building sector could achieve deep emissions reductions and avoid over $100 billion in power sector costs24 | Scout | Residential, commercial | Scout estimates the national energy savings, avoided CO2 emissions, and operating cost impact potential of various energy conservation measures in the U.S. residential and commercial building sectors | Scenario representing building retrofits and afressive fuel switching for new and replacement buildings is implemented for the 2020 to 2050 years |
| Industrial decarbonization roadmap | — | Industrial | Road-map for decarbonization of U.S. industrial activities. Report identifies opportunities to decarbonize industrial activities such as technological switching, energy efficiency improvements, CCS, etc. | Identifying achievable decarbonization targets for efficiency improvement of industrial sector activities, and fuel switching to shift from high-carbon energy feedstocks to low-carbon and carbon-negative feedstocks |
| Billion Ton Study22 | BT16 | — | A national biomass resource assessment commissioned by the U.S. Department of energy (DOE). Billion ton datasets includes detailed biomass cost and supply information across years (2020 to 2040) and projections | Identifying available biomass for producing biofuel, data used to design available biofuel feedstocks and available biofuels, through various feedstock-to-biofuel biochemical conversion pathways, from 2020 to 2040. From 2040 to 2050, feedstock availability is kept constant |
| Air emissions, greenhouse gas emissions, and energy use model for the bioeconomy | BioeconomyAGE | Cross-sector | Bioeconomy AGE provides understanding of the potential uses of various biomass types in a scaled-up bioeconomy and estimates the energy and environmental impacts of biotechnology deployment at scale | Model projects the biofuel-based mitigation scenarios as developed based on economically feasible biofuel conversion pathways and biomass availability as per BT16 |
2.1. Reference case
The decarbonization model harmonizes various data sources to define the reference case for the United States economy from 2020 to 2050. It considers major GHG emissions with detailed reporting of CO2, CH4, N2O, and HFCs emissions for economy wide activities and additionally of fluorinated compounds for the non-combustion emissions. The temporal projections of energy demand by economic sectors from 2020 to 2050 for the business-as-usual case are obtained from the EIA Annual Energy Outlook (EIA AEO).13 The EIA AEO data serves to estimate the direct combustion based energy demand detailed by sector, sub-sector, end-use application, and fuel types. Further, the energy demand are multiplied with emission factors obtained from GREET to obtain the direct combustion and supply chain emissions.12 For estimating, non-combustion emissions by sector, sub-sector, and end-use application, the Greenhouse Gas Inventory of the United States data14 is referred. In addition to model development details described in here, further details are available in the technical report.152.2. Mitigation measures data source
The model incorporates a set of greenhouse gas emissions mitigation measures. For the current study, a set of mitigation scenarios are designed that includes sector-specific and economy-wide scope. The mitigation scenarios are derived based on a suite of published models, best projection of the technological improvements as per literature, and governmental targets to net-zero carbon emissions by 2050. The mitigation scenarios can be broadly classified as efficiency improvements, fuel switching, and improvements in soil carbon management. Electric grid decarbonization estimations are based on a preliminary simulation of the ‘All Options with Electrification Futures Study’ scenario modeled in ReEDS.16 The ‘All Options with Electrification Futures Study’ scenario considers futuristic scenarios of high electricity demand across the U.S. Economy sectors and projects the future feedstock mix for producing electricity through the implementation of renewable feedstocks, including biomass to electricity pathway.17 The projection implemented in this study varies from the current publication of ReEDS projections, available at (ref. 18). In year 2050, feedstock mix implemented in this study varies primarily for wind-based electricity being 8% higher, which is compensated by 4% and 11% more of natural gas based and nuclear based electricity generation respectively, and 3% higher solar electricity production, in the ReEDS scenario. Our implementation considers electricity storage technologies using batteries storage (long and short durations) and hydrogen. For hydrogen and battery-based storages, it is assumed that the storages will be eventually used, ‘from storage-to-grid’ when electricity demand is higher than supply, and ‘from grid-to-storage’, when supply is higher than demand. In either scenario, the primary feedstock-to-electricity production is accounted in our analysis. Though bioelectricity with carbon capture technology is considered within the renewable feedstock choices for decarbonized electricity grid, we have not included the direct air capture technology, which has been included in the ‘All Options with Electrification Future Study’ to achieve net-zero electric grid. We base our assumption due to limited technology readiness level of the technology in near future to expanded to large scale implementation.Decarbonizing road, marine, and rail transportation sectors are projected using VISION19 model which considers vehicle fleet's efficiency improvements, electrification, and use of low-carbon fuels over 2020 to 2050 years. When implementing electrification of road transportation, decarbonized grid electricity is projected to further help reduce greenhouse gas emissions when vehicle technologies shift from fossil-based to electricity-based options.
Sustainable aviation fuels (SAF) produced from biomass are used to decarbonize sectors such as aviation which are not amenable to electrification. We consider the use of biofuels for aviation considering a stipulated target of producing 3 billion gallons of SAF by 2030 and 35 billion gallons by 2050.20,21 Multiple technological pathways exist in SAF production; notably, the Hydroprocessed Esters and Fatty Acids (HEFA) pathway. Availability of novel technologies such as ethanol-to-jet fuel will increase the amount of SAF production. Allocation is performed based on feedstock availability as projected at $60 per dry ton biomass according to the Billion Ton 2016 study for the 2020 to 2040 years.22 The availability of biomass in 2040 is assumed to be constant until 2050 for the current model development. Based on biomass availability a model based allocation is performed using BioeconomyAGE model, such that the chosen biofuel pathways meet the SAF targets incrementally to 2050.23 The SAF production pathways when co-produce other biofuels, specifically renewable diesel and renewable gasoline, they are allocated for use in other economic sectors, proportionally displacing conventional fuel use in the U.S. economy. The biofuel based decarbonization scenarios help offsetting conventional fossil fuel use across the economic sectors, constrained by its availability and infrastructure compatibility.
For the commercial and residential buildings sectors, we use decarbonization measures projected by the SCOUT model as presented in the Langevin et al., 2023 study.24 The SCOUT model estimates energy demand for the residential and commercial buildings from 2020 to 2050 considering improvements over years for buildings' efficiency; transformation of energy sources from high-carbon to low-carbon and renewables for heating and cooling end uses; lifespan of services and installations; and adaptation of efficient technologies. Space heating and cooling, water heating, washers and dryers, and refrigeration end-uses are project to be transitioned from fossil-fuel dependence to electricity. As the electric grid decarbonizes through transition from fossil-based feedstocks to renewable sources (solar, wind, hydroelectric, and nuclear) the sectors' environmental impact from the fuel switching are expected to reduce. In addition to the sector specific improvements, several global decarbonization choices – biofuel use, natural gas to hydrogen, and conventional hydrogen to green hydrogen also help decarbonize the residential and commercial sectors.
For the industrial sector we consider efficiency improvements, fuel switching, and adoption of improved production processes with the granularity of industrial sub-sectors. In addition, we also consider carbon capture and storage (CCS) implementation by the industrial sub-sectors. Quantitative targets are assumed at sub-sector level for efficiency improvements and fuel switching from 2020 to 2050, and are implemented based on a logistic regression curve, representing the technology penetration rate over the years. Efficiency improvement targets are placed varying by industry types (sub-sectors) at rates of 13% for bulk chemicals, 10% for cement and lime, 13% for iron and steel, 32% for paper, and 37% food industries. Fuel switching targets are considered from high-carbon to low-carbon options, which includes transformation of coal to natural gas, natural gas to hydrogen, and conventional hydrogen to green hydrogen. Green hydrogen here is defined as hydrogen sourced from biomass through gasification technology. Coal to natural gas transformation targets is set at 100% by 2050 for the bulk chemicals, cement and lime, and food industries. Natural gas to hydrogen fuel switching is considered at 30% and 100% by 2050 for the food and iron and steel industries, respectively. Coal to electricity and natural gas to electricity use transformations are targeted at 50% for the paper industry. Conventional hydrogen to green hydrogen transformation is targeted at 100% by 2050 for iron and steel, food, and cement and lime industries. Further, low-quality process heat in the bulk chemicals industry which are conventionally sourced from fossil fuels are transitioned to electricity at targeted rates of 50% for coal, 100% for diesel, 100% for petroleum coke, 100% for propane, 50% for natural gas, and 100% for other petroleum fuels, by 2050. Improvement in production technologies for ammonia and cement are considered as decarbonization measures. The conventional approach of ammonia production from the Haber Bosch process is targeted to be transformed 100% to green ammonia production process, by 2050. CCS implementation for the cement and lime industry is projected to influence 95% of CO2 from combustion emissions by 2050. Similarly, for iron and steel, bulk chemicals, refineries, and food industries, CCS is projected to influence 85%, 70%, 70%, and 30%, respectively, of CO2 in combustion emissions, by 2050. The CCS capture rate is assumed to be 90% by weight of processed CO2 in flue gas. The CCS facilities are expected to have electricity demand for their operations and satisfied by using grid electricity. Emissions from use of electricity for CCS operations is accounted as per year specific electric grid carbon intensity for mitigation scenario. Greenhouse gas emissions in the agricultural sector can be mitigated through sustainable farming practices, efficient use of fertilizers, low-carbon and renewable energy alternatives for on-farm machinery, and digital transformations.25–27 Improvement in soil nitrogen management (uptake and runoff), adaptation of precision farming with advent of digital technologies, improvement in soil carbon management with optimal management of above-ground and below-ground carbon can reduce carbon loss and reduce nitrous oxide emissions from croplands. Electrification of farm machinery and grain transportation, and biogas recovery at livestock facilities can further help reduce supply chain emissions for the agriculture sector. In our decarbonization scenario for agricultural sector we considered linear implementation of decarbonization measures over years, to 2050. Technological revolutions through digital precision in sustainable farming practices is expected to reduce nitrous oxide emissions by 60%. With better management of livestock cultivation and sustainable manure management methane emissions from livestock is assumed to be reduced by 85%. Additionally, 50% methane emissions reduction is considered for rice cultivation through optimal management of water and residue. Based on efforts for electrification of other sectors of the economy, it is expected socio-economic benefits of electrification will be transitioned to the agriculture sector simultaneously. Hence, we consider fossil fuel-based farm machinery to be fully electrified by 2050. Additionally, biogenic carbon sequestration based decarbonization scope is considered for land use, land use change, and forestry (LULUCF), adaptation of conservation tillage, cover cropping, forest residue management, and optimal use of forestry resources, increase in soil carbon sequestration in non-croplands, achieving 0.5 MT C ha−1 per year increase in soil carbon. Land use and land use change and forestry-based carbon sequestration are considered as a carbon mitigation strategy.
2.3. Emission factors for analysis
The model projects economic activity based GHG emissions by sector, sub-sector, end use applications, and their corresponding choice of energy source. For the reference case and with implementation of the mitigation scenarios, GHG emissions per unit of energy produced or energy demand varies over years. Based on economic activity, direct GHG emissions carbon intensities are quantified using Argonne's GREET1 model.28 GREET1 models cradle to grave fuel use pathways by fuel feedstock, fuel, year, and end use applications and consider background emissions for production of various fuel products. A correspondence mapping is performed that relates GREET1 fuel pathways with Decarb model's sectors, sub-sectors, end use applications, fuel feedstock, and fuel type classifications. Our model utilizes the temporal variability of carbon intensities from GREET1 for the available pathways and for pathways with limited projections of yearly carbon intensity estimates, fixed values are considered across the study years. Non-combustion emissions as reported by EPA 2022 dataset including supply chain emissions and are mapped to EIA AEO economic activities categories by sector, sub-sector, and end use applications.As energy demand, fuel-feedstock choice, and fuel feedstock transform for the various sectors, sub-sectors, and end-use applications when the mitigation scenarios are applied over the reference case, the corresponding temporally varying emission factors change the net GHG emissions for the sectors and sub-sectors. Carbon mitigation benefits from electric grid decarbonization and implementation of biofuels are reflected across all sectors. In our implementation approach, the electric grid decarbonization is applied before and biofuel decarbonization applied after all sector-specific mitigation measures. As biofuel availability is constrained by amount of feedstock availability at specific price, the net decarbonization achieved by electric grid decarbonization and biofuel decarbonization will be same, irrespective of the order of their implementation. Within sectors, if mitigation options constitute efficiency improvement from the use of improved production processes, those mitigation scenarios are applied after electric grid decarbonization, followed by implementation of infrastructure efficiency improvement and fuel switching mitigation options. The remaining sector-wide decarbonization scenarios are implemented at the end, reflecting economy-wide policy implementation for carbon mitigation, those not yet mitigated at sectoral-level. The current mitigation scenarios represent the best estimates from experts and literature.
The various sector-level and economy-wide decarbonization strategies presented in this study represent one decarbonization pathway for the U.S. economy. However, alternative options for carbon reduction can be modeled and provide differentiating life cycle GHG impact results. The extensible framework followed in the model development allows for further investigation of alternative approaches to decarbonization by modifying input parameters and data sets.
2.4. Model framework
The U.S. decarbonization model is developed using Python language (version 3.9.7 from conda-forge) and Microsoft Excel. It is maintained and hosted for public access through GitHub. The development environment is maintained using Conda package manager.29 The Spyder integrated development environment (IDE) editor is used for code development and execution.30 Decarbonization model considers greenhouse gas emissions (GHG) and energy use across all segments of the U.S. economy. Results generated in Python are dynamically written to a Microsoft Excel dashboard interface, which enables users to graphically explore economy-wide decarbonization results. Model code can be found at the public GitHub repository.313. Results and discussions
3.1. Summary of reference case
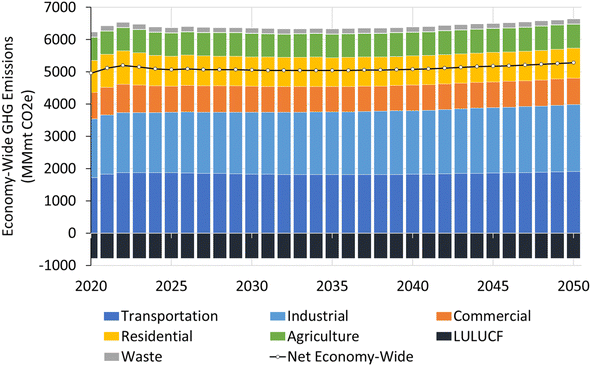
The decarbonization model assesses various mitigation options targeted to reduce the greenhouse gas emissions as projected by the reference case. For the reference case, the energy generation and energy demand for end uses across the U.S. economy is projected as per EIA AEO and their greenhouse gas emissions are estimated using life cycle assessment-based emission factors from GREET. Emissions, as shown in Fig. 2, are estimated to be 5443.84 MMmt CO2e and 5854.42 MMmt CO2e for the years 2020 and 2050, respectively. The industrial and transportation sectors share the largest fraction of greenhouse gas emissions, constituting 35% and 33% respectively in the year 2050. Based on land use, land use change and forestry (LULUCF) estimates, a constant carbon sequestration of 790.29 MMmt CO2e is projected over the years. A targeted reduction of 80% U.S. economy wide greenhouse gas emissions by 2050, approximately 4684 MMmt CO2e emissions reduction is needed through implementation of various carbon mitigation technologies across the U.S. economy.3.2. Summary of mitigation scenarios
Various decarbonization options including energy efficiency and fuel switching are implemented to analyze the potential of reducing greenhouse gas emissions over time for the reference case energy demand across the U.S. economic sectors. Fig. 3 shows the remaining greenhouse gas emissions when emissions are allocated to the source sectors if all of default decarbonization scenarios are considered, reaching 86% greenhouse gas emissions reduction in 2050. Achieving the target is contributed by industrial, transportation, agriculture, residential, and commercial sectors at their reduction potentials projected at 61%, 89%, 74%, 85%, and 73% respectively in 2050. Additionally, greenhouse gas emissions from fugitive sources and landfill waste are expected to assist decarbonization over time through production of biofuels or reducing supply chain losses during transportation and distribution of non-combusted fuels to atmosphere.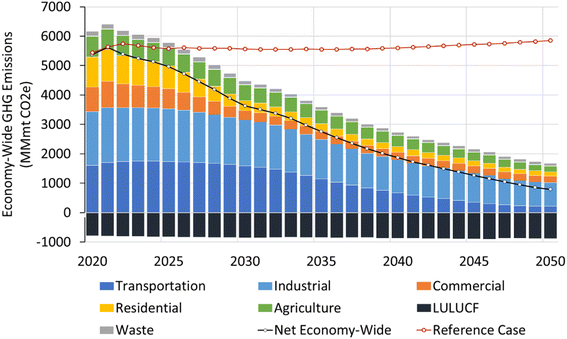 | ||
| Fig. 3 Greenhouse gas emissions by sector across the U.S. economy after application of the decarbonization measures. | ||
Based on the sector-level carbon intensities estimated from the projections of energy demand and GHG emissions, the percentage change in carbon intensity is calculated considering 2020 carbon intensity as the baseline, shown in Fig. 4. For the reference case, the trend shows a gradual reduction, which occurs due to the improvement in conventional technologies and fuel efficiencies. For the mitigation case, significant reduction in carbon intensity is observed across all sectors of the economy, achieving 83%, 78%, 48%, 87%, and 89% carbon intensity reductions by agriculture, commercial, industrial, residential, and transportation sectors, respectively.
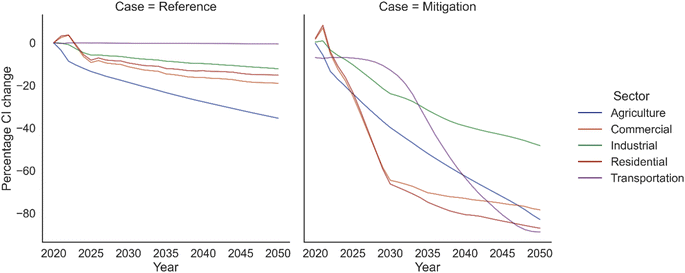 | ||
| Fig. 4 Percentage change in carbon intensities of reference case and mitigation case by sectors of the U.S. economy, considering 2020 carbon intensities as the baseline. | ||
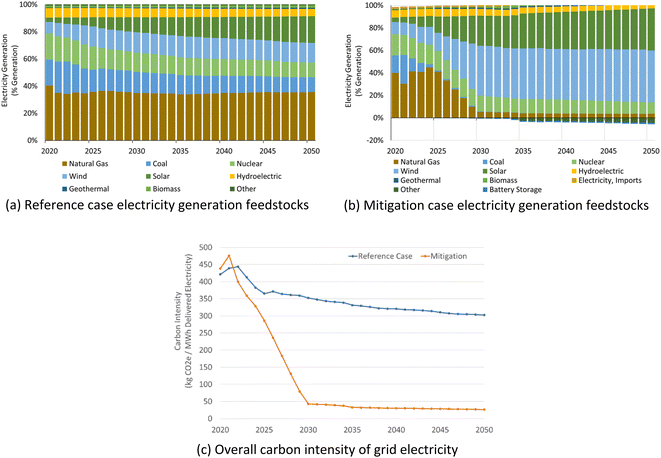
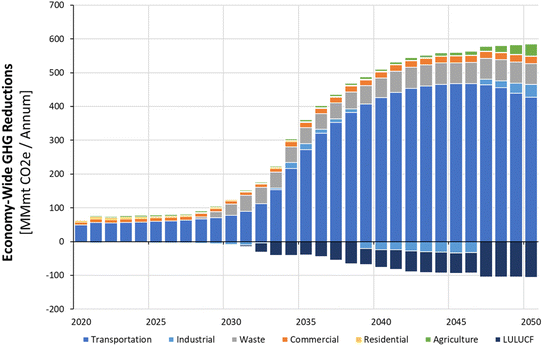
The decarbonization options chosen in this study to achieve the decarbonization targets across the economic sectors are heavily dependent on the electric grid decarbonization and biofuel use. Considering the transition of conventional fuel-based technologies to electricity-based technologies significantly increases the electricity demand over the years when mitigation scenarios are applied. In the year 2050, a 24% increase in electricity demand is projected for mitigation case when compared to the reference case. Increased demand for electricity is observed in transportation, industry, and buildings. Hence, expanding electric grid capacity and reducing electric grid carbon intensities by deploying renewable sources based technologies for electricity generation are essential for achieving long term decarbonization targets. In the reference case, the electric grid primarily relies on fossil-based energy source with major fractions being natural gas and coal, whereas, for decarbonized grid the energy dependence shifts to renewables with large demand projected to be satisfied by wind, solar, geothermal, and others (Fig. 5a and b). Increase in renewables helps lower the carbon intensity of electric grid, even though demand of electricity increases in the mitigation case (Fig. 5c). Fig. 6 shows the influence of electric grid decarbonization across the economic sectors, identifying major influence on the residential, commercial, and industrial sectors.
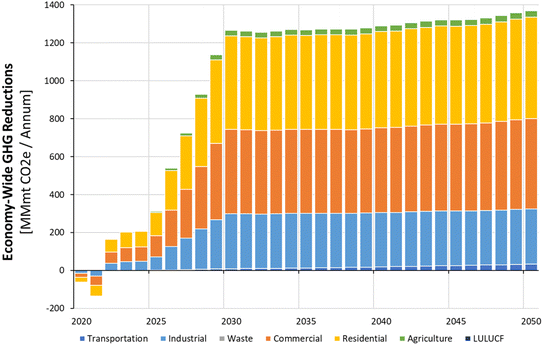 | ||
| Fig. 6 Greenhouse gas emissions reductions from electric grid decarbonization per U.S. economic sectors. A positive number shows emissions reduced, whereas a negative number shows emissions incurred. | ||
Hard to decarbonize sectors such as air transportation and several sub-sectors in industry are projected to rely on alternative low-carbon fuels, those have similar physical form and chemical properties to conventional fuels and are infrastructure compatible or for which technology transition to alternative fuel use is feasible. For those, biofuels play an essential role to achieve decarbonization targets. We implement biofuel based decarbonization for the remaining emissions once electrification and all other decarbonization options are considered. Fig. 7 highlights the contribution of biofuel based decarbonization measures across the economic sectors over the studied years. Adoption of biofuels mitigation is focused on the aviation sector in the form of SAF. Emissions from the aviation sector are projected to peak within this decade at 220 Mt-CO2e per year and reduce to near-zero levels by 2050. As such, the mitigation from SAF hovers around 300–320 Mt-CO2e per year and a decoupling of increasing aviation demand and GHG emissions is observed. Co-produced renewable diesel and renewable gasoline biofuels are projected to further decarbonize other sectors avoiding emissions from conventional fuels. Implementation of biofuels help achieve a significant 8% economy wide carbon mitigation in year 2050: most significant impact realized by the transportation and agriculture sectors achieving 23% and 5% emission reductions in 2050, respectively.
Along with electrification, decarbonization of electric-grid, and biofuels, hydrogen is considered to play a significant role in achieving the decarbonization targets. In the reference case, hydrogen demand is projected in the transportation sector for light duty vehicles, commercial trucks, freight trucks, transit bus, intercity bus, and school bus fleets. The reference case hydrogen demand is satisfied by natural gas to hydrogen steam-methane reforming conversion pathway. In mitigation case, fuel switching is considered from natural gas to hydrogen and hydrogen to green hydrogen. Such mitigation options are considered for various hard to-decarbonize industry sub-sectors and as a global (across all sectors) fuel switching option. Compared to natural gas, hydrogen has no direct combustion emissions and only has supply chain emissions from transportation and conversion steps, leading to reduction in end-use emissions when switching from natural gas to hydrogen. However, it is essential to consider the life cycle impact of fuel switching.
A critical example here is that of fuel switching from natural gas to hydrogen (Fig. 8). Fuel switching – in and of itself – results in an increase in GHG emissions that may be attributed increase in supply chain emissions for natural gas (72 gCO2e MJ−1) to hydrogen (99 gCO2e MJ−1) pathway. However, transitioning from conventional hydrogen to green hydrogen i.e., hydrogen sourced from renewables, can help net reduce life cycle emissions accounting to a net effect of the mitigating about 118 MMmt CO2e for the U.S. economy, in 2050. Hence, even if the transition from natural gas to green hydrogen is expected to go through the transition of natural gas to fossil-hydrogen, before shifting primarily to renewable sourced hydrogen, it is imperative that the considered pathway will eventually help decarbonize the U.S. economy. It is notable that future scenarios evaluated with this framework can incorporate blue hydrogen, i.e., hydrogen produced from natural gas with captured CO2. Here, state-of-the-art reforming techniques at high CO2 capture rates and minimal fugitive emissions can also result in long-term decarbonization.32
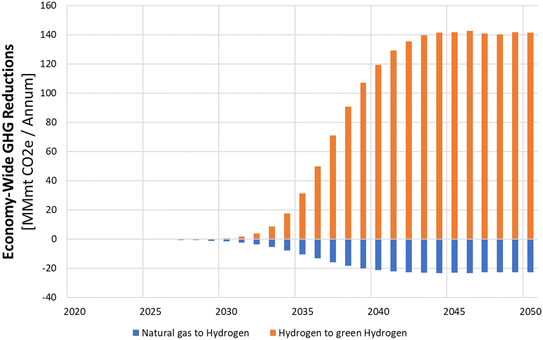 | ||
| Fig. 8 Greenhouse gas emissions reductions from fuel switching to hydrogen fuel. A positive number shows emissions reduced, whereas a negative number shows emissions incurred. | ||
3.3. Sector-specific observations
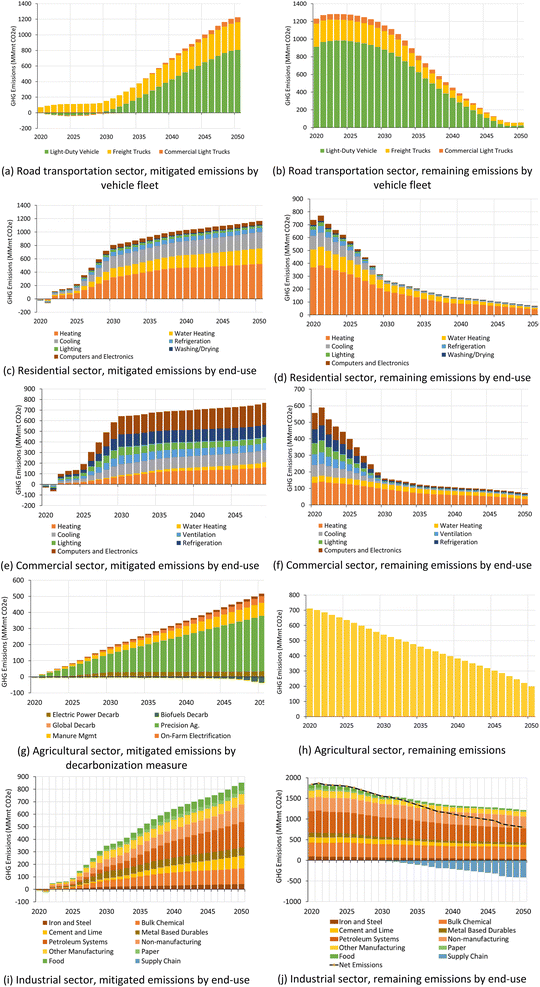
Fig. 9 shows the projected greenhouse gas mitigation and the remaining emissions per sector and end-use over the years. For road transportation, light duty vehicles are expected to achieve most significant decarbonization due to electrification of the vehicle fleet while using electricity from the decarbonized electric grid, and by replacing conventional fuels with biofuels. In 2050, about 7% and 4% emissions remain from the freight trucks and commercial light trucks. For the residential and commercial sectors transition from high carbon fuels to low carbon fuels and electrification plays a prominent role, which significantly reduces greenhouse gas emissions from space heating, computers, and electronics. Even after significant decarbonization, space heating is projected to have high magnitude of remaining emissions in 2050 for commercial and residential buildings, a relative 30% and 14% emissions remain, respectively. In addition, commercial water heating has 40% residual emissions in 2050. These un-mitigated emissions are expected to be produced from the demand of natural gas, from its supply chain and combustion end-use. For the agriculture sector, precision agriculture is expected to bring the most significant decarbonization, however, a major portion of remaining emissions account from the continued use of diesel and natural gas in mobile and stationary farming activities.For the industrial sector, end-use industry-based mitigation measures help decarbonize the industries, while supply chain emissions are reduced through fuel switching and efficiency improvements. Supply chain emissions reduction that occurs in other sectors under the mitigation scenarios are allocated to industry, this is shown separately in Fig. 9i–j. Significant reduction in emissions is observed from avoidance of use of petroleum-based energy source, which reduces emissions from petroleum systems – extraction, refining, processing, and fuel transportation. However, a relative 62% of un-mitigated emissions from petroleum system remain, along with significant contributions from other sub-sectors: bulk chemicals by 71%, non-manufacturing by 67%, other-manufacturing by 59%, metal-based durables by 46%, iron and steel by 45%, cement and lime by 31%, and paper by 28%, in 2050. Natural gas combustion is the primary contributor for the remaining emissions across the industrial sub-sectors, followed by diesel and coke use. Among the various mitigation choices developed in this analysis industrial sub-sectors show the largest contributor to the residual emissions in 2050, primarily due to its dependence on natural gas. This highlights the importance of decarbonizing the natural gas-based end uses having similar liquid or gaseous physical form of energy product, along with the successful adoption of technologies harnessing the benefits of the decarbonized electric-grid.
4. Conclusions and future work
The Decarbonization Scenario Analysis Model developed here facilitates assessing decarbonization potential of the U.S. economy by bridging the gap between the technology readiness, fuel options, and their respective policy context, in a life cycle assessment approach. This study quantifies the decarbonization potential when a set of selected decarbonization choices are applied and identifies the hard to decarbonize hot spots. While the study highlights the large implication of expansion and decarbonization of the electric grid, it also highlights the dependence on low-carbon fossil fuels, especially natural gas and diesel, for migrating technologies away from their high-carbon counterparts.33 This is in line with analyses from IAMs.34 Particularly, our results show concurrence with the IPCC AR6 that projects steep reductions in the electric grid carbon intensity by the mid-century itself.Heavy transportation mode and heavy industries are projected to rely significantly on natural gas and conventional diesel. This study identifies decarbonization for the supply-chain of various end-uses, but their environmental impact is often hard to isolate and allocate to the specific sectors or sub-sectors of the economy. In such cases, global and cross-sectoral decarbonization strategies on fuel switching help achieve decarbonization.
The study considers a limited set of decarbonization choices for the U.S. economy which shows strong readiness and as projected by various bottom-up models and literature. Based on the considered scenarios, a significant gap is identified between the achievable goal and the net-zero target. We find that using all available technological options (fuel use, adaptation of high efficiency technologies, electrification of vehicle fleet) still leaves residual emissions equivalent to 14% of present-day emissions. In recent advancement of IAMs, technology parameterization have improved, especially in the electricity and transport sectors. That said, most IAMs do not explicitly estimate industry and agriculture mitigation technologies and lump together emission reductions. In contrast, the decarbonization model delves into greater technological depth in these sectors. For instance, we find significant emission reductions are feasible via the precision agriculture approach, while IAMs generally model only increased yield and emissions due to reduced fertilizer use.35 Future work is expected to account for improved soft linking between these two approaches and is likely to address weaknesses of both the models. Overall, while IAMs may lack in technological breakthroughs and supply-chain linkages, the Decarbonization modeling approach takes a life cycle assessment approach to address them, and also linking co-product accounting in greenhouse gas estimation calculations.
The scope of consideration of the default decarbonization measures has been limited to fuel switching and projections of technology improvements while it does not consider implementation of carbon dioxide removal such as direct air capture or carbon capture and utilization (carbon capture and storage is considered in industrial mitigation, however, using CO2 as feedstock is not considered as a mitigation option). Though net-zero emissions are not attained, around 86% decarbonization is projected feasible through efficiency improvements, fuel switching, and low electric grid carbon intensity. Economy wide Carbon Dioxide Removal (CDR) based technology implementations are especially left out for two reasons – one to quantify the decarbonization potential without implementation of technologies that directly capture and remove atmospheric carbon; two recent literature sources (which we do not necessarily endorse or oppose here) have highlighted concerns of scale-up success of carbon capture technologies due to their high implementation costs and parasitic energy demand.36 When affordable, scaled-up implementation of carbon capture utilization and storage technologies can help further to reach net-zero decarbonization target by 2050. Past work also states that providing equivalent policy incentives to CDR and emissions reduction and treating them as fungible could lead to negative path dependencies and can result in temperature overshot even if end-of-century targets are met.37 Even so, our results show that demand-side reductions are more effective at decarbonization. For instance, the recent EMF-37 analysis shows that residual emissions in the year 2050 were as high as 2200 Mt-CO2e per year by the mid-century.34 However, with the use of more detailed process parameterization at a sectoral level, there is only about 1000 Mt-CO2e in our mitigation scenario. Hence, high-resolution process modeling shows reduced need of CDR in the U.S. For instance, the carbon prices in IAM analyses hinging on CDR rise to $200–300/t-CO2 by 2050 in scenarios converging to net-zero emissions. On the other hand, most technology options discussed in this study are much cheaper and ready for implementation on a commercial scale.
The environmental impact from the identified dependency on diesel and natural gas use for the decarbonized economy can be further mitigated by implementation of natural gas to green hydrogen pathways and conventional diesel to renewable diesel pathways. Though such technologies exist, sustainable scale-up and geographic expansion are primary challenges for their success. Potential expansion of other biofuel pathways and new renewable or waste feedstocks to biofuel pathways can pave the way towards net-zero carbon goal. Future work can focus on expanding the decarbonization model to include such options and further assess their feasibility for the U.S. economy-wide decarbonization.
This framework is best poised to answer ‘what-if’ questions on technology readiness. While IAMs are designed to address some ‘what-if’ questions, they are usually configured to project cost-optimal pathways subject to pre-defined outcomes, e.g., limiting warming to 1.5 °C. Instead, this framework can be modified to project the actual life cycle implications in various levels of penetration of low-carbon technologies, ranging from EVs and SAF in the transport sector, to green hydrogen for industrial decarbonization. As part of continuation of the study, we plan to investigate new scenarios focusing on using biomass resource for decarbonizing fuels and chemicals, implementation of carbon capture storage and utilization technologies, and forthcoming policy insights in governmental reports and literature. To integrate choice-selection based analysis among a varied spread of renewable energy technology options, a multi-criteria analysis can be undertaken as future scope of work.
Author contributions
Troy Hawkins helped with funding acquisition, conceptualization, project administration, methodology, and reviewing and editing the manuscript. George G. Zaimes helped with funding acquisition, conceptualization, formal analysis, software development, visualization, and data curation. Doris Oke, Xinyi Wu, and Hoyoung Kwon helped in data curation, methodology, revision of manuscript. Udayan Singh helped in data curation, drafting and reviewing the manuscript. Shannon Zhang helped with software development and visualization. Guiyan Zang and Yan Zhou helped with data curation and methodology. Amgad Elgowainy and Michael Wang helped with funding acquisition and conceptualization. Ookie Ma helped with funding acquisition, project administration, and reviewing the manuscript. Saurajyoti Kar helped in conceptualization, project administration, formal analysis, software development, and writing the original draft and editing manuscript.Conflicts of interest
The authors declare no conflict of interest.Acknowledgements
The research effort at Argonne National Laboratory was supported by the Bioenergy Technologies Office of the US Department of Energy's Office of Energy Efficiency and Renewable Energy under contract DE-AC02-06CH11357. We would like to thank Jay Fitzgerald, Zia Haq, and Andrea Bailey from the Bioenergy Technologies Office of the US Department of Energy's Office of Energy Efficiency and Renewable Energy; Kara Podkaminer from the US Department of Energy's Office of Energy Efficiency and Renewable Energy; and Hugh Ho and Anna Hagstrom from the Strategic Analysis team of the US Department of Energy's Office of Energy Efficiency and Renewable Energy for their valuable contributions to guiding the development of this study. The views and opinions of the authors expressed herein do not necessarily state or reflect those of the US government or any agency thereof. Neither the US government nor any agency thereof, nor any of their employees, makes any warranty, expressed or implied, or assumes any legal liability or responsibility for the accuracy, completeness, or usefulness of any information, apparatus, product, or process disclosed, or represents that its use would not infringe privately owned rights.References
- L. Clarke, Y. M. Wei, A. D. L. V. Navarro, A. Garg, A. N. Hahmann, S. Khennas, et al., Energy Systems, in IPCC, 2022: Climate Change 2022: Mitigation of Climate Change. Contribution of Working Group III to the Sixth Assessment Report of the Intergovernmental Panel on Climate Change. Cambridge University Press. 2022 Search PubMed.
- L. Clarke, K. Jiang, K. Akimoto, M. Babiker, G. Blanford, K. Fisher-Vanden, et al., Assessing Transformation Pathways, in: Climate Change 2014: Mitigation of Climate Change. Contribution of Working Group III to the Fifth Assessment Report of the Intergovernmental Panel on Climate Change, Cambridge University Press, Cambridge, United Kingdom and New York, NY, USA, 2014, available from: https://www.ipcc.ch/site/assets/uploads/2018/02/ipcc_wg3_ar5_chapter6.pdf Search PubMed.
- E. Papadis and G. Tsatsaronis, Challenges in the decarbonization of the energy sector, Energy, 2020, 205, 118025 CrossRef CAS.
- J. E. T. Bistline, Roadmaps to net-zero emissions systems: Emerging insights and modeling challenges, Joule, 2021, 5(10), 2551–2563 CrossRef.
- J. Bistline, N. Abhyankar, G. Blanford, L. Clarke, R. Fakhry and H. McJeon, et al., Actions for reducing US emissions at least 50% by 2030, Science, 2022, 376(6596), 923–924 CrossRef PubMed.
- J. Williams, H. Ben, J. Moore, F. Kahrl, A. Mahone, E. Hart, et al.Pathways to deep decarbonization in the United States, 2015, available from: https://pdfs.semanticscholar.org/4630/43eacaf24d1cb64b1357b94ccc41d76bc823.pdf Search PubMed.
- R. Lempert, B. L. Preston, J. Edmonts, L. Clark, T. Wild, M. Binsted, et al., Pathways to 2050: Alternative scenarios for decarbonizing the U.S. Economy, 2019, available from: https://www.4cleanair.org/wp-content/uploads/Documents/C2ES-pathways-to-2050-scenarios-for-decarbonizing-the-us-economy-final.pdf Search PubMed.
- C. Bataille, H. Waisman, Y. Briand, J. Svensson, A. Vogt-Schilb and M. Jaramillo, et al., Net-zero deep decarbonization pathways in Latin America: Challenges and opportunities, Energy Strategy Rev, 2020, 30, 100510 CrossRef.
- W. Peng, G. Iyer, M. Binsted, J. Marlon, L. Clarke and J. A. Edmonds, et al., The surprisingly inexpensive cost of state-driven emission control strategies, Nat. Clim. Change, 2021, 11(9), 738–745 CrossRef.
- S. Pauliuk, A. Arvesen, K. Stadler and E. G. Hertwich, Industrial ecology in integrated assessment models, Nat. Clim. Change, 2017, 7(1), 13–20 CrossRef.
- D. McLaren and N. Markusson, The co-evolution of technological promises, modelling, policies and climate change targets, Nat. Clim. Change, 2020, 10(5), 392–397 CrossRef.
- M. Wang, A. Elgowainy, U. Lee, A. Bafana, S. Banerjee, P. Benavides, et al., Summary of Expansions and Updates in GREET® 2021, 2021, available from: http://greet.es.anl.gov/publication-greet-2021-summary Search PubMed.
- EIA, U.S. Energy Information Administration - Independent Statistics and Analysis, U.S. EIA, Open Data, 2022 [cited 2022 Jun 18], available from: https://www.eia.gov/opendata/v1/commands.php Search PubMed.
- EPA, Inventory of U.S. Greenhouse Gas Emissions and Sinks: 1990–2020, United States Environmental Protection Agency, 2022. Report No.: EPA 430-R-22-003, available from: https://www.epa.gov/ghgemissions/draft-inventory-us-greenhouse-gas-emissionsand-sinks-1990-2020 Search PubMed.
- S. Kar, T. Hawkins, G. Zaimes, D. Oke, H. Kwon, X. Wu, et al., Decarbonization Scenario Analysis Model: Evaluation of a Scenario for Decarbonization of the United States Economy, in Energy Systems and Infrastructure Analysis, Argonne National Laboratory, 2022 [cited 2022 Dec 12]. Report No.: ANL-22/40, available from: https://greet.es.anl.gov/publication-decarbon_tool_manual Search PubMed.
- P. Denholm, P. Brown, W. Cole, T. Mai, B. Sergi, M. Brown, et al., Examining Supply-Side Options to Achieve 100% Clean Electricity by 2035, 2022 Aug [cited 2022 Oct 18]. Report No.: NREL/TP-6A40-81644, available from: https://www.nrel.gov/docs/fy22osti/81644.pdf Search PubMed.
- E. Zhou and T. Mai, Electrification Futures Study: Operational Analysis of U.S. Power Systems with Increased Electrification and Demand-Side Flexibility, 2021 May [cited 2023 Nov 28] p. NREL/TP-6A20-79094, 1785329, MainId: 33320. Report No.: NREL/TP-6A20-79094, 1785329, MainId: 33320, available from: https://www.osti.gov/servlets/purl/1785329/ Search PubMed.
- Scenario Viewer | 100% Clean Electricity by 2035 Study [cited 2023 Nov 28], available from: https://scenarioviewer.nrel.gov/?project=a483cbfd-cd59-4aaf-94a8-6c2967318158%26mode=download%26layout=Default.
- Y. Zhou and A. Vyas, VISION Model Description and User’s Guide: Model Used to Estimate the Impacts of Highway Vehicle Technologies and Fuels on Energy Use and Carbon Emissions to 2100, Argonne National Laboratory, Argonne, IL, United States, 2014 Mar [cited 2022 Jun 27]. Report No.: ANL/ESD-14/1, available from: https://www.osti.gov/biblio/1130301/ Search PubMed.
- White House Briefing, Fact Sheet: Biden Administration Advances the Future of Sustainable Fuels in American Aviation, The White House, 2021 Sep [cited 2022 Sep 13], available from: https://www.whitehouse.gov/briefing-room/statements-releases/2021/09/09/fact-sheet-biden-administration-advances-the-future-of-sustainable-fuels-in-american-aviation/ Search PubMed.
- BETO, Sustainable Aviation Fuel Grand Challenge, Bioenergy Technologies Office, 2021 [cited 2022 Sep 13], available from: https://www.energy.gov/eere/bioenergy/sustainable-aviation-fuel-grand-challenge Search PubMed.
- M. H. Langholtz, B. J. Stokes, and L. M. Eaton, 2016 Billion-Ton Report: Advancing Domestic Resources for a Thriving Bioeconomy, 2016 Jul [cited 2022 Jun 27] p. DOE/EE-1440, ORNL/TM-2016/160, 1271651. Report No.: DOE/EE-1440, ORNL/TM-2016/160, 1271651, available from: http://www.osti.gov/servlets/purl/1271651/ Search PubMed.
- D. Oke, J. B. Dunn and T. R. Hawkins, The contribution of biomass and waste resources to decarbonizing transportation and related energy and environmental effects, Sustainable Energy Fuels, 2022, 6(3), 721–735 RSC.
- J. Langevin, A. Satre-Meloy, A. J. Satchwell, R. Hledik, J. Olszewski and K. Peters, et al., Demand-side solutions in the US building sector could achieve deep emissions reductions and avoid over $100 billion in power sector costs, One Earth, 2023, 6(8), 1005–1031 CrossRef.
- H. Kwon, X. Liu, H. Xu and M. Wang, Greenhouse gas mitigation strategies and opportunities for agriculture, Agron. J., 2021, 113(6), 4639–4647 CrossRef CAS.
- D. L. Northrup, B. Basso, M. Q. Wang, C. L. S. Morgan and P. N. Benfey, Novel technologies for emission reduction complement conservation agriculture to achieve negative emissions from row-crop production, Proc. Natl. Acad. Sci. U. S. A., 2021, 118(28), e2022666118 CrossRef CAS PubMed.
- M. Khanna, S. S. Atallah, S. Kar, B. Sharma, L. Wu and C. Yu, et al., Digital transformation for a sustainable agriculture in the United States: Opportunities and challenges, Agric. Econ., 2022, 53(6), 924–937 CrossRef.
- ANL, The Greenhouse gases, Regulated Emissions, and Energy Use in Transportation Model, Argonne National Laboratory, 2022 [cited 2022 May 23], available from: https://greet.es.anl.gov/ Search PubMed.
- Anaconda Inc., Anaconda Software Distribution, 2020, available from: https://docs.anaconda.com/ Search PubMed.
- P. Raybaut, Spyder-documentation, 2009, available from: http://pythonhosted.org.
- S. Kar, and G. G. Zaimes, Decarbonization Scenario Analysis Model, Argonne National Laboratory, Lemont, IL, United States, 2022, available from: https://github.com/Argonne-National-Laboratory-SAC/DECARB Search PubMed.
- C. Bauer, K. Treyer, C. Antonini, J. Bergerson, M. Gazzani and E. Gencer, et al., On the climate impacts of blue hydrogen production, Sustainable Energy Fuels, 2021, 6(1), 66–75 RSC.
- H. McJeon, B. K. Mignone, P. O'Rourke, R. Horowitz, H. S. Kheshgi and L. Clarke, et al., Fossil energy deployment through midcentury consistent with 2°C climate stabilization, Energy Clim. Change, 2021, 2, 100034 CrossRef CAS.
- M. Browning, J. McFarland, J. Bistline, G. Boyd, M. Muratori and M. Binsted, et al., Net-zero CO2 by 2050 scenarios for the United States in the Energy Modeling Forum 37 study, Energy Clim. Change, 2023, 4, 100104 CrossRef CAS PubMed.
- M. Wise, K. Calvin, P. Kyle, P. Luckow and J. Edmonds, Economic and physical modeling of land use in gcam 3.0 and an application to agricultural productivity, land, and terrestrial carbon, Clim. Change Econ., 2014, 05(02), 1450003 CrossRef.
- E. Grubert and F. Sawyer, US power sector carbon capture and storage under the Inflation Reduction Act could be costly with limited or negative abatement potential, Environ. Res. Infrastruct. Sustain., 2023, 3(1), 015008 CrossRef.
- N. Grant, A. Hawkes, S. Mittal and A. Gambhir, The policy implications of an uncertain carbon dioxide removal potential, Joule, 2021, 5(10), 2593–2605 CrossRef CAS.
Footnote |
| † Electronic supplementary information (ESI) available: Supplementary information on the study is available which details specific model data, model files, and summarizes the decarbonization mitigation choices considered in the study. See DOI: https://doi.org/10.1039/d3se00807j |
| This journal is © The Royal Society of Chemistry 2024 |

