
 Open Access Article
 This Open Access Article is licensed under a Creative Commons Attribution-Non Commercial 3.0 Unported Licence
Selection of DNA aptamers for sensing drugs treating eye disease: atropine and timolol maleate†‡
Ka-Ying
Wong
ab,
Yibo
Liu
ab,
Chau-Minh
Phan
bc,
Lyndon
Jones
bc,
Man-Sau
Wong
bde and
Juewen
Liu
 *ab
*ab
aDepartment of Chemistry, Waterloo Institute for Nanotechnology, University of Waterloo, Waterloo, ON N2L 3G1, Canada. E-mail: liujw@uwaterloo.ca
bCentre for Eye and Vision Research (CEVR), 17W Science Park, Hong Kong, Hong Kong
cCentre for Ocular Research & Education (CORE), School of Optometry and Vision Science, University of Waterloo, Canada
dDepartment of Food Science and Nutrition, The Hong Kong Polytechnic University, Hung Hom, Kowloon, Hong Kong
eResearch Center for Chinese Medicine Innovation, The Hong Kong Polytechnic University, Hung Hom, Kowloon, Hong Kong SAR, PR China
First published on 15th August 2024
Abstract
Effective monitoring of ocular drugs is crucial for personalized medicine and improving drug delivery efficacy. However, traditional methods face difficulties in detecting low drug concentrations in small volumes of ocular fluid, such as that found on the ocular surface. In this study, we used capture-SELEX to select aptamers for two commonly used ocular drugs, timolol maleate and atropine. We identified TMJ-1 and AT-1 aptamers with binding affinities of 3.4 μM timolol maleate and 10 μM atropine, respectively. Our label-free TMJ-1 biosensor using thioflavin T staining achieved a limit of detection (LOD) of 0.3 μM for timolol maleate. The AT-1 biosensor showed an LOD of 1 μM for atropine, and exhibited a 10-fold higher sensitivity compared to UV-visible spectroscopy. Future research in this area holds promise in enhancing drug delivery monitoring and improving the treatment of ocular diseases.
1. Introduction
Detection and monitoring of drugs is a crucial area of research, with significant implications for optimizing drug delivery, pharmacokinetics, and enabling personalized medicine.1,2 In particular, accurate and timely measurement of drug levels in ocular tissues and fluids can provide valuable insights into their efficacy and pharmacokinetics, allowing for more informed treatment decisions and better patient outcomes.3,4 However, the unique anatomical and physiological characteristics of the eye present substantial challenges for drug detection. One of the primary difficulties in ocular drug detection is the small volume of samples available, such as that found via ocular surface tear fluid, the aqueous humor, and vitreous humor. For instance, tear volume typically ranges around 7 to 10 microliters,5,6 corresponding to a tear flow rate of approximately 1.4 microliters per min.7 These fluids are present in limited quantities, making it challenging to obtain sufficient samples for analysis. Additionally, the concentration of drugs in ocular fluids is often low, necessitating highly sensitive detection methods.3,8 Traditional analytical techniques, such as liquid chromatography and mass spectrometry, while highly accurate, are often unfeasible for routine clinical use due to their complexity, cost, and the need for large sample volumes which can be impractical and uncomfortable for patients, especially in cases requiring frequent monitoring.4,9 Therefore, the need for more sensitive and accurate detection methods, specifically designed to detect low concentrations of molecules in small volumes of tears, is imperative.Aptamers are short, single-stranded nucleic acids (DNA or RNA) that can bind to specific target molecules with high affinity and specificity.4,10,11 DNA aptamers are selected through an iterative process called Systematic Evolution of Ligands by Exponential Enrichment (SELEX).10,11 Aptamers offer several advantages over antibodies, including smaller size, lower production costs, greater stability, and the ability to be chemically synthesized and modified.10,11 Aptamer-based biosensors, or aptasensors, leverage the unique properties of aptamers to detect target molecules.4 Aptasensors can be designed to be label-free, meaning they do not require a covalently attached secondary label or indicator to produce a signal, which simplifies the detection process. Label-free aptasensors have been reported to detect various molecules.12–14
Two ocular drugs, timolol maleate and atropine, were selected to validate our label-free aptasensors. Timolol maleate is widely used to treat glaucoma,15 while atropine is employed for myopia, both of which are prevalent anterior segment eye diseases.16,17 These drugs are primarily administered via eye drops. However, the drugs are rapidly diluted and eliminated by tear flow and blinking, which presents a significant challenge in measuring the efficacy of drug delivery through tear fluid due to the low concentrations of the drugs present.18 Timolol maleate acts as a non-selective beta1 and beta2 adrenergic receptor-blocking agent.19 In ocular therapy, it is employed to mitigate intraocular pressure following topical administration twice daily. Its mean half-life after a single dose is around 3 h 30 min, and its efficacy may persist for up to 24 h.15 Atropine as a naturally occurring alkaloid, primarily sourced from Atropa belladonna within the Solanaceae family, is subject to ongoing scrutiny concerning its mechanisms in myopia control.20 There is a pressing demand for cost-effective, user-friendly, and sensitive methods for detecting these drugs.
In this study, we used capture-SELEX to immobilize a randomized DNA library to select aptamers for timolol maleate and atropine. We identified two aptamers that could bind to these drugs with high affinity. Additionally, we compared the sensing properties of the traditional UV-vis method with our label-free aptamer-based sensor for the detection of atropine in research samples. Our findings demonstrated that the aptamer-based sensor offers high sensitivity and specificity, making it an effective tool for detecting low concentrations of ocular drugs in small volumes of tear fluid.
2. Materials and methods
2.1 Chemicals
All DNA oligonucleotides were synthesized by Integrated DNA Technologies (Coralville, IA, USA), and the sequences used in this work are listed in ESI‡ Table S1. Streptavidin-coated agarose resin and Dulbecco's modified Eagle medium/Nutrient Mixture F-12 medium was purchased from Thermo Scientific (IL, USA). Atropine, timolol maleate, sodium chloride, magnesium chloride, sodium hydroxide, uric acid, histidine, tryptophan, ibuprofen, sulfaclozine and metronidazole and hydrochloric acid were obtained from Sigma-Aldrich (MO, USA). Ultra-0.5 centrifugal filter units (3k and 10k MWCO centrifugal filter) were purchased from Millipore-Sigma (Oakville, ON, Canada). Micro-bio-spin chromatography columns and SsoFast EvaGreen supermix were obtained from Bio-Rad. The dNTP mix, Taq DNA polymerase with ThermoPol buffer, and low molecular weight DNA ladder were purchased from New England Biolabs (Ipswich, MA, USA). Artificial tear was purchased from Biochemazone (Alberta, Canada).2.2 Capture-SELEX
The aptamer selections for atropine and timolol maleate were performed according to the previously described capture-SELEX method with modification.21 The selection buffer for the atropine selection was 1× PBS, 5 mM MgCl2, 5 mM KCl, 1 mM CaCl2, pH 7.5, while for the timolol maleate selection was 1× PBS, 1 mM MgCl2, 5 mM KCl, 1 mM CaCl2, pH 7.5. The separation buffer in both sections was 1× PBS, 5 mM KCl, pH 7.5. The initial concentration of the target was 1 mM in the selection buffer. The concentrations of the target and library are listed in Table S2.‡ A total of 13 rounds (timolol maleate) or 15 rounds (atropine) were performed before sequencing (McMaster University).2.3 ThT fluorescence-based binding assays
Thioflavin T (ThT) fluorescence spectra were measured using a Variant Eclipse fluorescence spectrophotometer to assess the binding of the aptamer to the target in various solutions and with other molecules. The binding assay was performed based on the previous setup with some modifications.22 It involved dissolving the aptamer at a concentration of 1 μM and ThT at a concentration of 10 μM in 500 μL of selection buffer. This solution was then transferred to a quartz cuvette, and the target was gradually titrated to reach a final concentration of 25 μM (for timolol maleate) or 100 μM (for atropine). The excitation wavelength was set at 440 nm, and emission was monitored from 460 to 500 nm. Fluorescence values at 490 nm were used for the calculations. The Kd value was determined by fitting the data using the following equation: F = F0 + aKd/(Kd + x), where x represents the concentration of the titrated target, and a denotes the maximal signal change upon saturated binding. Moreover, the binding of the aptamer to targets was examined in various buffers, including PBS alone, PBS with or without calcium or magnesium ions. Additionally, the specificity of the aptamer was also assessed by examining its binding to 50 μM targets, including uric acid, histidine, tryptophan, ibuprofen, sulfaclozine and metronidazole in selection buffer. Same protocol was used to determine the limit of detection (LOD) and limit of quantification (LOQ) of the label-free aptamer sensor. LOD was determined using LOD = 3.3σ/S while LOQ was determined using LOQ = 10σ/S where σ represents the standard deviation and S denotes the slope.2.4 Isothermal titration calorimetry
Isothermal titration calorimetry (ITC) experiments were conducted using a MicroCal VP-ITC instrument. Aptamers and targets were dissolved in the selection buffer and degassed for 5 min before loading. For timolol maleate, 280 μL of a 15 μM timolol maleate solution was added to the syringe, while 1.47 mL of a 400 μM aptamer solution was injected into the cell chamber. For atropine, 280 μL of a 10 μM atropine solution was added to the syringe, while 1.47 mL of a 200 μM aptamer solution was injected into the cell chamber. After an initial injection of 0.5 μL, 10 μL of the target was titrated into the cell during each injection, which lasted for 20 s, with a total of 28 injections performed at 25 °C. A spacing of 360 s was set between injections. The binding constant was determined by fitting the titration curve to a one-site binding model using Origin software.2.5 Atropine release from polymer discs
For the Atropine release study, three polymer discs loaded with 0.6 mg mL−1 atropine (S1–S3) and three atropine-free polymer discs (C1–C3) were prepared. The polymers consisted of 10% w/v polyvinyl alcohol (PVA), physically cross-linked using two freeze–thaw cycles. PVA-based gels have been used as contact lens material.23–25 These discs were then transferred to wells of a 24-well culture plate for the release study. Subsequently, 1 mL PBS was added to each well, and the plate was shielded from light while being gently shaken on an orbital shaker at approximately 50 rpm, at room temperature. After 1 h, the solution was collected for measurement.2.6 Quantification of timolol maleate and atropine by UV-vis spectroscopy
Artificial tear was spiked with timolol maleate at different concentrations. 100 μL aliquots of each solution were transferred into separate cuvettes for UV-vis analysis. UV absorbance readings were recorded across the spectrum ranging from 200 to 400 nm, with absorbance at 293 nm recorded to construct the calibration curve. The LOD was determined using LOD = 3.3σ/S while the LOQ was determined using LOQ = 10σ/S, where σ represents the standard deviation and S denotes the slope. A 6000 ppm (6 mg mL−1 or 20.7 mM) atropine solution was diluted to various concentrations of 0.6, 0.3, 0.24, 0.2, and 0.17 mg mL−1 with PBS. Subsequently, 100 μL aliquots of each solution were transferred into separate cuvettes for UV-vis analysis. UV absorbance readings were recorded across the spectrum ranging from 200 to 400 nm, with a specific focus on the absorbance at 257 nm to construct the calibration curve. The LOD and LOQ were determined. Six samples (C1, C2, C3, S1, S2, and S3) were diluted by a factor of two using PBS. Subsequently, absorbance readings at 257 nm of 100 μL samples were recorded in triplicate. Readings of the S samples were corrected against those of the control samples. After correcting for the blank, the concentrations were calculated using the calibration curve equation. The concentrations of atropine in S1–S3 were determined using the calibration curve equation and were multiplied by a dilution factor of 2.2.7 Quantification of timolol maleate and atropine by the aptamer-based sensor
The calibration curve was generated according to the procedure outlined in section 2.3. The LOD was calculated using LOD = 3.3σ/S. For atropine study, 20 μL of the sample (C1, C2, C3, S1, S2, or S3) was added to a ThT reaction mixture comprising 500 μL of phosphate-buffered saline (PBS) with 5 mM MgCl2, 1 μM aptamer, and 10 μM ThT. This resulted in dilution factors of 26. Subsequently, the absorbance readings at 490 nm were recorded and substituted into the calibration curve equation to determine the concentrations of atropine in the diluted solutions. The final concentration was corrected by subtracting the signal in the control discs and obtained by multiplying with the dilution factor to ascertain the original concentration of atropine in the samples.3. Results and discussion
Selection for timolol maleate aptamers
Using the capture-SELEX method, we conducted 13 rounds of aptamer selection targeting timolol maleate (Fig. 1A). The round 13 PCR products were sequenced and a total of 21![[thin space (1/6-em)]](https://www.rsc.org/images/entities/char_2009.gif) 152 sequences were obtained. The top 10 most abundant sequences obtained are listed in Fig. 1B. Since sequence #11 has only 9 copies, we did not further analyze other sequences. These 11 sequences were categorized into a main population based on sequence similarity, with conserved regions highlighted in red and green. The primary differences among these sequences are located in the 3′ end, following the green conserved regions. Since TMJ-1 is the most abundant sequence (49.4% of the library), we selected TMJ-1 for further analysis. According to the rationale of SELEX, high-affinity aptamers can be readily identified simply by copy number enrichment, where sequences enriched to higher copy numbers might be aptamers.4 The Mfold predicted secondary structure of TMJ-1 aptamer is shown in Fig. 1C. Given that a large fraction of the green marked conserved sequences are confined in a hairpin structure, and the stem region has a G–G mismatch, we suspected that this hairpin might be open in the binding state of the aptamer. In addition, this sequence is rich in guanine and we cannot rule out the possibility of a G-quadruplex structure.
152 sequences were obtained. The top 10 most abundant sequences obtained are listed in Fig. 1B. Since sequence #11 has only 9 copies, we did not further analyze other sequences. These 11 sequences were categorized into a main population based on sequence similarity, with conserved regions highlighted in red and green. The primary differences among these sequences are located in the 3′ end, following the green conserved regions. Since TMJ-1 is the most abundant sequence (49.4% of the library), we selected TMJ-1 for further analysis. According to the rationale of SELEX, high-affinity aptamers can be readily identified simply by copy number enrichment, where sequences enriched to higher copy numbers might be aptamers.4 The Mfold predicted secondary structure of TMJ-1 aptamer is shown in Fig. 1C. Given that a large fraction of the green marked conserved sequences are confined in a hairpin structure, and the stem region has a G–G mismatch, we suspected that this hairpin might be open in the binding state of the aptamer. In addition, this sequence is rich in guanine and we cannot rule out the possibility of a G-quadruplex structure.
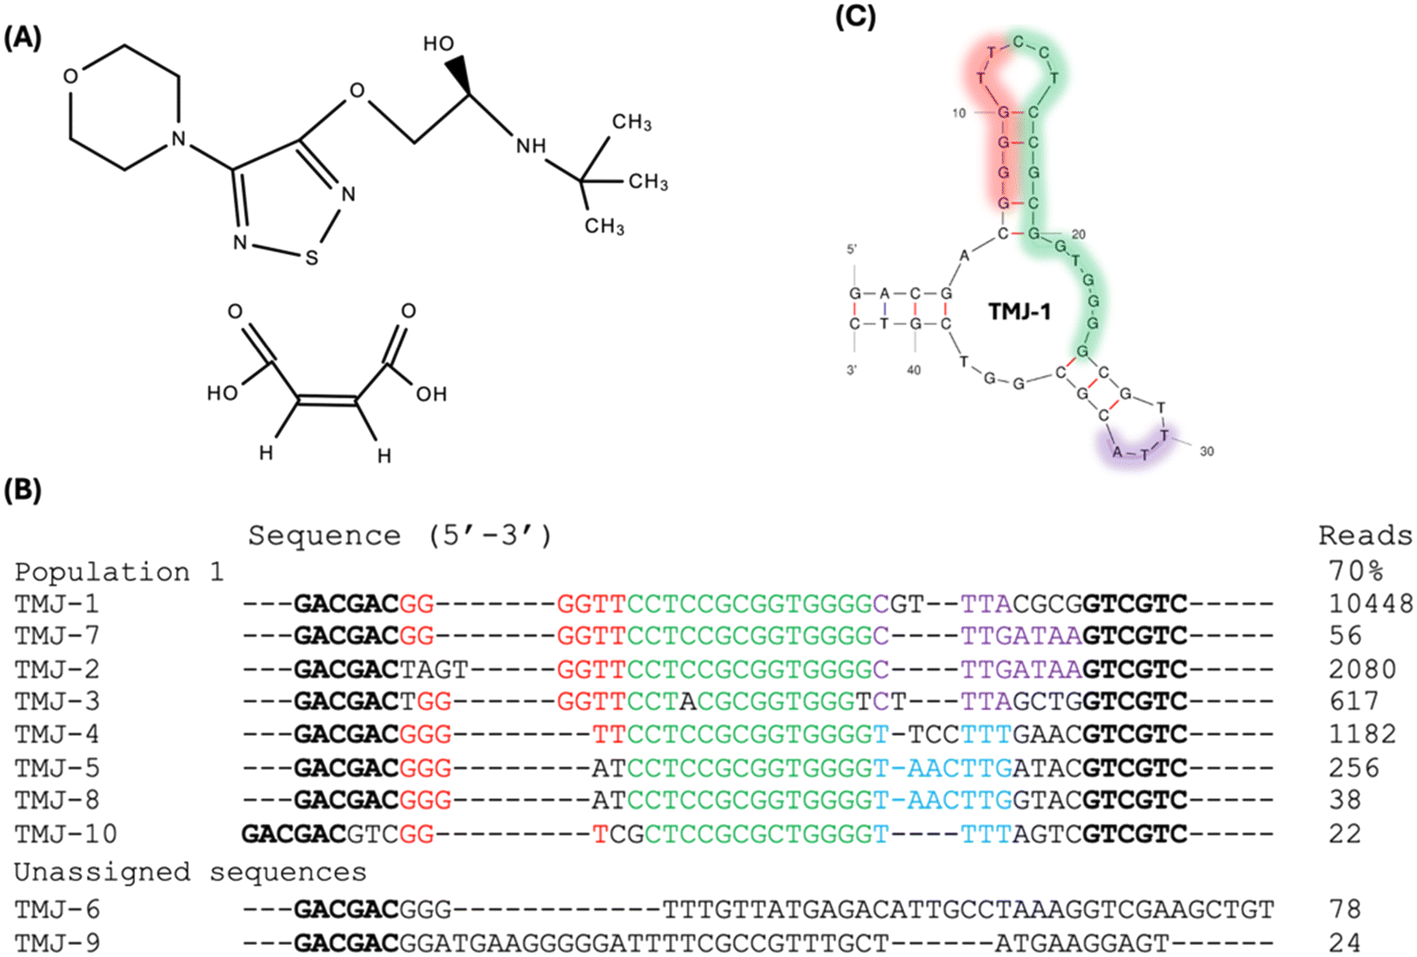 | ||
| Fig. 1 (A) The chemical structure of timolol maleate. (B) The alignment of the top 11 aptamer sequences obtained from the round 13 library. The primer-binding regions are highlighted in bold in the two ends. These sequences were categorized into populations based on sequence similarity, with conserved sequences displayed in various colors. The percentages of sequences within each family are provided out of a total of 21152 sequences. (C) The predicted secondary structure of TMJ-1, the most abundant sequences, with conserved regions highlighted. | ||
Binding of timolol maleate aptamer to timolol maleate
Subsequently, we evaluated the binding of the TMJ-1 aptamer to timolol maleate utilizing the label-free thioflavin T (ThT) fluorescence assays and ITC. ThT has been used as a fluorescent marker to identify amyloids and target proteins.26 Besides proteins, ThT can target certain nucleic acid secondary structures. While ThT is best known for its binding to G-quadruplexes, it can also bind to other DNA structures,27 such as hairpins and Watson–Crick helices, as evidenced from the enhanced ThT fluorescence upon adding various DNA sequences. When it binds to nucleic acids, the two rotatable bonds in ThT act as a molecular rotor at the C–C bond between benzothiazole and dimethylaniline, emitting fluorescence.28,29 This makes it a valuable biomarker for studying the binding of nucleic acids.28 In the present study, ThT was used as a light-off mechanism to study aptamer-target binding. When there is no target molecule, ThT bound to the aptamer and generated fluorescent signal. In the presence of a target molecule, the initially bound ThT may be released and fluorescence is then decreased. This decrease of ThT fluorescence can then be used to evaluate aptamer binding.27,30 In the ThT assay, the Kd value of TMJ-1 was determined to be 4.1 μM. At the same time, the fluorescence decrease of ThT can be used as a label-free biosensor for the detection of timolol. Based on the data, the LOD in these label-free aptamer-based assays was established to be 0.3 μM for TMJ-1 based on 3σ/slope, where σ is the standard deviation of background variation (Fig. 2A).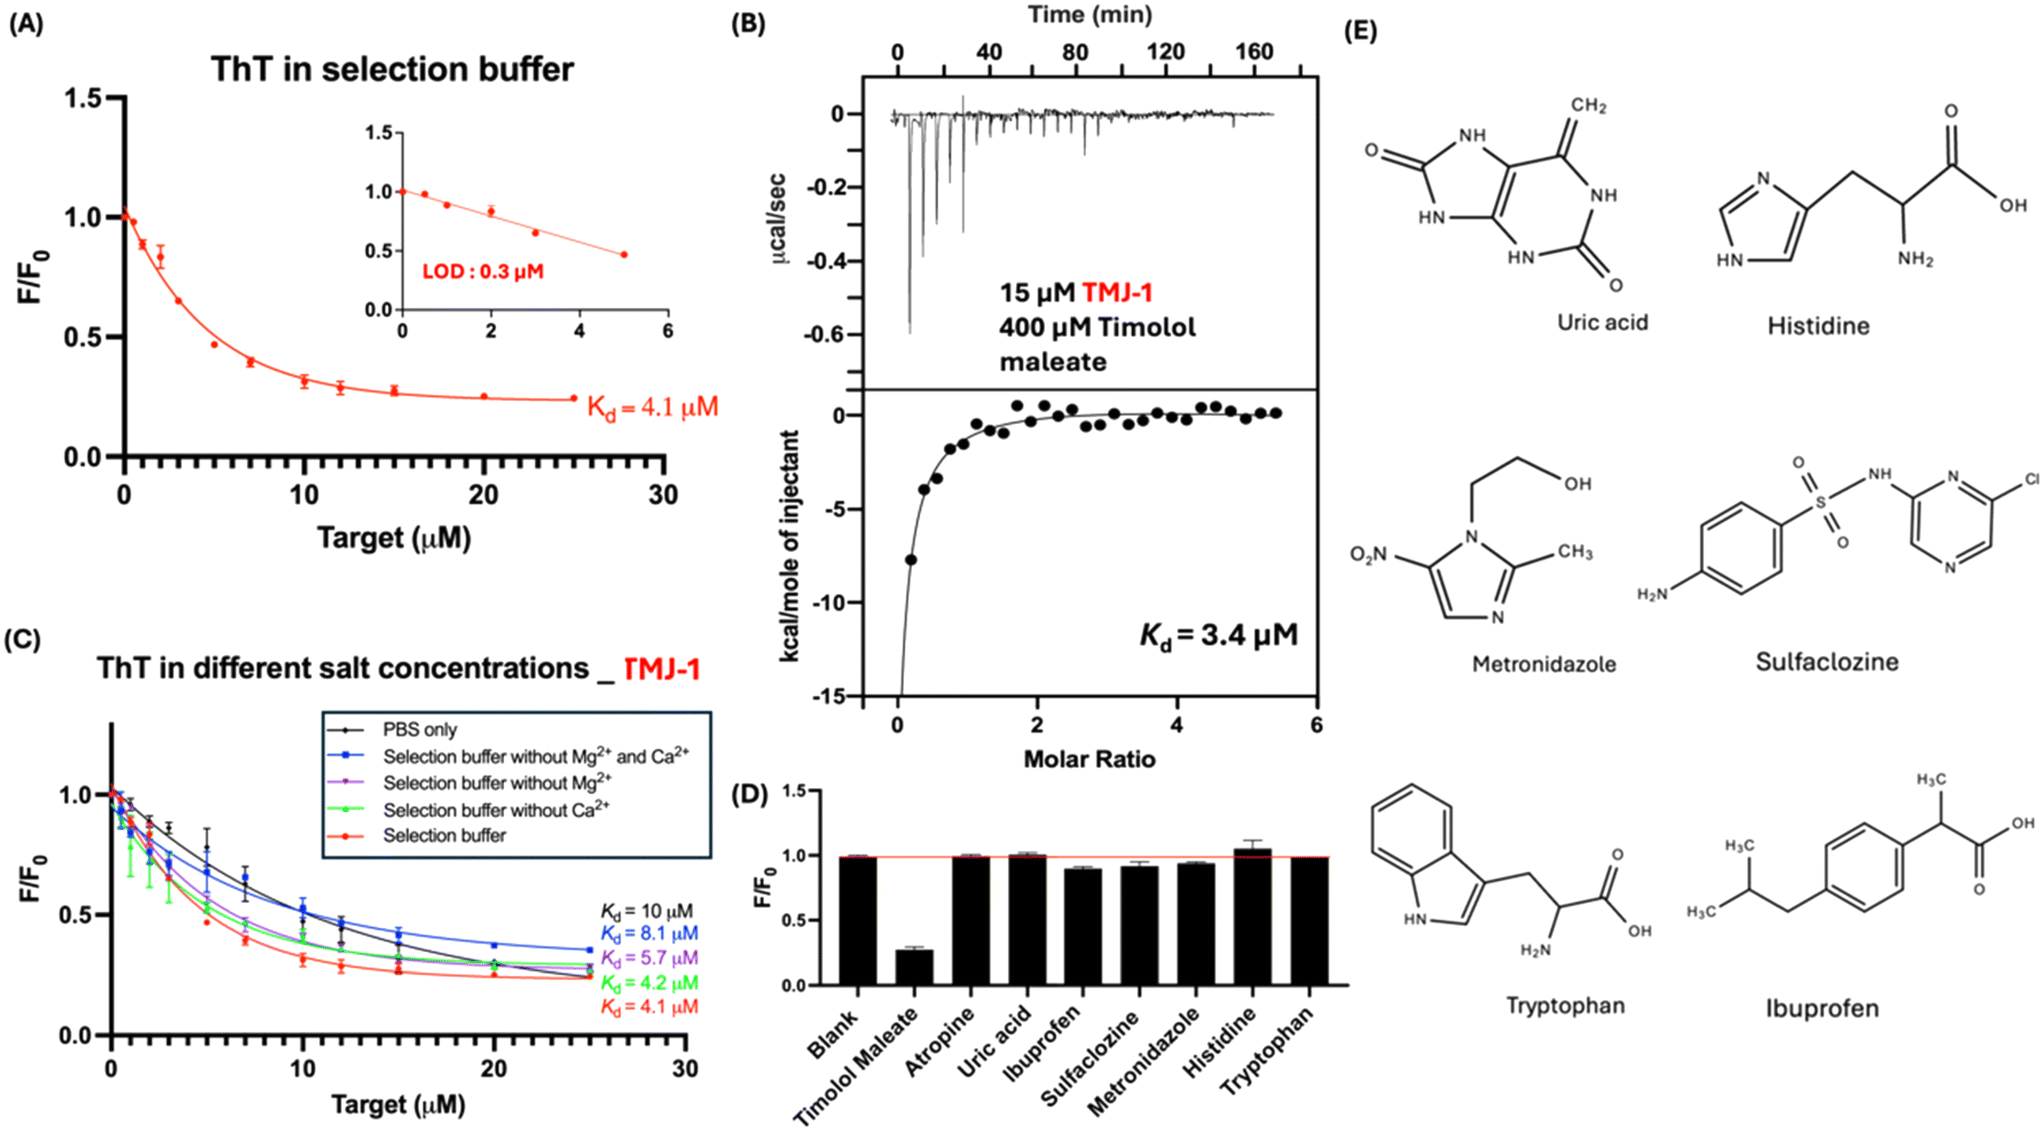 | ||
| Fig. 2 (A) The ThT fluorescence titration curves for timolol maleate binding to TMJ-1 in the selection buffer. Insets: The linear range and regression line at low timolol maleate concentrations and the limit of detection of the two aptamers. (B) ITC data for the interaction between timolol maleate and TMJ-1 in selection buffers. (C) ThT fluorescence titration curves of timolol maleate binding to TMJ-1 in buffers with different salt concentrations. (D) The selectivity of TMJ-1 aptamers to different targets in the selection buffer. Data presented as mean ± SEM, n = 3. (E) The chemical structures of the molecules tested in the ThT assays for the selectivity test. | ||
We further investigated the binding affinity of TMJ-1 using ITC, revealing a Kd value of 3.4 μM (Fig. 2B), which aligns well with the ThT assay results. In many aptamers, divalent metal ions are critical for binding.31–33 Thus, we then examined the effect of Mg2+ and Ca2+ ions on the binding of TMJ-1 to timolol maleate to gain insights into the binding properties of the aptamer, considering that these ions are known to enhance the stability of DNA folding.34 As depicted in Fig. 2C, ThT assays showed minimal alterations in the Kd value of TMJ-1 to timolol maleate in different buffers regardless of the concentration of divalent metal ions, suggesting that Mg2+ and Ca2+ ions may not significantly influence this binding interaction. Thus, sensors using this aptamer may tolerate a broad buffer conditions.
Selectivity of TMJ-1
Testing the selectivity of the atropine aptamer is crucial to ensure that the aptamer can differentiate atropine from other molecules that may be present in ocular fluids or in research use. Ibuprofen, sulfasalazine, and metronidazole have been incorporated into ophthalmic solutions in the market to relief inflammation, postoperative infections, or bacterial infections in the eye.35–37 Amino acids, like histidine and tryptophan, are naturally present in tear fluid.38 If there is no non-specific binding of aptamer to amino acids, drug detection in tear fluid can be performed without the need for much sample pre-treatment. In the present study, we added 50 μM of various molecules to the TMJ-1 sensor, with the data presented in Fig. 2D. ThT results showed that timolol maleate lowered the fluorescence level to 0.23, while the fluorescence levels for the rest of the molecules (Fig. 2E) barely changed compared to the background level. This indicates that TMJ-1 has good specificity for timolol maleate.Comparing aptamer-based sensing of timolol maleate with UV-vis spectroscopy
Timolol maleate, often administered via ophthalmic solutions and need a precise monitoring in tear fluid for effective drug delivery assessment.39 We then conducted a comparative study to evaluate the performance of our label-free aptamer sensor utilizing TMJ-1 against the conventional UV-vis method for detecting timolol maleate in artificial tear solutions. Artificial tear samples were spiked with varying concentrations of timolol maleate, and the concentrations were quantified using UV-vis spectroscopy and the label-free aptamer sensor. Fig. 3A shows the calibration curve for timolol maleate in artificial tears, determined by UV-vis spectroscopy at 293 nm in PBS. The UV-vis assay revealed a LOD of 10.5 μM and a LOQ of 31.8 μM. Conversely, Fig. 3B presents the calibration curve for timolol maleate detection using the aptamer-based sensor in selection buffer. The aptamer sensor achieved an LOD of 0.7 μM and an LOQ of 2.1 μM. These findings indicate that the aptamer-based sensor exhibited 15-fold better sensitivity compared to the traditional UV-vis spectroscopy method, with lower LOD and LOQ values. Furthermore, considering that many molecules such as lactoferrin in tear absorb light near 293 nm,40 our aptamer-based sensor offers greater specificity and accuracy in quantifying timolol maleate. The enhanced sensitivity of the aptamer sensor underscores its potential for more accurate and reliable monitoring of timolol maleate concentrations in ocular drug delivery systems.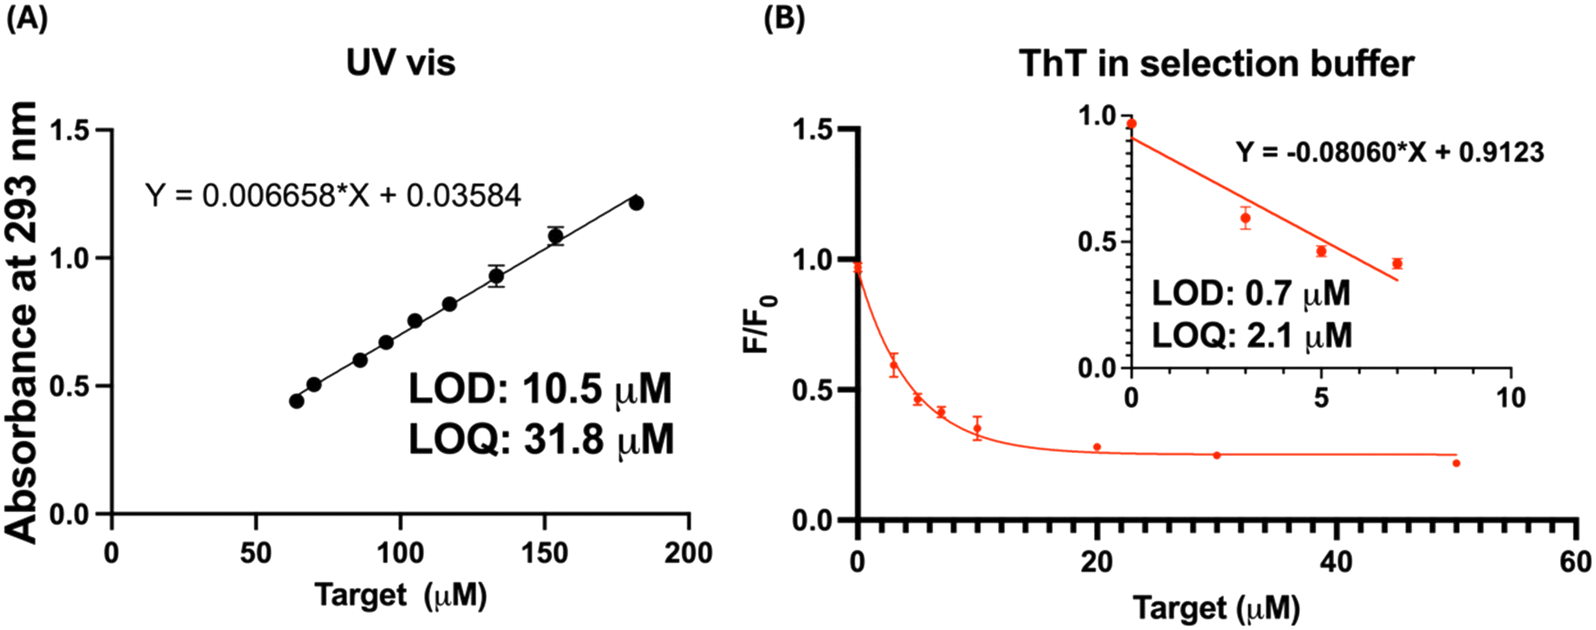 | ||
| Fig. 3 Sensing timolol maleate in artificial tear. (A) The calibration curve plotted for absorbance at 293 nm. (B) The calibration curve using aptamer-based assay in selection buffer. Inset: Linear region at low timolol maleate concentrations. n = 3. | ||
Selection for atropine aptamer
Using the same capture-SELEX method, we also conducted aptamer selection specifically targeting atropine (Fig. 4A). After 15 rounds of selection, we analysed the top 10 most abundant sequences and grouped them into distinct populations. Notably, AT-1 and AT-2 emerged as the most significantly enriched sequences, collectively constituting 74% of the sequencing reads (Fig. 4B). Considering part of the sequences in the AT-1 and AT-2 are conserved, we chose AT-1 for further studies. The secondary structural prediction, as delineated in Fig. 4C, shows the conserved regions within population 1, predominantly located within the loop regions of the aptamer. No stable secondary structures in the loop region were predicted and this loop also has very few guanine bases. Therefore, it is likely to be a simple loop in the absence of the target and it is not a G-quadruplex structure.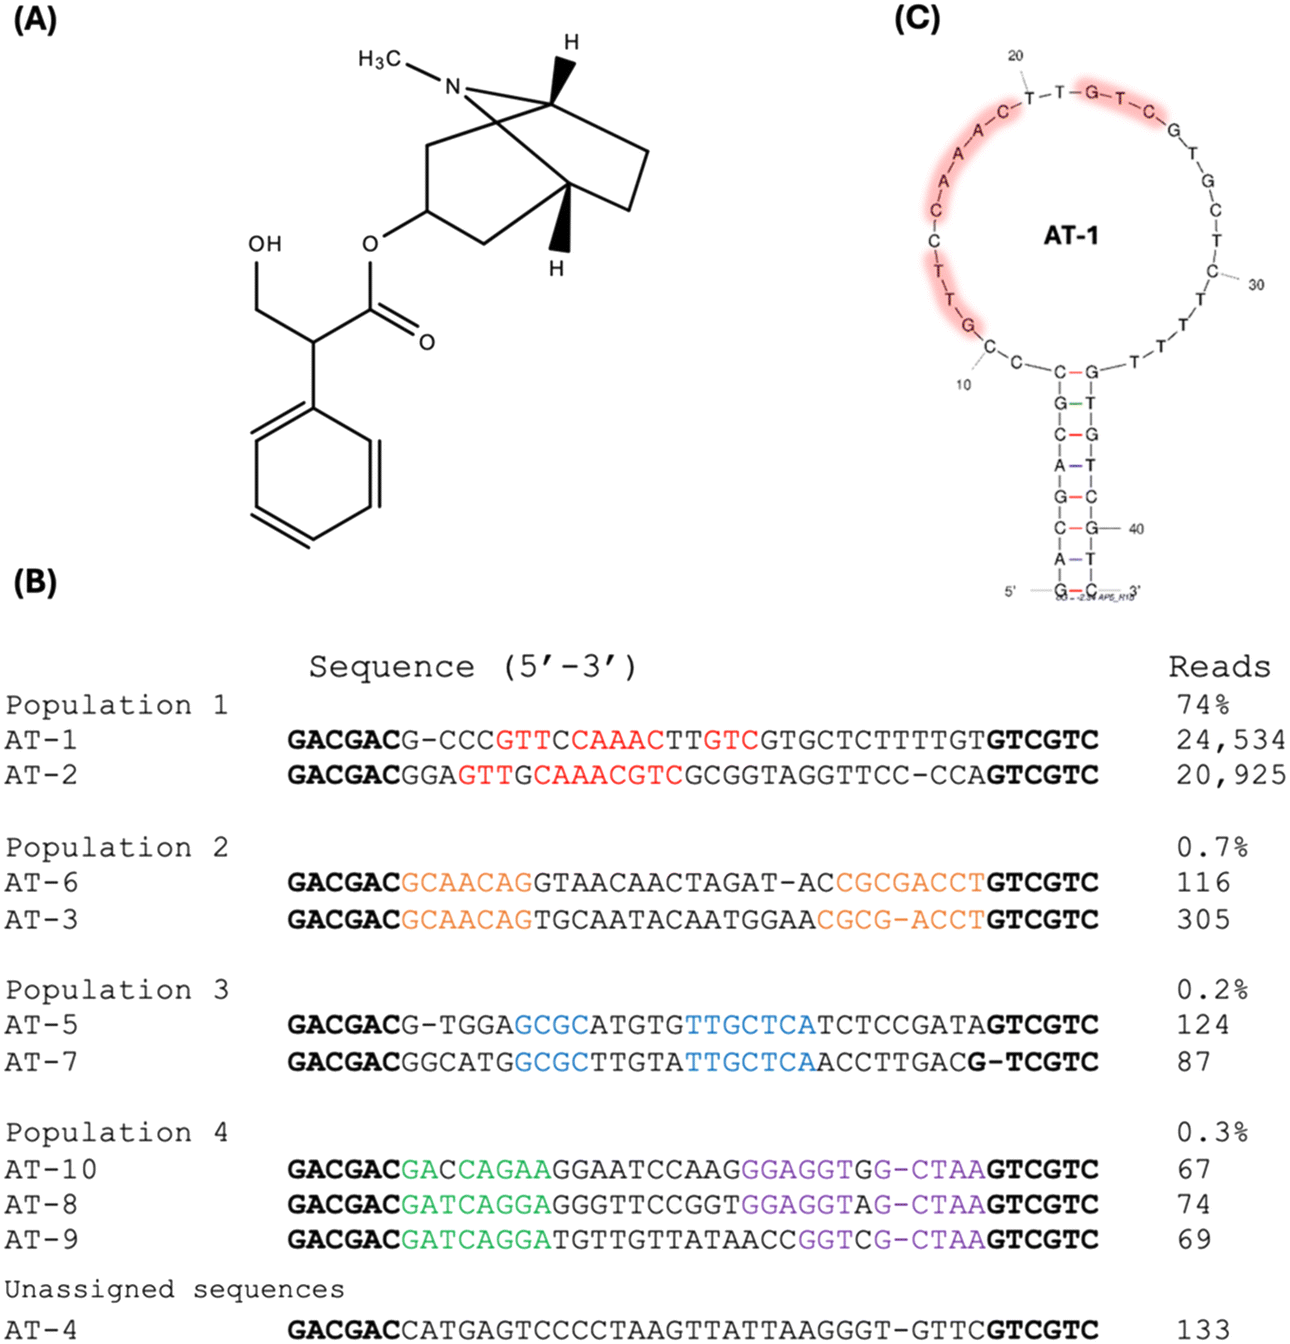 | ||
| Fig. 4 (A) The chemical structure of atropine. (B) The alignment of the top 10 aptamer sequences obtained from the round 15 library. The primer-binding regions are highlighted in bold. These sequences were clustered into populations based on sequence similarity, and conserved sequences are delineated in different colors. The percentages of sequences within each family are presented out of a total of 79609 sequences. (C) The predicted secondary structure of AT-1 with conserved regions highlighted. | ||
Binding of atropine aptamer to atropine
Similar ThT fluorescence spectroscopic approaches were applied to study the binding affinities of atropine. This assay suggested a Kd value of 10.1 μM atropine for the AT-1 aptamer in the selection buffer (Fig. 5A). The LOD in this setting was found to be 0.9 μM. We have further measured the binding affinity of AT-1 to atropine using isothermal titration calorimetry (ITC), which yielded a Kd of 10 μM (Fig. 5B), a value comparable to that obtained from the ThT assays. Similar to the TMJ-1 aptamer, the AT-1 aptamer does not have a strong dependency on salt as well (Fig. 5C).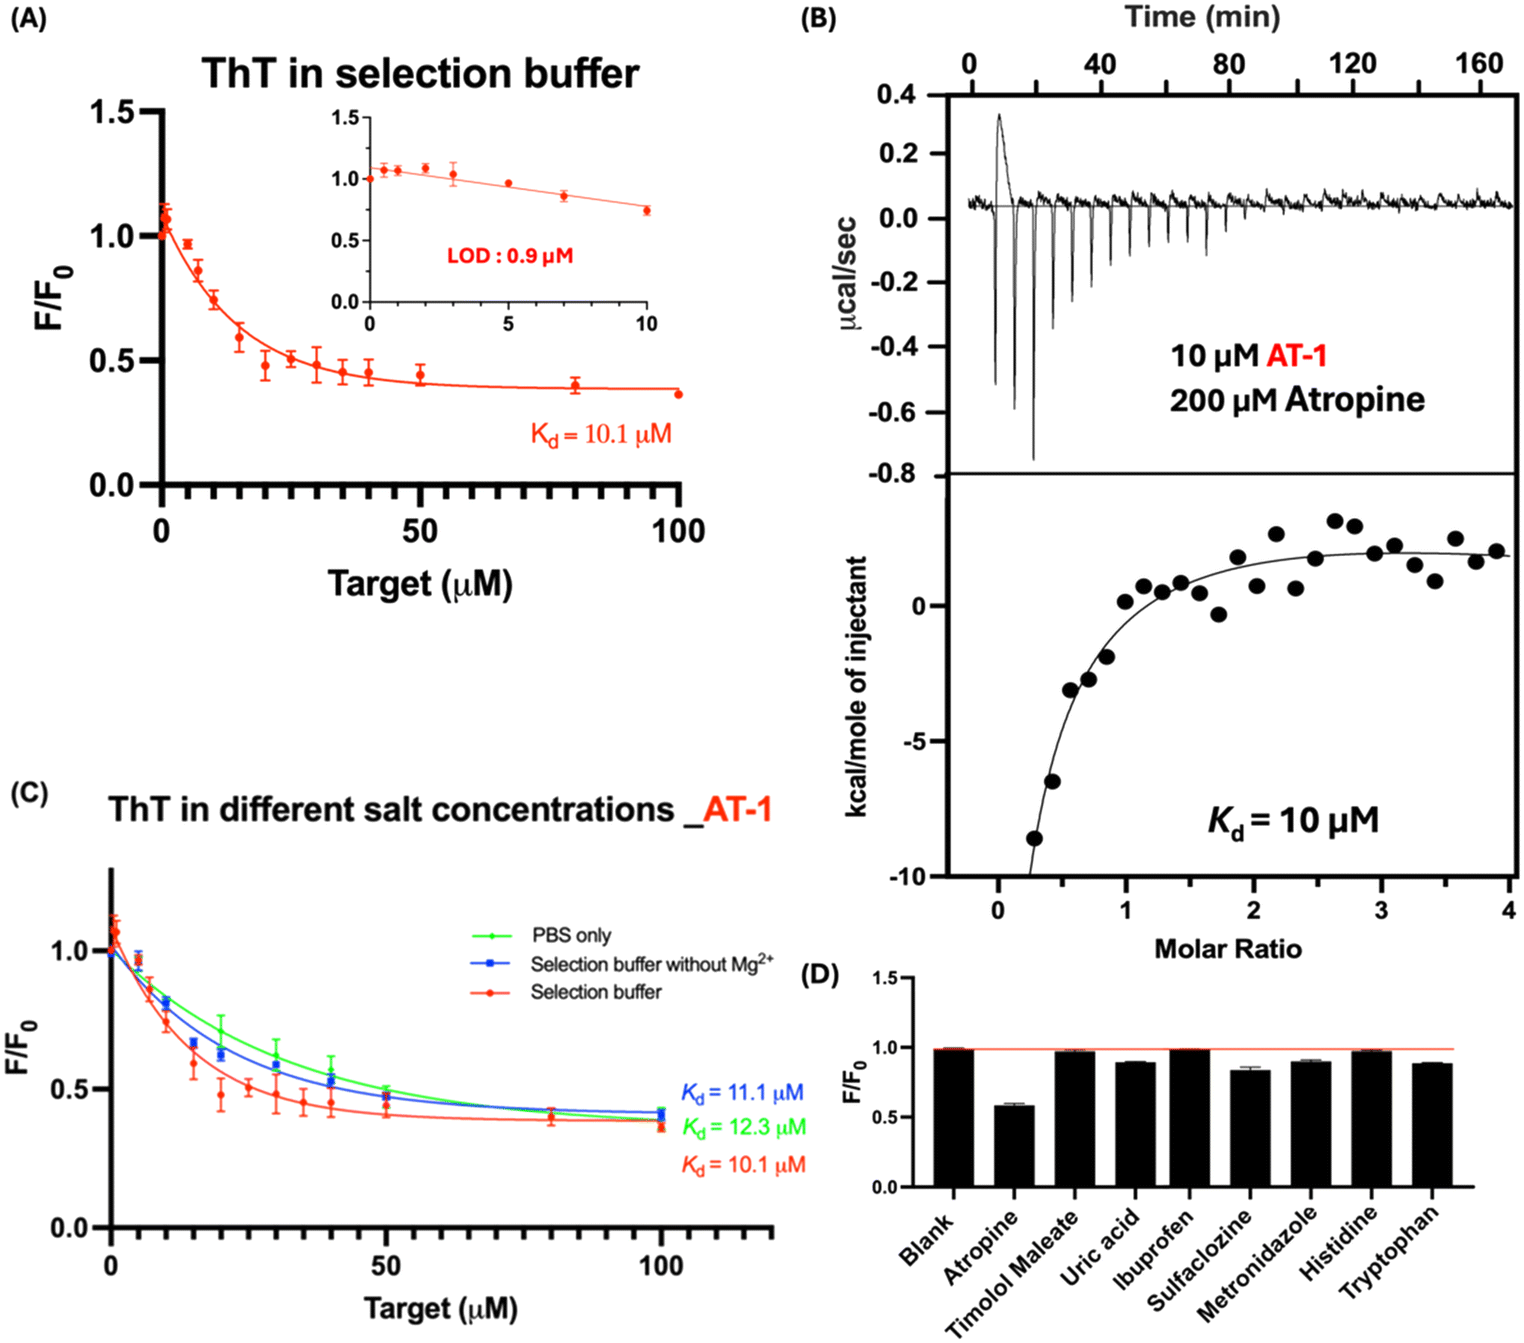 | ||
| Fig. 5 (A) The ThT fluorescence titration curves of atropine to AT-1 in selection buffer. Inset: The linear range and regression line at low atropine concentrations and the limit of detection of two aptamers. (B) The ITC data of the atropine to AT-1 in selection buffers. (C) The ThT fluorescence titration results showing the selectivity of AT-1 to different molecules (50 μM) or solutions (30 μL) in the selection buffer. (D) The selectivity of AT-1 aptamers to different targets in the selection buffer. Data presented as mean ± SEM, n = 3. | ||
In Fig. 5D, the ThT results revealed that 50 μM atropine significantly reduced the fluorescence signal to 0.58. This indicates a strong interaction between atropine and the AT-1 sensor to compete with ThT binding. In contrast, the other molecules tested did not cause a significant reduction in the fluorescent signal, suggesting that they exhibit weak or negligible binding to AT-1. This differential response highlights the specificity of AT-1 for atropine, as it can effectively distinguish atropine from other similar molecules.
The present study is the first to report the selection of aptamers for ocular drugs. Many aptamers for drug molecules have been reported, with most targeting antibiotics. For instance, aptamers for oxytetracycline (OTC-5),41 sulfonamide (SDM-3 and MIX-1),42 and tobramycin (TOB-1) exhibit affinities in the nanomolar range.43 In contrast, the chloramphenicol aptamer (CAP1) has a Kd of about 10 μM,13 which is comparable to the aptamers identified in this study. Beyond antibiotics, some groups have also reported aptamers for daunomycin (DAU-10) with a Kd of 20 nM and dexamethasone (DEX04) with a Kd of 18 nM.44,45 Our lab recently reported aptamers for salicylic acid (SA1),14 the active form of aspirin, with a Kd of 5.8 μM, similar to the results of the present study.
Comparing the sensing of atropine by UV-vis and aptamer-based assays
Atropine has been utilized for myopia control, with recent studies focusing on its delivery via various materials such as hydrogels and microneedles. To apply our aptamer-based sensing method in practical research scenarios, we prepared monolithic hydrogels loaded with atropine and assessed the atropine release using our sensor. This hydrogel mimics the use of contact lenses for drug delivery.24,46–48 We also compared the LOD and sensitivity of our sensor with UV-vis spectroscopy, a common method for measuring atropine absorbance at 258 nm. Fig. 6A presents the calibration curve for atropine using UV-vis spectroscopy, indicating a LOD of 100 μM and a LOQ of 345 μM. In contrast, Fig. 6C shows the calibration curve of our sensor for atropine in PBS with 5 mM MgCl2, which matches the Mg2+ ion concentration in the selection buffer. Our sensor demonstrated a LOD of 7.6 μM and a LOQ of 25.4 μM, which are an order of magnitude lower than those obtained with the UV-vis assay, indicating higher sensitivity of our sensor. Furthermore, considering that many materials or molecules absorb near 258 nm, like tryptophan in culture medium49 and polystyrene in drug delivery materials,50 our aptamer-based sensor with excitation and emission both in the visible region offers greater specificity and accuracy in quantifying atropine. Fig. 6B and D depict the concentrations of atropine released from the sample discs. The results are comparable and the differences were within approximate 15%. Importantly, due to its higher sensitivity, our sensor requires a smaller sample volume for detection. While the UV-vis assay required a dilution factor of 2, our sensor was able to detect atropine in samples diluted up to 26 times, indicating its capability for small-volume sample detection. Overall, our sensor provides an alternative, rapid, sensitive and convenient method for ocular drug detection.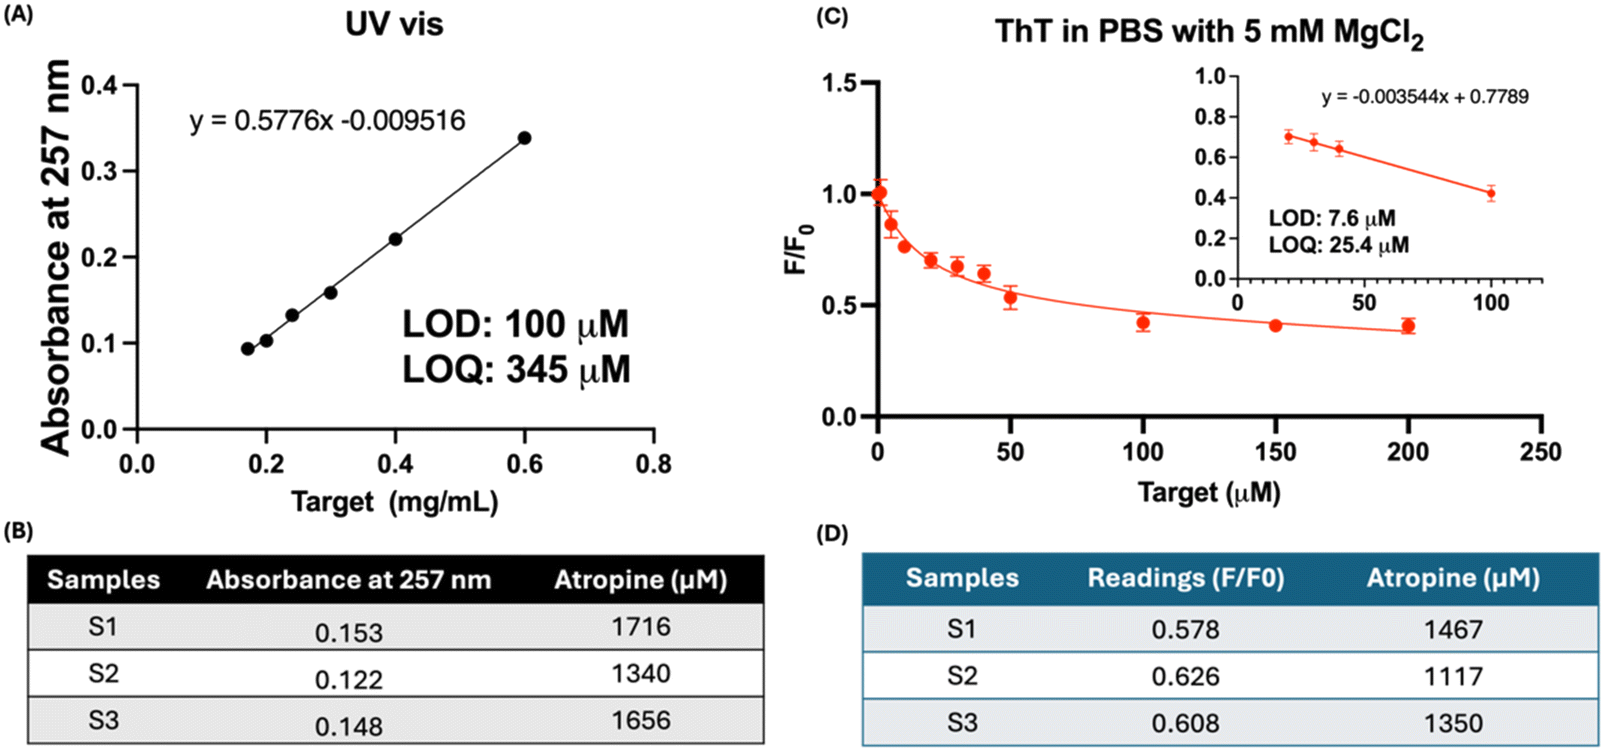 | ||
| Fig. 6 (A) The calibration curve plotted for absorbance at 258 nm. (B) The atropine release from each sample disc calculated based on the UV-vis calibration curve line equation. (C) Calibration curve using aptamer-based assay in PBS with 5 mM MgCl2. Inset: Linear region at low atropine concentrations. (D) The atropine release from each sample disc was calculated based on the aptamer-based assay calibration curve line equation. Data presented as mean ± SEM, n = 3. | ||
UV-visible spectroscopy relies on the light absorption by molecules, which depends on their electronic structure, such as π-bonds, double bonds, or aromatic ring systems. Its sensitivity is often limited by the intrinsic properties of the molecules and the detection limits of the equipment.51,52 In contrast, our aptamer-based assay relies on the ThT fluorescent signal, which is inherently more sensitive than UV-visible spectroscopy. In fluorescence, a single molecule can emit multiple photons, effectively amplifying the signal. This allows for the detection of very low concentrations of the target analyte, even down to the single-molecule level in some cases.53 The observed higher sensitivity of our aptamer-based assay compared to UV-visible spectroscopy can be attributed to the nature of fluorescence detection. Overall, our sensor provides an alternative, rapid, sensitive and convenient method for ocular drug detection.
When comparing our label-free aptamer-based assay with other existing technologies such as the standard LC-MS method, several advantages become apparent. LC-MS, while highly accurate and sensitive, presents significant challenges for routine clinical use. Its complexity involves intricate procedures and sophisticated equipment, requiring highly trained personnel to operate.54,55 In contrast, our aptamer-based assay can address these limitations. The key advantages include rapid detection, significantly reducing the time required for drug detection and treatment decisions. The simplicity of the assay minimizes the need for highly specialized personnel.10,11 Furthermore, the reagents are affordable and also stable. The most significant advantages of our aptamer-based assay is the potential to modify it into a portable biosensor.
4. Conclusions
This study marks the first selection of aptamers for drug molecules that can treat eye diseases: atropine and timolol maleate. Two aptamers, TMJ-1 and AT-1, were identified with good binding affinities with the Kd value of 3.4 μM for TMJ-1 and 10 μM for AT-1, as determined by ITC. Our label-free TMJ-1 biosensor exhibited a LOD of 0.3 μM, enabling the detection of timolol maleate in demanding sample matrix. Meanwhile, the AT-1 biosensor had a LOD of 1 μM, suitable for research applications and showcasing higher sensitivity in UV-visible spectroscopy, ideal for detecting atropine in small-volume samples. By complementing our prior publication on uric acid detection in tears,21 our aptamer-based biosensors have addressed some challenges inherent in ocular drug detection. These biosensors offer higher sensitivity, and specificity, and serve as viable alternatives to conventional detection methods. Further advancements in this domain hold promise for significantly enhancing the monitoring of drug delivery and the treatment of ocular diseases. Future research aims to enhance the clinical use of these sensors by conducting experiments using patient samples to ensure reliability. Developing smart contact lenses or ocular inserts with embedded biosensors can provide continuous drug level monitoring and real-time feedback.56 Enhancing biosensors with nanoparticles can improve sensitivity and specificity, potentially lowering the LOD. Applying the SELEX protocol to select more aptamers for various ocular drugs will broaden sensor applicability, making them versatile tools for comprehensive ocular drug monitoring. These advancements can make aptamer-based biosensors integral to advanced ophthalmic care, offering precise, personalized, and timely therapeutic monitoring.Data availability
The data supporting this article have been included as part of the ESI.‡Author contributions
Ka-Ying Wong contributed to conducting the experiments, analyzing the data, and preparing the manuscript. Yibo Liu contributed to designing the experiments and providing advice. Chau-Minh Phan and Lyndon Jones contributed to the conceptualization of the topics. Man-Sau Wong provided advice. Juewen Liu contributed to the conceptualization of the topic, providing advice, and revising the manuscript. All authors have approved the final version of the manuscript.Conflicts of interest
The authors declare no conflict of interest.Acknowledgements
We are grateful for the financial support from the Hong Kong Special Administrative Region Government and InnoHK. We extend our gratitude to Dr. Brandon Ho and Dr. Parvin Shokrollahi at the Centre for Ocular Research & Education (CORE) at the University of Waterloo for preparing the artificial tears and the disc samples.References
- Y. Liu, J. Li, S. Xiao, Y. Liu, M. Bai, L. Gong, J. Zhao and D. Chen, Biosensors, 2023, 13, 726 CrossRef CAS PubMed.
- W. S. Liang, B. Beaulieu-Jones, S. Smalley, M. Snyder, L. H. Goetz and N. J. Schork, Front. Pharmacol., 2024, 15, 1348112 CrossRef CAS PubMed.
- A. Dennyson Savariraj, A. Salih, F. Alam, M. Elsherif, B. AlQattan, A. A. Khan, A. K. Yetisen and H. Butt, ACS Sens., 2021, 6, 2046–2076 CrossRef CAS PubMed.
- Z. Goli-Malekabadi, N. Salarizadeh, M. Dianatkhah, M. Amoo and J. Shabani Shayeh, in Advanced Sensor Technology, ed. A. Barhoum and Z. Altintas, Elsevier, 2023, pp. 383–412, DOI:10.1016/B978-0-323-90222-9.00016-9.
- L. G. Carney and R. M. Hill, Arch. Ophthalmol., 1976, 94, 821–824 CrossRef CAS PubMed.
- S. Mishima, A. Gasset, S. D. Klyce, Jr and J. L. Baum, Invest. Ophthalmol. Visual Sci., 1966, 5, 264–276 CAS.
- T. Sørensen and F. T. Jensen, Acta Ophthalmol., 1979, 57, 564–581 CrossRef PubMed.
- M. H. Akhter, I. Ahmad, M. Y. Alshahrani, A. I. Al-Harbi, H. Khalilullah, O. Afzal, A. S. A. Altamimi, S. N. M. Najib Ullah, A. Ojha and S. Karim, Gels, 2022, 8, 82 CrossRef CAS PubMed.
- X. Zhan, J. Li, Y. Guo and O. Golubnitschaja, EPMA J., 2021, 12, 449–475 CrossRef PubMed.
- S. M. Nimjee, R. R. White, R. C. Becker and B. A. Sullenger, Annu. Rev. Pharmacol. Toxicol., 2017, 57, 61–79 CrossRef CAS PubMed.
- W. Tan, H. Wang, Y. Chen, X. Zhang, H. Zhu, C. Yang, R. Yang and C. Liu, Trends Biotechnol., 2011, 29, 634–640 CrossRef CAS PubMed.
- B. G. Andryukov, N. N. Besednova, R. V. Romashko, T. S. Zaporozhets and T. A. Efimov, Biosensors, 2020, 10, 11 CrossRef CAS PubMed.
- Y. Zhao, A. Z. Li and J. Liu, Environ. Health, 2023, 1, 102–109 CAS.
- L. Gu, H. Zhang, Y. Ding, Y. Zhang, D. Wang and J. Liu, Smart Mol., 2023, 1, e20230007 CrossRef.
- L. Negri, A. Ferreras and M. Iester, J. Ophthalmol., 2019, 2019, 4146124 Search PubMed.
- P.-C. Wu, M.-N. Chuang, J. Choi, H. Chen, G. Wu, K. Ohno-Matsui, J. B. Jonas and C. M. G. Cheung, Eye, 2019, 33, 3–13 CrossRef PubMed.
- I. Jawaid, K. Saunders, C. J. Hammond, A. Dahlmann-Noor and M. A. Bullimore, Eye, 2024, 38, 434–441 CrossRef PubMed.
- S. Ahmed, M. M. Amin and S. Sayed, AAPS J., 2023, 24, 66 Search PubMed.
- R. C. Heel, R. N. Brogden, T. M. Speight and G. S. Avery, Drugs, 1979, 17, 38–55 CrossRef CAS PubMed.
- B. Al, J. Acad. Emerg. Med., 2014, 13, 2–3 CrossRef.
- Y. Liu and J. Liu, Analysis Sensing, 2022, 2, e202200010 CrossRef CAS.
- L. Gu, Y. Zhang, D. Wang and J. Liu, Adv. Sens. Res., 2024, 3, 2300167 CrossRef CAS.
- C. M. Phan, H. Walther, D. Riederer, C. Lau, K. O. Lorenz, L. N. Subbaraman and L. Jones, J. Biomed. Mater. Res., Part B, 2019, 107, 1662–1668 CrossRef CAS PubMed.
- C. M. Phan, L. N. Subbaraman and L. W. Jones, Optom. Vis. Sci., 2019, 96, 180–186 CrossRef PubMed.
- M. Fahmy, B. Long, T. Giles and C.-H. Wang, Eye Contact Lens, 2010, 36, 215–219 CrossRef PubMed.
- M. Biancalana and S. Koide, Biochim. Biophys. Acta, 2010, 1804, 1405–1412 CrossRef CAS PubMed.
- K. Yang, N. M. Mitchell, S. Banerjee, Z. Cheng, S. Taylor, A. M. Kostic, I. Wong, S. Sajjath, Y. Zhang, J. Stevens, S. Mohan, D. W. Landry, T. S. Worgall, A. M. Andrews and M. N. Stojanovic, Science, 2023, 380, 942–948 CrossRef CAS PubMed.
- F. Yeasmin Khusbu, X. Zhou, H. Chen, C. Ma and K. Wang, TrAC, Trends Anal. Chem., 2018, 109, 1–18 CrossRef CAS.
- N. Amdursky, Y. Erez and D. Huppert, Acc. Chem. Res., 2012, 45, 1548–1557 CrossRef CAS PubMed.
- Y. Ding, Y. Xie, A. Z. Li, P.-J. J. Huang and J. Liu, Biochemistry, 2023, 62, 2280–2288 CrossRef CAS PubMed.
- T. Hermann and D. J. Patel, Structure, 2000, 8, R47–R54 CrossRef CAS PubMed.
- Y. Zhao, B. Gao, P. Sun, J. Liu and J. Liu, Biosensors, 2022, 12, 717 CrossRef CAS PubMed.
- Y. Liu and J. Liu, ChemBioChem, 2023, 24, e202200564 CrossRef CAS PubMed.
- J. Noeske, H. Schwalbe and J. Wöhnert, Nucleic Acids Res., 2007, 35, 5262–5273 CrossRef CAS PubMed.
- M. Ahuja, A. S. Dhake, S. K. Sharma and D. K. Majumdar, AAPS Journal, 2008, 10, 229–241 CrossRef CAS PubMed.
- C.-K. Joo and J.-S. Choi, Invest. Ophthalmol. Visual Sci., 2013, 54, 2955–2955 Search PubMed.
- A. Kodym, E. Kaczyńska-Dyba, B. Kubiak and H. Kukuła, Acta Pol. Pharm., 2011, 68, 109–114 CAS.
- M. Nakatsukasa, C. Sotozono, K. Shimbo, N. Ono, H. Miyano, A. Okano, J. Hamuro and S. Kinoshita, Am. J. Ophthalmol., 2011, 151, 799–808.e791 CrossRef CAS PubMed.
- T. K. Mundorf, T. Ogawa, H. Naka, G. D. Novack and R. S. Crockett, Clin. Ther., 2004, 26, 541–551 CrossRef CAS PubMed.
- Y. Zhang, C. Lu and J. Zhang, Nutrients, 2021, 13, 2492 CrossRef CAS PubMed.
- Y. Zhao, S. Ong, Y. Chen, P. J. Jimmy Huang and J. Liu, Anal. Chem., 2022, 94, 10175–10182 CrossRef CAS PubMed.
- X. Li, Z. Yang, M. Waniss, X. Liu, X. Wang, Z. Xu, H. Lei and J. Liu, Anal. Chem., 2023, 95, 16366–16373 CrossRef CAS PubMed.
- D. Wang, Y. Li, X. Deng, M. Torre, Z. Zhang, X. Li, W. Zhang, K. Cullion, D. S. Kohane and C. B. Weldon, Nat. Commun., 2023, 14, 2444 CrossRef CAS PubMed.
- A. Wochner, M. Menger, D. Orgel, B. Cech, M. Rimmele, V. A. Erdmann and J. Glökler, Anal. Biochem., 2008, 373, 34–42 CrossRef CAS PubMed.
- S. Mehennaoui, S. Poorahong, G. C. Jimenez and M. Siaj, Sci. Rep., 2019, 9, 6600 CrossRef PubMed.
- L. Jones, A. Hui, C.-M. Phan, M. L. Read, D. Azar, J. Buch, J. B. Ciolino, S. A. Naroo, B. Pall, K. Romond, P. Sankaridurg, C. M. Schnider, L. Terry and M. Willcox, Cont. Lens Anterior Eye, 2021, 44, 398–430 CrossRef PubMed.
- M. Abdullah Aziz, R. Kuppusamy, K. Mazumder, A. Hui, F. Maulvi, F. Stapleton and M. Willcox, Cont. Lens Anterior Eye, 2024, 102246, DOI:10.1016/j.clae.2024.102246.
- A. Hui, M. Bajgrowicz-Cieslak, C. M. Phan and L. Jones, Clin. Ophthalmol., 2017, 11, 1657–1665 CrossRef CAS PubMed.
- Agilent, Quantitation of Peptides and Amino Acids with a SynergyTMHT using UV Fluorescence, 2006 Search PubMed.
- F. Li, X. Ye, M. Li, Q. Nie, H. Wang, G. Zhang, L. Dong, C. Wang, L. Wu, H. Liu, L. Wang, C. Peng and J. Zhang, Int. J. Pharm., 2024, 660, 124294 CrossRef CAS PubMed.
- J. Miyawa and S. Schulman, Handbook of Pharmaceutical Analysis, 2001, vol. 187, p. 38 Search PubMed.
- H. Förster, Characterization I. Molecular Sieves – Science and Technology, ed. H. G. Karge and J. Weitkamp, Springer Berlin Heidelberg, Berlin, Heidelberg, 2004, pp. 337–426, DOI:10.1007/b94239.
- Z. Farka, M. J. Mickert, M. Pastucha, Z. Mikušová, P. Skládal and H. H. Gorris, Angew. Chem., Int. Ed., 2020, 59, 10746–10773 CrossRef CAS PubMed.
- S. Junger, M. Hoene, M. Shipkova, G. Danzl, C. Schöberl, A. Peter, R. Lehmann, E. Wieland and H. Braitmaier, J. Mass Spectrom. Adv. Clin. Lab, 2023, 30, 1–9 CrossRef CAS PubMed.
- S. N. Thomas, D. French, P. J. Jannetto, B. A. Rappold and W. A. Clarke, Nat. Rev. Methods Primers, 2022, 2, 96 CrossRef CAS PubMed.
- C. M. Phan, L. Subbaraman and L. W. Jones, Optom. Vis. Sci., 2016, 93, 419–425 CrossRef PubMed.
Footnotes |
| † The authors have filed patent related to this work. |
| ‡ Electronic supplementary information (ESI) available. See DOI: https://doi.org/10.1039/d4sd00223g |
| This journal is © The Royal Society of Chemistry 2024 |