
 Open Access Article
 This Open Access Article is licensed under a Creative Commons Attribution-Non Commercial 3.0 Unported Licence
A sensitive paper-based sensor for fluoride detection in water using Tb3+ photoluminescence†
Pankaj Kumar
Chaturvedi
 and
Uday
Maitra
*
and
Uday
Maitra
*
Department of Organic Chemistry, Indian Institute of Science, Bengaluru, 560012, Karnataka, India. E-mail: maitra@iisc.ac.in
First published on 11th April 2024
Abstract
Fluoride is a vital trace mineral for healthy bones and teeth, but a higher intake can lead to nephrolithiasis, dental/skeletal fluorosis, etc. Many dry regions worldwide contain higher fluoride than the WHO permissible limit of 1.5 ppm, necessitating a simple fluoride detection protocol. We adopted a fluoride-triggered desilylation strategy, which releases a sensitizer and enhances Tb3+ luminescence in a TbCh gel matrix. Under the optimized assaying conditions, the pro-sensitizer exhibited a selective response with a detection limit of 27 ppb, well below the WHO permissible limit. We also immobilized the gels on paper discs to detect fluoride from real-life samples (e.g., toothpaste, groundwater), and the results were validated using the standard ISE method. The promising results suggest nonexpert users adapting the protocol in resource-limited areas to provide quality control analysis.
1. Introduction
Anion recognition and sensing have immense applications in chemical processes. Anions are involved in many metabolic processes and participate in various enzymatic reactions.1,2 Fluoride (F−), the smallest anion with high charge density, is essential for teeth and bones. The appropriate level of fluoride ions in the human body is routinely maintained from its natural presence in drinking water, food, and fluoride supplements (e.g., toothpaste, mouthwash) to prevent dental caries and treat osteoporosis.3–5 However, higher intake induces liver or kidney damage and dental and skeletal fluorosis, inhibits neurotransmitter biosynthesis in fetuses and leads to various serious health issues (Fig. 1).6,7 | ||
| Fig. 1 Health issues from excess fluoride intake. | ||
The WHO has set 1.5 ppm as the maximum permissible fluoride limit in drinking water.8 The fluoride content in groundwater exceeds this limit due to its natural occurrence in parts of various countries such as China, Argentina, Middle East, Italy, Mexico, Mongolia, India, The Netherlands, Poland, Norway, West Indies, Pakistan, Spain, UK, and various regions of the African continent.9,10 Fluoride contamination in groundwater due to the use of fluoride in industry has also become a global threat. Thus, it is important to design and synthesize molecular probes for the selective detection of fluoride ions from drinking water without the aid of sophisticated equipment.
In the literature, various fluoride detection techniques in aqueous solutions have been reported, including chromatography,11 electrochemistry,12,13 fluorescence,14,15etc.16 Fluorescence techniques are advantageous due to their low cost, simple operation, compatibility with biological systems, and high sensitivity and selectivity. Some important recognition strategies using fluorescence techniques that have been reported in the literature are anion–π interactions,17,18 Lewis acid–base interactions,19–21 reversible hydrogen-bonding,22,23 and irreversible anion-induced chemical reactions.16,24,25 The very high affinity of fluorides towards silicon enables irreversible fluoride-induced chemical reactions owing to the formation of strong Si–F bonds.26 Thus, the strategy of desilylation of silyl ether has been widely used in synthesizing many chemodosimeters for fluoride sensing.16,27 However, fluoride detection in aqueous solutions using these techniques is difficult due to the interference with other biomolecules and similar ions present in the samples.28 Lanthanide photoluminescence can circumvent these problems by allowing emission recording in the time-gated mode due to long excited-state lifetimes with large pseudo-Stokes shifted sharp, line-like emission features.29 These characteristics make the lanthanide-based luminescence probes advantageous over the conventional fluorescence-based probes. A few lanthanide luminescence-based fluoride detection methods have been reported with covalently connected chelate lanthanide complexes,30 metal–organic frameworks,31,32 nanomaterials,33 lanthanide-xerogels,34etc., but they involve tedious synthesis. The present work describes a lanthanide gel-based “turn-on” photoluminescent probe for detecting fluoride ions in aqueous media.
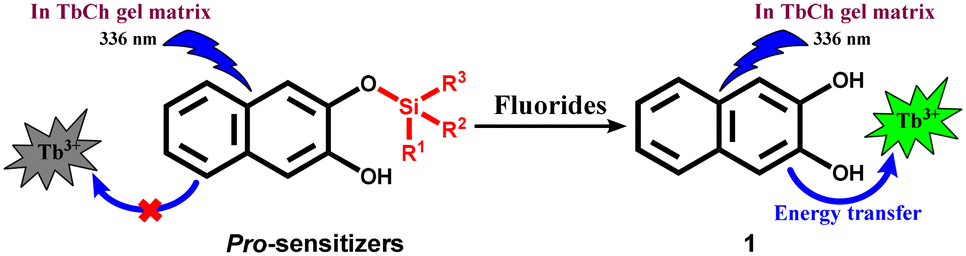
This group has demonstrated and explained the sensitization of lanthanide (Ln3+) luminescence by noncovalently linked, small organic chromophores through an “antennae” effect in lanthanide cholate (LnCh) gel matrices.35 This strategy has been used for the detection of various drug molecules,36 gallate-derived green tea polyphenols,37 and fluoroquinolone antibiotics.38 Our group has also discovered a novel “pro-sensitizer” based approach to detect various enzymes39 and small molecules.40 Here, 2,3-dihydroxynaphthalene (1) is one of the sensitizers that enhance Tb3+ luminescence in TbCh gel, whereas molecules with structural modification of 1 at the hydroxyl group showed only weak sensitization. Thus, we envisaged designing pro-sensitizers with silyl ether group(s) attached to sensitizer molecule 1 as a fluoride-recognizing unit (Scheme 1). The pro-sensitizers were anticipated to liberate the sensitizer 1 upon the reaction with fluoride ions, enabling luminescence enhancement of Tb3+ in the TbCh gel matrix for sensing and quantification.
 | ||
| Scheme 1 Design of pro-sensitizers from structural modification of 1. | ||
2. Experimental
2.1. Materials and instruments
2,3-Dihydroxynaphthalene (1) was purchased from Sigma Aldrich and recrystallized from hot water. Sodium cholate (NaCh), terbium nitrate pentahydrate (Tb(NO3)3·5H2O), imidazole, and HEPES sodium salts were purchased from Sigma Aldrich and were used without any further purification. Triisopropylsilyl trifluoromethanesulfonate (TIPSOTf) and tert-butyldimethylsilyl chloride (TBDMSCl) were purchased from Tokyo Chemical Industries and Spectrochem Pvt. Ltd., respectively. Sodium salts, acetic acid and hydrochloric acid were purchased from commercial suppliers and were used as received. Solvents were purchased from S. D. Fine Chemical Ltd. and distilled before any use. Western blotting filter paper (thickness: 0.83 mm) was purchased from Thermo Fisher Scientific. Whatman W3 filter paper was purchased from the Chemical Store at the institute. Milli-Q water (18.2 MΩ cm at 25 °C) was used for all the experiments. pH values were recorded on a HORIBA LAQUAtwin pH-11 pocket pH meter. An ultrasonic bath (33 kHz) was used for the gel preparation. Nuclear magnetic resonance (NMR) spectra were acquired using a Bruker 400 MHz spectrometer. Chemical shifts are reported in δ/ppm relative to tetramethylsilane (δ = 0 ppm, s) with the multiplicities reported as follows: s (singlet), dd (doublets of doublet), sept (septet) and m (multiplet). Coupling constants (J-values) are reported in Hertz (Hz), and the number (n) of protons associated with a given peak is indicated as nH. High-resolution mass spectra (HRMS) were recorded using a Xevo G2-XS QToF and an Agilent 6538 UHD Accurate-Mass Q-TOF LC/MS G6538A instrument. UV spectra were recorded on a Shimadzu UV-2600i UV-vis-NIR spectrometer. A Varian Cary Eclipse spectrometer was used for recording PL spectra of gels in the phosphorescence mode (delay time: 0.2 ms, gate time: 3.0 ms). The luminescence measurements of gels and gel-coated paper discs were performed on a Varioskan Flash spectral scanning multimode reader in TRF mode (delay time: 0.2 ms). High-performance liquid chromatography (HPLC) analysis was done on a Shimadzu HPLC system (LC-10ATvp gradient pump, SPD-M10Avp UV-vis detector) using a reversed-phase C18 column (Phenomenex, 5 μm, 250 × 4.6 mm). AFM images were recorded on a JPK Nano Wizard II instrument.2.2. Synthesis of pro-sensitizers 2, 3 and 4
The pro-sensitizers 2, 3 and 4 were synthesized by the silylation of sensitizer 1 by tert-butyldimethylsilyl chloride (TBDMS-Cl) and triisopropylsilyl trifluoromethanesulfonate (TIPS-OTf) following a reported protocol41 with some modifications, and characterized by 1H NMR, 13C NMR and HRMS spectral analysis.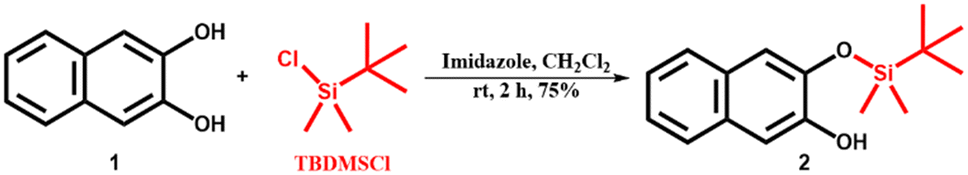 | ||
| Scheme 2 Synthesis of pro-sensitizer 2. | ||
1H NMR (400 MHz, CDCl3) δ/ppm: 7.66–7.61 (m, 2H), 7.32–7.25 (m, 3H), 7.15 (s, 1H), 5.82 (s, 1H), 1.06 (s, 9H), 0.36 (s, 6H) (Fig. S11†).
13C NMR (100 MHz, CDCl3) δ/ppm: 147.3, 143.4, 130.3, 128.9, 126.4, 126.3, 124.5, 123.7, 113.1, 109.5, 25.8, 18.3, −4.3 (Fig. S12†).
HRMS (m/z for C16H22O2SiK [M + K]+): calcd. 313.1026, observed 313.0938 (Fig. S13†).
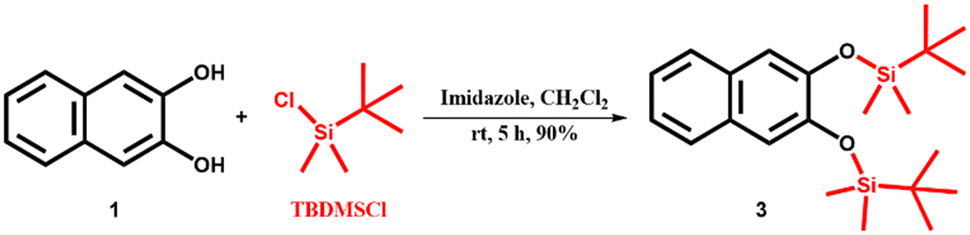 | ||
| Scheme 3 Synthesis of pro-sensitizer 3. | ||
1H NMR (400 MHz, CDCl3) δ/ppm: 7.61 (dd, J = 6.4 Hz, 3.2 Hz, 2H), 7.28 (dd, J = 6.4 Hz, 3.2 Hz, 3H), 7.18 (s, 2H), 1.02 (s, 12H), 0.26 (s, 18H) (Fig. S14†).
13C NMR (100 MHz, CDCl3) δ/ppm: 147.6, 129.7, 126.1, 123.9, 116.1, 26.0, 18.6, −4.1 (Fig. S15†).
HRMS (m/z for C22H36O2Si2Na [M + Na]+): calcd. 411.2152, observed 411.2146 (Fig. S16†).
 | ||
| Scheme 4 Synthesis of pro-sensitizer 4. | ||
1H NMR (400 MHz, CDCl3) δ/ppm: 7.66–7.60 (m, 2H), 7.33–7.25 (m, 3H), 7.16 (s, 1H), 5.98 (s, 1H), 1.43 (sept, 3H), 1.10 (s, 18H) (Fig. S17†).
13C NMR (100 MHz, CDCl3) δ/ppm: 147.2, 143.6, 130.2, 128.9, 126.4, 126.3, 124.3, 123.6, 112.6, 109.3, 18.3, 12.8 (Fig. S18†).
HRMS (m/z for C19H29O2Si [M + H]+): calcd. 317.1932, observed 317.1161 (Fig. S19†).
2.3. Procedure for gel preparation and PL measurements
A stock solution of pro-sensitizer/sensitizer was prepared in DMSO, followed by 5-fold dilution with a buffer solution (20 mM NaCh + 10 mM HEPES) of pH 6.9 to prepare an appropriate concentration of pro-sensitizer/sensitizer doped NaCh solution. The corresponding doped TbCh (5/15 mM)42 gel was prepared by mixing 300 μL of respective NaCh solution and 100 μL of Tb(NO3)3·5H2O solution, followed by mild sonication in a bath sonicator (5–6 s, 33 kHz, rt).Similarly, 300 μL of analyte-treated, pro-sensitizer doped NaCh solution was incubated at 35 °C for 30 min and mixed with 100 μL of Tb(NO3)3·5H2O solution, followed by mild sonication to obtain analyte-treated pro-sensitizer-doped TbCh (5/15 mM) gels.
2.4. Preparation of toothpaste stock solution
A fluoride-containing (927 ppm) toothpaste (476 mg) was suspended in 7.74 mL Milli-Q water and sonicated for 5 min, followed by centrifugation (5000 rpm) for 15 min. The supernatant was collected and filtered through a 0.2 μm membrane syringe filter to obtain the toothpaste stock solution (pH 7.1). The stock solution was further diluted 10-fold in HEPES (20 mM, pH 6.5) buffer and used for fluoride detection.3. Results and discussion
3.1. Sensitization of TbCh gel by 1 and pro-sensitizer 2
First, the stock solutions of compounds 1 and 2 were prepared in DMSO and further diluted in 30 mM NaCh solution (with 33% DMSO/water) to prepare 1-doped and 2-doped NaCh solutions. UV-vis spectra of compounds 1 and 2 recorded in 30 mM NaCh solution (33% DMSO/water) showed similar absorption profiles with the absorbance maxima at 326 nm having molar extinction coefficient, ε = 3680 M−1 cm−1 (Fig. 2a).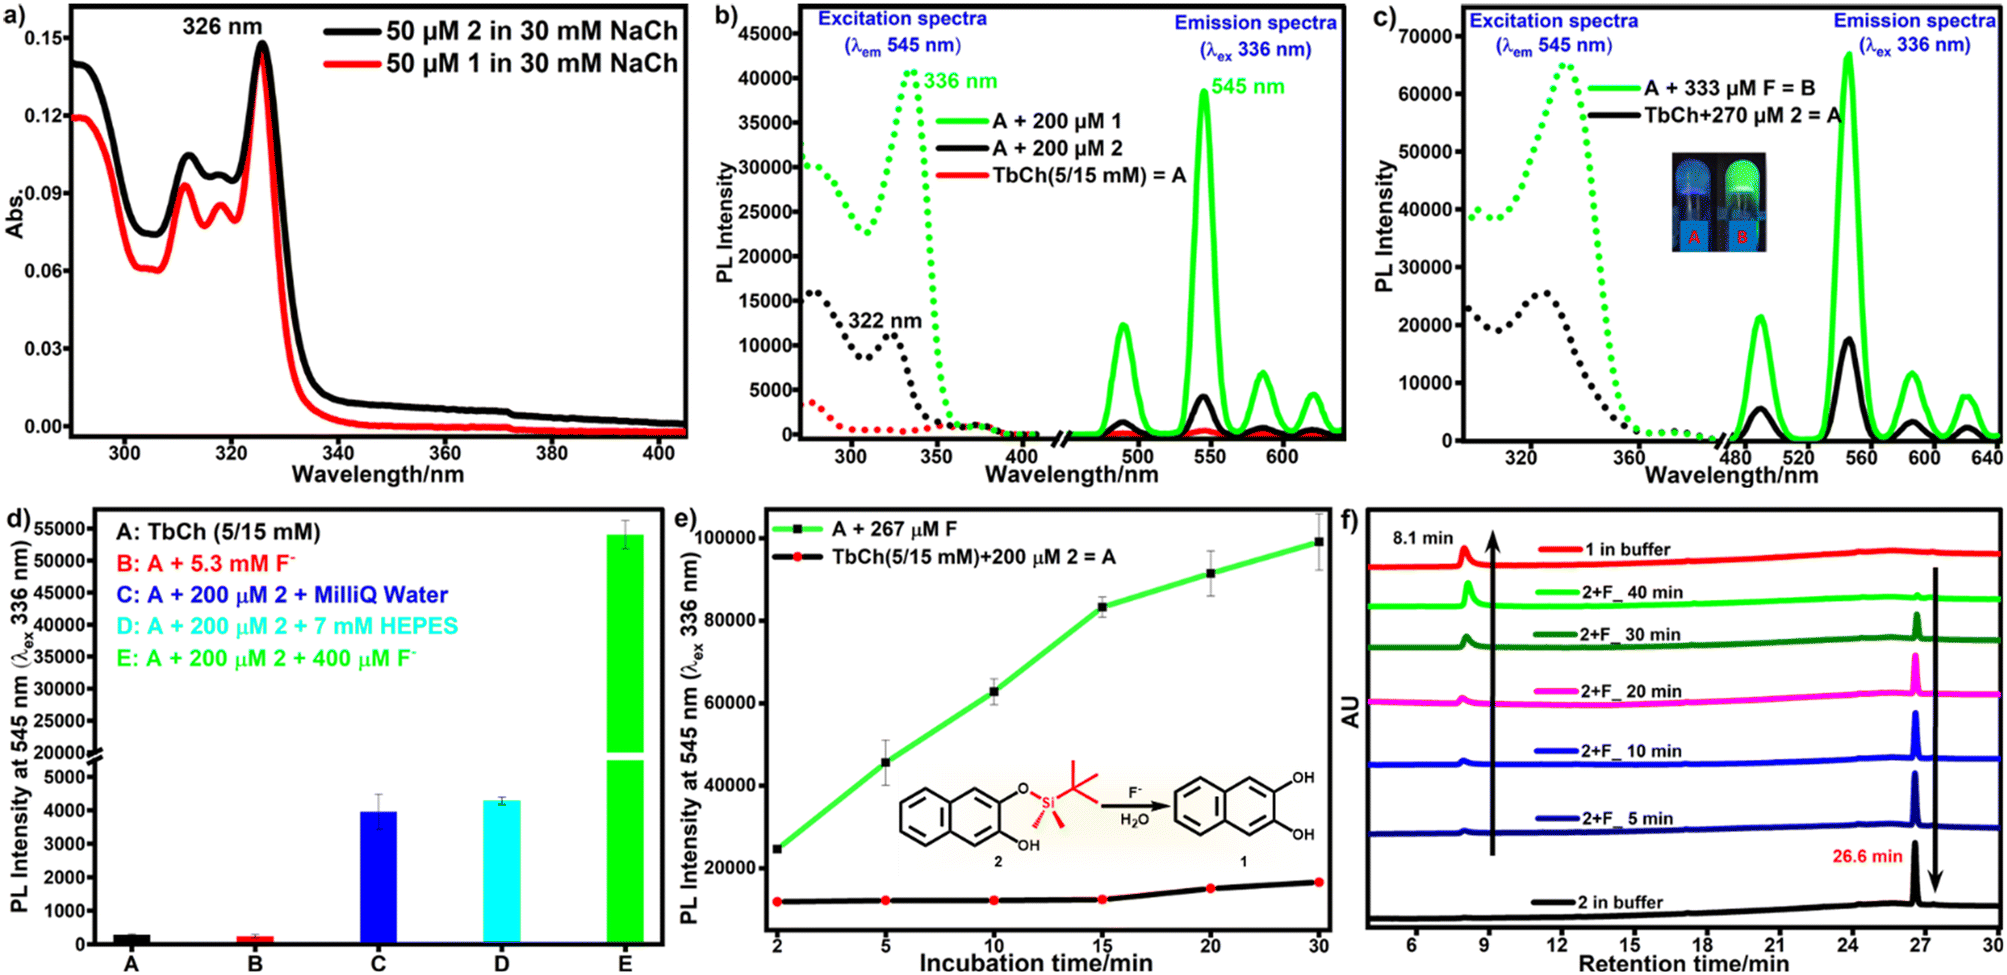 | ||
| Fig. 2 a) UV spectra of 1 and 2 in 30 mM NaCh solution (33% DMSO/water). b) PL spectra (excitation and emission) of 1-doped, 2-doped, and native TbCh (5/15 mM) gels. c) PL spectra of 2-doped and fluoride-treated 2-doped TbCh gels (inset: picture of gels). d) PL intensity of native (A), fluoride-doped (B), 2-doped (C and D), and fluoride-treated 2-doped (E) TbCh gels. e) PL intensity of 2-doped and fluoride-treated 2-doped TbCh gels (inset: desilylation reaction scheme). f) HPLC chromatogram (gradient elution of 55–90% MeOH/water with 0.09% AcOH). | ||
To check the sensitization of Tb3+, the photoluminescence (PL) spectra of 1 (200 μM)-doped, 2 (200 μM)-doped and native TbCh (5/15 mM) gels were recorded (Fig. 2b). The native TbCh gel showed very weak luminescence, whereas 1-doped TbCh gel showed strong (90-fold) Tb3+ luminescence when excited at 336 nm, indicating the energy transfer from the sensitizer 1 to the Tb3+ center in the gel matrix. The importance of the gel system and the involved energy transfer mechanism were reported earlier.35 However, the 2-doped TbCh gel showed only weak (10-fold) luminescence, suggesting significantly poor Tb3+ sensitization, which was also evident from the excitation profile.
3.2. Reactivity of pro-sensitizer 2 with fluoride ions
To check the reactivity of 2 with fluoride, 2 (270 μM)-doped NaCh solutions (450 μL, 20 mM) containing 333 μM fluoride and without fluoride (as a control) were incubated at 35 °C for 1 h. These solutions were mixed with aqueous terbium nitrate (150 μL, 20 mM), followed by mild sonication to prepare TbCh gels. The PL spectra of these gels were recorded by excitation at 336 nm. As we envisaged, fluoride-treated 2-doped TbCh gel showed strong Tb3+ luminescence, whereas 2-doped TbCh gel showed only weak Tb3+ luminescence (Fig. 2c). Furthermore, several experiments were performed to improve detection accuracy, sensitivity, and stability. The incubation temperature, the reaction time of 2 with fluoride ions, the pH of the testing system, and the solvent system were optimized (details in the ESI†).The pro-sensitizers 3 and 4 were also tested under the optimized assay conditions. The poor solubility of 3 (cloudiness was visible by the naked eye) made it inappropriate for the assay. However, the assay performed using pro-sensitizer 4 (details in the ESI†) showed very poor responses compared to that using pro-sensitizer 2 (Fig. S7†). Thus, pro-sensitizer 2 was used for further studies to develop the detection protocol.
Under the optimized assay conditions, a control experiment was done to eliminate the possibility of a direct effect of fluoride on the TbCh gel. There was no luminescence enhancement even with 5.3 mM fluoride-doped TbCh gel compared to the native TbCh gel, whereas 2-doped TbCh gel showed only weak luminescence (15-fold). In contrast, fluoride-treated 2-doped TbCh gel showed strong green luminescence (190-fold) compared to the native TbCh gel at 545 nm (Fig. 2d), suggesting the fluoride-triggered release of sensitizer 1, which was responsible for the Tb3+ luminescence enhancement.
3.3. Proof for release of sensitizer 1
Under the optimal conditions, solutions of fluoride-treated 2 in buffer were incubated at 35 °C for various incubation times (5 to 30 min in increments of 5 min), followed by the addition of aqueous terbium nitrate to make TbCh (5/15 mM) gels. The luminescence of these samples, measured as before, showed that the luminescence intensity gradually increased with the increase in incubation time and reached saturation within 30 min (Fig. 2e). No such enhancement in the luminescence intensity was observed in a control experiment without fluoride.HPLC analysis was done to provide evidence for the fluoride-triggered desilylation mechanism (Fig. 2e, inset), enabling luminescence enhancement by releasing sensitizer moiety 1. Compounds 1 and 2 appeared in the HPLC chromatogram at retention times (tR) of 8.1 min and 26.6 min, respectively. The release of sensitizer 1 was observed by HPLC of preincubated fluoride-treated 2-doped buffer solution. The HPLC peak area of 2 decreased with incubation time, whereas that of 1 increased (Fig. 2f). The luminescence intensity and HPLC peak area of released 1 as a function of incubation time showed a correlation (Fig. S8†). Therefore, the HPLC data provide the validation of our protocol for the detection of fluoride ions.
3.4. Selectivity of pro-sensitizer 2 towards fluoride ions
In real-life applications, the selectivity of the probe towards the analyte ensures the accuracy of the results. Herein, competitive experiments were carried out to study the interference of other common ions on pro-sensitizer 2. Compound 2-doped buffer was treated with other potential interfering ions to check its selectivity towards fluoride ions. Fig. 3a clearly shows that even a 7-fold higher concentration of other anions, including halides (Cl–, Br–, I–), did not release sensitizer 1. Thus, pro-sensitizer 2 exhibited the selective detection of fluoride ions even in the presence of mixtures of other interfering anions (Fig. 3b).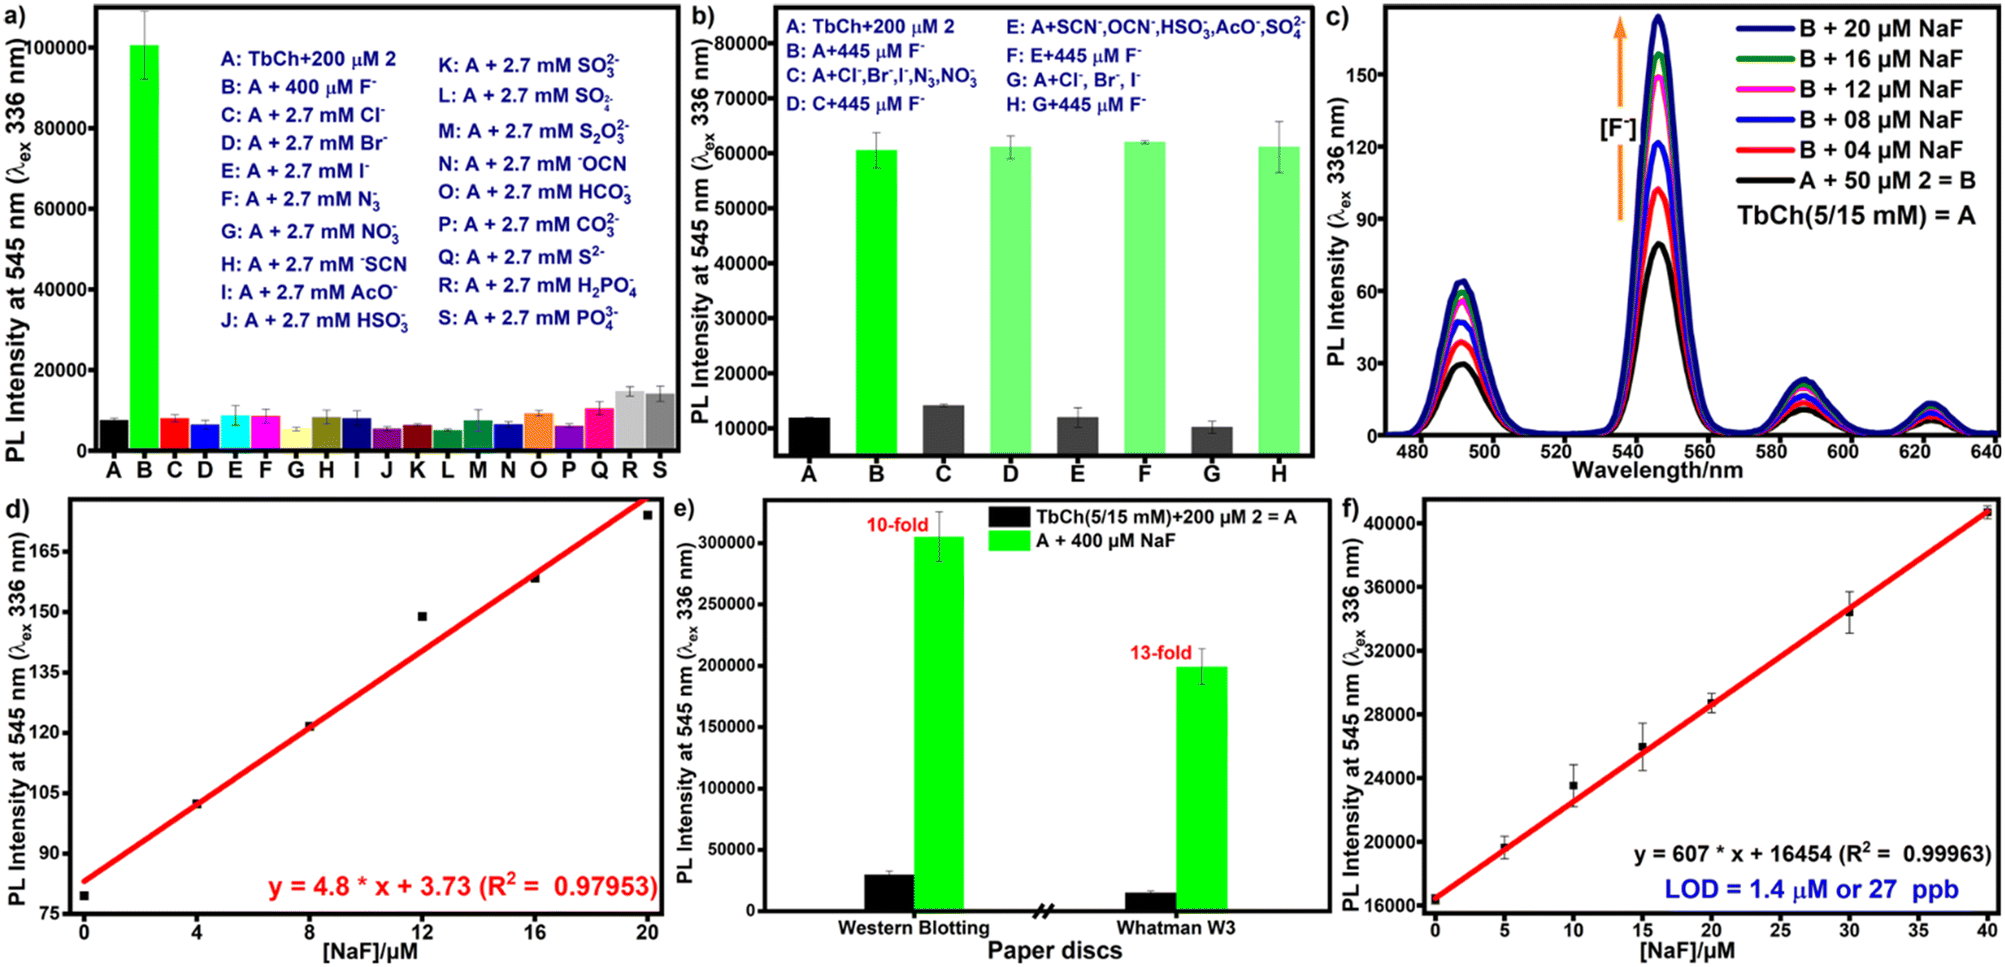 | ||
| Fig. 3 a) PL intensity of analyte/interferent-treated 2 (200 μM)-doped TbCh gels and b) PL intensity of analyte/interferent mixture (445 μM each)-treated 2 (200 μM)-doped TbCh gels. c) PL spectra of the 2-doped and fluoride-treated 2-doped TbCh gels. d) PL intensity of the TbCh gels with increasing fluoride concentration. e) PL intensity of TbCh gel-coated western blotting and Whatman W3 paper discs. f) PL intensity of fluoride (0 – 40 μM)-treated 2-doped TbCh gel-coated Whatman W3 paper discs. | ||
3.5. Sensitivity of the detection protocol
The protocol involves a bimolecular desilylation reaction between pro-sensitizer 2 and fluoride ions, generating sensitizer 1. Therefore, compound 2 must show a wide range of linear luminescence enhancement with increased fluoride concentrations. We chose the concentration range from 0–20 μM fluoride ions with a fixed concentration (50 μM) of 2 for the determination of the LOD of the system.Under the optimized conditions, solutions of fluoride-treated 2 in buffer (300 μL) with increasing fluoride concentration were incubated at 35 °C for 30 min, followed by the preparation of the gel by the addition of aqueous terbium nitrate as mentioned earlier. The PL spectra of Tb3+ were recorded for these gels (Fig. 3c), which showed a linear increase with increasing fluoride concentration (Fig. 3d). The LOD value was calculated using the standard formula from the linear fit graph of three identical experiments and was found to be 2.5 ± 0.2 μM (see the calculations in the ESI†).
3.6. Ease-of-detection: development of the paper-based protocol
Paper-based detection protocols present a promising analytical approach, providing a simple and cost-effective sensing platform.43 We used Whatman W3 filter and western blotting paper discs with 0.45 cm diameter on which 20 μL of TbCh gels prepared from the preincubated samples of 2-doped and fluoride-treated 2-doped NaCh solutions were drop-cast. The gel-coated paper discs were air-dried for 10 min before measuring the time-delayed emission intensities using a plate reader. Paper immobilizes the gel fibers on the surface by absorbing excess water from the gels, facilitating decreased luminescence quenching caused by water molecules and enhancing luminescence output, improving sensitivity. The luminescence enhancement for the gel-coated Whatman W3 paper discs was higher than that of the western blotting paper discs (Fig. 3e), and thus, Whatman W3 paper discs were used for subsequent paper-based assays.The LOD determination was repeated on the paper discs, and the estimated LOD from the linear fit plot (Fig. 3f) was 27 ppb (see the calculations in the ESI†). Since the green luminescence output was visible from the naked eye under UV light (330 nm), we used ImageJ software to analyze the RGB images (Fig. 4a) and calculate the green color intensity, which showed a correlation with the fluoride concentration. Also, the LOD calculated from the linear fit ImageJ data (Fig. 4b) was 28 ppb, which was well below the limit stipulated by the WHO.
 | ||
| Fig. 4 a) Photographs of gel-coated paper discs under 330 nm UV light. b) Variation of green color intensity with the fluoride concentration. | ||
It is important to note that the sensing performance of our protocol, such as the assay time, linear range, and LOD, is better than or comparable to those of the other recently reported protocols (Table S1†) because most of the reported methods have used organic solvents as media or compromised with low LODs. Therefore, our protocol is simple and sensitive for selectively detecting fluoride ions (Table 1).
| S. No. | Parameters | Advantages/limitations |
|---|---|---|
| 1. | Material/probe synthesis | The new method utilizes commercial materials and straightforward one-step synthesis of 2, unlike existing methods requiring tedious synthesis15 |
| 2. | Solvent system | Most of the existing methods use organic solvents as media,3,14,44 but we have used aqueous buffer with only 20% DMSO |
| 3. | Assay time | Except for a few (<10 min),3,44 the existing methods have longer response times (>1 h),14,15 whereas our method showed a response time of 30 min |
| 4. | Media/support | The existing methods use solution media,27 whereas we have used a gel-based assay on a paper support for easing the detection |
| 5. | Readout data | Unlike the existing fluorescence-based methods,3,14,15 the output of our method is time-delayed emission (phosphorescence mode), overcoming autofluorescence |
| 6. | Detection limit | Some of the methods have low detection limits (sub-ppb)27 compared to our method and other reported methods (sub-ppm)15 |
| 7. | Cost/instrument | The cost can be reduced by analyzing RGB images (capturing the gel-coated paper discs with a mobile camera) using ImageJ software without any costly instruments |
3.7. Robustness of the protocol
Upon comparing the AFM images (Fig. 5a), we observed that the crosslinked fibrous morphology with an average diameter of 72 nm for 2 (200 μM)-doped TbCh (5/15 mM) gel was intact (73 nm) even for fluoride (200 μM)-treated 2 (200 μM)-doped TbCh (5/15 mM) gel. These results suggested the robustness of the lanthanocholate hydrogel morphology, which was unaffected by the analyte.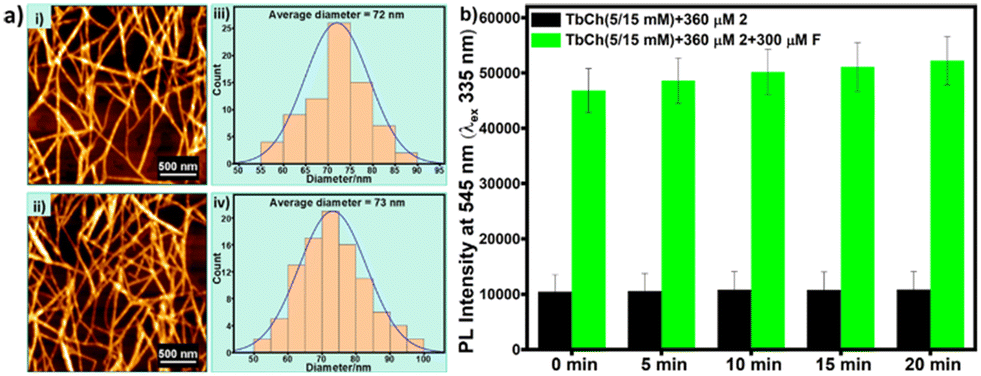 | ||
| Fig. 5 a) AFM images and diameter histograms of 2-doped (i and iii) and fluoride-treated 2-doped (ii and iv) TbCh gels. b) PL intensity of 2-doped and fluoride-treated 2-doped TbCh gels drop-cast on a 96-well microplate with time. | ||
Additionally, when the prepared gels were drop-cast on the 96-well microwell plate (black), stable photoluminescence intensity was observed for at least 20 min. A very slight increment observed is possibly due to the drying effect of the gel (Fig. 5b).
3.8. Application in real-life sample analysis
We tested several groundwater samples obtained from various regions of India and a fluoride-containing toothpaste to verify the applicability to real-life samples. The groundwater samples were filtered through 0.2 μm membrane syringe filters, and the pH was adjusted to 6.5 using 0.1 N HCl. These water samples and prepared toothpaste solution (dilute) were used for the analysis without further processing.From the emission intensities, the fluoride concentration of each sample was calculated (Table 2). A few representative water samples were analyzed by the standard ISE method. Table 3 provides data that validate our protocol.
| S. No. | Water samples (regions in India) | [F−]/ppm |
|---|---|---|
| 1. | Well water (Bankura, WB, India) | 0.83 |
| 2. | Tap water supply (Ajmer, RJ, India) | 0.43 |
| 3. | Tube well water (Ajmer, RJ, India) | 2.44 |
| 4. | Well #1 water (Ajmer, RJ, India) | 2.49 |
| 5. | Well #2 water (Ajmer, RJ, India) | 2.41 |
| 6. | Handpump water (Baran, RJ, India) | 1.42 |
| 7. | Borewell water (Baran, RJ, India) | 1.00 |
| S. N. | Fluoride-containing water samples | [F−]/ppm (our method) | [F−]/ppm (ISE) |
|---|---|---|---|
| 1. | Parvati River (Baran, RJ, India) | 1.43 | 1.24 |
| 2. | Stepwell (Baran, RJ, India) | 1.24 | 0.94 |
| 3. | Stepwell (Bankura, WB, India) | 0.81 | 0.81 |
A spike and recovery test was done to evaluate the general performance of the analytical applicability of the protocol. Three fluoride-containing solutions (toothpaste, river water from Baran, Rajasthan, and 10 μM NaF solution) were split into two portions. One portion of these samples was spiked with 10 μM NaF solution, while the other was unspiked. Then, the paper-based fluoride detection experiment was performed using both unspiked and spiked samples, following the procedure described earlier.
The fluoride concentrations were calculated using the calibration equation from their PL intensity values (Fig. S10†). These samples showed a recovery percentage within the acceptable analytical range of 80–120%, suggesting the acceptance of possible systematic error due to the sample matrix (Table 4).
| S. N. | Fluoride-containing samples | [F−]unspiked (ppm) | [F−]spiked (ppm) | Recovery |
|---|---|---|---|---|
| 1. | River water (Baran, RJ) | 0.078 | 0.289 | 111% |
| 2. | 10 μM NaF solution | 0.186 | 0.386 | 105% |
| 3. | Toothpaste solution | 1.397 | 1.615 | 115% |
4. Conclusions
In conclusion, we have developed an inexpensive “turn-on” Tb3+ luminescence-based protocol for fluoride detection well below its permissible limit. The developed protocol involved the fluoride-triggered desilylation of 2, releasing sensitizer 1 for intensification of Tb3+ luminescence in the TbCh gel matrix through a noncovalent approach, which did not require tedious, complex synthesis. Furthermore, the protocol exhibited excellent selectivity and a low detection limit with high accuracy. Moreover, immobilizing gels on paper discs provided an easy-to-handle and cost-effective platform for the naked-eye detection of fluoride ions under a UV lamp without any sophisticated instrument. The protocol was implemented to detect fluoride ions from groundwater and toothpaste samples to demonstrate the practical utility. The promising results suggested the method's potential to be used for the quality check of drinking water and groundwater in limited-resource areas. In further advancements, the sensitivity of the protocol could be improved by the modification of the pro-sensitizer, lowering the background emission of the control. We hope that our results would promote the development of sensitive and selective systems for detecting other small molecules/anions.Author contributions
All authors have read and given approval to the final version of the manuscript.Conflicts of interest
There are no conflicts to declare.Acknowledgements
The Science and Engineering Research Board (SERB), India, supported the work through grant# CRG/2020/001140. UM also thanks the SERB for the award of a J. C. Bose fellowship (SR/S2/JCB-68/2007). PKC thanks the Council of Scientific & Industrial Research (CSIR), the Ministry of Science and Technology (Govt. of India), and the Ministry of Education (Govt. of India) for the awards of JRF and PMRF research fellowships. PKC also thanks Divy Meena (Dept. of Organic Chemistry, IISc, Bangalore) for his generous help in arranging the water samples. We also thank Manish Sharma (Materials Research Center, MNIT, Jaipur) and Prof. Ragini Gupta (Dept. of Chemistry, MNIT, Jaipur) for the ISE measurements.Notes and references
- R. M. Duke, E. B. Veale, F. M. Pfeffer, P. E. Kruger and T. Gunnlaugsson, Chem. Soc. Rev., 2010, 39, 3936–3953 RSC.
- P. D. Beer and P. A. Gale, Angew. Chem., Int. Ed., 2001, 40, 486–516 CrossRef CAS PubMed.
- A. Roy, D. Kand, T. Saha and P. Talukdar, Chem. Commun., 2014, 50, 5510–5513 RSC.
- L. Zhang, X. Gao, X. Chen, M. Zhao, H. Wu and Y. Liu, Anal. Bioanal. Chem., 2022, 414, 3999–4009 CrossRef CAS PubMed.
- J. D. B. Featherstone, Community Dent. Oral Epidemiol., 1999, 27, 31–40 CrossRef CAS PubMed.
- S. Y. Kim and J.-I. Hong, Org. Lett., 2007, 9, 3109–3112 CrossRef CAS PubMed.
- X. C. Yu, J. W. Chen, Y. G. Li, H. L. Liu, C. C. Hou, Q. Zeng, Y. Cui, L. Zhao, P. Li, Z. Zhou, S. Pang, S. Tang, K. M. Tian, Q. Zhao, L. Dong, C. Y. Xu, X. Zhang, S. Zhang, L. Liu and A. Wang, Environ. Int., 2018, 118, 116–124 CrossRef CAS PubMed.
- Y. S. Solanki, M. Agarwal, A. B. Gupta, S. Gupta and P. Shukla, Sci. Total Environ., 2022, 807, 150601 CrossRef CAS PubMed.
- M. X. Mu, X. Ke, W. Cheng, J. Li, C. D. Ji and M. Z. Yin, Anal. Chem., 2022, 94, 11470–11475 CrossRef CAS PubMed.
- S. Ali, S. K. Thakur, A. Sarkar and S. Shekhar, Environ. Chem. Lett., 2016, 14, 291–315 CrossRef CAS.
- R. Michalski, Crit. Rev. Anal. Chem., 2006, 36, 107–127 CrossRef CAS; H. Yahyavi, M. Kaykhaii and M. Mirmoghaddam, Crit. Rev. Anal. Chem., 2016, 46, 106–121 CrossRef PubMed.
- A.-P. Chiriac, I. Butnaru and M.-D. Damaceanu, Electrochim. Acta, 2020, 353, 136602 CrossRef CAS.
- Y. Wu, S. Liu and J. Zhao, J. Photochem. Photobiol., A, 2022, 425, 113728 CrossRef CAS.
- Y.-T. Zeng, S.-Y. Gao, K. Traskovskis, B. Gao and X.-K. Ren, Dyes Pigm., 2021, 193, 109491 CrossRef CAS.
- Y. Lin, K. Du, M. R. Gau and I. J. Dmochowski, Chem. Sci., 2023, 14, 291–297 RSC.
- S. Dhiman, M. Ahmad, N. Singla, G. Kumar, P. Singh, V. Luxami, N. Kaur and S. Kumar, Coord. Chem. Rev., 2020, 405, 213138 CrossRef CAS.
- S. Guha and S. Saha, J. Am. Chem. Soc., 2010, 132, 17674–17677 CrossRef CAS PubMed.
- B. Chowdhury, S. Sinha, R. Dutta, S. Mondal, S. Karmakar and P. Ghosh, Inorg. Chem., 2020, 59, 13371–13382 CrossRef CAS PubMed.
- Y. Kubo, M. Yamamoto, M. Ikeda, M. Takeuchi, S. Shinkai, S. Yamaguchi and K. Tamao, Angew. Chem., Int. Ed., 2003, 42, 2036–2040 CrossRef CAS PubMed.
- J. Wang, Y. Zhang, Q. Lin, Q. Huang and Y. Liu, J. Mol. Struct., 2022, 1257, 132537 CrossRef CAS.
- L. Li, Y. Zhang, Y. Li, Y. Duan, Y. Qian, P. Zhang, Q. Guo and J. Ding, ACS Sens., 2020, 5, 3465–3473 CrossRef CAS PubMed.
- A. S. Hussein, F. Lafzi, S. Bayindir and M. Toprak, J. Photochem. Photobiol., A, 2023, 438, 114574 CrossRef.
- N. Ahmed, W. Zareen, Z. Shafiq, S. F. de Alcântara Morais, M. Khalid, A. A. Carmo Braga, K. S. Munawar and Y. Yong, Spectrochim. Acta, Part A, 2023, 286, 121964 CrossRef CAS PubMed.
- E. Galbraith, T. M. Fyles, F. Marken, M. G. Davidson and T. D. James, Inorg. Chem., 2008, 47, 6236–6244 CrossRef CAS PubMed.
- T.-H. Kim and T. M. Swager, Angew. Chem., Int. Ed., 2003, 42, 4803–4806 CrossRef CAS PubMed.
- V. Bernard-Gauthier, C. Wängler, E. Schirrmacher, A. Kostikov, K. Jurkschat, B. Wängler and R. Schirrmacher, BioMed Res. Int., 2014, 2014, 454503 Search PubMed.
- Q. Wang, D. Li, N. Rao, Y. Zhang, Y. Le, L. Liu, L. Huang and L. Yan, Dyes Pigm., 2021, 188, 109166 CrossRef CAS; I. Ortiz-Gómez, S. González-Alfaro, A. Sánchez-Ruiz, I. de Orbe-Payá, L. F. Capitán-Vallvey, A. Amparo Navarro, A. Salinas-Castillo and J. C. García-Martínez, ACS Sens., 2022, 7, 37–43 CrossRef PubMed; D. Li, S. Tu, Y. Le, Y. Zhou, L. Yang, Y. Ding, L. Huang and L. Liu, Spectrochim. Acta, Part A, 2023, 285, 121816 CrossRef PubMed.
- P. Chen, W. Bai and Y. Bao, J. Mater. Chem. C, 2019, 7, 11731–11746 RSC.
- J.-C. G. Bünzli, Acc. Chem. Res., 2006, 39, 53–61 CrossRef PubMed.
- T. Liu, A. Nonat, M. Beyler, M. Regueiro-Figueroa, K. N. Nono, O. Jeannin, F. Camerel, F. Debaene, S. Cianfèrani-Sanglier, R. Tripier, C. Platas-Iglesias and L. J. Charbonnière, Angew. Chem., Int. Ed., 2014, 53, 7259–7263 CrossRef CAS PubMed; J. S. Butler, Chem. Commun., 2015, 51, 10879–10882 RSC; M. L. Aulsebrook, B. Graham, M. R. Grace and K. L. Tuck, Coord. Chem. Rev., 2018, 375, 191–220 CrossRef.
- H.-Y. Zheng, X. Lian, S.-J. Qin and B. Yan, ACS Omega, 2018, 3, 12513–12519 CrossRef CAS PubMed.
- X. Zeng, J. Hu, M. Zhang, F. Wang, L. Wu and X. Hou, Anal. Chem., 2020, 92, 2097–2102 CrossRef CAS PubMed.
- H. Xie, Z. Chen, X. Wei, Q. Han, H. Wang, X. Yang, S. Xu and X. Wang, Sens. Actuators, B, 2022, 366, 131975 CrossRef CAS.
- X. Pang, T. Yu, F. Shen, X. Yu and X. Li, J. Lumin., 2018, 204, 169–175 CrossRef CAS.
- S. Bhowmik, S. Banerjee and U. Maitra, Chem. Commun., 2010, 46, 8642–8644 RSC; S. Banerjee, R. Kandanelli, S. Bhowmik and U. Maitra, Soft Matter, 2011, 7, 8207–8215 RSC; T. Gorai and U. Maitra, Angew. Chem., Int. Ed., 2017, 56, 10730–10734 CrossRef CAS PubMed.
- R. Laishram and U. Maitra, Asian J. Org. Chem., 2017, 6, 1235–1239 CrossRef CAS.
- T. Gorai, S. Sakthivel and U. Maitra, Chem. – Asian J., 2020, 15, 4023–4027 CrossRef CAS PubMed.
- A. Biswas and U. Maitra, RSC Adv., 2022, 12, 26106–26110 RSC.
- S. Bhowmik and U. Maitra, Chem. Commun., 2012, 48, 4624–4626 RSC; T. Gorai and U. Maitra, ACS Sens., 2016, 1, 934–940 CrossRef CAS; T. Gorai and U. Maitra, J. Mater. Chem. B, 2018, 6, 2143–2150 RSC.
- D. Bhowmik, A. Dutta and U. Maitra, Chem. Commun., 2020, 56, 12061–12064 RSC; A. Dutta and U. Maitra, ACS Sens., 2022, 7, 513–522 CrossRef CAS PubMed.
- E. J. Corey and A. Venkateswarlu, J. Am. Chem. Soc., 1972, 94, 6190–6191 CrossRef CAS.
- (5/15 mM) refers to the final concentrations of Tb3+ and cholate in gels in mM.
- Z. Yao, P. Coatsworth, X. Shi, J. Zhi, L. Hu, R. Yan, F. Güder and H.-D. Yu, Sens. Diagn., 2022, 1, 312–342 RSC.
- X. Wu, H. Wang, S. Yang, H. Tian, Y. Liu and B. Sun, ACS Omega, 2019, 4, 4918–4926 CrossRef CAS PubMed.
Footnote |
| † Electronic supplementary information (ESI) available. See DOI: https://doi.org/10.1039/d4sd00078a |
| This journal is © The Royal Society of Chemistry 2024 |