 Open Access Article
An approach to use machine learning to optimize paper immunoassays for SARS-CoV-2 IgG and IgM antibodies†
Josselyn
Mata Calidonio
a and
Kimberly
Hamad-Schifferli
 *ab
*ab
aDept. of Engineering, University of Massachusetts Boston, Boston, MA 02125, USA. E-mail: kim.hamad@umb.edu
bSchool for the Environment, University of Massachusetts Boston, Boston, MA 02125, USA
First published on 15th March 2024
Abstract
Optimizing paper immunoassay conditions for diagnostic accuracy is often achieved by tuning running conditions in a trial and error manner. We developed an approach to use machine learning (ML) in the optimization process, demonstrating it on a COVID-19 assay to detect IgG and IgM antibodies for both SARS CoV-2 spike and nucleocapsid proteins. The multiplexed test had a multicolor readout by using red and blue gold nanoparticles. Spike and nucleocapsid proteins were immobilized on a nitrocellulose strip at different locations, and the assay was run with red nanoparticles conjugated to anti-IgG and blue nanostars conjugated to anti-IgM. The spatial location of the signal indicated whether the antibody present was anti-spike or anti-nucleocapsid, and the test area color indicated the antibody type (IgG vs. IgM). Linear discriminant analysis (LDA) and ML were used to evaluate the test accuracy, and then used iteratively to modify running conditions (presence of quencher molecules, nanoparticle types, washes) until the test accuracy reached 100%. The resulting assay could be trained to distinguish between 9 different antibody profiles indicative of different disease cases (prior infection vs. vaccinated, early/mid/late stage post infection). Results show that supervised learning can accelerate test development, and that using the test as a selective array rather than a specific sensor could enable rapid immunoassays to obtain more complex information.
Introduction
Paper tests are ideal as diagnostics for infectious diseases because they are low cost, easy to use, and robust. Lateral flow immunoassays (LFAs) have proven to be critical diagnostic tools because they can be operated at point of care, thus removing the need for sample transport or travel to centralized labs.1 LFAs rely on affinity agents specific for the target such as antibodies, which are conjugated to gold nanoparticles (NPs) and immobilized on a paper strip. A fluid sample is wicked through the strip, and if the target is present, it binds to both of these antibodies, accumulating NPs at the test line which produces a visible color. Access to diagnostics can facilitate the reopening of society after pandemics, as citizens can self-test and determine whether to isolate or not.However, rapid diagnostic production possesses major bottlenecks that inhibit rapid response. With each new disease, an entirely new LFA must be developed for a corresponding target,2 requiring production of specific antibodies. The process of developing new antibodies can take 1–2 years and cost hundreds of millions of dollars.3 Moreover, every diagnostic has its own required sensitivity, time window, and biological fluids which cause different matrix effects with their own requisite sample preparation protocols. LFAs and paper immunoassays are tedious to optimize, where multiple parameters spanning the physical, chemical, and biological properties all must be systematically varied to arrive at conditions where a test can detect the target at a biologically relevant level, while also exhibiting no signal in its absence. The chemical and physical parameters are diverse, including the materials for the strips, absorbent pads, conjugate pads, chemical stabilizers and passivators, paper blocking agents, reagent concentrations, timing of reagent addition, and chemical strip dimensions.4 Another complicating factor is that the gold NPs responsible for the signal can suffer from nano-bio interface effects in commonly used biological fluids like blood and saliva, which have protein concentrations of ∼60–80 mg mL−1 and millimolar ionic concentrations.5,6 These conditions are ripe for non-specific adsorption, protein corona formation, and NP precipitation,7 which can ultimately cause both false positives and false negatives, confounding test results.8–10 Optimization of the nano-bio interface requires varying the NP synthesis protocol, surfactant types, and bioconjugation chemistries.
To accelerate the development process and accessibility to what is anticipated to be a $12.6B market in the US in 2026,11 there are several companies devoted to finding optimal conditions for LFA fabrication. However, these training courses and consulting services can cost several thousands of dollars. While there are some general guides on LFA construction in the literature, it is impossible to predict precipitation and undesirable surface effects, so ultimately one simply varies all of the parameters in an ad hoc manner to determine which are relevant. This represents a major bottleneck in LFA development, which is eventually borne out as delayed response times.
There is an opportunity in machine learning (ML), which has been demonstrated to be a powerful tool in creating molecules and materials. It can explore large areas of synthesis space efficiently, and thus has been used successfully to fabricate molecules with desired properties without prior knowledge of the required conditions, and can arrive at solutions that a human normally would not be able to access.12 ML has been extensively explored for fully automated systems, where autonomously completing the feedback loop yields an efficient synthesis engine. Consequently, the benefits of ML have been demonstrated mostly in fabrication/synthesis approaches that are high throughput systems, and only in a single phase, especially an entirely solution phase synthesis that can leverage liquid handling robotics.
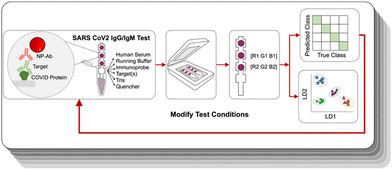
Here, we show that an ML-assisted process can be used to optimize the test parameters for making a viable paper immunoassay. We demonstrated it on an antibody test for IgG and IgM of COVID-19 designed for antibody profiling different immunity states. The multiplexed assay leveraged gold NPs of two different colors, where identification of the target relied on not only the presence of a signal at a given location, but also their color. We optimized the assay properties by performing ML in an iterative loop (Fig. 1) to arrive at test conditions that could accurately distinguish a subset of antibodies. The system was trained using linear discriminant analysis (LDA), and the ML-assisted approach could reach a test accuracy of 100%. Then, we use ML to train the optimized test to distinguish 9 distinct antibody profiles representative of different disease histories, with the ability to discriminate between vaccinated and infected profiles.
Materials and methods
Reagents
Gold chloride trihydrate (CAS 16961-25-4), N-(2-hydroxyethyl)piperazine-N′-(2-ethanesulfonic acid) (HEPES) (CAS 7365-45-9), bis(sulphatophenyl)phenylphosphine dehydrate (BPS) (CAS 308103-66-4), sodium citrate tribasic trihydrate (CAS 6132-04-3), Tween 20 (CAS 9005-64-5), and sucrose (CAS 57-50-1) were all purchased from Sigma-Aldrich. Phosphate buffered saline (PBS) was purchased from Fisher Scientific, and Tris-buffered saline (TBS) (10X, pH 7.4) from Boston BioProducts. Thiolated mPEG (5 kDa) was purchased from Nanocs. Casein hydrolysate was purchased from Sigma.For the biological reagents, goat anti-human IgM (αIgM), rabbit anti-goat IgG Fc, and human serum were purchased from Sigma-Aldrich. Goat anti-human IgG (αIgG) was purchased from Abcam. The spike (S) protein and human αS IgG were purchased from Native Antigen. Nucleocapsid (N) protein was purchased from Sino Biological. Human αS IgM, human αN IgG, and human αN IgM were purchased from Genscript. Gold NPs with a functional group for covalent attachment to amines were obtained commercially as a kit (Innova, Abcam).
NP synthesis and conjugation
Blue colored gold NPs were synthesized using literature methods.13,14 Gold nanostars (GNSs) were synthesized to yield blue-colored nanoparticles. Antibody conjugation was achieved by physisorbing αIgM to GNSs. Synthesized GNSs were pelleted by centrifuging at 3381g for 12 min. The supernatant was removed, and the pellet was resuspended in 140 mM HEPES at pH 7.48. αIgM antibodies (20 μg) were added to the solution and left to incubate for 60 min at room temperature. Following this, thiolated polyethylene glycol (PEG-SH) was added (5 × 10⁻¹⁰ mol) to the solution and was allowed to mix with GNS–αIgM for 10 min. Finally, the PEGylated GNS–αIgM was centrifuged at 2348g for 10 min, and free PEG-SH and αIgM in the supernatant were discarded. The pellet was resuspended in ∼100 μL 0.01 M PBS buffer.Red-colored gold NPs were synthesized using a double boiling technique. A 600 mL beaker was filled with 275 mL diH2O and placed on top of a magnetic mixer. A 100 mL uncapped glass bottle containing 49.5 mL of 18 MΩ Milli-Q water and a magnetic stir bar were placed inside the beaker. The temperature was increased to allow the water to boil. Once boiling, the stirring setting was set to low, followed by addition of 500 μL of 25 mM HAuCl4·3H2O. The solution was left to stir for 10 min. Afterward, 500 μL of 34.1 mM sodium citrate dihydrate was added, which initiated NP formation and changed the solution color to red. After 10 min, the temperature and stir settings were turned off and the solution was left to cool for 30 min. Finally, ∼6.5 mg of BPS was added.
Prior to the formation of the NP–Ab conjugate, 1 mL of red NPs were centrifuged at 12![[thin space (1/6-em)]](https://www.rsc.org/images/entities/char_2009.gif) 312g for 12 min to remove excess reagents. After removing the supernatant, the NP pellet was resuspended in a solution of 140 mM HEPES (pH 7.48) and αIgG (10 μg) and left for incubation on an orbital shaker for 60 min. A PEG backfill was conducted by adding PEG-SH (1 × 10⁻⁹ mol) and incubating for 20 min on an orbital shaker. Lastly, the NP–Ab complex was centrifuged at 7607g for 12 min and resuspended in 50 μL of 0.01 M PBS buffer.
312g for 12 min to remove excess reagents. After removing the supernatant, the NP pellet was resuspended in a solution of 140 mM HEPES (pH 7.48) and αIgG (10 μg) and left for incubation on an orbital shaker for 60 min. A PEG backfill was conducted by adding PEG-SH (1 × 10⁻⁹ mol) and incubating for 20 min on an orbital shaker. Lastly, the NP–Ab complex was centrifuged at 7607g for 12 min and resuspended in 50 μL of 0.01 M PBS buffer.
Conjugation to αIgG to the commercial NPs was achieved following the procedure outlined by the commercial supplier in the kit.
Optical absorption spectroscopy was performed on a Spectramax Molecular Devices plate reader in 1 cm cuvettes. The hydrodynamic diameters (DH) of the NPs and NP conjugates were obtained on a nanoparticle analyzer (SZ-100, HORIBA Scientific).
Immunoassays
Dipstick immunoassays15–17 were constructed of laser cut plastic backed nitrocellulose (3 mm × 25 mm, Sartorius, Unistart CN140), which had a capillary specific speed of 95–155 s per 40 mm and a thickness of 225–255 μm. An absorbent pad (7.2 mm × 65 mm) (Sigma Aldrich, GB003 Gel Blot paper) was attached to the top to act as a fluid sink using an adhesive backing (DCN Dx, MIBA-050). For the control area, 0.4 μg of anti-Fc IgG antibodies were spotted onto position 4 of the nitrocellulose. For the test lines, 0.27 μg of S and 0.2 μg of N protein were spotted onto the nitrocellulose at position 3 and 2, respectively. Strips were run in triplicate for each of the 9 cases. Once the spotted strips were completely dry, they underwent four different steps to run test solutions. First, strips were placed in individual tubes containing 30 μL human serum, 16 μL of running buffer (50% sucrose: 1% Tween 20, 1![[thin space (1/6-em)]](https://www.rsc.org/images/entities/char_2009.gif) :
:![[thin space (1/6-em)]](https://www.rsc.org/images/entities/char_2009.gif) 1 ratio), 3 μL of GNS–αIgM, and the target(s) (αS IgG, αS IgM, αN IgG, and/or αN IgM). The fluid was allowed to wick to the absorbent pad via capillary forces. The running times per solution were approximately 20–30 minutes. The strips were then washed by placing them in tubes containing 25 μL of 1% casein solution. Then, the strips were placed in a solution containing 30 μL of human serum, 16 μL of running buffer, and 2 μL of the NP–αIgG conjugate. Finally, the strips were placed in 25 μL of 1% casein for a post-wash and allowed to completely dry before image analysis.
1 ratio), 3 μL of GNS–αIgM, and the target(s) (αS IgG, αS IgM, αN IgG, and/or αN IgM). The fluid was allowed to wick to the absorbent pad via capillary forces. The running times per solution were approximately 20–30 minutes. The strips were then washed by placing them in tubes containing 25 μL of 1% casein solution. Then, the strips were placed in a solution containing 30 μL of human serum, 16 μL of running buffer, and 2 μL of the NP–αIgG conjugate. Finally, the strips were placed in 25 μL of 1% casein for a post-wash and allowed to completely dry before image analysis.
Image analysis
Strip images were obtained on a desktop scanner.18 ImageJ19 was used to obtain RGB intensities (8-bit) of test areas. The RGB intensities of the S and N areas above the background of the nitrocellulose were obtained by subtracting the RGB intensity of a blank area (position 1).Machine learning
MATLAB (version R2023a) was used for ML. The Classification Learner app within MATLAB was used for the generation of the training algorithm. The RGB intensities for the S and N test spots were the input data for training the model, giving rise to a total of 6 training features (IR, IG, and IB for both the S and N spots). The total number of training examples was equal to the number of classes per trial times 3, since the strips per class were run in triplicate. The supervised multi-class classification model used for training was linear discriminant analysis (LDA). LDA is a statistical method most commonly used for classification and dimensionality reduction. It aims to maximize the separability between the classes while minimizing the variation within each class. To better evaluate the model, a 10-fold cross-validation was performed, for which ∼7–11% of the data was used at the validation set. A test set was not defined given the small size of the sample set. The validation accuracy was dependent on the correct and incorrect predictions from LDA, which can be visualized on a confusion matrix. Since LDA is also a dimensionality reduction technique, it enabled visualization of the best separation of classes via clustering in 2D LDA plots. Scripts were run in Matlab and are supplied as files in the ESI.†Pseudocolor/stain vectors
Color deconvolution was implemented to improve the accuracy of the LDA model. The color information of the S and N spots was deconvolved based on the color information of the immunoprobes (i.e., the stains). First, the red NP–αIgG and blue GNS–αIgM conjugates were directly spotted on nitrocellulose and left to completely dry before performing image analysis. Through the Color Deconvolution 2 plugin on ImageJ,20 stain vectors S1, S2, and S3 were defined based on the optical density for each RGB channel of the red NP–αIgG spot (S1), blue GNS–αIgM spot (S2), and the cross product of both (S3). The three stain vectors were placed together to form the stain vector matrix. The inverse of the stain vector matrix was then used to find the amount of the three stains at the test spots. The deconvoluted values were used as the new input data for LDA.Receiver operating characteristic (ROC) analysis
Receiver operating characteristic (ROC) analysis was performed to show the performance of the LDA model at all classification thresholds. Given that the model represents a multi-class classification system, a one-vs.-rest scheme was implemented to compare each class against all others, resulting in 9 ROC curves. The area under the curve (AUC) value was computed to measure how well predictions are ranked.Results and discussion
Rationale of the immunoassay architecture
Serological tests are used to determine which antibodies a patient has, and yield information on history of exposure to a virus or vaccination. They are important tools for disease surveillance, as they permit individuals to determine whether or not they have antibodies against a particular antigenic species, thereby assessing their protection against that disease. Existing commercial tests for COVID-19 antibodies are designed to detect only the presence of SARS-CoV-2 antibodies. However, the ability to discriminate which antibodies are present can yield much more useful information. First, it can enable one to distinguish between previously vaccinated patients and those who have been infected. mRNA vaccines such as those produced by Moderna and Pfizer use only S protein as the challenging antigen, and not N protein, so uninfected, vaccinated patients will possess only αS antibodies and not αN ones. On the other hand, if a patient has had a prior SARS-CoV-2 infection, their immune response will have developed antibodies for all of the proteins in the SARS-CoV-2 virus (S, N, and also envelope and membrane proteins). Thus, the ability to discriminate between vaccinated and infected is possible if a test can distinguish between αS and αN antibodies. The other information that can be obtained from an antibody profile is how long ago an infection was. In an immune response, IgG and IgM antibodies are produced at different time points post infection, where IgM antibodies are produced first, then IgG (Fig. 2a). Thus, distinguishing between IgG and IgM antibodies enables determination of how far a patient is in the disease progression. Consequently, we aimed to produce an assay that could recognize four different targets: αS IgG, αS IgM, αN IgG, and αN IgM.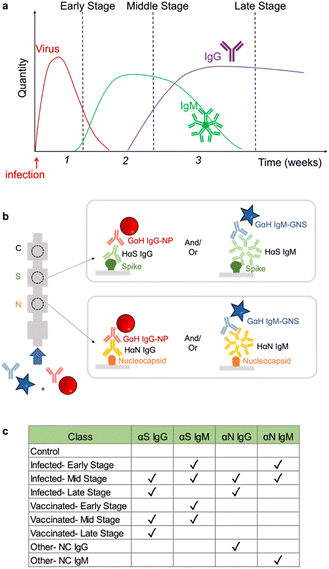 | ||
| Fig. 2 a) Antibody infection profile. b) Architecture of the immunoassay. c) Disease cases investigated. | ||
IgG and IgM tests can be challenging to make because a patient serum has a high concentration of antibodies, where prior exposure to antigens means that a patient can have a wide range of different IgGs and IgMs. Consequently, the test architecture can impact the test signal and ultimately the readout. One possible immunoassay architecture is to immobilize an antibody that binds IgG (αIgG) as a capture agent and use it as a label S conjugated to the NP.21–23 In this case, the αIgG at the test area would capture all the IgGs present in the sample, and then only the α-S antibodies would bind to the NP label. However, patients possess a large number of other IgGs, and this high abundance can result in the hook effect, where the signal decreases at high target concentrations. At high target concentration, both the immobilized capture antibody at the test line and the label antibody on the NP can bind to their own respective targets, reducing the probability of sandwich formation, thus compromising the signal.24,25
To reduce the impact of the hook effect, we chose to use an alternative binding geometry where the capture agents on the paper were immobilized S and N proteins (Fig. 2b). Thus, immobilized S would capture only αS antibodies and N only αN. Then, αIgG and αIgM served as label antibodies, where they are conjugated to the NPs that yield the visual signal. Elimination of the hook effect can also be assisted by running the NP–Ab conjugates in different steps, where the sample is not run at the same time as all of the NP–Ab conjugates. To distinguish which type of antibody is present (IgG vs. IgM), we used NPs of different colors for anti IgG and anti IgM, where αIgG was conjugated to red NPs and αIgM was conjugated to blue ones.
Because the assay targeted 4 different species, this architecture involves 4 different possible sandwiches. Ultimately, a given patient could potentially have a mixture of SARS-CoV-2 antibodies depending on where they are in the disease progression states and whether they have been infected or vaccinated (Fig. 2c). Determination of which antibodies are present was achieved by the combination of the color of the signal and the spatial location. The location distinguishes whether the antibody is αS or αN, and the color of the spot tells which type, so the readout is a pattern of colored signals as opposed to a presence or absence of a signal at a single test area.26
NP synthesis and test construction
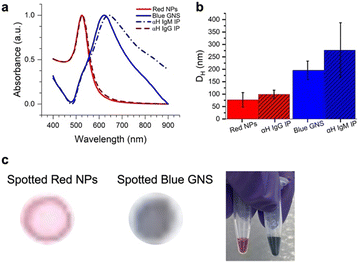
Two different colored NPs were synthesized (Fig. 3). Red NPs were synthesized using citrate reduction of an Au3+ salt.27 To explore the effect of different NP types, we also utilized commercial red NPs with a functional group that can bind to amines on the anti-human IgG (αIgG). Blue star-shaped NPs (gold nanostars, GNSs) were synthesized using literature methods of reducing HAuCl4 with HEPES buffer.13 This resulted in NPs that were blue in color due to arms grown on the nanostar,28 which redshifts the SPR to ∼730 nm.UV-vis of the particle solutions (Fig. 3a) showed that the red NPs had a peak at 526 nm and the GNS at 622 nm due to the surface plasmon resonance (SPR). DLS measured the hydrodynamic diameter (DH) of the particles, where the red NPs had 〈DH〉 = 77.0 ± 29.2 nm, and the blue GNS 〈DH〉 = 195.8 ± 37.2 nm (Fig. 3b, red).
Antibody conjugation to the blue GNS was achieved by physisorption, where the GNS was incubated in solution with the antibodies. DLS of the GNS–Ab exhibited an increase in DH to 277.4 nm (Fig. 3b, blue), confirming successful antibody conjugation. A similar effect was observed for the red NPs, which increased to a DH of 99.2 nm. UV-vis spectra of the red NPs showed minimal spectral changes, indicating that conjugation did not induce significant aggregation. For blue GNS, the SPR exhibited a slight redshift and broadening, indicating that some aggregation occurred upon conjugation. However, GNS–antibody conjugates were still stable in solution and thus still viable for immunoassays.
Finally, the red NPs and blue GNS had visually distinct colors, very different in the RGB space, as evidenced by the color of the solution and were also easy to visually distinguish when dropped on paper, the format in which they would be ultimately read out (Fig. 3c).
ML assisted development on the S protein subset
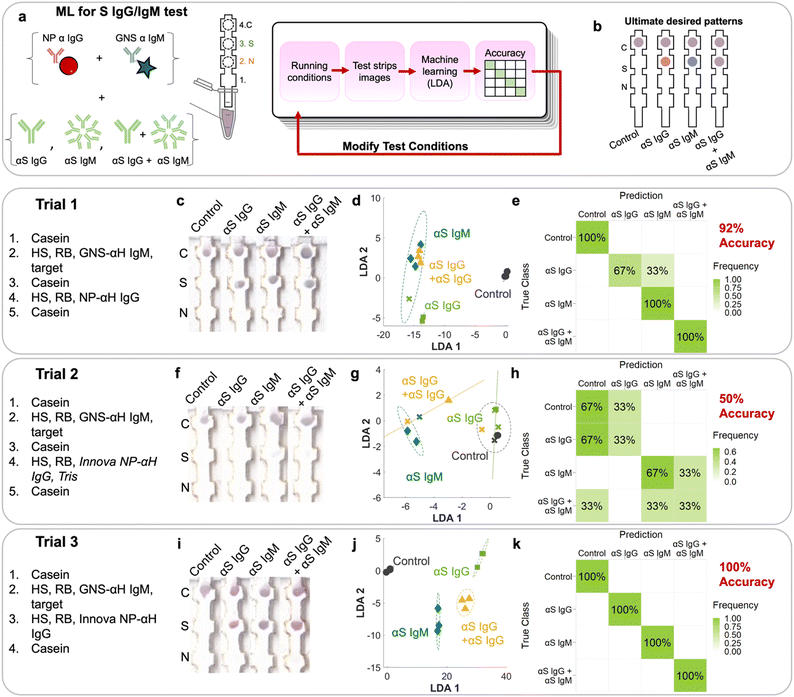
There are seven possible antibody states for a patient: unvaccinated and uninfected, vaccinated at early, mid, or late stages, and infected at early, mid or late stages (Fig. 2c). For early stages, only IgM for that protein would be present; for late stages only IgG, and for mid both IgG and IgM would be present. Because mRNA vaccines induce a patient to produce only S protein, the vaccinated patient would have only αS IgG/M, whereas an infected patient would have both αN and αS IgG/M. Because we wanted to also investigate the assay's ability to detect pure αN IgG and αN IgM, this resulted in 9 possible classes.However, instead of optimizing the test for all 9 classes directly, we used ML to optimize the test first on a representative subset of the 4 classes representing the case for vaccinated early/mid/late: negative control, αS IgG, αS IgM, and αS IgG + αS IgM (Fig. 4a). We chose this subset because it required the ability to distinguish color on a single spot, which is more complex than distinguishing the location of a signal.
Tests were run on dipstick paper immunoassays which consisted of laser-cut nitrocellulose strips attached to an absorbent wick (Fig. 4a). N protein was spotted by pipetting onto position 2, and S protein on position 3. αFc was spotted onto the control line (position 4), which binds to NP–αIgG and GNS–αIgM directly regardless of whether the target is present, serving as a negative control and confirming that fluid flow occurred. To run the strips, they were immersed in a solution containing NP–αIgG and GNS–αIgM, running buffer, human serum, and targets (αS IgG, αS IgM, and αS IgG + αS IgM) depending on the running procedure. The solution was allowed to wick up the strip to the absorbent pad, which acted like a fluid sink.
The strip was designed such that if αS IgG is present, it should bind to the immobilized S at location 3. Then, the red NP–αIgG would bind to it to form the sandwich, resulting in a red spot at location 3. If αS IgM was present, it should bind to immobilized S at location 3. Then, the blue GNS–αIgM would bind to form the sandwich, resulting in a blue spot at location 3. If both αS IgG and αS IgM were present, they would bind to immobilized S at location 3. Both red NP–αIgG and blue GNS-αIgM would bind to it to form the sandwich, resulting in a purple spot (Fig. 4b).
The first trial consisted of running the immunoprobes separately, with wash steps in between (ESI† Fig. S1). First, a casein prewash was run as a blocking step. Then, GNS–αIgM was mixed with human serum (HS), running buffer (Tween/sucrose) and targets. This was followed by a mid-wash of casein. Then, red NP–αIgG was mixed with HS and running buffer, followed by a casein post wash. Strips were run in triplicate (ESI† Fig. S2). The first trial (Fig. 4c) had spots at the S location, indicating sandwich formation with the αS IgG and IgM antibodies. However, the colors were not exactly what was expected, as the red/blue color was not distinguishable by eye. The N location displayed no signal, indicating that there was no cross reactivity.
RGB values of intensities at both the N and S locations (locations 2 and 3) were obtained by image analysis of the scanned strips.19 This resulted in 2 sets of RGB results for each strip, or 6 components for the 12 training examples of this set. The 6 components were run through linear discriminant analysis (LDA, ESI† Fig. S3c) in order to maximize the ratio of between-class variance to within-class variance. The LDA plot showed clustering but with overlap between classes, indicating that the separability of the classes was suboptimal. αS IgM (blue diamonds) clustered but overlapped with the αS IgG + αS IgM cluster (yellow triangles). αS IgG (green squares) also overlapped with the others. The negative control (black circles) was distinct from the rest of the cases. A confusion matrix (ESI† Fig. S3d) was used to display the accuracy of the method, showing in a matrix format the true classes (rows) vs. the predictions from LDA (columns). The on-diagonal values in the 4 × 4 confusion matrix indicate correctly predicted classes, whereas off-diagonal values indicate errors. First, we evaluated the confusion matrix using the spot RGB values. LDA resulted in a confusion matrix with an overall accuracy of 50%, where it mistook αS IgG for αS IgG + IgM, αS IgM for αS IgG + IgM, and αS IgG + IgM for αS IgM. This can be attributed to the inability to distinguish the color at the S location, where what should be a red or blue spot appeared purple.
Using stain vectors instead of RGB values
The NPs used in the assays were not pure red and the GNSs were not pure blue, where both of their colors consisted of a combination of values for the red, blue, and green channels. Thus, using RGB values has limitations in discriminating the red NPs from the blue GNS. We found that the accuracy could be improved if we used color deconvolution,29 a strategy implemented for histology and one which we have utilized successfully to repurpose α-NS1 antibodies for dengue and Zika viruses to detect NS1 of yellow fever.30 First, stain vectors are assigned for each stain, which here in our case were the differently colored NP–Ab conjugates (ESI† Fig. S3a). Each individual stain vector is a linear combination of the RGB values of the stain created by the pure NP–Ab conjugate.First, each pure stain by itself was imaged, where just the red NP–αIgG immunoprobe was dropped on nitrocellulose and imaged to define its stain vector S1, followed by the blue GNS–αIgM to define S2. A third vector, S3, was assigned as the cross product of S1 and S2 and thus orthogonal to both. Then, the colors at the S and N locations were deconvoluted into their S1, S2, and S3 components. Using the stain vectors for each of the spots in the LDA model (6 components) (Fig. 4d), the resulting confusion matrix had an accuracy of 92% (Fig. 4e), where it only mistook αS IgG for αS IgM, and was better than the LDA using RGB values of the spots (ESI† Fig. S3c and d).
To improve the test, additional trials using modified running conditions were performed. Conditions for a given trial were based on the analysis of the incorrect predictions of the previous trial. For trial 1, the mistake in prediction came from the inability to distinguish the color between blue and red (i.e., mistaking IgG for IgM). To address this, commercial red NPs (Innova) that are less susceptible to aggregation were used for the following trials. Because conjugation to commercial NPs relies on NHS–ester chemistry, TBS was added as a quencher as it contains amines (Fig. 4, trial 2). Resulting trial 2 strips (Fig. 4f) had a very weak signal at the S location on all strips.
LDA exhibited improved clustering (Fig. 4g) and ML analysis showed an accuracy of 50% (Fig. 4h), where there were multiple mistakes in which every class was mistaken for another. For example, αS IgM was erroneously classified as αS IgG + IgM, and αS IgG + IgM for the control and αIgM. Clearly, the weak signal made it difficult for the system to be trained to accurately distinguish the classes.
For the 3rd trial, we changed the running conditions by removing the casein wash in between running the blue GNS and red NPs, as it could be washing away NP–Ab and thus reducing the visible signal. Additionally, TBS was removed from the solution when running the red NPs to reduce particle aggregation. This time, the resulting signal intensity at the S area was much stronger, resulting in colors that were visually more distinct (Fig. 4i), especially between αS IgG and αS IgM. LDA (Fig. 4j) and ML reached an accuracy of 100% (Fig. 4k). Thus, all classes were correctly predicted, indicating that we converged on running conditions that can be used to successfully identify each of the four cases for this subset.
Remaining classes
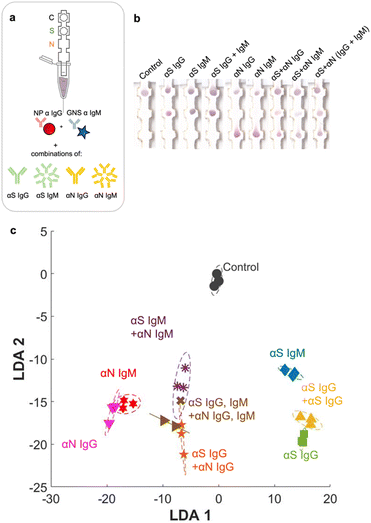
Having arrived with the optimal running conditions, we then repeated the process on other subsets of targets: αN IgG, αN IgM, and a negative control (Fig. 5a), resulting in three strips (Fig. 5b).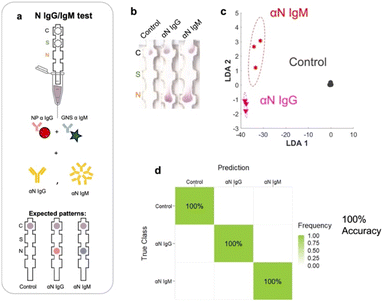 | ||
| Fig. 5 a) Strip runs for targets of N IgG and N subsets. b) Images of test strips. c) LDA. d) Confusion matrix showing 100% accuracy. | ||
These were run in triplicate (ESI† Fig. S4). Under these conditions, LDA and ML yielded a 3 × 3 confusion matrix with an accuracy of 100% (Fig. 5c and d), showing that the assay running conditions were also optimal for this subset.
Full set of classes (9 × 9)
Finally, we ran the assay with the entire set of classes, which included all 7 possible disease states plus pure αN IgG and αN IgM (Fig. 6a and b). The additional strip runs were (αS IgG + αN IgG), (αS IgM + αN IgM), and (αS IgG + αS IgM + αN IgG + αN IgM), performed in triplicate (ESI† Fig. S5), resulting in a total of 27 training examples for the entire test. For αS IgG + αN IgG, representing an infected patient in the late-stage post infection, a red signal was present at both S and N locations, though the intensity at the S location was weaker. For αS IgM + αN IgM, representing an infected patient in the early-stage post infection, a signal was present at both locations and had a slightly more purplish color. The red NPs should not bind to this location, so evidently there was some non-specific adsorption.When the strip was run with all four antibodies (αS IgG + αS IgM + αN IgG + αN IgM), representing an infected patient in the mid stage post infection, both S and N spots had color, and again both were purple in color.
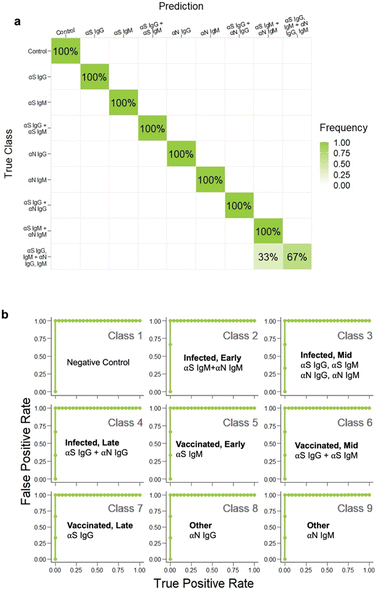
Even though the test color patterns were not distinguishable by eye, ML could still be trained to distinguish the different cases. LDA clustering showed that there was minimal overlap except for this one error (Fig. 6c, brown x). The confusion matrix (Fig. 7a) had an accuracy of 96.3%, with only one error, where αS IgG + αS IgM + αN IgG + αN IgM was mistaken for αS IgM + αN IgM. This indicates that for one strip, the color differential between blue and purple for both S and N locations was not successful.
ROC analysis
To evaluate sensitivity and specificity, we performed receiver operating characteristic (ROC) analysis (Fig. 7b). The metrics of the analyses had to be adapted from those in binary classification to make ROC curves for our multi-class model. A “one-vs.-rest” approach was implemented to compare each class against all the others at the same time. There were 9 resultant ROC curves. The AUC for each curve was 1, which reflected how well the classifier was in predicting each class vs. the rest. These results demonstrate that we could arrive at an accurate IgG IgM test for COVID-19 using ML to guide running conditions. We note that an AUC of 1.0 can occur even when the accuracy is <100% due to the fact that the ROC curve considers the trade-off between sensitivity and specificity across various threshold values, while accuracy considers the ratio of correctly predicted instances to the total instances at a fixed threshold.Limit of detection
We evaluated the LOD of the test. The concentration of each of the targets was varied, and the signal intensity at the relevant spot was quantified as a function of target concentration. Strip images are shown in the ESI,† Fig. S6. αS IgG and αN IgG strips exhibited hook effects (ESI,† Fig. S7), so a window at the lower target concentration was chosen to fit the data to obtain the LOD values. The LOD values were αS IgG = 55 pM (Fig. 8a), αN IgG = 96.8 pM (Fig. 8b), αS IgM = 1.1 nM (Fig. 8c), and αN IgM = 9.6 pM (Fig. 8d).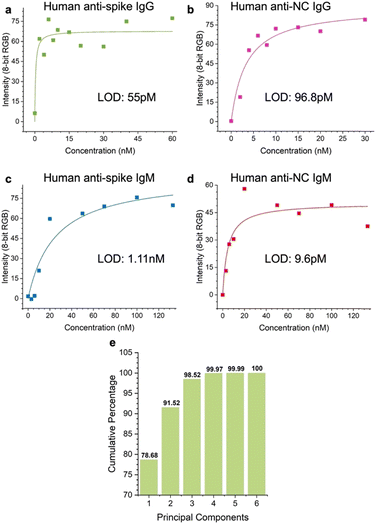 | ||
| Fig. 8 Limit of detection (LOD) of the test for a) αS IgG, b) αN IgG, c) αS IgM, and d) αN IgM. e) Scree plot of the assay. | ||
Scree plot
The discriminatory power of the assay was evaluated using a scree plot (Fig. 8e), which showed that 98% of the discriminatory power was contained in 3 components.Conclusions
We demonstrate here a hybrid approach to use ML to improve the properties of a paper immunoassay of COVID-19 antibodies, where the running conditions for the NP–antibody conjugates, surface passivants, and stabilizers were optimized. ML and LDA were first used to optimize the test running conditions for a subset of targets, and then used to train the final test that could differentiate between αS and αN antibodies for both IgG and IgM, where it could distinguish 9 different infection profiles and achieve an accuracy of 100%. The assay was designed to extend the capabilities of immunoassays beyond a yes/no answer, where it could be used as a selective array, yielding a multicolor spatial pattern as the signal.31,32 Because the readout relies on discriminating test line colors, image analysis and color deconvolution in combination with supervised ML were used to train the system to distinguish between vaccinated and infected, and antibody profiles representing early, mid, or late stage post-infection.ML has already been demonstrated to be a powerful and versatile tool for arriving at a desired synthesis outcome, impacting a broad range of scientific areas. It has proven to be successful in the synthesis of organic molecules, soluble NPs, solid materials for batteries, natural compounds, fluorescent polymers, and many other species.12,33–36 The benefits of ML have been demonstrated for solution synthesis because all of the reagents are in a single phase, thus rendering the process suitable for completely autonomous control via microfluidics and liquid handling robots. In contrast, LFA development is less convenient to map to autonomous ML because the format is not in a single phase, where running assays involve utilizing solid materials such as paper strips in combination with solutions, so completing the feedback loop often requires human intervention. While modifications to running conditions were not performed autonomously, our results demonstrate the principle that the overall process can potentially use ML to aid development.
Even though the scale is small here, these results highlight the opportunity to utilize ML to rapidly create new tests for an emerging pathogen. Emergency preparedness for the next outbreak relies critically on diagnostics, which are the foundation of rapid response in disease surveillance and patient treatment.37 Delays in point of care test development can have dangerous consequences, especially early in an outbreak. Thus, any means to expedite this process could have a consequential impact on the availability of diagnostic tests.38
Furthermore, this approach can be easily shared and used to improve development time in areas with limited or no access to antibody production.39,40 This could potentially enhance the detection capabilities of reagents that are limited to what is currently available. Thus, this approach can expand access to diagnostic development and aid in confining the spread of a disease. We have already demonstrated that using multicolor NPs in combination with ML can be used to repurpose antibodies of one flavivirus to make a diagnostic for another.30 It has the potential to be applied to other diseases as well as emerging pathogens, and consequently help reduce response time during the critical stages of an outbreak, ultimately improving emergency preparedness.
IgG and IgM tests can increase the reach of disease surveillance tools and get a better handle of the impact of an outbreak. With the emergence of new variants,41 one can introduce reagents to be able to distinguish antibodies of different variants, and the test can yield historical information on what a patient has been exposed to. Here for SARS CoV-2, they can be used to determine past vaccination and/or infection status. Looking back to the early stages of the COVID-19 pandemic, if we had a point of care diagnostic for either diagnosing current infections by detecting the protein biomarkers, or past infections by antibodies at an earlier point in the outbreak, maybe it could have enabled containment and quarantining and resulted in different outcomes. The frequency of infectious diseases emerging is increasing due to a variety of factors,42 and using ML in LFA development could better prepare us for the next outbreak43,44 by expediting the response with diagnostics. Future work involves work on patient samples, potentially variant differentiation so that one can determine what someone has been infected with, and extension to other disease biomarkers.
Author contributions
The manuscript was written through contributions of all authors. All authors have given approval to the final version of the manuscript.Conflicts of interest
There are no conflicts to declare.Acknowledgements
Funding was from the UMass Boston Proposal Development Grant.Notes and references
- F. Di Nardo, M. Chiarello, S. Cavalera, C. Baggiani and L. Anfossi, Sensors, 2021, 21, 5185 CrossRef CAS PubMed.
- J. Mata Calidonio and K. Hamad-Schifferli, Biochim. Biophys. Acta, Gen. Subj., 2023, 1867, 130266 CrossRef PubMed.
- P. A. Ward, J. Adams, D. Faustman, G. F. Gebhart, J. G. Geistfeld, W. Imbaratto, N. C. Peterson, F. Quimby, A. Marshak-Rothstein, A. N. Rowan, M. D. Scharff, R. B. Dell, K. A. Beil, S. S. Vaupel, M. K. Williams, N. Grossblatt, J. Vandeberg, C. R. Abee, B. Dyke, R. W. Elliott, G. F. Gebhart, H. J. Klein, M. Landi, C. R. McCarthy, H. Moon, W. Norton, R. J. Russell, W. S. Stokes, J. G. Vandenbergh, T. Wolfle, J. Zurlo, R. B. Dell, M. T. Clegg, P. Berg, F. R. Anderson, J. C. Bailar III, J. Burger, S. L. Dunwoody, D. Eisenberg, J. L. Emmerson, N. L. First, D. J. Galas, D. V. Goeddel, A. Gomez-Pompa, C. S. Goodman, H. W. Heikkinen, B. S. Hulka, H. J. Kende, C. J. Kenyon, M. G. Kidwell, B. R. Levin, O. F. Linares, D. M. Livingston, D. R. Mattison, E. M. Meyerowitz, R. T. Paine, R. R. Sederoff, R. R. Sokal, C. F. Stevens, S. M. Tilghman, J. L. Vandeberg, R. L. White and M. Uman, National Research Council (US) Committee on Methods of Producing Monoclonal Antibodies, Monoclonal Antibody Production, National Academies Press (US), Washington (DC), 1999, Available from: https://www.ncbi.nlm.nih.gov/books/NBK100189/ Search PubMed.
- C. Parolo, A. Sena-Torralba, J. F. Bergua, E. Calucho, C. Fuentes-Chust, L. Hu, L. Rivas, R. Álvarez-Diduk, E. P. Nguyen, S. Cinti, D. Quesada-González and A. Merkoçi, Nat. Protoc., 2020, 15, 3788–3816 CrossRef CAS PubMed.
- K. E. Barrett, H. Brooks, S. Boistano and S. M. Barman, Ganong's review of medical physiology, McGraw-Hill Medical, New York, 2010 Search PubMed.
- R. Milo and R. Phillips, Cell Biology by the Numbers, Garland Science, 2015 Search PubMed.
- C. Rodríguez-Quijada, M. Sánchez-Purrà, H. de Puig Guixé and K. Hamad-Schifferli, J. Phys. Chem. B, 2018, 122, 2827–2840 CrossRef PubMed.
- J. Mata Calidonio, J. Gomez-Marquez and K. Hamad-Schifferli, J. Phys. Chem. C, 2022, 126, 17804–17815 CrossRef CAS.
- A. Molinelli, K. Grossalber, M. Führer, S. Baumgartner, M. Sulyok and R. Krska, J. Agric. Food Chem., 2008, 56, 2589–2594 CrossRef CAS PubMed.
- H. de Puig Guixé, I. Bosch, L. Gehrke and K. Hamad-Schifferli, Trends Biotechnol., 2017, 35, 1169–1180 CrossRef PubMed.
- Lateral Flow Assays Market worth $12.6 Billion by 2026, Markets and Markets, 2023 Search PubMed.
- J. M. Granda, L. Donina, V. Dragone, D.-L. Long and L. Cronin, Nature, 2018, 559, 377–381 CrossRef CAS PubMed.
- H. de Puig, J. O. Tam, C.-W. Yen, L. Gehrke and K. Hamad-Schifferli, J. Phys. Chem. C, 2015, 119, 17408–17415 CrossRef CAS PubMed.
- K. Chandra, K. S. B. Culver, S. E. Werner, R. C. Lee and T. W. Odom, Chem. Mater., 2016, 28, 6763–6769 CrossRef CAS.
- D. Hristov, H. Rijal, J. Gomez-Marquez and K. Hamad-Schifferli, Anal. Chem., 2021, 93, 7825–7832 CrossRef CAS PubMed.
- L. Zhan, S.-Z. Guo, F. Song, Y. Gong, F. Xu, D. R. Boulware, M. C. McAlpine, W. C. Chan and J. C. Bischof, Nano Lett., 2017, 17, 7207–7212 CrossRef CAS PubMed.
- J. Hu, S. Wang, L. Wang, F. Li, B. Pingguan-Murphy, T. J. Lu and F. Xu, Biosens. Bioelectron., 2014, 54, 585–597 CrossRef CAS PubMed.
- J. O. Tam, H. de Puig, C.-W. Yen, I. Bosch, J. Gómez-Márquez, C. Clavet, K. Hamad-Schifferli and L. Gehrke, J. Immunoassay Immunochem., 2017, 38, 355–377 CrossRef CAS PubMed.
- C. A. Schneider, W. S. Rasband and K. W. Eliceiri, Nat. Methods, 2012, 9, 671–675 CrossRef CAS PubMed.
- G. Landini, G. Martinelli and F. Piccinini, Bioinformatics, 2021, 37, 1485–1487 CrossRef CAS PubMed.
- Z. Li, Y. Yi, X. Luo, N. Xiong, Y. Liu, S. Li, R. Sun, Y. Wang, B. Hu, W. Chen, Y. Zhang, J. Wang, B. Huang, Y. Lin, J. Yang, W. Cai, X. Wang, J. Cheng, Z. Chen, K. Sun, W. Pan, Z. Zhan, L. Chen and F. Ye, J. Med. Virol., 2020, 92, 1518–1524 CrossRef CAS PubMed.
- B. D. Kevadiya, J. Machhi, J. Herskovitz, M. D. Oleynikov, W. R. Blomberg, N. Bajwa, D. Soni, S. Das, M. Hasan, M. Patel, A. M. Senan, S. Gorantla, J. McMillan, B. Edagwa, R. Eisenberg, C. B. Gurumurthy, S. P. M. Reid, C. Punyadeera, L. Chang and H. E. Gendelman, Nat. Mater., 2021, 20, 593–605 CrossRef CAS PubMed.
- R. L. Higgins, S. A. Rawlings, J. Case, F. Y. Lee, C. W. Chan, B. Barrick, Z. C. Burger, K.-T. J. Yeo and D. Marrinucci, PLoS One, 2021, 16, e0247797 CrossRef CAS PubMed.
- E. G. Rey, D. O'Dell, S. Mehta and D. Erickson, Anal. Chem., 2017, 89, 5095–5100 CrossRef CAS PubMed.
- D. Hristov, A. J. Pimentel, G. Ujialele and K. Hamad-Schifferli, ACS Appl. Mater. Interfaces, 2020, 12, 34620–34629 CrossRef CAS PubMed.
- R. Wang, S. Y. Ongagna-Yhombi, Z. Lu, E. Centeno-Tablante, S. Colt, X. Cao, Y. Ren, W. B. Cárdenas, S. Mehta and D. Erickson, Anal. Chem., 2019, 91, 5415–5423 CrossRef CAS PubMed.
- J. Turkevich, P. C. Stevenson and J. Hillier, Discuss. Faraday Soc., 1951, 11, 55–75 RSC.
- T. V. Tsoulos, S. Atta, M. J. Lagos, M. Beetz, P. E. Batson, G. Tsilomelekis and L. Fabris, Nanoscale, 2019, 11, 18662–18671 RSC.
- A. C. Ruifrok and D. A. Johnston, Anal. Quant. Cytol., 2001, 23, 291–299 CAS.
- C. Rodríguez-Quijada, J. Gomez-Marquez and K. Hamad-Schifferli, ACS Nano, 2020, 14, 6626–6635 CrossRef PubMed.
- J. R. Askim, M. Mahmoudi and K. S. Suslick, Chem. Soc. Rev., 2013, 42, 8649–8682 RSC.
- W. J. Peveler, M. Yazdani and V. M. Rotello, ACS Sens., 2016, 1, 1282–1285 CrossRef CAS PubMed.
- C. H. Liow, H. Kang, S. Kim, M. Na, Y. Lee, A. Baucour, K. Bang, Y. Shim, J. Choe, G. Hwang, S. Cho, G. Park, J. Yeom, J. C. Agar, J. M. Yuk, J. Shin, H. M. Lee, H. R. Byon, E. Cho and S. Hong, Nano Energy, 2022, 98, 107214 CrossRef CAS.
- S. Ye, N. Meftahi, I. Lyskov, T. Tian, R. Whitfield, S. Kumar, A. J. Christofferson, D. A. Winkler, C.-J. Shih, S. Russo, J.-C. Leroux and Y. Bao, Chem, 2023, 9, 924–947 CAS.
- V. Periwal, S. Bassler, S. Andrejev, N. Gabrielli, K. R. Patil, A. Typas and K. R. Patil, PLoS Comput. Biol., 2022, 18, e1010029 CrossRef CAS PubMed.
- H. Lv and X. Chen, Nanoscale, 2022, 14, 6688–6708 RSC.
- H. Devlin, The Guardian, 2022 Search PubMed.
- J. Budd, B. S. Miller, N. E. Weckman, D. Cherkaoui, D. Huang, A. T. Decruz, N. Fongwen, G.-R. Han, M. Broto, C. S. Estcourt, J. Gibbs, D. Pillay, P. Sonnenberg, R. Meurant, M. R. Thomas, N. Keegan, M. M. Stevens, E. Nastouli, E. J. Topol, A. M. Johnson, M. Shahmanesh, A. Ozcan, J. J. Collins, M. Fernandez Suarez, B. Rodriguez, R. W. Peeling and R. A. McKendry, Nat. Rev. Bioeng., 2023, 1, 13–31 CrossRef.
- J. Gomez-Marquez and K. Hamad-Schifferli, Nat. Nanotechnol., 2021, 16, 484–486 CrossRef CAS PubMed.
- J. Gomez-Marquez and K. Hamad-Schifferli, Adv. Healthcare Mater., 2019, 8(18), 1900184 CrossRef PubMed.
- C. Stein, H. Nassereldine, R. J. D. Sorensen, J. O. Amlag, C. Bisignano, S. Byrne, E. Castro, K. Coberly, J. K. Collins, J. Dalos, F. Daoud, A. Deen, E. Gakidou, J. R. Giles, E. N. Hulland, B. M. Huntley, K. E. Kinzel, R. Lozano, A. H. Mokdad, T. Pham, D. M. Pigott, R. C. Reiner Jr, T. Vos, S. I. Hay, C. J. L. Murray and S. S. Lim, Lancet, 2023, 401, 833–842 CrossRef PubMed.
- D. M. Morens, G. K. Folkers and A. S. Fauci, Nature, 2004, 430, 242–249 CrossRef CAS PubMed.
- B. Gates, N. Engl. J. Med., 2015, 372, 1381–1384 CrossRef CAS PubMed.
- K. F. Smith, M. Goldberg, S. Rosenthal, L. Carlson, J. Chen, C. Chen and S. Ramachandran, J. R. Soc., Interface, 2014, 11, 20140950 CrossRef PubMed.
Footnote |
| † Electronic supplementary information (ESI) available: Experimental workflow, strip replicates, and color deconvolution comparison. See DOI: https://doi.org/10.1039/d3sd00327b |
| This journal is © The Royal Society of Chemistry 2024 |

