
 Open Access Article
 This Open Access Article is licensed under a Creative Commons Attribution-Non Commercial 3.0 Unported Licence
Development of fluorometric detection for saxitoxin with its specific binding peptide†
Tae Hee
Kim
 a,
Chae Hwan
Cho
b,
So Yeon
Kweon
a,
Su Min
Kim
a,
Suresh Kumar
Kailasa
c,
Jong Pil
Park
b,
Chan Yeong
Park
*a and
Tae Jung
Park
*a
a,
Chae Hwan
Cho
b,
So Yeon
Kweon
a,
Su Min
Kim
a,
Suresh Kumar
Kailasa
c,
Jong Pil
Park
b,
Chan Yeong
Park
*a and
Tae Jung
Park
*a
aDepartment of Chemistry, Research Institute of Chem-Bio Diagnostic Technology, Chung-Ang University, 84 Heukseok-ro, Dongjak-gu, Seoul 06974, Republic of Korea
bDepartment of Food Science and Technology, Chung-Ang University, Anseong 17546, Republic of Korea
cDepartment of Chemistry, Sardar Vallabhbhai National Institute of Technology, Surat-395007, Gujarat, India
First published on 23rd December 2023
Abstract
Saxitoxin (STX) is a representative neurotoxin among paralytic shellfish poisons and poses a serious threat to human health. When ingested, it blocks sodium permeability of excitatory membranes and causes neuromuscular paralysis and respiratory arrest, leading to death. Therefore, technology capable of detecting STX in advance is required. In this study, to develop the bioreceptor that specifically binds to STX, a phage display was introduced. For this technique, the STX hapten was synthesized by reacting the amine group of STX with the carboxyl group of ovalbumin, a carrier protein, using 1-ethyl-3-(3-dimethylaminopropyl)carbodiimide and N-hydroxysulfosuccinimide sodium salt coupling reaction. The peptides discovered through this were selected according to frequency and similarity, and the 5′-terminal was modified with 5-carboxyfluorescein as the fluorophore. To construct a simple verification procedure for the discovered peptides, we developed a peptide-based fluorometric sensor using the graphene oxide (GO) quenching phenomenon. In this sensor, GO as a quencher can be strongly adsorbed through π–π interaction with a fluorophore and charge–charge interaction with STX at pH 7.4, and it showed a low detection limit of 1.5 ppb.
1. Introduction
Shellfish toxins are natural organic substances produced by toxic algae in the sea. Shellfish bioaccumulate these toxic microalgae after filtering and feeding them. They are usually classified as neurotoxic shellfish poisons (NSPs), amnesic shellfish poisons (ASPs), diarrhetic shellfish poisons (DSPs), and paralytic shellfish poisons (PSPs), depending on the symptoms of poisoning and the type of toxin delivery agent. Saxitoxin (STX), which is produced by cyanobacteria and marine dinoflagellates, is a kind of PSP and one of the most potent compared to other PSP toxins, consisting of neosaxitoxin (NEO) and gonyautoxins 1 to 4 (GTX1 to 4).1–7The STX reversibly binds to specific amino acid residues near the sodium channels, blocking sodium permeableness of the excitatory membrane.8,9 Blocking such voltage-dependent sodium channels prevents the creation of appropriate action potentials in nerves and muscle fibers, resulting in neuromuscular paralysis and respiratory arrest.
In detail, symptoms of STX typically begin within 30 min of intake, leading to overall paralysis of the face from tingling or burning pain on the lips, tongue, and inside neck.10 In addition, vomiting, perspiration, and diarrhea may occur. In the case of acute addiction, these symptoms spread throughout the body as well as the face, causing muscle weakness, loss of limb coordination, and massive paralysis. The occurrence of death after taking 1 mg of the toxin has also been reported,11 and there is no legally approved antidote yet.
Despite the health benefits of seafood consumption, the potential risks of residual marine toxins are constantly monitored by countries to ensure the safety of marine food, protect public health, and foster the aquaculture industry. The evaluation of seafood safety for human consumption has been categorized into several approaches, including in vivo animal bioassays, analytical techniques, and immunoassays. Hitherto, mouse bioassay, standardized by the Association of Official Analytical Chemists, is the representative assay method to judge the existence of marine toxins in seafood. However, this method is considered ethically unacceptable, and its validity is questionable because it measures other routes of human exposure to toxins. In addition, for accurate measurement, the preparation process is complicated, a number of mice must be used, and there are differences in sensitivity depending on the mouse strains.7,12–14
High-performance liquid chromatography-tandem mass spectrometry (HPLC/LC-MS) and enzyme-linked immunosorbent assays (ELISA) were considered to replace the mouse bioassay. HPLC/LC-MS has the advantages of high sample throughput, sensitivity, and selectivity, but there are disadvantages such as expensive equipment, multi-step sample pretreatments, requiring skilled operators, and long analysis time.15–17 The ELISA is a type of biochemical assay that utilizes antibodies raised to the analyte of interest. The experimental method is simple, has high sensitivity, and can analyze many samples at once. However, the receptors and antibodies used are easily affected by the environment and have poor stability, requiring strict storage conditions.7,13 To overcome these limitations, it is necessary to develop a new detection method that can be analyzed quickly and is stable without using living organisms.
In this study, to develop a simpler and more efficient way, we constructed a fluorescence detection method based on the graphene oxide (GO) quenching mechanism using a peptide that specifically binds to STX for STX detection. All experiments used certified reference material (CRM) samples, and reproducibility and reliability can be confirmed by applying homogeneous and stable CRM samples to the system several times.18,19 STX-specific binding peptide (SABP1) was tagged with 5-carboxyfluorescein (FAM) as the fluorophore. Peptides as receptors show promise for usage outside of the laboratory due to their high thermal stability and high affinity with the target. In addition, peptides can also be synthesized in large quantities and made on-demand through the phage display.20,21 GO was adopted as a quencher due to its superior fluorescence quenching efficiency.22 GO can be strongly adsorbed with SABP1–FAM through hydrophobic and π–π stacking interactions.23 If STX exists in the sample, at neutral pH (or at pH 7.4), cation state STX24 becomes closer to union state GO due to charge–charge interaction, increasing the quenching effect of the STX compound combined with SABP1. Therefore, the fluorescence intensity decreases in proportion to the concentration of STX (Fig. 1).
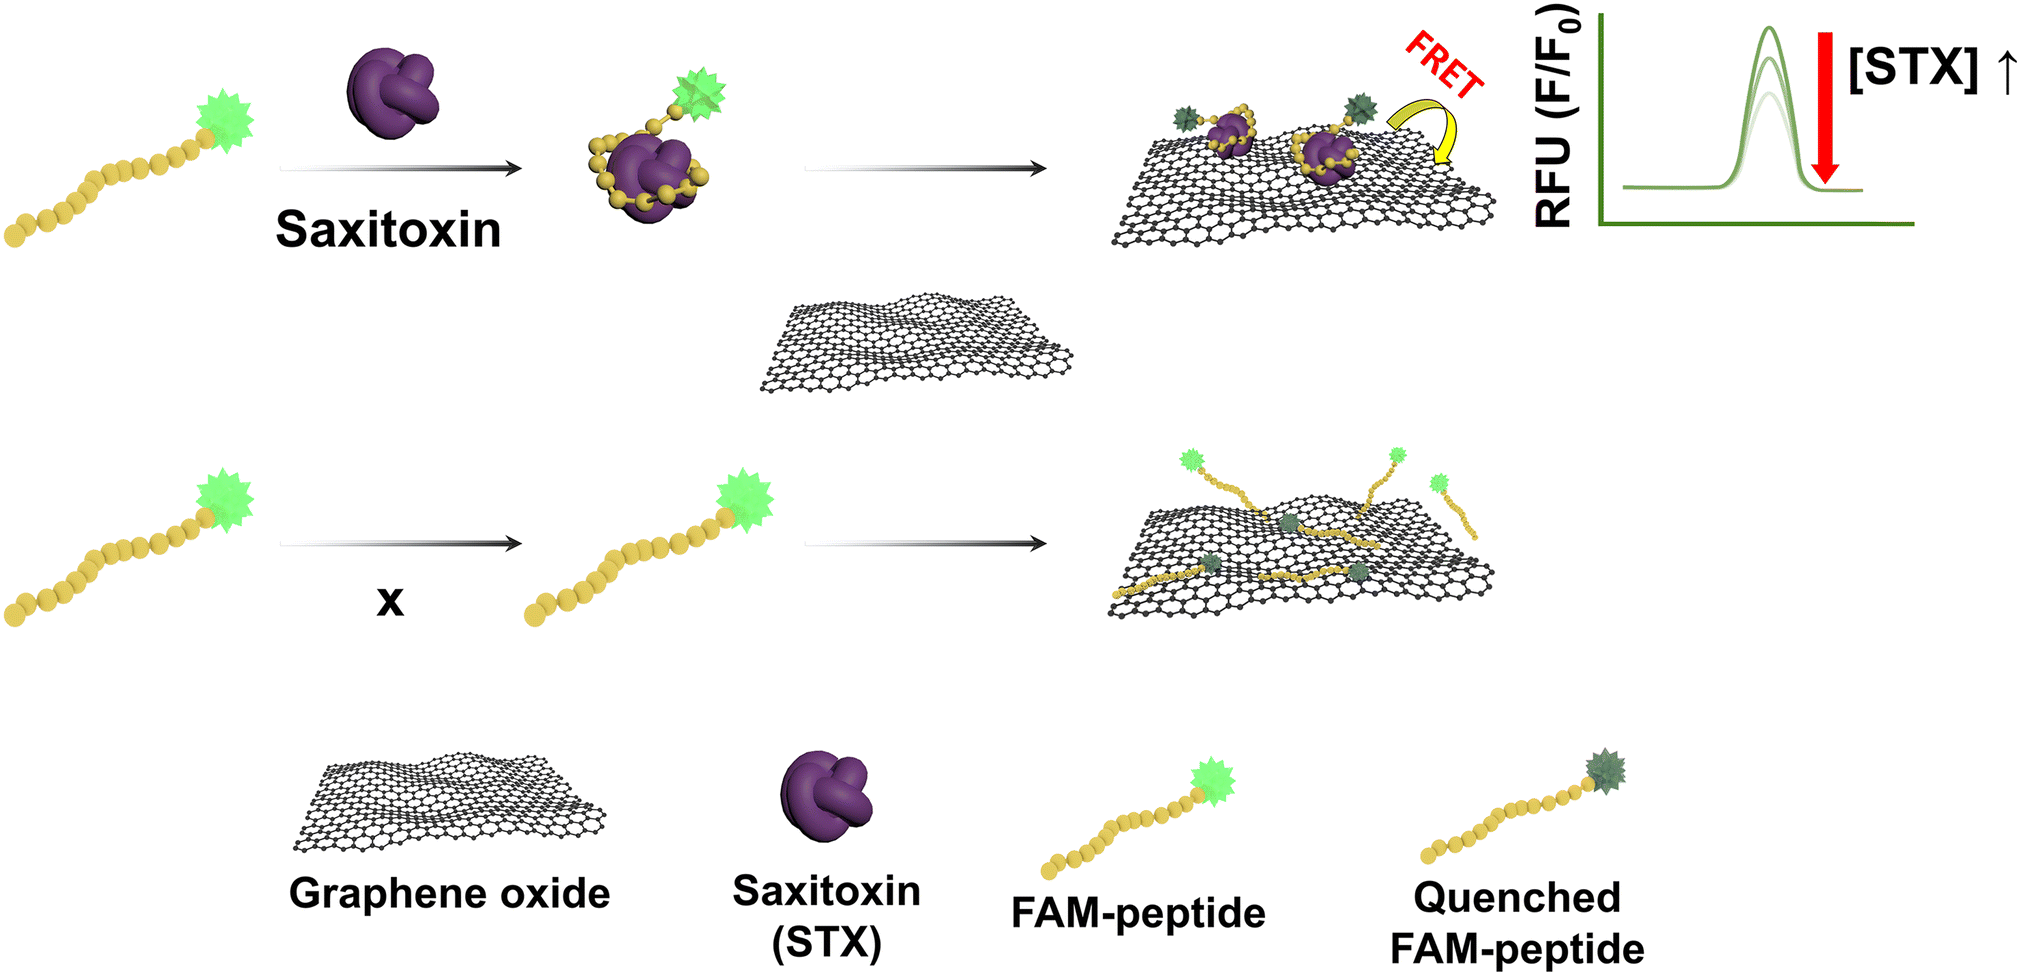 | ||
| Fig. 1 Schematic illustration of the fluorometric STX sensor based on the GO mediated quenching phenomenon. | ||
2. Experimental
2.1 Materials
STX dihydrochloride (20 μg g−1, certified reference material (CRM)), GO dispersion (4 mg mL−1), albumin from chicken egg white (ovalbumin; OVA) and potassium phosphate monobasic were purchased from Sigma-Aldrich (St. Louis, MO, USA). STX-specific binding peptide (SABP1) is Ac HYPTWQAMKTTWK and FAM-modified SABP1 on the 5′-terminal, and was synthesized by Peptron (Daejeon, Korea). Tris and TEMED were purchased from Bio-Rad Laboratories (Hercules, CA, USA). 1-Ethyl-3-(3-dimethylaminopropyl)carbodiimide (EDC), N-hydroxysulfosuccinimide sodium salt (NHS), and sodium hydrogen phosphate dibasic (98+%) were purchased from Alfa Aesar (Haver Hill, MA, USA). Sodium chloride, acetic acid, and methanol were purchased from Daejung Chemical (Siheung, Korea). Potassium chloride was purchased from Duksan (Ansan, Korea). Dimethyl sulfoxide-d6 (DMSO) was purchased from Acros Organics (Geel, Belgium). Smart™ BCA protein kit was purchased from iNtRON (Seongnam, Korea). Ammonium persulfate (APS) and 30% acrylamide-bis solution (37.5![[thin space (1/6-em)]](https://www.rsc.org/images/entities/char_2009.gif) :1) were purchased from Biosesang (Yongin, Korea). Hydrochloric acid (HCl) was purchased from Merck (Kenilworth, NJ, USA). Deionized (DI) water was prepared using a Direct-Q® water purification system (Millipore, Billerica, MA, USA), which was used for the whole experiment.
:1) were purchased from Biosesang (Yongin, Korea). Hydrochloric acid (HCl) was purchased from Merck (Kenilworth, NJ, USA). Deionized (DI) water was prepared using a Direct-Q® water purification system (Millipore, Billerica, MA, USA), which was used for the whole experiment.
2.2 Instruments
Fluorescence spectra were recorded with a Synergy H1 hybrid multi-mode microplate reader (BioTek Instruments, Winooski, VT, USA). The data processing and representations were conducted using the Origin 2018 software (OriginLab, Northampton, MA, USA). Particle average diameter was recorded with a zeta-potential & particle size analyzer, ELSZ-1000 (Otsuka Electronics, Osaka, Japan). An ultrasonicator was purchased from Kodo Technical Research (Hwaseong, Korea). A protein electrophoresis system was purchased from Bio-Rad Laboratories (Hercules, CA, USA). 96-Well plates (clear and black) were purchased from SPL (Pocheon, Korea). A 3k-Amicon tube (1.5 mL) was purchased from Merck (Darmstadt, Germany).2.3 STX–OVA hapten synthesis
Two STX-2HCl ampoules were combined in a 5 mL tube and 100 μL of DI water was used to wash the ampoules (0.018 mg mL−1). Next, EDC (0.31 mg mL−1, solvent DI water), NHS (0.24 mg mL−1, solvent DI water), and OVA (0.48 mg mL−1, solvent PBS pH 7.5, 10 mM) solutions were prepared. Then, 500 μL of OVA solution and 50 μL of NHS solution were injected into the STX solution and mixed. After that, 100 μL of EDC solution was added, and the reaction was performed to complete the STA-OVA hapten at 25 °C for 2 days with a rotator at 60 rpm. Finally, the synthesized STA-OVA hapten was filtered using a 3k-Amicon tube (1.5 mL) and then washed three times with DI water.2.4 Verification of the STX–OVA hapten
The protein content of the STX–OVA hapten was determined using a BCA assay. The expression of the STX–OVA hapten was verified through conventional sodium dodecyl sulphate polyacrylamide gel electrophoresis (SDS-PAGE) and MALDI-TOF/MS analysis. The SDS-PAGE method followed our previous work with some modifications.25 Briefly, the running gel (2 mL of 30% acrylamide, 1.3 mL of Tris-HCl (1.5 M, pH 8.8), 0.05 mL of 10% SDS, 0.05 mL of 10% APS, 0.004 mL of TEMED and 1.6 mL of DI water) and stacking gel (0.5 mL of 30% acrylamide, 0.38 mL of Tris-HCl (1.0 M, pH 8.8), 0.03 mL of 10% SDS, 0.03 mL of 10% APS, 0.003 mL of TEMED and 2.1 mL of DI water) were prepared. OVA and STX–OVA were diluted to 0.1 mg mL−1 with DI water, and the 5 μL of the sample was mixed with 20 μL of gel loading buffer, and it was boiled for 10 min 97–100 °C. The 20 μL mixed samples were loaded on the 10% SDS polyacrylamide gel and electrophoresed for 60 V for 40 min and 100 V for 70 min. After that, it was stained using Coomassie Brilliant Blue R-250 and analyzed after destaining using a destaining solution (30 mL of acetic acid, 180 mL of methanol, 240 mL of DI water) for 12 h. Matrix-assisted laser desorption–ionization (MALDI) and time-of-flight mass spectrometry (TOF/MS) were also performed using the MALDI TOFTOF 5800 system (AB SCIEX, USA) at Seoul National University (Seoul, Korea). The validity of the discovered peptides was investigated in our previous study.262.5 Peptide concentration test
The discovered peptide sequence was custom-made at Peptron. 1 mg of SABP1–FAM was diluted to a concentration of 10 mM using 48 μL of DMSO, and the peptide was diluted at various concentrations (0, 1, 5, 10, and 15 μM) using DI water. The analysis solution consisted of 30 μL of SABP1–FAM and 30 μL of Tris-HCl (50 mM, pH 7.4), the solvent was DI water, and the fluorescence intensity was measured with a final volume of 240 μL per well. The excitation of SABP1–FAM was observed at 480 nm, and strong emission was observed at 520 nm.2.6 pH test & GO concentration test
To improve the quenching efficiency, pH and GO concentration were optimized, respectively. First, the pH effect was performed using an analysis solution comprised with 30 μL of SABP1–FAM (8 μM), 30 μL of Tris-HCl (50 mM, pH 6, 7, 7.4, 8, 9, and 10) in DI water, and the solution was mixed with a total volume of 210 μL per well. After LASER beam irradiation 10 times, 30 μL of GO (40 μg mL−1) was added and fluorescence intensity was measured. Next, to optimize the GO concentration, the analysis solution consisted of 30 μL of SABP1–FAM (8 μM), 30 μL of Tris-HCl (50 mM, pH 7.4), 30 μL of STX (800 ppb), and the solution was mixed with a total volume of 210 μL per well. After LASER beam irradiation 10 times, 30 μL of various concentrations of GO (0, 20, 30, 40, 50, 60, 80, and 100 μg mL−1) was added and fluorescence intensity was measured. The quenching efficiency was calculated with the equation quenching (%) = (1 − F/F0) × 100 (%).272.7 GO sonication time test
Since GO was in a solution state, sonication time optimization was performed to disperse homogeneously. After diluting GO to 40 μg mL−1 in a beaker and sonicating for 0, 10, 20, and 30 min, the approximate average diameter of GO was measured with the particle size analyzer equipment.2.8 LASER power test
To reduce the effect of photobleaching according to LASER power, LASER power was optimized. Fluorescence intensity was measured with a multi-mode microplate reader using the analysis solution comprised with 30 μL of SABP1–FAM (8 μM) and 30 μL of Tris-HCl (50 mM, pH 7.4), and the solvent was DI water, with a total volume of 240 μL per well. The gain values were set to 80, 90, and 100, and it was measured by reacting at 25 °C for 0, 15, 30, and 45 min per gain values without the influence of light.2.9 Feasibility test
To analyze the feasibility, of this sensor, the analysis solution consisted of 30 μL of SABP1–FAM (8 μM), 30 μL of Tris-HCl (50 mM, pH 7.4), and STX (800 ppb) in DI water, and the solution was mixed with a total volume of 210 μL per well. It was reacted at 25 °C for 30 min, and after LASER beam irradiation 10 times, fluorescence intensity was measured by adding 30 μL of GO (40 μg mL−1).2.10 Sensitivity test
For the sensitivity assay of STX, the analysis solution consisted of 30 μL of SABP1–FAM (8 μM), 30 μL of Tris-HCl (50 mM, pH 7.4), and STX (0, 100, 200, 400, 600, and 800 ppb), I water was used as a solvent, and the solution was mixed with a total volume of 210 μL per well. It was reacted at 25 °C for 30 min, and after LASER beam irradiation 10 times, fluorescence intensity was measured by adding 30 μL of GO (40 μg mL−1).3. Results and discussion
3.1 Preparation and characterization of the STX–OVA hapten
The design of a hapten suitable for phage display, such as the position and length of the target, affects the properties of the receptor.28 To proceed with phage display, the hapten was prepared by immobilizing STX to OVA, a carrier protein, using the EDC/NHS coupling reaction. The amine group of OVA and the carboxy group of STX are sites provided for hapten immobilization. To confirm the STX–OVA hapten was synthesized, the concentration of the hapten was checked through BCA assay, and then the identification of the STX–OVA hapten was carried out using SDS-PAGE (Fig. 2a) and MALDI-TOF/MS analysis was then performed (Fig. 2b). In the SDS-PAGE, the band of the STX–OVA was confirmed to be about 47 kDa, which is higher than that of OVA which is about 45 kDa, and as can be seen in the MALDI-TOF/MS results, the molecular weight of STX–OVA is larger than OVA. Therefore, it was confirmed that STX–OVA hapten was synthesized well, and it was calculated that approximately 22 STX molecules were conjugated with an OVA. | ||
| Fig. 2 Verification of the STX–OVA hapten using (a) SDS-PAGE and (b) MALDI-TOF/MS analysis. | ||
3.2 Development of the fluorometric sensor for STX
Previous STX detection studies had problems such as not being able to process a large number of samples and long analysis time. To solve this problem, the STX-specific binding peptide modified with FAM dye (SABP1–FAM) was used for STX detection. The sensor developed using SABP1–FAM can analyze many samples simply and quickly using 96-well plates. In the absence of STX, the fluorescence of SABP1–FAM is quenched because the distance becomes closer by the hydrophobic interaction and π–π stacking force between the sp2 carbon of fluorescein and the sp2 carbon of the GO sheet. In the presence of STX, SABP1–FAM will bind to STX and, due to the cation state of STX and anion state of GO in pH 7.4, STX combined with SABP1–FAM is further quenched due to charge–charge interaction. Therefore, the amount of STX in the sample can be quantified through the fluorescence intensity according to the presence/absence of toxins.3.3 Optimization of the fluorometric sensor for STX
Peptide concentration, pH value, GO concentration, GO sonication time, and LASER power were investigated to determine the environment optimized for this sensor. If the fluorescence intensity is too high or too low, the result is not accurate and difficult to confirm, so the peptide concentration was determined as 8.0 μM based on the previous research results (Fig. 3a).29 | ||
| Fig. 3 (a) Fluorescence emission intensity of the various concentrations of SABP1–FAM. (b) Effect of pH level on the quenching efficiency (n = 3). | ||
To increase the quenching efficiency, the pH value was investigated 50 mM Tris-HCl pH from 6.0 to 10.0. Since the working range of the Tris-HCl buffer was from pH 7.0 to 9.2, pH 6 showed the highest quenching efficiency, but was excluded. The highest percentage of quenching efficiency at pH 7.4 is depicted in Fig. 3b. Therefore, 50 mM Tris-HCl at pH 7.4 was used as a buffer in the experiments. The fluorescence intensity was measured for the optimization of GO concentration (Fig. 4a) using the SABP1–FAM concentration of 8.0 μM.
 | ||
| Fig. 4 (a) Relative recovery percentage showing difference depending on the presence or absence of toxin under various GO concentrations. (b) The degree of dispersion of the GO sheet according to sonication time (n = 3). | ||
To set the GO concentration that can best show the different working ranges of the sensor, GO concentration optimization was performed using the STX regulatory concentration of 800 ppb. As the GO concentration (0–100 μg mL−1) increased, the quenching efficiency gradually increased as it was more contactable with SABP1–FAM. However, since an excessive amount of quencher can absorb some of the excitation light and cause quenching through the absorption of the emitted light, the range of detectable toxin concentration displayed may be narrowed.30 Therefore, the GO concentration was selected as 40 μg mL−1 and used in further experiments. At the optimized peptide concentration of 8.0 μM, GO concentration (40 μg mL−1), and pH value (pH 7.4), the GO sonication time and LASER power of the multi-mode microplate reader used were optimized continuously.
First, since the quenching effect differs according to the dispersion degree of GO, the GO sonication time was determined through particle size analysis. As shown in Fig. 4b, it was confirmed that as the sonication time passed, the overlapping GO sheets were dispersed, and the approximate diameter of GO decreased. Therefore, in further experiments, the GO sonication time was fixed at 30 min.
When the LASER power is high, the photobleaching effect is large31 and the intensity decrease rate is large over time. Therefore, the LASER power optimization experiment was conducted to delay the photobleaching effect and set the fluorescence intensity constant before proceeding with the experiment. Fluorescence intensity was confirmed according to the gain value of the multi-mode microplate reader. As shown in Fig. 5, it was confirmed that the fluorescence intensity was saturated when irradiated with a certain amount of LASER at a gain value of 90. Therefore, a gain value of 90 was used in further experiments.
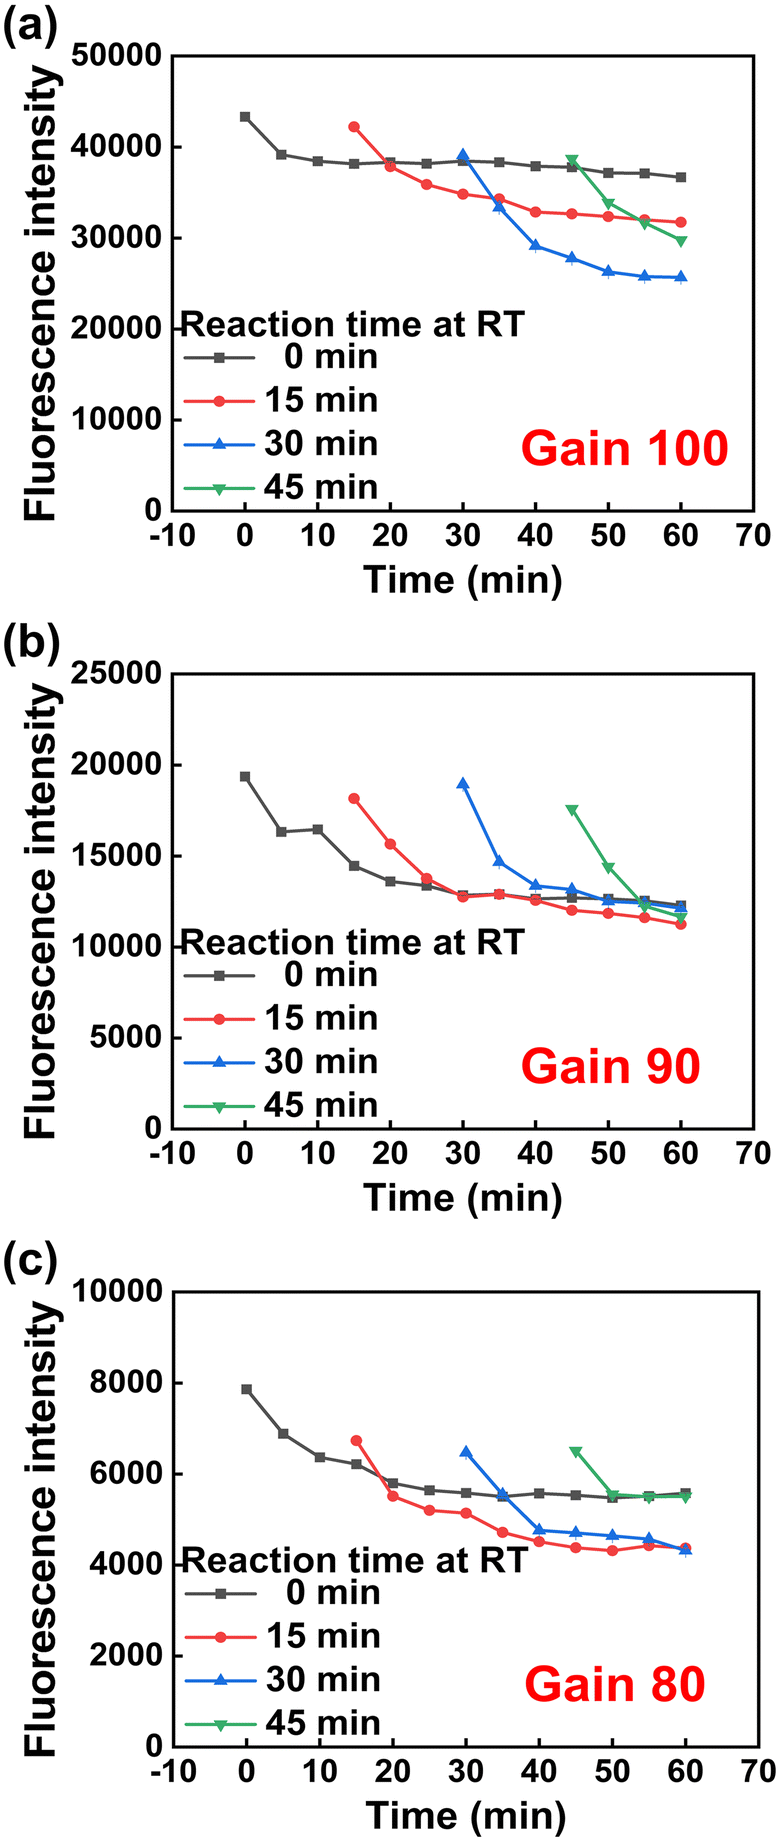 | ||
| Fig. 5 Fluorescence emission intensity of SABP1–FAM on reaction time, 0, 15, 30, and 45 min at 25 °C under various gain values, (a) 100, (b) 90, and (c) 80 of the multi-mode microplate reader (n = 3). | ||
3.4 Analysis of fluorometric sensor for STX
In the above-optimized conditions, the feasibility and sensitivity of the developed STX fluorometric sensor were demonstrated. The whole figure is expressed as a relative value calculated as F/F0. F and F0 are fluorescence intensities before and after the addition of GO, respectively. The fluorescence intensity of this was immediately confirmed by strong absorption in the presence of GO, confirming the fluorescence quenching ability of GO. STX interacted with SABP1–FAM for 30 min (SABP1–FAM + STX), and its fluorescence intensity did not differ from that of SABP1–FAM. This confirms that STX does not affect the fluorescence of SABP1–FAM. After interaction with STX, the sample with GO (SABP1–FAM + STX + GO) had a lower intensity than the sample with GO without STX (SABP1–FAM + GO). This is because the interaction with STX as well as GO and SABP1–FAM resulted in increased adsorption, and it was confirmed that there was no fluorescence of STX itself (Fig. 6a).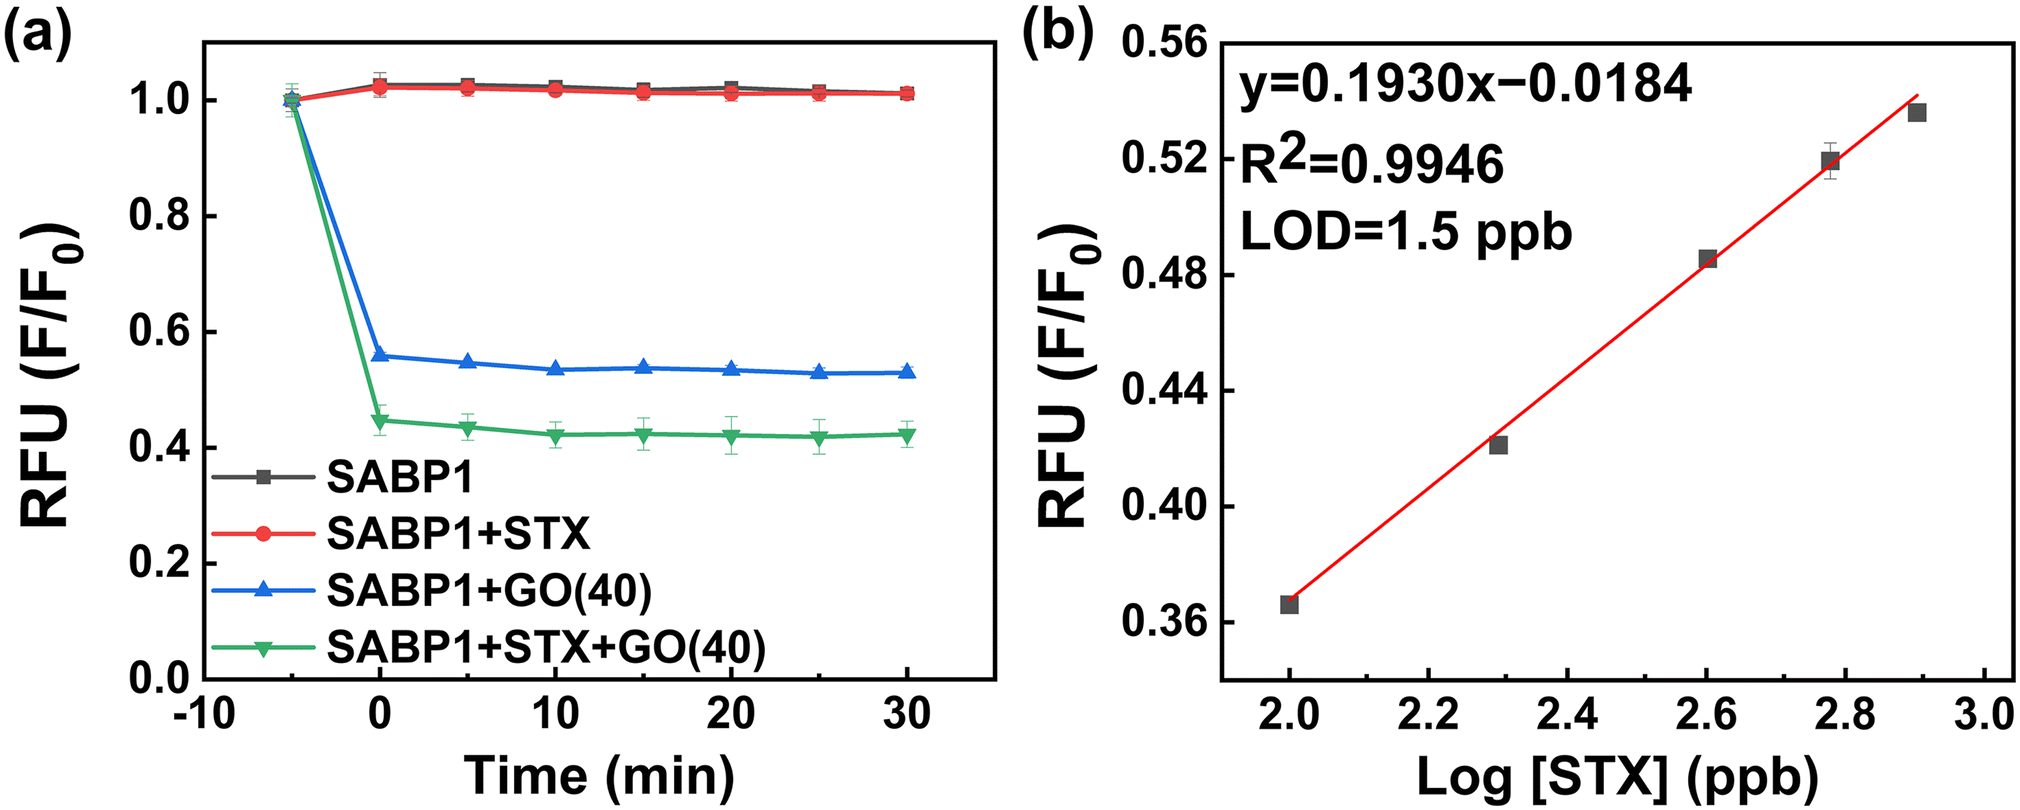 | ||
| Fig. 6 (a) Fluorescence emission intensity of sensing system under different environments. (b) Calibration curve for STX based on the developed fluorometric sensor (n = 3). | ||
The linear regression equation obtained based on these results is F/F0 = 0.1930 × log[STX] − 0.01834 (R2 = 0.9946; n = 3) (slope (S) = 0.1930 ± 0.0083 and intercept = −0.0184 ± 0.0213). The limit of detection (LOD) calculation formula is LOD = 10(3.3σ/S), and the standard deviation value (σ) of the blank was 0.0098. Thus, the calculated LOD is 1.5 ppb.
In the presence of SABP1–FAM and GO with binding buffer solution, the linearity of fluorescence response according to STX concentration was in the range of 0–800 ppb (Fig. 6b). The x-axis in Fig. 6b was drawn on a log scale, so the portion corresponding to 0 ppb was not shown.
Compared to previous studies, the developed STX fluorescence sensor showed a comparable detection range and LOD. Because electrochemical methods cannot handle a large amount of samples at once, we developed a system using a fluorescence detection method. This system offers a straightforward mixing process and immediate visual assessment, enabling the detection of numerous samples with minimal quantities. As described in Table 1, the LOD of our system is slightly higher compared to other studies. Nevertheless, our study boasts a wide detection range, capable of discerning both low and high concentrations, and exhibits the added benefit of swift detection due to the abbreviated analysis time.
| Detection method | Detection range (ppb) | LOD (ppb) | Detection time (min) | Ref. |
|---|---|---|---|---|
| STX-specific peptide-based fluorometric sensor | 0–800 | 1.5 | 10 | This study |
| Magnetic electrochemical immunosensor | 0.02–0.4 | 0.0012 | 75 | 32 |
| Wearable cardiomyocyte-based potential biosensor | 0.057–0.78 | 0.35 | 5 | 33 |
| Multiplex lateral flow assay | 2.5–65.0 | 1.1 | 45 | 34 |
| Graphene quantum dot-based fluorescence detection sensor | 0.1–100 | 0.035 | 50 | 35 |
| Electrochemical impedance biosensor | 0.3–30 | 0.30 | 60 | 36 |
Considering CRM is regarded essential for verification, the CRM for verification is similar in behavior to the real sample, and reliability can be confirmed instead of using the real sample. Therefore, to determine the practical applicability of the developed system, the recovery test of STX samples in CRM was applied. Based on the linear regression curves, the F/F0 value of the CRM sample was substituted into the equation, and assayed concentration and recovery value were calculated. As shown in Table S1,† the recovery range of the fluorometric sensor for STX was 92.9–102.1% with a low CV.
4. Conclusions
In summary, before developing this sensor, SABP1 was developed using phage display technology, and SABP1–FAM was produced by modifying it. Building upon this, we demonstrated the development of an STX fluorometric sensor using the GO-mediated quenching phenomenon. These sensor optimization conditions, such as peptide concentration, pH level, GO concentration, GO sonication time, and LASER power brought out the maximum performance for STX detection. The LOD of this sensor was 1.5 ppb, indicating good sensitivity, and all experiments used CRM samples, proving the reproducibility and reliability of the developed system. In addition, compared to previously reported studies on STX detection, this STX fluorometric sensor proved to be simpler to manage with large amounts of samples within a 10-minute period. Therefore, it is expected to produce good results in the food safety industry.Author contributions
Tae Hee Kim: conceptualization, methodology, investigation and writing – original draft. Chae Hwan Cho: methodology and resources. So Yeon Kweon: conceptualization, methodology and visualization. Su Min Kim: methodology. Suresh Kumar Kailasa: writing – review & editing. Jong Pil Park: methodology and resources. Chan Yeong Park: methodology and writing – review & editing. Tae Jung Park: supervision, writing – review & editing, project administration and funding acquisition.Conflicts of interest
There are no conflicts to declare.Acknowledgements
This work was supported by a grant (20163MFDS641) from the Ministry of Food and Drug Safety in 2023.Notes and references
- S. E. Shumway, Rev. Fish. Sci., 1995, 3, 1–31 CrossRef.
- S. E. Shumway and T. L. Cucci, Aquat. Toxicol., 1987, 10, 9–27 CrossRef.
- C. Shin, H. Jo, S.-H. Kim and G.-J. Kang, Food Res. Int., 2018, 108, 274–279 CrossRef CAS PubMed.
- J. Nicolas, R. L. A. P. Hoogenboom, P. J. M. Hendriksen, M. Bodero, T. F. H. Bovee, I. M. C. M. Rietjens and A. Gerssen, Glob. Food Sec., 2017, 15, 11–21 CrossRef.
- H. Wang, H. Kim, H. Park and J.-S. Ki, Sci. Total Environ., 2022, 802, 149801 CrossRef CAS.
- A. H. Abdulhussain, K. B. Cook, A. D. Turner, A. M. Lewis, M. A. Elsafi and D. J. Mayor, Harmful Algae, 2020, 98, 101890 CrossRef CAS.
- K. D. Cusick and G. S. Sayler, Mar. Drugs, 2013, 11, 991–1018 CrossRef CAS PubMed.
- S. Cestèle and W. A. Catterall, Biochimie, 2000, 82, 883–892 CrossRef.
- V. M. Bricelj, L. Connell, K. Konoki, S. P. MacQuarrie, T. Scheuer, W. A. Catterall and V. L. Trainer, Nature, 2005, 434, 763–767 CrossRef CAS PubMed.
- L. E. Llewellyn, Nat. Prod. Rep., 2006, 23, 200–222 RSC.
- M. H. Evans, Br. Med. Bull., 1969, 25, 263–267 CrossRef CAS PubMed.
- H. A. Bates and H. Rapoport, J. Agric. Food Chem., 1975, 23, 237–239 CrossRef CAS.
- X. Bai, W. Gong, Y. Guo, D. Zhu and X. Li, Analyst, 2023, 148, 2327–2334 RSC.
- A. I. Selwood, C. Waugh, D. T. Harwood, L. L. Rhodes, J. Reeve, J. Sim and R. Munday, Toxins, 2017, 9, 73 CrossRef.
- A. Robertson, D. Stirling, C. Robillot, L. Llewellyn and A. Negri, Toxicon, 2004, 44, 765–771 CrossRef CAS PubMed.
- S. M. Rodrigues, M. de Carvalho, T. Mestre, J. J. Ferreira, M. Coelho, R. Peralta and P. Vale, Toxicon, 2012, 59, 558–566 CrossRef CAS.
- R. Watanabe, T. Harada, R. Matsushima, H. Oikawa, Y. Oshima, M. Kaneniwa and T. Suzuki, Anal. Sci., 2014, 30, 931–936 CrossRef CAS.
- R. D. Josephs, M. Derbyshire, J. Stroka, H. Emons and E. Anklam, Toxicol. Lett., 2004, 153, 123–132 CrossRef CAS PubMed.
- J. Y. Hwang, S.-W. Lee, K. Kim, Y. Huh, E.-J. Yoo, B. Kim, H. J. Kim, H. Lee, S. H. Ko and J. Kim, Journal of Environmental Analysis, Health and Toxicology, 2019, 22, 104–116 CrossRef.
- T. Kodadek, M. M. Reddy, H. J. Olivos, K. Bachhawat-Sikder and P. G. Alluri, Acc. Chem. Res., 2004, 37, 711–718 CrossRef CAS PubMed.
- M. Coppock, B. Farrow, C. Warner, A. Finch, B. Lai, D. Sarkes, J. Heath and D. Stratis-Cullum, Peptide-based protein capture agents with high affinity, selectivity, and stability as antibody replacements in biodetection assays, SPIE, 2014.
- P. Zheng and N. Wu, Chem. – Asian J., 2017, 12, 2343–2353 CrossRef CAS PubMed.
- L. Wang, Y. Zhang, A. Wu and G. Wei, Anal. Chim. Acta, 2017, 985, 24–40 CrossRef CAS PubMed.
- H. Shi, J. Ding, T. Timmons and C. Adams, Harmful Algae, 2012, 19, 61–67 CrossRef CAS.
- M. Il Kim, C. Y. Park, J. M. Seo, K. S. Kang, K. S. Park, J. Kang, K. S. Hong, Y. Choi, S. Y. Lee and J. P. Park, ACS Appl. Mater. Interfaces, 2021, 13, 36697–36708 CrossRef CAS.
- C. V. Raju, Y. V. Manohara Reddy, C. H. Cho, H. H. Shin, T. J. Park and J. P. Park, Food Chem., 2023, 428, 136811 CrossRef CAS.
- R. Arppe, I. Hyppänen, N. Perälä, R. Peltomaa, M. Kaiser, C. Würth, S. Christ, U. Resch-Genger, M. Schäferling and T. Soukka, Nanoscale, 2015, 7, 11746–11757 RSC.
- J. Wang, T. Peng, X. Zhang, K. Yao, Y. Ke, B. Shao, Z. Wang, J. Shen and H. Jiang, Food Control, 2018, 94, 65–70 CrossRef CAS.
- S. Y. Kweon, J. P. Park, C. Y. Park and T. J. Park, BioChip J., 2022, 16, 207–213 CrossRef CAS.
- H. Gu, N. Duan, S. Wu, L. Hao, Y. Xia, X. Ma and Z. Wang, Sci. Rep., 2016, 6, 21665 CrossRef CAS PubMed.
- C. Kuang, D. Luo, X. Liu and G. Wang, Measurement, 2013, 46, 1393–1398 CrossRef.
- X. Jin, J. Chen, X. Zeng, L. Xu, Y. Wu and F. Fu, Biosens. Bioelectron., 2019, 128, 45–51 CrossRef CAS.
- Q. Wang, J. Fang, D. Cao, H. Li, K. Su, N. Hu and P. Wang, Biosens. Bioelectron., 2015, 72, 10–17 CrossRef CAS.
- C. Mills, M. J. Dillon, P. K. Kulabhusan, D. Senovilla-Herrero and K. Campbell, Environ. Sci. Technol., 2022, 56, 12210–12217 CrossRef CAS.
- H. Gu, L. Hao, H. Ye, P. Ma and Z. Wang, Microchim. Acta, 2021, 188, 1–9 CrossRef PubMed.
- P. C. Serrano, G. E. Nunes, L. B. Avila Jr, C. P. Reis, A. M. Gomes, F. T. Reis, M. L. Sartorelli, S. P. Melegari, W. G. Matias and I. H. Bechtold, Anal. Bioanal. Chem., 2021, 413, 6393–6399 CrossRef CAS PubMed.
Footnote |
| † Electronic supplementary information (ESI) available. See DOI: https://doi.org/10.1039/d3sd00295k |
| This journal is © The Royal Society of Chemistry 2024 |