 Open Access Article
Creative Commons Attribution 3.0 Unported Licence
Bead-enriched catalyzed hairpin assembly for the flow cytometric detection of microRNA via FRET signal readout†
Zhengkun
Dong
,
Wenjiao
Fan
*,
Wei
Ren
 and
Chenghui
Liu
 *
*
Key Laboratory of Applied Surface and Colloid Chemistry, Ministry of Education, Key Laboratory of Analytical Chemistry for Life Science of Shaanxi Province, School of Chemistry & Chemical Engineering, Shaanxi Normal University, Xi'an 710119, Shaanxi Province, P. R. China. E-mail: fanwj@snnu.edu.cn; liuch@snnu.edu.cn
First published on 2nd November 2023
Abstract
The accurate quantification of microRNAs (miRNAs) is of great significance for various biomedical applications. Herein, a facile bead-enriched catalyzed hairpin assembly (CHA) assay for flow cytometric miRNA analysis via fluorescence resonance energy transfer (FRET) signal readout is successfully developed. Different from the traditional homogeneous CHA strategies, the CHA reaction is confined on magnetic beads (MBs), so that even low levels of fluorescent dye can be enriched on the minuscule space around the MBs and then sensitively investigated by flow cytometry (FCM), resulting in the improvement of sensitivity. What's more, with the help of a robust FCM-based FRET signal output, the potential detection inaccuracy caused by the fluctuation of experimental conditions and instrument settings can be greatly decreased by recording the fluorescence intensity ratio of FAM and Cy3 instead of a single fluorescent dye. In this way, precise miRNA sensing with a detection limit of 0.7 pM is achieved, and the amount of miRNA target in complex total RNA is successfully analyzed. This work achieves FCM-assisted ratiometric fluorescence analysis of miRNAs, providing a new route for the DNA machine-based biosensing system.
Introduction
MicroRNAs (miRNAs) are short noncoding RNA molecules that play important roles in gene expression.1 Notably, increasing research evidence has suggested that aberrant miRNA expression is associated with the onset and progression of some diseases, including cardiovascular diseases and various cancers.2,3 Consequently, accurate quantification of miRNAs is essential for clinical diagnosis and prognosis. Over the last few decades, several techniques for miRNA analysis have been developed, including northern blotting and DNA microarrays.4–6 Given the low levels of miRNA in the early stage of diseases, series of nucleic acid amplification strategies have been introduced into the sensitive analysis of miRNA, which can be classified as enzyme-assisted and enzyme-free ones.7 Although quite effective, the enzyme-assisted nucleic acid amplification reactions have their own limitations. For instance, to guarantee the activity of the enzymes, stringent reaction conditions are required, such as biological buffers and certain reaction temperatures.8,9In contrast to the enzyme-assisted nucleic acid amplification strategies, the enzyme-free ones are endowed with some inherent advantages, including simple operation, high stability, easy accessibility, etc.10 Therefore, various enzyme-free nucleic acid amplification strategies have been developed, such as hybridization chain reaction (HCR),11 catalyzed hairpin assembly (CHA),12 and entropy-driven catalysis (EDC).13 Among them, the CHA, in which single stranded DNA or RNA is cyclically used to catalyze the strand displacement of two stem-loop probes, has been widely used in biomarker detection.14–17
Benefiting from the inherent advantages of fluorescence analysis, including the simplicity of operation, the high sensitivity and the adaptability to various optical instruments,18 it has been employed as the main signal analysis method in CHA-based strategies.19 Despite showing good performance, they face some difficulties. On the one hand, most of them employ only one single fluorescent dye as the signal, whose reliability may be easily disturbed by external factors, such as the complex matrix medium and the potential intensity fluctuation of the excitation light sources.20 On the other hand, in the traditional fluorescence-based CHA strategies, the fluorescence signal produced by the target is always dispersed into a large volume of solution, resulting in the dilution of the signal and limitation of detection sensitivity.21
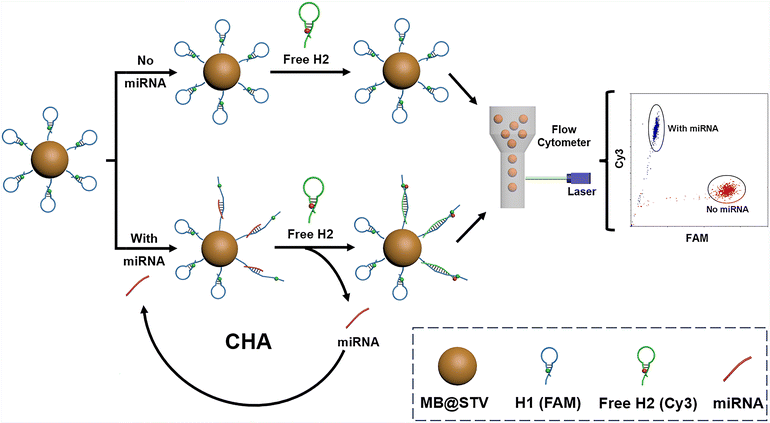
Herein, we proposed a bead-enriched CHA signal amplification assay for the flow cytometric detection of miRNAs by introducing on-bead fluorescence resonance energy transfer (FRET) as a signal readout mode. This approach provides several advantages. First, the signal amplification is achieved by the enzyme-free CHA reaction, which simplifies the experimental process and overcomes the shortcomings of enzyme-catalyzed amplification reactions. Second, different from the homogeneous CHA,22 the target-initiated CHA reactions in this study are all enriched in the tiny space around micron-sized magnetic beads (MBs). Particularly, unlike the traditional bulk measurement by recording the fluorescence signal of the whole solution,23,24 in this study, the minuscule sized MBs bearing enriched fluorophores are investigated as separate reaction units one-by-one through a flow cytometer (FCM), thus even very weak fluorescence signals can be detected. Third, an on-bead FRET readout mode is introduced to be monitored by versatile FCM. In this way, the miRNA can be ratiometrically sensed via simultaneously monitoring the fluorescence intensity of two dyes, offering intrinsic signal correction and avoiding false positive results caused by the complex biological matrix.25,26
Experimental section
Materials and reagents
Dynabeads M-270 Streptavidin (STV-MBs, diameter 2.8 μm) were purchased from Thermo Fisher Scientific (Invitrogen). All of the nucleic acid molecules, including miRNAs and hairpin DNA probes, were custom synthesized by Sangon Biological Engineering Technology and Services Co. Ltd. (Shanghai, China), whose detailed sequences are listed in Table S1.† Saline sodium phosphate (SSPE) buffer (20×, 200 mM phosphate buffer containing 3 M NaCl and 20 mM EDTA, pH 7.4) and Tween-20 were purchased from Sangon Biological Engineering Technology and Services Co. Ltd. All the solutions used for miRNA analysis were prepared with RNase-free water, which was obtained from TaKaRa Bio Inc. (Dalian, China).Standard procedures of the bead-enriched CHA for miRNA analysis
Before use, H1 and free H2 were separately annealed in 5× SSPE using the following procedure: 95 °C for 5 minutes, 80 °C for 5 minutes, 75 °C for 10 minutes, 70 °C for 10 minutes, 65 °C for 10 minutes, 60 °C for 5 minutes, and 25 °C for 20 minutes. Then, in 100 μL of 4× SSPE buffer solution, 5 nM H1 and 2 μL slurry of the STV-MBs were mixed. The mixture was stirred for 0.5 hours at room temperature to produce H1-MBs. The H1-MBs were magnetically purified and dispersed in 10 μL of 4× SSPE buffer for further use. Typically, 1 μL of the abovementioned H1-MBs (∼1.2 × 10⁵ beads) was mixed with 50 nM free H2 and different concentrations of let-7a in a final 10 μL of 4× SSPE buffer solution. When ∼2.4 × 10³ beads were employed, the above prepared H1-MBs were diluted 50 times, and 1 nM free H2 was used. The mixture was incubated at 37 °C for 3 hours to conduct the CHA reaction. Finally, the reaction mixture was diluted to 500 μL 1 × PBS and analyzed using a flow cytometer. Unless otherwise stated, the fluorescence signals of 10![[thin space (1/6-em)]](https://www.rsc.org/images/entities/char_2009.gif) 000 MBs (1000 MBs when ∼2.4 × 10³ beads are employed) for each sample were monitored at the FL1 (FAM) and FL2 (Cy3) channels under 488 nm excitation. The quantification of the target miRNA in each sample was achieved by evaluating the mean fluorescence intensity (MFI) of the detected MBs.
000 MBs (1000 MBs when ∼2.4 × 10³ beads are employed) for each sample were monitored at the FL1 (FAM) and FL2 (Cy3) channels under 488 nm excitation. The quantification of the target miRNA in each sample was achieved by evaluating the mean fluorescence intensity (MFI) of the detected MBs.
Results and discussion
Principle of the bead-enriched CHA assay
Scheme 1 illustrates the working principle of the bead-enriched CHA assay for miRNA detection, and the detailed miRNA-initiated CHA process based on the toehold-mediated strand displacement is illustrated in Fig. S1.† Initially, H1 (a FAM-labeled probe that acts as a FRET donor) is anchored onto STV-MBs through STV–biotin interaction. If let-7a is present, it hybridizes with the toehold of H1 and unfolds the hairpin structure. Subsequently, the unfolded H1 can further hybridize with free H2 (a Cy3-labeled probe that acts as a FRET acceptor), allowing let-7a to re-enter into the solution. Then, the released let-7a will act as a new catalyst to initiate another round of CHA on the surface of MBs. In this way, each let-7a can generate a large number of H1/H2 duplexes on MBs, in which FAM and Cy3 are close together, generating an obvious FRET signal. As a result, the miRNA can be quantified by monitoring the FRET signals with FCM. | ||
| Scheme 1 Schematic of the bead-enriched CHA strategy for the flow cytometric FRET detection of miRNAs. | ||
Optimization of experimental conditions
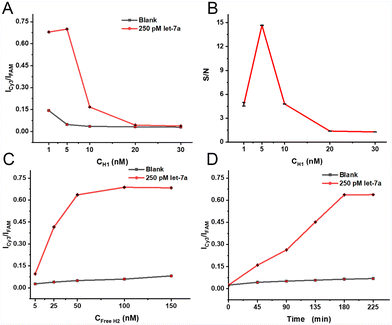
In order to achieve the optimal analytical performance, optimization of experimental conditions was conducted, which involved the concentration of H1 and free H2, as well as the reaction time. The loading density of H1 on the MBs plays an important role in determining the signal intensity. Therefore, the concentration of H1 was firstly optimized with other experimental conditions kept consistent. As can be seen from Fig. 1A, as the H1 concentration increases, the let-7a-produced FRET signal (relative fluorescence intensity of cy3 to FAM, Icy3/IFAM) firstly increases faintly, and then decreases when the concentration of H1 exceeds 5 nM, probably because the excessive H1 loaded on the MBs may partially lead to steric hindrance. Additionally, the level of H2 hybridized with the H1 is rather low, especially when the miRNA target is at a low concentration. Hence, the value of ICy3/IFAM can be also greatly decreased at a high concentration of H1. According to Fig. 1B, the signal-to-noise ratio (designated as S/N) reaches a maximum at 5 nM H1, so 5 nM is selected as the optimized H1 concentration for the experiment.In addition, the concentration of free H2 in the reaction system also affects the signal intensity. With the increase of free H2, the interaction efficiency between free H2 and H1 on MBs will be higher, along with a stronger background signal. Therefore, different concentrations of free H2 are added to evaluate the FRET signal intensity of the bead-enriched CHA reaction at 5 nM H1. As shown in Fig. 1C, the let-7a-induced FRET signal increases with the free H2 increasing from 5 nM to 50 nM, and when the concentration of free H2 further increases, the let-7a-produced FRET signal changes weakly while the blank signal continues to increase gradually. Therefore, 50 nM is selected as the optimal concentration of free H2 in this work.
The CHA reaction time is further investigated to achieve the optimal amplification performance at the optimized concentration of H1 and free H2. As shown in Fig. 1D, the let-7a-produced FRET signal increases over time until 180 minutes, and the blank signal remains almost constant. Therefore, the CHA reaction is conducted for 3 hours.
Analytical performance of the bead-enriched CHA assay
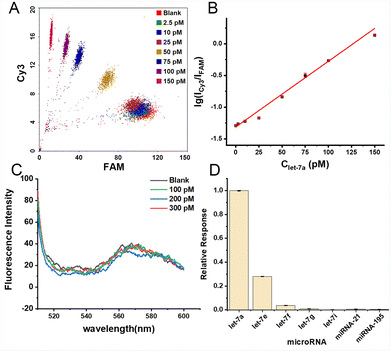
Under the optimized experimental conditions, different concentrations of let-7a were introduced to assess the analytical performance of the proposed bead-enriched CHA assay. As shown in Fig. S2,† the FRET signal continuously rises with the concentration of let-7a increasing from 50 pM to 300 pM by using ∼1.2 × 10⁵ beads. It is noted that the FRET signal produced by as low as 50 pM let-7a can be well separated from the blank signal. In addition, in the case that the density of the H1 probe on the beads is fixed, fewer beads will lead to a higher loading efficiency of the miRNA target (miRNA per bead), resulting in more CHA reaction on each single bead. In this work, the miRNA target is quantified by investigating the beads bearing the enriched fluorophores as separate reaction units one-by-one through flow cytometry, thus a low number of beads is better for the sensitive detection. However, it is noteworthy that using an extremely low amount of beads might result in poor reproducibility of detection. We found that the lowest detection limit with a high accuracy of the experiment can be attained by using approximately 2.4 × 10³ beads and collecting the FRET signals of 1000 MBs for each sample. As shown in Fig. 2A and S3,† as low as 2.5 pM (absolutely 25 amol) let-7a-produced FRET signal can be reliably discriminated from the blank sample. The lg(ICy3/IFAM) signal is linearly proportional to the let-7a concentration as shown in Fig. 2B. The corresponding linear regression equation is lg(ICy3/IFAM) = 0.0104Clet-7a (pM) − 1.3126 (R2 = 0.9961), and the detection limit is calculated to be 0.7 pM according to the 3σ criterion (see details in the ESI†). Furthermore, the comparison of the analytical performance of our assay to other representative CHA-based methods is listed in Table S3.†Compared with the traditional CHA-based strategies that typically detect the fluorescence signal dispersed in a homogeneous solution with a fluorescence spectrometer, this bead-based CHA assay can achieve a higher sensitivity. That is because a small amount of MBs is employed and the target-produced signal is enriched on the confined surface of these MBs which can be effectively monitored by FCM as individual units, resulting in much higher sensitivity. To evaluate the advantage of this bead-enriched CHA assay, a contrast experiment is designed, in which the CHA reaction is conducted in the homogeneous solution and the FRET signal is bulk measured by using fluorescence spectroscopy with the same amount of H1 and H2 as those used in the bead-enriched assay by the use of ∼2.4 × 10³ beads. As can be seen in Fig. 2C, the signals are almost undetectable because the low level let-7a-produced fluorescence signals are distributed into a large volume solution. Therefore, compared with the CHA reaction in homogeneous solution, higher detection sensitivity can be achieved with the bead-enriched CHA assay.
To investigate the specificity of the proposed bead-enriched CHA assay, 250 pM different types of miRNAs such as let-7e, let-7f, let-7g, let-7i, miRNA-21, and miRNA-195 are selected and evaluated by the use of let-7a-specific probes. As shown in Fig. 2D, only let-7e (one-base different) generates obvious interference for let-7a analysis. This is because only through the hybridization mechanism, although sometimes sequence-dependent, it is quite challenging to fully discriminate the quite similar homologous miRNA sequences with only one-base difference.27–29 The detection of let-7a will not be interfered with heterologous nucleic acids; however, as to other potential practical application scenarios that are conducted in more complex reaction systems, the potential interference of quite similar homologous miRNA species should be taken into consideration.
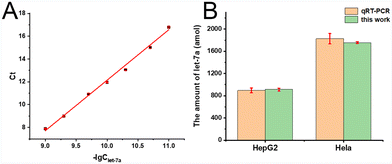
In addition, we implement the proposed bead-enriched CHA assay for quantifying let-7a in total RNA extracted from HepG2 cells and HeLa cells. Following the standard assaying procedures established, the bead-enriched CHA assay indicates that the amount of let-7a in 1 μg total HepG2 and HeLa RNA samples is 910 amol and 1.75 fmol, respectively. Moreover, the standard quantitative real-time polymerase chain reaction (qRT-PCR) method was employed to determine the let-7a level in the same batches of total HepG2/HeLa RNA samples. Firstly, Ct values were obtained from the StepOne Real-Time PCR system (Applied Biosystems, U.S.A.) and applied to construct a calibration curve against the logarithm of synthetic standard let-7a concentrations (Fig. 3A). According to the constructed calibration curve, the amount of let-7a in 1 μg total HepG2 and HeLa RNA samples was determined to be 895 amol and 1.82 fmol, respectively. As can be seen in Fig. 3B, the results of RT-PCR are in good agreement with the proposed bead-enriched CHA assay, indicating that the bead-enriched CHA assay is reliable for the quantification of miRNAs in complex samples.
Conclusions
In summary, a new bead-enriched assay combining CHA signal amplification and FRET signal readout was successfully developed for the flow cytometric detection of miRNAs. Benefiting from the FCM-assisted FRET signal output, the potential detection error caused by the fluctuation of experimental conditions and instrument settings can be greatly eliminated. In addition, the CHA reaction is spatially conducted on MBs rather than in homogeneous solution, enriching the fluorescence signal and improving the detection sensitivity. Therefore, let-7a sensing with a low detection limit of 0.7 pM is achieved, and the amount of let-7a in complex total RNA is reliably analyzed. We believe that this on-bead CHA strategy integrated with flow cytometric FRET signal readout may provide a new choice for fabricating sensitive bioassays.Author contributions
Z. Dong: conceptualization, investigation, validation and writing – original draft. W. Fan: visualization, writing – review & editing and funding acquisition. W. Ren: resources and data analysis. C. Liu: methodology, supervision, writing – review & editing and funding acquisition.Conflicts of interest
There are no conflicts to declare.Acknowledgements
This work was supported by the National Natural Science Foundation of China (22074088), the Program for Changjiang Scholars and Innovative Research Team in University (IRT_15R43), the Innovation Capability Support Program of Shaanxi (No. 2021TD-42), and the Fundamental Research Funds for the Central Universities (GK202101001, GK202304009).Notes and references
- D. P. Bartel, Cell, 2004, 116, 281–297 CrossRef CAS PubMed.
- R. I. Gregory, K.-P. Yan, G. Amuthan, T. Chendrimada, B. Doratotaj, N. Cooch and R. Shiekhattar, Nature, 2004, 432, 235–240 CrossRef CAS.
- J. V. Tricoli and J. W. Jacobson, Cancer Res., 2007, 67, 4553–4555 CrossRef CAS PubMed.
- É. Várallyay, J. Burgyán and Z. Havelda, Nat. Protoc., 2008, 3, 190–196 CrossRef PubMed.
- T. Yang, M. Zhang and N. Zhang, BMC Genomics, 2022, 23, 66 CrossRef CAS PubMed.
- G. L. Argraves, J. L. Barth and W. S. Argraves, Bioinformatics, 2003, 19, 2473–2474 CrossRef CAS PubMed.
- Y. X. Chen, K. J. Huang and K. X. Niu, Biosens. Bioelectron., 2018, 99, 612–624 CrossRef CAS PubMed.
- A. Suea-Ngam, L. Bezinge, B. Mateescu, P. D. Howes, A. J. deMello and D. A. Richards, ACS Sens., 2020, 5, 2701–2723 CrossRef CAS PubMed.
- J. G. Zhao, C. P. Fu, C. Huang, S. B. Zhang, F. F. Wang, Y. Zhang, L. N. Zhang, S. G. Ge and J. H. Yu, Chem. Eng. J., 2021, 406, 126892 CrossRef CAS.
- E. H. Xiong, D. S. Zhen and L. Jiang, Chem. Commun., 2018, 54, 12594–12597 RSC.
- H. Chai, W. B. Cheng, D. Y. Jin and P. Miao, ACS Appl. Mater. Interfaces, 2021, 13, 38931–38946 CrossRef CAS.
- T. J. Xie, Y. X. Liu, J. L. Xie, Y. J. Luo, K. Mao, C. Z. Huang, Y. F. Li and S. J. Zhen, Chemosensors, 2022, 10, 501 CrossRef CAS.
- C. Zhang, Z. Y. Wang, Y. Liu, J. Yang, X. X. Zhang, Y. F. Li, L. Q. Pan, Y. G. Ke and H. Yan, J. Am. Chem. Soc., 2019, 141, 17189–17197 CrossRef CAS.
- S. Z. Yue, X. Y. Song, W. L. Song and S. Bi, Chem. Sci., 2019, 10, 1651–1658 RSC.
- Q. Liu, Y. Y. Huang, Z. P. Li, L. L. Li, Y. L. Zhao and M. Y. Li, Angew. Chem., Int. Ed., 2022, 61, e202214230 CrossRef CAS PubMed.
- W. Wang, Y. Li, A. Nie, G.-C. Fan and H. Han, Analyst, 2021, 146, 848–854 RSC.
- J. Wang, Y. Sun, C. Lau and J. Lu, Anal. Bioanal. Chem., 2020, 412, 3019–3027 CrossRef CAS PubMed.
- Y. X. Ma, Q. H. Chen, X. Y. Pan and J. Zhang, Top. Curr. Chem., 2021, 379, 10 CrossRef CAS PubMed.
- Y. Zhang, Y. Wu, S. Luo, C. Yang, G. Zhong, G. Huang, X. Zhang, B. Li, C. Liu, L. Li, X. Yan, L. Zheng and B. Situ, ACS Sens., 2022, 7, 1075–1085 CrossRef CAS PubMed.
- A. P. Demchenko, Methods Appl. Fluoresc., 2023, 11, 033001 CrossRef.
- Z. Luo, Y. Li, P. Zhang, L. He, Y. Feng, Y. Feng, C. Qian, Y. Tian and Y. Duan, TrAC, Trends Anal. Chem., 2022, 151, 116582 CrossRef CAS.
- C.-H. Zhang, Y. Tang, Y.-Y. Sheng, H. Wang, Z. Wu and J.-H. Jiang, Chem. Commun., 2016, 52, 13584–13587 RSC.
- J. Yu, L. Qi, S. Zhao, X. Zhang, X. Shang, X. Hu, L. Chen, D. Wang, Y. Jiang and Y. Du, Analysis Sensing, 2023, e202300011 CrossRef.
- J. Wu, Y. Tian, L. He, J. Zhang, Z. Huang, Z. Luo and Y. Duan, Analyst, 2021, 146, 3041–3051 RSC.
- L. L. Wu, C. S. Huang, B. Emery, A. C. Sedgwick, S. D. Bull, X. P. He, H. Tian, J. Yoon, J. L. Sessler and T. D. James, Chem. Soc. Rev., 2020, 49, 5110–5139 RSC.
- Y. L. Wu, S. L. Huang, F. Zeng, J. Wang, C. M. Yu, J. Huang, H. T. Xie and S. Z. Wu, Chem. Commun., 2015, 51, 12791–12794 RSC.
- Z. Cai, Y. Song, Y. Wu, Z. Zhu, C. James Yang and X. Chen, Biosens. Bioelectron., 2013, 41, 783–788 CrossRef CAS.
- F. Xu, Z. Qiao, L. Luo, X. He, Y. Lei, J. Tang, H. Shi and K. Wang, Talanta, 2022, 243, 123323 CrossRef CAS.
- H. Xu, D. Wu, Y. Zhang, H. Shi, C. Ouyang, F. Li, L. Jia, S. Yu and Z.-S. Wu, Sens. Actuators, B, 2018, 258, 470–477 CrossRef CAS.
Footnote |
| † Electronic supplementary information (ESI) available. See DOI: https://doi.org/10.1039/d3sd00287j |
| This journal is © The Royal Society of Chemistry 2024 |


