 Open Access Article
Development of a peptide-based lateral flow assay for the detection of the cancer biomarker Mdm2†
Bryan
Gosselin
ab,
Maurice
Retout
 a,
Ivan
Jabin
 *b and
Gilles
Bruylants
 *a
*a
aEngineering of Molecular NanoSystems, Ecole Polytechnique de Bruxelles, Université Libre de Bruxelles (ULB), Avenue F. D. Roosevelt 50, CP165/64, B-1050 Brussels, Belgium. E-mail: gilles.bruylants@ulb.be
bLaboratoire de Chimie Organique, Université Libre de Bruxelles (ULB), Avenue F. D. Roosevelt 50, CP160/06, B-1050 Brussels, Belgium
First published on 22nd November 2023
Abstract
This study introduces peptide aptamers as a promising alternative to conventional antibodies for use as recognition units in lateral flow assays (LFAs). Two distinct strategies for immobilizing peptides onto nitrocellulose (NC) membranes were investigated: the first involved covalent coupling to bovine serum albumin (BSA) using EDC/sulfo-NHS chemistry, while the second utilized the well-known biotin/streptavidin complexation method. The former strategy only requires the addition of a lysine in the peptide sequence, while the latter exploits a commercially widely available chemical modification of these biomolecules. Both methods proved successful in immobilizing the capture probes onto the surface. Furthermore, we employed silver nanoplates functionalized with calixarenes as colorimetric reporters, that we have shown recently to exhibit excellent characteristics for LFAs, including high absorption coefficient, excellent stability, and strong contrast with the NC membrane. The peptide-based assay detected Mdm2, a well-established cancer biomarker, in low nanomolar range even in complex matrixes such as cell lysates. Notably, the utilization of peptide aptamers demonstrated superior performance and extended shelf life compared to polyclonal antibodies, underlining their potential as recognition units in LFAs. In addition to their ease of handling, peptide aptamer utilization also offers the prospect of substantial cost reductions compared to conventional antibody-based LFAs. This comprehensive approach enhances the utility of LFAs for the sensitive and cost-effective detection of target proteins using peptide aptamers as recognition units both on the colorimetric reporter and the membrane, opening doors to broader applications in biomarker analysis and diagnostic assays.
Introduction
Lateral flow assays (LFAs) have gained increasing attention in recent years due to their numerous advantages, including low-cost, simplicity, portability, minimal sample preparation, rapid response, and convenience.1 LFAs have emerged as one of the fastest growing tools for on-site diagnostics,2 with tests developed to detect various analytes such as proteins, biomarkers, or DNA.3–6 Typically, LFAs are based on the immobilization of colorimetric reporters, such as gold nanoparticles (AuNPs), on the test line in the presence of a target analyte. The naked-eye readout is generally sufficient for qualitative analysis. However, quantification with smartphone readout or artificial intelligence are reported for reliable and quantitative LFAs.7–9Selectivity in a lateral flow assay (LFA) is primarily achieved through careful design and choice of the recognition elements used to functionalize the colorimetric reporter and/or the membrane. Selecting an appropriate recognition unit is therefore a key parameter for LFA optimization. Classically, the recognition unit conjugated to the colorimetric reporter is named “detector reagent” whereas the one immobilized on the membrane is called “capture reagent”. Although antibodies are commonly chosen as recognition units for their versatility against a wide array of targets,10 they suffer from several drawbacks, including large molecular size, stability issues, poor control of their orientation on surfaces, batch-to-batch variations, and high cost.11,12 Consequently, interest has grown in exploring alternatives, such as small molecules like DNA aptamers (15–100 bases) or peptide aptamers (10–30 a.a.).13,14 Aptamers often exhibit affinity for their target comparable to antibodies (108–109 M−1) and can be reproducibly synthesized at a low cost. Compared to nucleic acid aptamers, peptide aptamers offer a broader range of functional groups, which can facilitate their attachment to surfaces, improve their interaction with the target, or broaden the potential range of applications. While a few LFAs employing DNA aptamers are reported in literature, they tend to be complex and not designed as classic sandwich format assays.15,16 Peptides-based examples are sparsely described and generally also involve antibodies.17,18 To our knowledge, despite their numerous advantages, only two examples of LFAs solely using peptide aptamers as recognition units have been described in the literature.19,20
In this study, we present an innovative approach based on the development of a dipstick assay using peptide aptamers as recognition units on both the membrane and the nanoparticles for detecting the biomarker Mdm2. This protein is of considerable interest in oncology for its role as a p53 inhibitor, a protein acting as a tumor suppressor,21 and its overexpression is often associated with cancer development.22 In a previous study, we developed an immunoturbidimetry assay for Mdm2 detection based on the aggregation of AuNPs functionalized with peptide aptamers.14 Recently, we improved the limit of detection of the system by replacing the AuNPs with silver nanoparticles protected by a calixarene layer.23 The higher extinction coefficient of AgNPs compared to their gold counterparts allowed us to work with a smaller quantity of material, while the calixarene coating provided the necessary stability for use in biological conditions. Despite these improvements, immunoturbidimetry assays are still susceptible to false positives, as factors other than the presence of the target analyte can cause particles aggregation, leading to misinterpretation of the results. Consequently, we sought to develop a lateral flow-type assay, as it should be less sensitive to stability issues of the colloidal suspensions, for Mdm2 detection based on calixarenes-coated triangular silver nanoplates (AgNPls). Indeed, AgNPls stand out as excellent candidates as colorimetric reporters, exhibiting superior optical properties than standard isotropic gold or silver nanoparticles. Furthermore, their absorption properties can be tailored by adjusting their size, making them particularly attractive for the development of multiplex LFAs (xLFAs).24,25 However, anisotropic nanostructures possess higher surface area-to-volume ratios than their spherical counterparts, rendering them less stable.26 Therefore, AgNPls are scarcely exploited in biosensing applications, as they are susceptible to etching or degradation triggered by changes in their environment, such as an increase in ionic strength, a modification of the pH, or the presence of specific biological molecules. To the best of our knowledge, only one other example of AgNPls application in LFAs has been reported in the literature (excluding our recent work).27
We recently demonstrated the high stability of AgNPls coated with calix[4]arenes bearing four carboxyl groups and their huge potential as colorimetric reporters.28 The coating can be readily obtained through the irreversible reduction of calix[4]arene-tetradiazonium salts,29,30 resulting in a robust and thin organic monolayer (typically around 2 nm in thickness).31,32 By selecting silver nanostructures with a blue color, which provides excellent contrast with the assay membrane, we could for example increase 20 times the sensitivity of a LFA intended to detect anti-SARS-CoV-2 IgG in human plasma compared to gold nanoparticles. We therefore envisaged them as promising colorimetric reporters for the development of our dipstick assay.
Our Mdm2 detection test could be of great interest for researchers needing a rapid and quantitative detection of this protein in biological samples. It could emerge as a viable alternative to the laborious ELISA or western blot tests, which are currently the standard techniques for detecting abnormal levels of this protein in biological samples.33
Results and discussion
Preparation and characterization of AgNPls-X4–p53
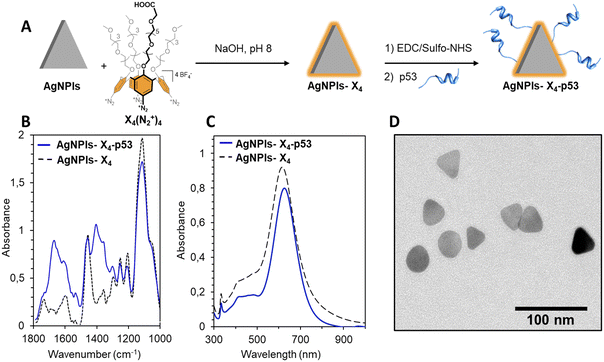
AgNPls were synthesized according to a reported procedure consisting in the addition of controlled mixtures of reducing (e.g. trisodium citrate, ascorbic acid or NaBH4) and oxidizing agents (e.g. hydrogen peroxide) to AgNO3.34 The as-synthesized AgNPls were then stabilized through the reductive grafting of calix[4]arene-tetradiazonium salt X4(N2+)4 on their surface, leading to nanostructures AgNPls-X4 (Fig. 1A). Calix[4]arene X4(N2+)4 was chosen as it combines i) a conjugable carboxyl group and ii) polyethylene glycol chains that should prevent nonspecific protein adsorption on the particles, which is essential when working with biological samples.35The characterization of AgNPls-X4 by ATR-FTIR spectroscopy confirmed the grafting of the calixarene (characteristic bands at ca. 1450 and 1105 cm−1 for the aromatic ring stretching and the symmetric COC stretching of polyethylene glycol, respectively) (Fig. 1C). The average edge length of AgNPls-X4 was determined to be 36 ± 3 nm by Transmission Electron Microscopy (TEM) (>100 particles analysed) (Fig. 1D). It is noteworthy that a significant amount of nanodiscs was observed, likely due to the triangular shape instability of the nanoplates under the energetic electron beam (Fig. S1†). As anticipated, the calix[4]arene-based coating provided remarkable colloidal and chemical stabilities to the nanoplates, as illustrated by their tolerance to high PBS concentrations (i.e. 1×) compared to naked AgNPls (Fig. S2†).28
Peptide aptamers p14 and p53 were selected for the design of the LFA, as they were already used with success in a dual-trapping assay for Mdm2 protein detection (see Fig. S3† for the sequences of the aptamers).14 We decided to conjugate the p53 peptide to AgNPls-X4 (detector reagent), and to couple the p14 peptide to an anchoring protein (capture reagent) for deposition on the nitrocellulose (NC) membrane. Conjugation of the p53 aptamer was achieved through the classical two-step EDC/sulfo-NHS procedure (Fig. 1A). The resulting AgNPls-X4–p53 were cleaned through centrifugation cycles in presence of a surfactant to remove any non-covalently bound peptide. UV-vis spectroscopy analysis revealed a sharp and intense LSPR band with a maximum of absorbance at 616 nm (Fig. 1C). The high similarity between the UV-vis spectra of AgNPls-X4 and AgNPls-X4–p53 indicates that the nanoplates did not aggregate upon conjugation of the peptide. A similar behavior was observed in the presence of 1× PBS was observed (Fig. S2c†), confirming their high stability. Finally, IR spectroscopy showed the presence of amide I and II bands (at 1650 and 1530 cm−1, respectively) after the bioconjugation (see Fig. S4† for the IR spectrum of the p53 peptide), confirming the presence of the p53 aptamer on the AgNPl surface (Fig. 1B). DLS and zeta measurements of AgNPls-X4 and AgNPls-X4–p53 are presented in Table S1.†
For comparison purpose, a detector reagent based on spherical silver nanoparticles (AgNPs) functionalized subsequently with X4(N2+)4 and p53 peptides was also developed using similar procedures (see Fig. S5† for the characterization of the resulting AgNPs-X4–p53).
Design and preliminary evaluation of the dipstick assay
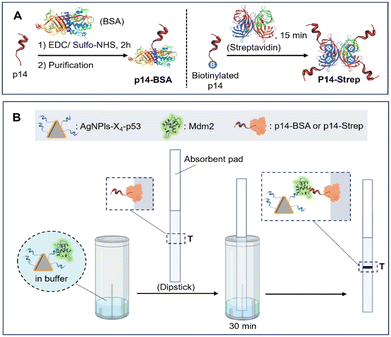
The next step was to develop a strategy for the immobilization of the p14 peptide on the NC membrane test line (T). This step was far from trivial as the small molecular weight of the p14 peptide (2372 g mol−1) prevented its direct immobilization on the membrane. Indeed, the immobilization of the capture reagent is mainly due to the van der Waals interactions that it can form with the nitrocellulose membrane and is therefore related to its molecular weight. Molecules with a low molecular weight will only interact with the membrane with a low binding energy and will flow out of the test line (T line) during the assay, leading to unreliable results. Therefore, two strategies were investigated and compared (Scheme 1) to anchor the p14 peptide to the NC membrane:i) “p14–BSA system”: coupling of the p14 peptide to bovine serum albumin (BSA) via the classical EDC/sulfo-NHS procedure. This was made possible due to the addition of a lysine at the C-terminal extremity of the p14 aptamer sequence. After purification on a Sephadex column and dialysis, the resulting p14–BSA conjugate was dispensed on the test line.
ii) “p14–Strep system”: this strategy consisted in the conjugation of a biotinylated p14 aptamer to streptavidin in controlled ratios before dispensing the resulting p14–Strep complex on the test line. This approach presents the advantage of avoiding the use of chemicals and purification steps for the preparation of the conjugate. Moreover, streptavidin presents four binding sites for biotin, enabling to tune the number of p14 peptides per protein.
In both cases, the NC membranes were dried during one hour at 40 °C after deposition of the p14–protein systems and cut into 5 mm dipsticks after addition of the absorbent pad. The performances of the resulting dipsticks obtained according to the two different immobilization strategies of the p14-aptamer were then evaluated (Scheme 1B). Noteworthy, only one line is dispensed on the NC membrane, corresponding to the test line. The AgNPls were in suspension and not dried on a conjugate pad, therefore the normal functioning of the assay is controlled by checking that the entire sample is absorbed but also by the light blue coloring of the absorbent pad. Suspensions of AgNPls-X4–p53 were diluted in a running buffer, either spiked with Mdm2 (at a final concentration of 8 nM) or not. The composition of the running buffer was optimized to minimize non-specific interactions and corresponded to 5 wt% BSA, 1 wt% PEG6000, 0.4 wt% Tween 20, 0.25 wt% sodium deoxycholate, 1 mM EDTA, 100 mM KCl and 25 mM TRIS·HCl at pH 8 (see Fig. S6 and S7 and Table S2† for optimization). The dipsticks were immersed for 30 min in these mixtures and then analyzed with the naked eye. Pictures were also taken with a camera and analyzed with the ImageJ software.
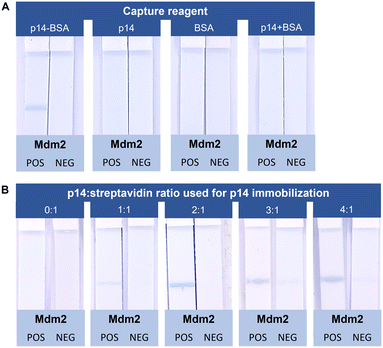
For the p14–BSA system, a blue line was clearly observed in the presence of Mdm2 (POS vs. NEG strips) (Fig. 2A). None of the control experiments, i.e. when the test line was composed of only p14 or BSA, or a mixture of p14 and BSA (namely p14 + BSA), displayed a colored line in the presence of Mdm2. In the latter case, this highlights the importance of the covalent coupling of the p14 peptide for its immobilization on the NC membrane.
In the case of the p14–Strep system, conjugates with different p14 peptide![[thin space (1/6-em)]](https://www.rsc.org/images/entities/char_2009.gif) :
:![[thin space (1/6-em)]](https://www.rsc.org/images/entities/char_2009.gif) streptavidin ratios were deposited on the test line, keeping the streptavidin concentration constant (Fig. 2B).
streptavidin ratios were deposited on the test line, keeping the streptavidin concentration constant (Fig. 2B).
The 2![[thin space (1/6-em)]](https://www.rsc.org/images/entities/char_2009.gif) :
:![[thin space (1/6-em)]](https://www.rsc.org/images/entities/char_2009.gif) 1 ratio led to a more intense blue signal than the 1
1 ratio led to a more intense blue signal than the 1![[thin space (1/6-em)]](https://www.rsc.org/images/entities/char_2009.gif) :
:![[thin space (1/6-em)]](https://www.rsc.org/images/entities/char_2009.gif) 1 ratio while the 3
1 ratio while the 3![[thin space (1/6-em)]](https://www.rsc.org/images/entities/char_2009.gif) :
:![[thin space (1/6-em)]](https://www.rsc.org/images/entities/char_2009.gif) 1 and 4
1 and 4![[thin space (1/6-em)]](https://www.rsc.org/images/entities/char_2009.gif) :
:![[thin space (1/6-em)]](https://www.rsc.org/images/entities/char_2009.gif) 1 ratios did not lead to a further increase of the test line intensity. However, very weak blue lines were observed for these two last ratios in the absence of Mdm2 (NEG strips). These false positive results are probably linked to the electrostatic attraction between the positive charges induced by the p14 peptides (which contains 5 arginine residues) on the p14–Strep system, which increases as a function of the p14 peptide to streptavidin ratio, and the negatively charged AgNPls-X4–p53. Therefore, the 2
1 ratios did not lead to a further increase of the test line intensity. However, very weak blue lines were observed for these two last ratios in the absence of Mdm2 (NEG strips). These false positive results are probably linked to the electrostatic attraction between the positive charges induced by the p14 peptides (which contains 5 arginine residues) on the p14–Strep system, which increases as a function of the p14 peptide to streptavidin ratio, and the negatively charged AgNPls-X4–p53. Therefore, the 2![[thin space (1/6-em)]](https://www.rsc.org/images/entities/char_2009.gif) :
:![[thin space (1/6-em)]](https://www.rsc.org/images/entities/char_2009.gif) 1 ratio was chosen for subsequent experiments. It is noteworthy that no line was observed in the absence of p14–biotin (ratio 0
1 ratio was chosen for subsequent experiments. It is noteworthy that no line was observed in the absence of p14–biotin (ratio 0![[thin space (1/6-em)]](https://www.rsc.org/images/entities/char_2009.gif) :
:![[thin space (1/6-em)]](https://www.rsc.org/images/entities/char_2009.gif) 1), confirming the specificity of the interaction with the p14 aptamer.
1), confirming the specificity of the interaction with the p14 aptamer.
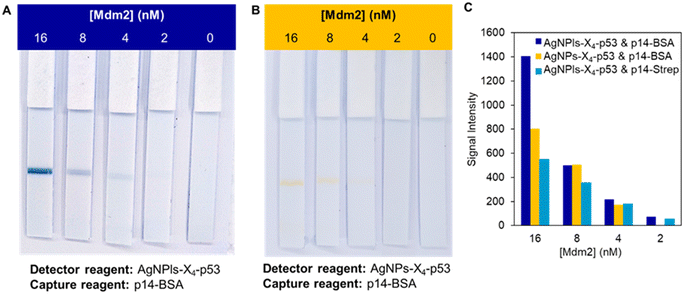
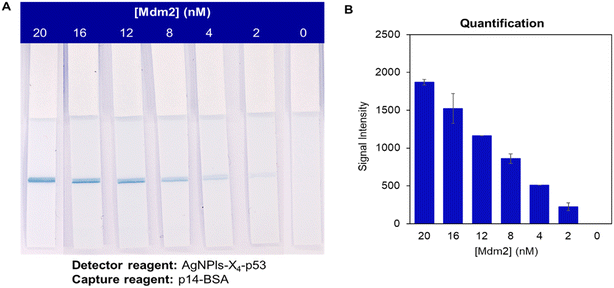
Both systems were then evaluated with concentrations of Mdm2 ranging from 0 to 16 nM (see Fig. 3A for the p14–BSA system). These experiments were also performed with the nanoparticles AgNPs-X4–p53 using the strips functionalized with the p14–BSA conjugate (Fig. 3B). In this case, a weak yellow test line was observed in the presence of Mdm2 down to a Mdm2 concentration of 4 nM. However, the contrast with the NC membrane was not optimal for a naked-eye detection, as underlined in previous studies.28 On the contrary, the dark blue color provided by the AgNPls led to an excellent contrast and a line could still be observed at a 2 nM concentration of the target protein (see Fig. 3A for the p14–BSA system and Fig. S8† for the p14–Strep system). For the highest Mdm2 concentration (i.e. 16 nM), the band intensity was significantly stronger for the combination of AgNPls-X4–p53 and p14–BSA systems. For all the other concentrations of Mdm2, similar color intensity values were obtained for the three systems, suggesting that both coupling strategies are suitable for the aptamer immobilization. Based on the color intensity of the T line, the limit of quantification (LoQ), which corresponds to a signal intensity higher than 10 times the standard deviation of the blank,36 was determined using the ImageJ software (Fig. 3C). LoQs of 5 nM and 2 nM were respectively obtained for AgNPs-X4–p53 and AgNPls-X4–p53, without significant difference between the p14–BSA and p14–Strep system.
Detection of Mdm2 in HEK273 cell lysate
To assess the specificity of the detection, dipstick assays were performed with the p14–BSA and p14–Strep systems using different concentrations of Mdm2 spiked in HEK293 cell lysate (diluted by a factor of 10 in the final assay). Note that the experiments were performed three times at least (see Fig. S9† for replicates). For the p14–BSA system, the signal intensity at the test line increased as function of the Mdm2 concentration (Fig. 4). A signal could be observed at the test line down to a Mdm2 concentration of 2 nM, which was similar to the limit obtained in buffer, and no false positive was observed in the absence of Mdm2, indicating a high specificity. The signal intensity was also quantified using the ImageJ software and a LoQ of 1.3 nM was determined. It is noteworthy that a linear dynamic range was obtained for concentrations of Mdm2 ranging from 2 to 20 nM. Control experiments (without Mdm2) were also performed in plasma, another complex matrix which contains multiple potential interferents, and no signal was observed in absence of Mdm2 (Fig. S10†), confirming the high specificity of the Mdm2 detection.Compared to our previous AgNPs-based sensors using immunoturbidimetry,23 the use of LFAs allowed to reduce by a factor of five the quantity of nanoparticles that is necessary to run a test (considering the use of 100 μL cuvette for absorption spectroscopy). Moreover, we observed that LFAs were less prone to UV-vis absorption interference from the matrix sample and less sensitive to non-specific aggregation of the suspension. A LoQ lowered by a factor of 2 was also observed. However, this improvement is related to the use of AgNPls instead of AgNPs, and not to the type of test, as a similar decrease of the performance of the dipstick assay is observed when spherical particles are used as colorimetric reporters.
With the p14–Strep system, false positives were consistently observed in the control experiments, despite optimization attempts (Fig. S11†). Further experiments were thus only conducted with strips functionalized with the p14–BSA conjugates. It is however noteworthy that this phenomenon was not observed when the Mdm2 detection was performed in human plasma, showing that this strategy could find applications with biological samples other than cell lysates and/or other aptamer sequences.
Comparison between the aptamer system and a classical antibody system
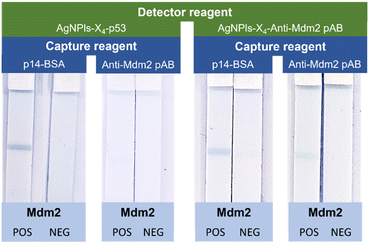
The performances of our aptamer-based system were compared to those of a classical system using antibodies as recognition unit for capture and detector reagents. Experimental details about the functionalization of the AgNPls-X4 and the strips with a polyclonal anti-Mdm2 antibody (pAB anti-Mdm2) can be found in ESI† (Fig. S12). The different possible combinations of peptides and pAB anti-Mdm2 for the functionalization of the colorimetric reporters and the test line were evaluated and the corresponding dipsticks assays were performed in the presence and in the absence of Mdm2 (Fig. 5). Interestingly, the most intense coloration of the test line was obtained with the system involving exclusively peptide aptamers. The use of AgNPls-X4–pAB anti-Mdm2 as detector reagent led to a less intense colored test line in the presence of the target protein, whatever the capture reagent used. When the combination of AgNPls-X4–p53 and pAB anti-Mdm2 was used, a very weak blue-coloured signal could be observed with the naked eye at the T line but with such a low intensity that it could not be captured by the camera. Signal intensity was also quantified as previously and confirmed our naked eye readout (Fig. S13†). These results confirm the that the system based uniquely on peptide aptamers as recognition unit for capture and detector reagents is suitable for the development of LFAs as we could detect the presence of Mdm2 in complex samples with a lower limit of detection than using commercial anti-Mdm2 polyclonal antibodies. Even more interestingly, it was still possible to detect reproducibly the presence of Mdm2 using silver nanoplates and strips functionalized with peptide aptamers that had been stored during one year at room temperature (Fig. S14†). In strong contrast, no signal could be observed when strips and particles functionalized with the pAB anti-Mdm2 were used after only one week of storage at 4 °C. All these results confirm the huge potential of peptide aptamers as capture and detector reagents for the development of efficient LFAs.Experimental
Chemical and biomolecules
All chemicals were at least of reagent grade. HP170 NC membranes were obtained from Cytiva while absorbent pads SureWick (1.7 × 30 cm2) were purchased from Sigma-Aldrich. Anti-Mdm2 pAB were ordered from Abnova (H00004193-D01). p14–biotin were purchased from BioMatik and p14-NH2 from Eurogentec. The synthesis of the calix[4]arene X4(N2+) salt was achieved according to the literature from commercially available p-tBu-calix[4]arene. AgNPs-X4 with a mean core diameter of 20 nm were synthesized following a previously reported procedure.29Characterizations and measurements
UV-vis absorption spectra were recorded with a UV-vis spectrophotometer in quartz cuvettes. As-synthesized NPs were diluted by a factor of 10 in 1 mL of aqueous solution, unless otherwise noted. Attenuated total reflection Fourier-transform infrared (ATR-FTIR) spectra were recorded at 20 °C on an FTIR spectrophotometer equipped with a liquid-nitrogen-cooled mercury–cadmium–telluride (MCT) detector. The silver nanoparticles were centrifugated, and 2 μL of the pellet was deposited on a germanium internal reflection element (triangular prism of 6.8 × 45 mm2 with an internal angle of incidence of 45°). Water was removed with a flow of nitrogen gas. Opus software (4.2.37) was used to record 128 scans with a resolution of 2 cm−1 under a continuous flow of nitrogen gas. Data were processed and analyzed using the kinetics software in MatLab 7.1 (Mathworks, Inc., Natick, MA) by the subtraction of water vapor, baseline correction, apodization at 4 cm−1, and flattening of the CO2 signal. Finally, the spectra were normalized at 1459 cm−1 (aromatic ring stretching band from the calixarenes) to compensate for variations in the number of AgNPs/AgNPls present on the spot of the Ge crystal where the measurement was performed. Images of the AgNPs/AgNPls were obtained with a transmission electron microscope (TEM) equipped with a lanthanum hexaboride (LaB6) crystal at a 200 kV accelerating voltage. The average size and standard deviation were determined by measuring the size of more than 150 NPs for each sample. A LFA dispenser from Claremont Bio was used to dispense the test line and ensure reproducibility.Bioconjugation
In a 1.5 mL glass vial, 1000 μL AgNPls-X4 was added. Then, 100 μL of MES buffer (100 mM, pH 5.8), 60 μL EDC·HCl (6 mM) and 60 μL sulfo-NHS (10 mM) were successively added and the mixture was stirred during 1 hour. Then, 20 μL p53-5FAM (100 μM) was added and the mixture was stirred during 4 h at room temperature. The mixture was transferred in a 1.5 mL Protein Lobind Eppendorf and 300 μL of SDS 1% was added. The Eppendorf was filled to 1.5 mL with MilliQ H2O and centrifugated at 18![[thin space (1/6-em)]](https://www.rsc.org/images/entities/char_2009.gif) 000g during 20 minutes at room temperature. The supernatant was discarded, and the pellet was redispersed in MilliQ H2O. Centrifugation and redispersion cycle were repeated twice as described.
000g during 20 minutes at room temperature. The supernatant was discarded, and the pellet was redispersed in MilliQ H2O. Centrifugation and redispersion cycle were repeated twice as described.
p14–BSA dipstick assembly
A solution of BSA (10 mg ml−1) in 0.1 M MES (pH 5.8) was prepared and 2 mg of p14-NH2 were dissolved in 500 μL 0.1 M MES (pH 5.8). Then, 357 μL of p14 solution were mixed with 142 μL of the BSA carrier protein. The p14/BSA solution was transferred in a Protein Lobind Eppendorf containing 3.6 mg of EDC·HCl. The mixture was stirred during 2 h at room temperature. The resulting mixture was purified using Sephadex Mini trap G25 column. Purification was performed as notified by the manufacturer. 200 μL fractions of eluate were collected and analysed by UV-vis. The 4 more concentrated fractions were mixed and dialysed using a Pur-A-Lyzer kit against a 10 mM phosphate buffer. After 16 h of dialysis, the mixture was analyzed by UV-vis spectroscopy. Finally, 800 μL of solution of 1.18 mg mL−1 was yielded and stored at −20 °C. The mixture was dispensed on the NC membrane (5 V, 2.5 ml min−1). Afterwards, the membrane was dried in an oven at 40 °C during 1 h 30 before addition of the absorbent pad (with an overlap of 3 mm) and slicing into 5 mm strips that were stored in a desiccator.p14–Strep dipstick assembly
Approximatively 1 mg of p14–biotin was dissolved in a mixture H2O![[thin space (1/6-em)]](https://www.rsc.org/images/entities/char_2009.gif) :
:![[thin space (1/6-em)]](https://www.rsc.org/images/entities/char_2009.gif) acetonitrile (3
acetonitrile (3![[thin space (1/6-em)]](https://www.rsc.org/images/entities/char_2009.gif) :
:![[thin space (1/6-em)]](https://www.rsc.org/images/entities/char_2009.gif) 1) ∼120 μL. The concentration of the resulting solution was determined by UV-vis spectroscopy using the extinction coefficient of the peptide. A concentration of 266 μM was calculated. Then, a 19 μM streptavidin solution was prepared. In a 0.5 mL Protein Lobind Eppendorf, the appropriate volume of p14–biotin (7.2 μL for 1
1) ∼120 μL. The concentration of the resulting solution was determined by UV-vis spectroscopy using the extinction coefficient of the peptide. A concentration of 266 μM was calculated. Then, a 19 μM streptavidin solution was prepared. In a 0.5 mL Protein Lobind Eppendorf, the appropriate volume of p14–biotin (7.2 μL for 1![[thin space (1/6-em)]](https://www.rsc.org/images/entities/char_2009.gif) :
:![[thin space (1/6-em)]](https://www.rsc.org/images/entities/char_2009.gif) 1 and 14.5 μL for 2
1 and 14.5 μL for 2![[thin space (1/6-em)]](https://www.rsc.org/images/entities/char_2009.gif) :
:![[thin space (1/6-em)]](https://www.rsc.org/images/entities/char_2009.gif) 1), 100 μL of streptavidin and H2O
1), 100 μL of streptavidin and H2O![[thin space (1/6-em)]](https://www.rsc.org/images/entities/char_2009.gif) :
:![[thin space (1/6-em)]](https://www.rsc.org/images/entities/char_2009.gif) acetonitrile (3
acetonitrile (3![[thin space (1/6-em)]](https://www.rsc.org/images/entities/char_2009.gif) :
:![[thin space (1/6-em)]](https://www.rsc.org/images/entities/char_2009.gif) 1) (21.8 μL for 1
1) (21.8 μL for 1![[thin space (1/6-em)]](https://www.rsc.org/images/entities/char_2009.gif) :
:![[thin space (1/6-em)]](https://www.rsc.org/images/entities/char_2009.gif) 1 and 14.5 μL for 2
1 and 14.5 μL for 2![[thin space (1/6-em)]](https://www.rsc.org/images/entities/char_2009.gif) :
:![[thin space (1/6-em)]](https://www.rsc.org/images/entities/char_2009.gif) 1) was mixed. See Table S3† for other ratios. The mixture was stirred during 30 minutes in a thermomixer at 1000 rpm and room temperature before being dispensed on the NC membrane (5 V, 2.5 ml min−1). Afterwards, the membrane was dried in an oven at 40 °C during 1 h 30 before addition of the absorbent pad (with an overlap of 3 mm) and slicing into 5 mm strips that were stored in a desiccator.
1) was mixed. See Table S3† for other ratios. The mixture was stirred during 30 minutes in a thermomixer at 1000 rpm and room temperature before being dispensed on the NC membrane (5 V, 2.5 ml min−1). Afterwards, the membrane was dried in an oven at 40 °C during 1 h 30 before addition of the absorbent pad (with an overlap of 3 mm) and slicing into 5 mm strips that were stored in a desiccator.
Assay procedure
In 0.5 mL Protein Lobind Eppendorf, 5 μL of AgNPs-X4–p53 or AgNPls-X4–p53 (OD = 2.5) were mixed with the appropriate volume of Mdm2 (86 nM) and 5 μL of cell lysate (0.2 mg ml−1) or 5 μL 20 mM TRIS·HCl. Mixtures were incubated during 15 minutes and then, transferred in a disposable cuvette containing 40 μL of running buffer (5 wt% BSA, 0.4 wt% Tween 20, 0.25 wt% sodium desoxycholate, 1 wt% PEG 6000, 2 mM EDTA, 100 mM KCl and 25 mM TRIS·HCl pH 8) before addition of the dipstick. Read-out was realized after 30 minutes. Quantification of the signal was performed based on a reported procedure using ImageJ.36 The limit of quantification (LoQ) corresponds to 10 times the standard deviation of blank and was determined by analyzing signal of sample without Mdm2.Conclusions
In this work, we have shown that peptide aptamers are an interesting alternative to classical antibodies for the development of LFAs, not only for the functionalization of the colorimetric reporters, but also for the T line of the NC membrane. The two envisioned anchoring strategies present their own advantages: the EDC/sulfo-NHS coupling chemistry only requires the addition of a lysine residue in the sequence of the peptide to couple to the protein, while the biotin/streptavidin complexation does not require any other operation than the mixing of the two partners in the right ratio. As shown, both strategies succeeded in immobilizing the p14 peptide aptamer on the NC strips to prepare dipstick assays for the detection of Mdm2. The system based on p14–BSA showed excellent performances, even in cell lysate, and we were able to detect Mdm2 with a LoQ of 2 nM.Comparative analysis with traditional antibody-based assays revealed the superiority of peptide aptamers in terms of both performance and shelf-life. Peptide aptamers remained effective even after a year of storage at room temperature, in contrast to antibody-based systems. From an industrial point-of-view, this achievement is of great importance as it could drastically reduce the cost of materials and reagents necessary to produce a test, mainly due to the capture reagent part.
In conclusion, this study underscores the remarkable potential of peptide aptamers as an interesting alternative to conventional antibodies in the realm of lateral flow assays (LFAs) and paves the way to extended applications of these remarkable recognition elements.
Conflicts of interest
M. R. were postdoctoral researchers for X4C from August 2020 to January 2021. I. J. is a shareholder of X4C. I. J. and G. B. are consultants for X4C.Acknowledgements
This research was supported by the Fonds pour la formation à la Recherche dans l'Industrie et dans l'Agriculture (FRIA-FRS) (PhD grant to B. G.), the “Actions de Recherches Concertées” of the Fédération Wallonie-Bruxelles and the ULB (PhD grant to M. R.) and the “Fondation Jaumotte-Demoulin”. B. G. gratefully acknowledges “Fonds David et Alice Van Buuren” for the grants attributed to end-year PhD.References
- F. Di Nardo, M. Chiarello, S. Cavalera, C. Baggiani and L. Anfossi, Sensors, 2021, 21, 5185 CrossRef CAS PubMed.
- J. H. Soh, H.-M. Chan and J. Y. Ying, Nano Today, 2020, 30, 100831 CrossRef CAS.
- L. Zeng, Y. Li, J. Liu, L. Guo, Z. Wang, X. Xu, S. Song, C. Hao, L. Liu, M. Xin and C. Xu, Mater. Chem. Front., 2020, 4, 2000–2005 RSC.
- M. Jauset-Rubio, M. Svobodová, T. Mairal, C. McNeil, N. Keegan, A. Saeed, M. N. Abbas, M. S. El-Shahawi, A. S. Bashammakh, A. O. Alyoubi and C. K. O'Sullivan, Sci. Rep., 2016, 6, 37732 CrossRef CAS PubMed.
- S. Bayoumy, H. Hyytiä, J. Leivo, S. M. Talha, K. Huhtinen, M. Poutanen, J. Hynninen, A. Perheentupa, U. Lamminmäki, K. Gidwani and K. Pettersson, Commun. Biol., 2020, 3, 460 CrossRef CAS PubMed.
- B. Gosselin, M. Retout, R. Dutour, L. Troian-Gautier, R. Bevernaegie, S. Herens, P. Lefèvre, O. Denis, G. Bruylants and I. Jabin, Anal. Chem., 2022, 94, 7383–7390 CrossRef CAS PubMed.
- N. H. Bhuiyan, J. H. Hong, M. J. Uddin and J. S. Shim, Anal. Chem., 2022, 94, 3872–3880 CrossRef CAS PubMed.
- H. Tong, C. Cao, M. You, S. Han, Z. Liu, Y. Xiao, W. He, C. Liu, P. Peng, Z. Xue, Y. Gong, C. Yao and F. Xu, Biosens. Bioelectron., 2022, 213, 114449 CrossRef CAS PubMed.
- V. Potluri, P. S. Kathiresan, H. Kandula, P. Thirumalaraju, M. K. Kanakasabapathy, S. Kota Sai Pavan, D. Yarravarapu, A. Soundararajan, K. Baskar, R. Gupta, N. Gudipati, J. C. Petrozza and H. Shafiee, Lab Chip, 2019, 19, 59–67 RSC.
- S. Sharma, H. Byrne and R. J. O'Kennedy, Essays Biochem., 2016, 60, 9–18 CrossRef PubMed.
- M. Baker, Nature, 2015, 521, 274–276 CrossRef CAS PubMed.
- P. J. Conroy, S. Hearty, P. Leonard and R. J. O'Kennedy, Semin. Cell Dev. Biol., 2009, 20, 10–26 CrossRef CAS PubMed.
- M. Mascini, I. Palchetti and S. Tombelli, Angew. Chem., Int. Ed., 2012, 51, 1316–1332 CrossRef CAS PubMed.
- M. Retout, H. Valkenier, E. Triffaux, T. Doneux, K. Bartik and G. Bruylants, ACS Sens., 2016, 1, 929–933 CrossRef CAS.
- T. Schüling, A. Eilers, T. Scheper and J. Walter, AIMS Bioeng., 2018, 5, 78–102 Search PubMed.
- M. Majdinasab, M. Badea and J. L. Marty, Pharmaceuticals, 2022, 15, 90 CrossRef CAS PubMed.
- X. Li, Q. Zhu, F. Xu, M. Jian, C. Yao, H. Zhang and Z. Wang, Anal. Biochem., 2022, 648, 114671 CrossRef CAS PubMed.
- M. J. Gonzalez-Moa, B. Van Dorst, O. Lagatie, A. Verheyen, L. Stuyver and M. A. Biamonte, ACS Infect. Dis., 2018, 4, 912–917 CrossRef CAS PubMed.
- X. Li, Q. Zhu, F. Xu, M. Jian, C. Yao, H. Zhang and Z. Wang, Anal. Biochem., 2022, 648, 114671 CrossRef CAS PubMed.
- C. Díaz-Perlas, B. Ricken, L. Farrera-Soler, D. Guschin, F. Pojer, K. Lau, C.-B. Gerhold and C. Heinis, Nat. Commun., 2023, 14, 2774 CrossRef PubMed.
- T. Ozaki and A. Nakagawara, Cancers, 2011, 3, 994–1013 CrossRef CAS PubMed.
- (a) J. D. Oliner, A. Y. Saiki and S. Caenepeel, Cold Spring Harbor Perspect. Med., 2016, 6, a026336 CrossRef PubMed; (b) H. Hou, D. Sun and X. Zhang, Cancer Cell Int., 2019, 19, 216 CrossRef PubMed; (c) I. Kamer, I. Daniel-Meshulam, O. Zadok, E. Bab-Dinitz, G. Perry, R. Feniger-Barish, M. Perelman, I. Barshack, A. Ben-Nun, A. Onn and J. Bar, Mol. Cancer Res., 2020, 18, 926–937 CrossRef CAS PubMed.
- M. Retout, B. Gosselin, A. Mattiuzzi, I. Ternad, I. Jabin and G. Bruylants, ChemPlusChem, 2022, 87, e202100450 CrossRef CAS PubMed.
- T. Sannomiya, C. Hafner and J. Vörös, J. Biomed. Opt., 2009, 14, 064027 CrossRef PubMed.
- A. Steinbrück, O. Stranik, A. Csaki and W. Fritzsche, Anal. Bioanal. Chem., 2011, 401, 1241–1249 CrossRef PubMed.
- P. R. Sajanlal, T. S. Sreeprasad, A. K. Samal and T. Pradeep, Nano Rev., 2011, 2, 5883 CrossRef PubMed.
- C.-W. Yen, H. de Puig, J. O. Tam, J. Gómez-Márquez, I. Bosch, K. Hamad-Schifferli and L. Gehrke, Lab Chip, 2015, 15, 1638–1641 RSC.
- M. Retout, B. Gosselin, A. Adrović, P. Blond, I. Jabin and G. Bruylants, Nanoscale, 2023, 15, 11981–11989 RSC.
- M. Retout, I. Jabin and G. Bruylants, ACS Omega, 2021, 6, 19675–19684 CrossRef CAS PubMed.
- L. Troian-Gautier, H. Valkenier, A. Mattiuzzi, I. Jabin, N. V. Den Brande, B. V. Mele, J. Hubert, F. Reniers, G. Bruylants, C. Lagrost and Y. Leroux, Chem. Commun., 2016, 52, 10493–10496 RSC.
- A. Mattiuzzi, I. Jabin, C. Mangeney, C. Roux, O. Reinaud, L. Santos, J.-F. Bergamini, P. Hapiot and C. Lagrost, Nat. Commun., 2012, 3, 1130 CrossRef PubMed.
- L. Troian-Gautier, A. Mattiuzzi, O. Reinaud, C. Lagrost and I. Jabin, Org. Biomol. Chem., 2020, 18, 3624–3637 RSC.
- P. Li, J.-X. Shi, L.-P. Dai, Y.-R. Chai, H.-F. Zhang, M. Kankonde, P. Kankonde, B.-F. Yu and J.-Y. Zhang, OncoImmunology, 2016, 5, e1138200 CrossRef PubMed.
- J. Haber and K. Sokolov, Langmuir, 2017, 33, 10525–10530 CrossRef CAS PubMed.
- P. Blond, R. Bevernaegie, L. Troian-Gautier, C. Lagrost, J. Hubert, F. Reniers, V. Raussens and I. Jabin, Langmuir, 2020, 36, 12068–12076 CrossRef CAS PubMed.
- C. Parolo, A. Sena-Torralba, J. F. Bergua, E. Calucho, C. Fuentes-Chust, L. Hu, L. Rivas, R. Álvarez-Diduk, E. P. Nguyen, S. Cinti, D. Quesada-González and A. Merkoçi, Nat. Protoc., 2020, 15, 3788–3816 CrossRef CAS PubMed.
Footnote |
| † Electronic supplementary information (ESI) available. See DOI: https://doi.org/10.1039/d3sd00253e |
| This journal is © The Royal Society of Chemistry 2024 |

