
 Open Access Article
 This Open Access Article is licensed under a Creative Commons Attribution-Non Commercial 3.0 Unported Licence
Acid-promoted fluorescent probe for monitoring endogenous methylglyoxal in tumors and gastritis†
Weijia
Xu‡
,
Senyao
Liu‡
,
Wenwen
Cao
and
Hu
Xiong
 *
*
Research Center for Analytical Sciences, Tianjin Key Laboratory of Biosensing and Molecular Recognition, College of Chemistry, Nankai University, Tianjin 300071, China. E-mail: xionghu@nankai.edu.cn
First published on 14th November 2023
Abstract
Methylglyoxal (MGO) is an important dicarbonyl metabolite that plays a crucial role in a range of physiological and pathological processes. It is critical to develop precise methods for detecting MGO levels in vivo to better understand its role in disease progression. Herein, we report an MGO-activatable fluorescent probe Cy-DNH2 based on hemicyanine, which could rapidly and selectively detect MGO with a low LOD of 95 nM in an acidic microenvironment. In the presence of MGO, acidic pH could trigger Cy-DNH2 to turn on intense fluorescence within 3 min. Moreover, Cy-DNH2 was able to target lysosomes, allowing for the detection of endogenous MGO in living cells as well as the identification of elevated MGO levels in tumors and mouse models of gastritis. This work may provide a valuable tool for monitoring MGO under acidic conditions and diagnosing MGO-related diseases.
Introduction
Methylglyoxal (MGO) is a reactive dicarbonyl metabolite produced in all live cells during various metabolic processes such as glycolysis, threonine catabolism, and the polyol pathway.1–3 As a highly active molecule, MGO can react with proteins, DNA, and lipids to form advanced glycation end products, resulting in irreversible cell structural damage and dysfunction, which is closely associated with pathologies of diverse human diseases including obesity, Alzheimer's disease, cardiovascular disease, and diabetes.4–10 The detoxification method of MGO mainly relies on glyoxalase 1 and glyoxalase 2, which can convert MGO into non-toxic D-lactic acid to regulate the levels of MGO in cells.11–14 Indeed, elevated levels of MGO have been observed in cancer cells due to the aerobic glycolysis pathway and are involved in tumor progression.15 Gastritis is another common inflammatory metabolic disease with stomach mucosal injury, and it raises the risk of cancer.16,17 So far, the main clinical diagnostic tool for gastritis is the combination of an X-ray barium meal and endoscope.18,19 However, these methods are complicated to operate, so it is of great significance to develop simple and non-invasive ways for diagnosing gastritis. Compared with normal stomach, the upregulation of MGO concentration occurs in the development of gastritis, which can kill gastrointestinal bacteria such as Helicobacter pylori.20 Therefore, accurate detection of MGO levels in vivo provides a new way for the diagnosis of tumors and gastritis, further elucidating its role in the progression of these diseases.Although MGO plays an important role in physiological processes, the mechanism of its impact on complex living systems is poorly understood due to the lack of simple and effective detection methods. To date, high-performance liquid chromatography (HPLC) and liquid chromatography-mass spectrometry (LC-MS) analysis have been commonly employed for the detection of MGO in biological samples.21,22 However, these methods suffer from complicated processing steps such as cell lysis and deproteinization, leading to low sensitivity and poor accuracy, and are not suitable for biological systems. In recent years, fluorescence imaging has attracted wide attention because of its advantages of high sensitivity, non-invasive visualization, and fast response speed.23–28 At present, only a small number of “turn-on” fluorescent probes have been created for imaging MGO in cells and mice.3,4,11,29–34 Nevertheless, most of these fluorescent probes require a long reaction time with MGO (usually 1–2 h), which is not suitable for real-time detection of variations in MGO levels in vitro and in vivo. Moreover, fluorescent probes exhibiting high organelle-targeting capability have been rarely reported. As an essential digestive organelle, lysosomes have an acidic environment and contain different kinds of enzymes for cellular metabolism, and dysfunction of lysosomes has been related to a wide variety of diseases such as cancer and gastroenteritis.35 Thus, real-time monitoring and imaging of MGO levels in lysosomes will help the diagnosis of cancer and gastritis, while such a fluorescent probe that can rapidly detect MGO under acidic conditions is still elusive.
To address these challenges, we herein designed and synthesized a novel lysosome-targeting fluorescent probe, named Cy-DNH2, for real-time monitoring MGO levels in tumors and gastritis. Probe Cy-DNH2 was synthesized via the Knoevenagel condensation reaction of electron-deficient benzo[cd]indolium and o-phenylenediamine that is an MGO-specific recognition unit. Under acidic conditions, it was able to rapidly recognize MGO and form an emissive product within 3 min, showing strong fluorescence at 545–580 nm. Moreover, Cy-DNH2 could sensitively and selectively detect exogenous and endogenous MGO in HeLa cells with a low limit of detection (LOD) value of 95 nM. Notably, it allowed the successful visualization of endogenous MGO fluctuations in mouse tumors and stomach of acute gastritis. To the best of our knowledge, Cy-DNH2 is the first acid-promoted fluorescent probe capable of specifically imaging MGO in lysosomes.
Experimental methods
Synthesis of fluorescent probe Cy-DNH2
Fluorescence imaging in living cells
For exogenous MGO detection, HeLa cells were treated with Cy-DNH2 (5 μM) for 2 h and fixed with 4% paraformaldehyde for 5 min, then phosphate buffer solutions (pH 4.2) containing different concentrations of MGO (0, 5, 10, 20, 30 μM) were added. After incubation for 30 min, laser confocal imaging was performed.For endogenous MGO detection, HeLa cells in DMEM medium were pretreated with curcumin (0, 5, 10, 20, 30 μM) for 6 h, then incubated with Cy-DNH2 (5 μM) for 2 h, and washed twice with PBS, then fresh medium was added for laser confocal imaging.
Fluorescence imaging in vivo
Female BALB/c mice (6–8 weeks old, 18–20 g) were purchased from Beijing Vital River Laboratory Animal Technology Co., Ltd. All animal experiments were approved by the Ethics Committee of Nankai University and carried out in accordance with the guidelines for animal experiments. The gastritis mouse model was established by intragastric administration of 200 μL anhydrous ethanol; 30 min later, Cy-DNH2 (1 mM, 150 μL) was administered intragastrically into the mice. The abdominal hair of the mouse was removed and imaged using an IVIS Lumina imaging system. Finally, the mice were euthanized, and their livers, lungs, hearts, kidneys, spleens, and intestines were immediately collected for ex vivo fluorescence imaging.In order to generate a tumor-bearing mouse model, 4T1-luc cells (2 × 10⁵) were injected subcutaneously into the left and right hind limbs. After one week, the right leg tumor (experimental group) was injected with curcumin (200 μM, 50 μL) and pretreated for 6 h, while the left leg tumor (control group) was injected with the same amount of PBS. Then, Cy-DNH2 (500 μM, 50 μL) was injected into the left and right tumors, respectively. 2 hours later, fluorescence imaging was performed using an IVIS imaging system (λex = 556 nm, λem = 580–640 nm).
Results and discussion
Design and synthesis of MGO-activatable probe Cy-DNH2
Hemicyanine dyes have been broadly used in the fields of biological imaging and disease diagnosis due to their high stability, large Stokes shift, tunable spectral characteristics, and good biocompatibility.36 Here, MGO-activatable probe Cy-DNH2 with a hemicyanine structure was constructed by the Knoevenagel condensation reaction (Scheme 1). O-Phenylenediamine, an MGO-specific recognition unit, was selected to detect MGO with excellent selectivity.30 Under acidic conditions, Cy-DNH2 could rapidly react with MGO to form the structure of quinoxaline (Fig. 1a). Once reacted with MGO, the donor–π–acceptor (D–π–A) skeleton of Cy-DNH2 was changed, showing intense “turn-on” fluorescence emission. As shown in Fig. 1b and c, the maximum absorption wavelength of Cy-DNH2 was 590 nm. After reacting with MGO, the absorption wavelength of the probe blue-shifted, and a new absorption peak appeared at 460 nm due to the change in donor–acceptor electron properties. The fluorescence intensity of Cy-DNH2 was very weak, and the fluorescence signal at 545 nm was greatly enhanced after the reaction with MGO. Then, Fourier transform high-resolution mass spectrometry (FTMS) was used to analyze the charge-mass ratio (m/z) of Cy-DNH2 and the product of Cy-DNH2 with MGO. Compared with the characteristic peak of Cy-DNH2 (m/z = 314.1654), the product showed a strong response peak at m/z of 350.1654, indicating that the reaction between Cy-DNH2 and MGO formed a quinoxaline structure with the loss of two water molecules (Fig. 1d and e). To further understand the fluorescence response mechanism, density functional theory (DFT) calculation was used to optimize the structure and electron distribution of Cy-DNH2 in the excited state treated with or without MGO. As shown in Fig. S1,† both of them exhibited similar highest occupied molecular orbital (HOMO) and lowest unoccupied molecular orbital (LUMO) distributions. However, it was found that the dihedral angle between the donor and the acceptor of Cy-DNH2 is 89°, almost in a vertical conformation, whose charge transfer state is typically not favored for radiative fluorescence emission.37 By contrast, after MGO treatment, the dihedral angle between the donor and the acceptor plane decreases to 27°, which could facilitate intermolecular charge transfer and enhance radiative transition with bright fluorescence.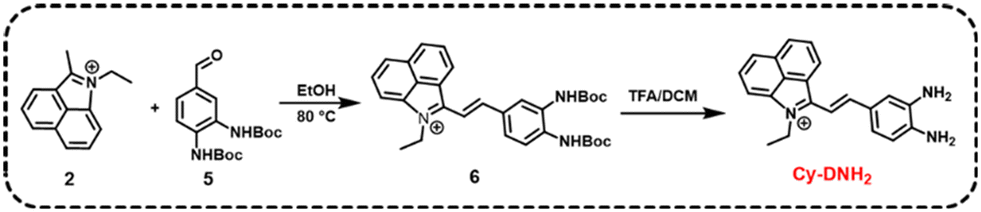 | ||
| Scheme 1 Synthetic route of Cy-DNH2. | ||
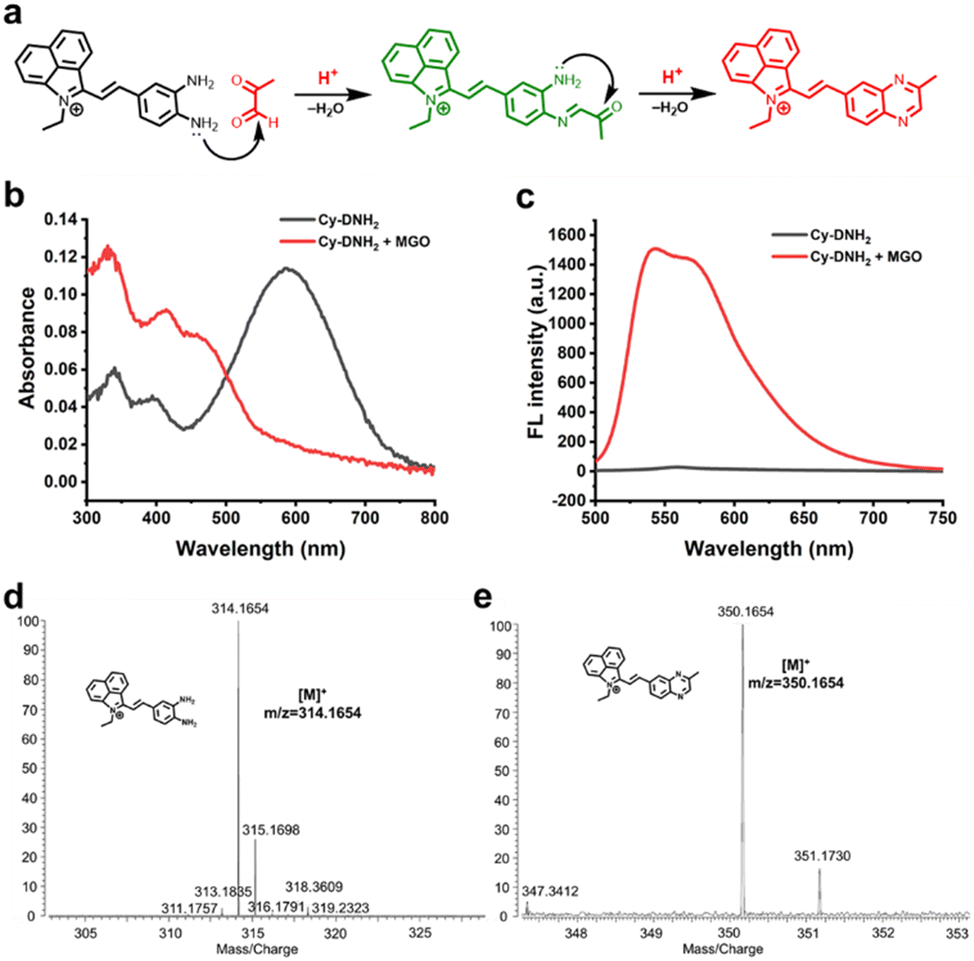 | ||
| Fig. 1 (a) Proposed reaction mechanism of Cy-DNH2 towards MGO under acidic conditions. Absorption spectra (b) and fluorescence emission spectra (c) of 10 μM Cy-DNH2 and Cy-DNH2 incubated with 100 μM MGO in pH 4.2 buffer. λex = 470 nm. Mass spectra of Cy-DNH2 (d) and Cy-DNH2 reacted with MGO (e). | ||
Spectroscopic properties of Cy-DNH2 towards MGO
Then, in order to further study the response of Cy-DNH2 towards different concentrations of MGO, we measured the fluorescence spectra of 10 μM Cy-DNH2 reacted with different concentrations of MGO. The results are shown in Fig. 2a; as the MGO content increases (0–150 μM), the fluorescence signals at 545–570 nm gradually increased. In addition, the fluorescence intensity at 545 nm also showed a good linear relationship with the concentration of MGO in the range of 0–30 μM (R2 = 0.998), and the limit of detection (LOD, 3σ/slope) was 95 nM (Fig. 2b), indicating that this probe could detect MGO sensitively and quantitatively. Next, we further investigate the pH effects on the reactivity of the MGO probe. Cy-DNH2 (10 μM) and MGO (100 μM) were co-incubated in different pH buffers at 37 °C for 30 min, and then their fluorescence emission spectra were measured. As shown in Fig. 2c, under the condition of low pH (3–5), Cy-DNH2 exhibited higher fluorescence response intensity towards MGO, indicating that this pH-dependent fluorescence enhancement phenomenon was probably attributed to the process of condensation reaction. To further investigate this effect, we next examined the reaction between Cy-DNH2 and MGO with or without acid. When Cy-DNH2 was treated with only MGO or trifluoroacetic acid (TFA), there was no fluorescence increase within 5 min. However, the fluorescence intensity increased rapidly in the presence of both MGO and TFA, reaching a plateau within 3 min (Fig. S2†). These results confirmed that acidic pH could significantly accelerate the reaction of the probe with MGO. To further evaluate its selectivity towards MGO, we measured the fluorescence spectra of Cy-DNH2 (10 μM) incubated with a variety of common biological species (Fig. 2d and S3†). Among all species (except glyoxal), only MGO could remarkably turn on the fluorescence of Cy-DNH2, while no obvious changes were observed in the presence of other species. It is worth noting that o-phenylenediamine has also been reported to respond with nitric oxide (NO),23 but this probe did not turn on in the presence of 20 equiv. NO. Then, we increased the concentration of NO over hundreds of equivalents, and we found that Cy-DNH2 could slightly turn on its fluorescence. Because the concentration of NO in cells is much lower than that, therefore, Cy-DNH2 can selectively detect MGO without interference of NO and holds great promise for applications in living systems.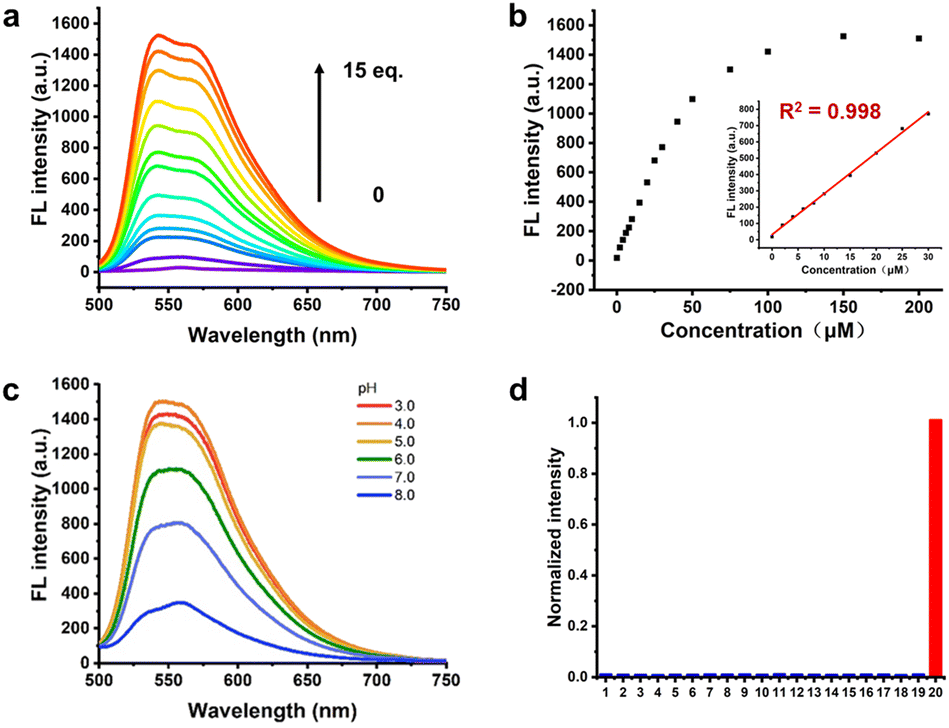 | ||
| Fig. 2 (a) Fluorescence response spectra of 10 μM Cy-DNH2 in the presence of different concentrations of MGO, λex = 470 nm. (b) Plot of fluorescence intensity of Cy-DNH2 at 545 nm as a function of MGO concentration. Inset: The linear relationship between fluorescence intensity and MGO concentration in the range of 0–30 μM. (c) Fluorescence response spectra of Cy-DNH2 to MGO in different pH buffers. (d) Relative fluorescence intensity at 545 nm of 10 μM Cy-DNH2 treated with various species (200 μM) in pH 4.2 buffers (1. blank, 2. L-Arg, 3. L-Cys, 4. L-Lys, 5. L-Try, 6. GSH, 7. Ca2+, 8. Cu2+, 9. Fe2+, 10. NH4+, 11. SO32−, 12. ClO−, 13. H2PO4−, 14. NO2−, 15. NO3−, 16. NO, 17. ·OH, 18. O2˙−, 19. H2O2, 20. MGO). | ||
Cellular localization and fluorescence imaging of MGO in cells
Before cell imaging, we first evaluated the cytotoxicity of Cy-DNH2 by CCK-8 assay. As shown in Fig. S4,† HeLa cells retained a high survival rate with Cy-DNH2 at the concentrations from 0 to 25 μM, indicating its high biocompatibility. Later, we examined the organelle-targeting ability of Cy-DNH2; HeLa cells were incubated with Cy-DNH2 and commercial mitochondria or lysosome targeting probes. The results are shown in Fig. 3a and S5;† the red channels were the fluorescence signals from Cy-DNH2, while the green channels were the fluorescence signals from mitochondria or lysosome trackers. Cy-DNH2 was co-localized well with lysosomes and not with mitochondria, showing a Pearson coefficient of 0.86 and 0.68, respectively. Since it has a better response to MGO under acidic pH conditions, Cy-DNH2 is promising for monitoring MGO levels in lysosomes.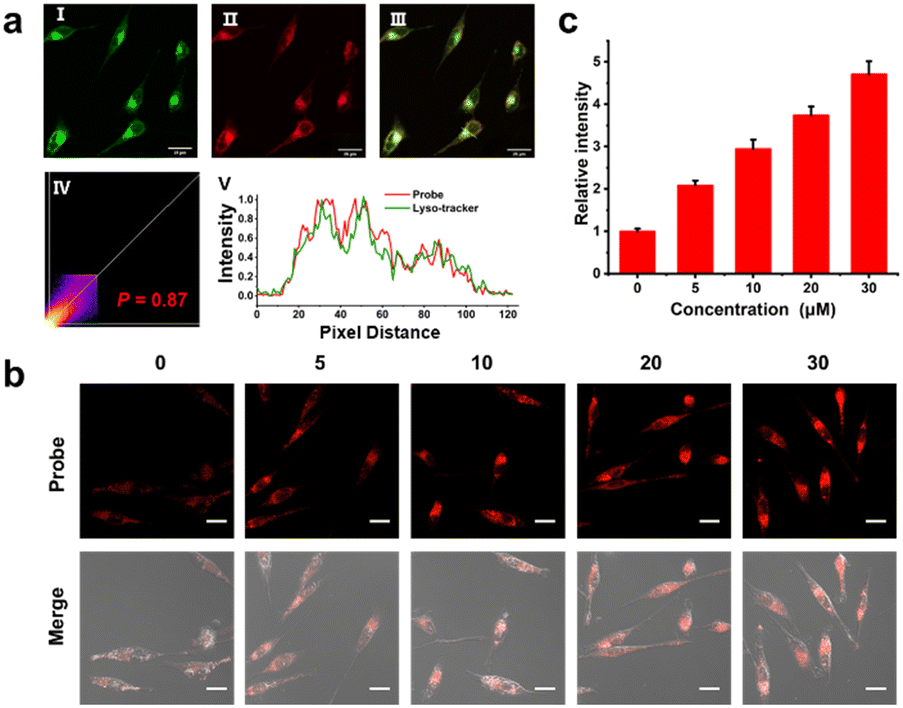 | ||
| Fig. 3 (a) Colocalization imaging of HeLa cells stained with Cy-DNH2 (10 μM) and Lyso-Tracker Green (1 μM). (I) Green channel (Lyso-Tracker Green, λex = 487 nm, λem = 500–550 nm). (II) Red channel (Cy-DNH2, λex = 487 nm, λem = 570–620 nm). (III) Merged image of (I and II). (IV) Intensity scatter plot. (V) Relative intensity profile of the white line across HeLa cells. Scale bar = 25 μm. (b) Confocal fluorescence images of Cy-DNH2 stained HeLa cells in response to different concentrations of MGO (λex = 487 nm, λem = 570–620 nm), scale bar: 20 μm. (c) Relative fluorescence intensity of cells in (b). | ||
Next, we investigated the ability of Cy-DNH2 for cellular MGO imaging in the lysosomes of living cells by confocal microscopy. The HeLa cells were pre-incubated with Cy-DNH2 for 2 h and treated with MGO for 30 min. As shown in Fig. S6,† the fluorescence intensity of cells treated with exogenous MGO was not significantly enhanced compared with untreated cells, which was probably ascribed to the fast MGO consumption by glyoxalase 1 (GLO1) in cells.11 In order to eliminate the interference of cellular metabolism of MGO, HeLa cells were fixed with paraformaldehyde before imaging. After being incubated with Cy-DNH2, HeLa cells were fixed and treated with different concentrations of MGO (0–30 μM) for 30 min in pH 4.2 phosphate buffers. As shown in Fig. 3b and c, with the increase of exogenous MGO, significant red fluorescence signals emerged and enhanced gradually, demonstrating the high ability of Cy-DNH2 to detect MGO in cells. To further assess the pH effect on MGO detection in cells, we incubated HeLa cells with Cy-DNH2 in buffers (containing 10 μM MGO) of pH 4.2 and 7.4, respectively. HeLa cells treated with acidic buffer displayed higher fluorescence intensity (Fig. S7†), suggesting that the lysosome-targeting ability of Cy-DNH2 contributes to MGO detection in cells due to the acidic microenvironment of lysosomes.
Monitoring endogenous MGO elevation in cells and mice
Furthermore, we applied Cy-DNH2 to monitor the endogenous MGO levels in living cells. Typically, cancer cells can overexpress the GLO1 enzyme to detoxify the excessive MGO generated in the glycolytic pathway, and thus inhibition of the GLO1 activity will increase the MGO levels in cancer cells.11 Curcumin, as one of the inhibitors of GLO1, can effectively increase the accumulation of MGO in cells. As shown in Fig. 4a and b, untreated HeLa cells showed low red fluorescence. In contrast, after being treated with curcumin for 6 h, HeLa cells exhibited strong red fluorescence due to the accumulation of excessive MGO, and the fluorescence intensity increased with the increase in curcumin concentration. These results revealed that Cy-DNH2 might be used not only to detect MGO in cells, but also to monitor the ability of GLO1 inhibitors to promote MGO accumulation in cells, and even utilized to screen GLO1 inhibitors at the cellular level in the future.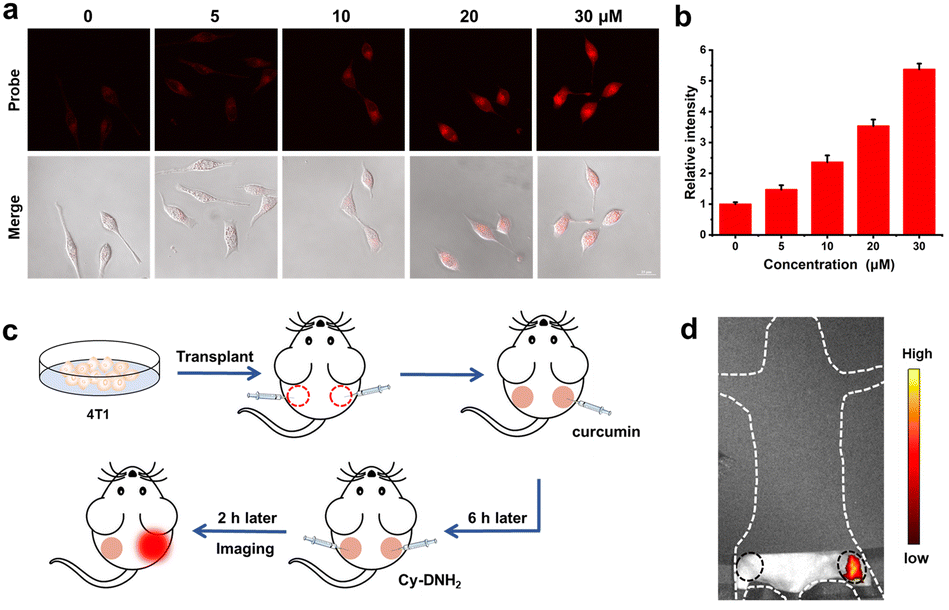 | ||
| Fig. 4 (a) Confocal fluorescence imaging of curcumin-induced endogenous MGO in HeLa cells stained with Cy-DNH2 (λex = 487 nm, λem = 570–620 nm), scale bar: 20 μm. (b) Relative fluorescence intensity of cells in (a). (c) The establishment of the tumor model for endogenous MGO detection in vivo. (d) Fluorescence imaging of tumors in left and right legs. | ||
Encouraged by the cell imaging results, we next evaluated the feasibility of Cy-DNH2 to detect MGO in tumors. The tumor-bearing mouse model was established by injecting 4T1 cells into the right and left legs of the mouse (Fig. 4c). After one week, PBS (∼50 μL) and curcumin (∼50 μL, 100 μM) were injected into the left and right tumors, respectively. 6 hours later, Cy-DNH2 was injected into the tumors of the left and right legs. After 2 hours, fluorescence imaging was performed. As shown in Fig. 4d, there was much stronger fluorescence intensity in the right tumor than that in the control left tumor, which was consistent with the results of cell imaging. Therefore, these results demonstrated that Cy-DNH2 has good capability to image endogenous MGO and elevated levels of MGO appearing in tumors induced by GLO1 inhibitor curcumin.
Fluorescence imaging of MGO in the gastritis mouse model
Gastritis is one of the most common inflammatory metabolic diseases; if not treated in time, it might develop into gastric cancer. There remains a need to develop non-invasive methods for diagnosis of gastritis. Previous studies have shown that an increase in MGO levels was observed in inflammatory gastrointestinal cells.17 To demonstrate the potential of Cy-DNH2 to visualize MGO in a stomach with gastritis, a mouse model of gastritis was established by intragastric administration of alcohol (Fig. 5a).38 30 min later, 150 μL of Cy-DNH2 was injected into the stomachs of the mice, and fluorescence imaging was performed. The fluorescence signals of mice with gastritis were significantly higher than those of healthy mice (Fig. 5b and d). Then, we collected the major organs of the mice, including the stomach, and found that the stomach with gastritis showed stronger fluorescence intensity (Fig. 5c). In addition, compared with the normal stomach, obvious swelling, superficial mucosal congestion, and fibrous tissue hyperplasia were observed in the stomach with gastritis. The results of H&E staining further verified the successful establishment of gastritis (Fig. 5e). Therefore, Cy-DNH2 has great potential as a useful fluorescent tool in the diagnosis of gastritis.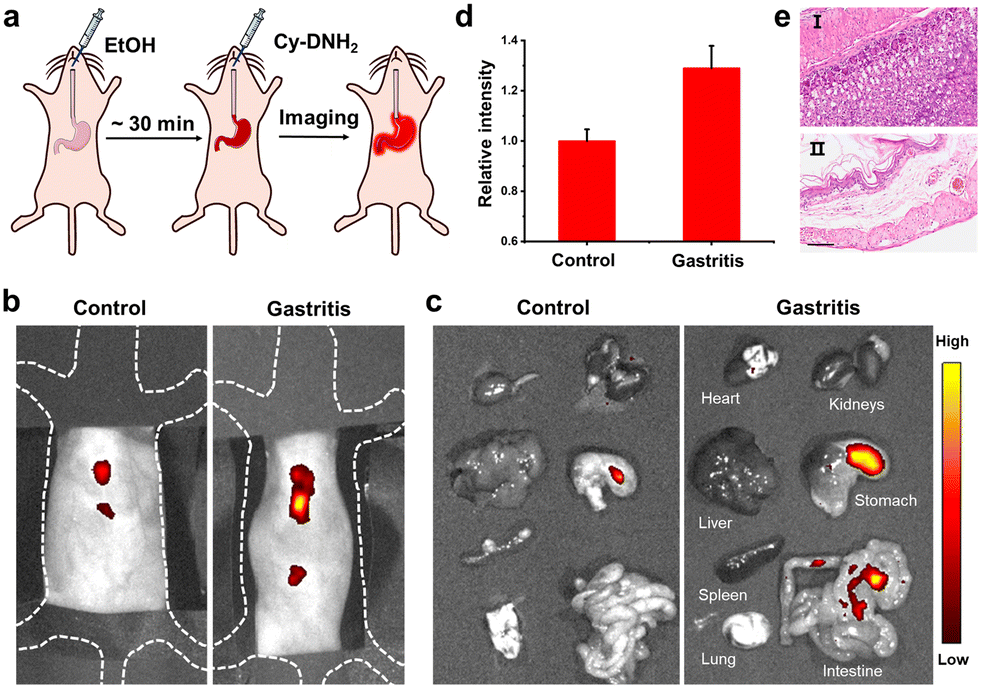 | ||
| Fig. 5 (a) Construction of a mouse model of acute gastritis. (b) Fluorescence images of the control mouse and gastritis mouse. (c) Representative ex vivo fluorescence images of major organs. (d) Relative fluorescence intensity around the stomach in (b). (e) H&E staining analysis of stomach tissues in the normal mouse (I) and the gastritis mouse (II), scale bar = 100 μm. | ||
Conclusions
Here, we developed an acid-promoted fluorescent probe Cy-DNH2 for monitoring MGO levels in tumors and gastritis. Compared with previously reported probes, Cy-DNH2 has high sensitivity and good selectivity to MGO in an acidic environment, showing a low LOD of 95 nM. It can not only image the accumulation of endogenous MGO in lysosomes of cells, but also monitor the GLO1 activity in the tumor-bearing mouse model. Furthermore, Cy-DNH2 was successfully applied to visualize the up-regulation of MGO levels in the gastritis mouse model. Taken together, Cy-DNH2 is a promising fluorescent probe for the detection of MGO under acidic conditions.Author contributions
W. X. and H. X. designed the research; W. X., S. L. and W. C. performed the experiments. W. X., S. L. and H. X. analyzed the data; W. X. and H. X. wrote the paper; H. X. supervised the research.Conflicts of interest
The authors declare no competing financial interest.Acknowledgements
This work was supported by the National Natural Science Foundation of China (22174078) and the Fundamental Research Funds for the Central Universities, Nankai University (63221408).Notes and references
- H. Wang, Y. Xu, L. Rao, C. Yang, H. Yuan, T. Gao, X. Chen, H. Sun, M. Xian, C. Liu and C. Liu, Anal. Chem., 2019, 91, 5646–5653 CrossRef CAS PubMed.
- Y. Guo, Y. Zhang, X. Yang, P. Lu, X. Yan, F. Xiao, H. Zhou, C. Wen, M. Shi, J. Lu and Q. H. Meng, Cancer Biol. Ther., 2016, 17, 169–180 CrossRef CAS PubMed.
- Y. Lai, Y. Dang, Q. Sun, J. Pan, H. Yu, W. Zhang and Z. Xu, Chem. Sci., 2022, 13, 12511–12518 RSC.
- M. Yang, J. Fan, J. Zhang, J. Du and X. Peng, Chem. Sci., 2018, 9, 6758–6764 RSC.
- S. S. More, A. P. Vartak and R. Vince, ACS Chem. Neurosci., 2013, 4, 330–338 CrossRef CAS PubMed.
- Q. Xie, Y. Zhan, L. Guo, H. Hao, X. Shi, J. Yang, F. Luo, B. Qiu and Z. Lin, ChemistryOpen, 2022, 11, e202200055 CrossRef CAS PubMed.
- D. Prantner, S. Nallar, K. Richard, D. Spiegel, K. D. Collins and S. N. Vogel, J. Leukocyte Biol., 2021, 109, 605–619 CrossRef CAS PubMed.
- S. Koike, C. Ando, Y. Usui, Y. Kibune, S. Nishimoto, T. Suzuki and Y. Ogasawara, Brain Res. Bull., 2019, 144, 164–170 CrossRef CAS PubMed.
- C. Sibbersen, J. Palmfeldt, J. Hansen, N. Gregersen, K. A. Jorgensen and M. Johannsen, Chem. Commun., 2013, 49, 4012–4014 RSC.
- D. J. Selkoe, Science, 2002, 298, 789–791 CrossRef CAS PubMed.
- C. Ding, F. Wang, Y. Dang, Z. Xu, L. Li, Y. Lai, H. Yu, Y. Luo, R. Huang, A. Zhang and W. Zhang, Anal. Chem., 2019, 91, 15577–15584 CrossRef CAS PubMed.
- K. O. Alfarouk, S. S. Alqahtani, S. Alshahrani, J. Morgenstern, C. T. Supuran and S. J. Reshkin, J. Enzyme Inhib. Med. Chem., 2021, 36, 2010–2015 CrossRef CAS PubMed.
- M. Cnop, F. Foufelle and L. A. Velloso, Trends Mol. Med., 2012, 18, 59–68 CrossRef CAS PubMed.
- Y. Dang, Y. Lai, F. Chen, Q. Sun, C. Ding, W. Zhang and Z. Xu, Anal. Chem., 2022, 94, 1076–1084 CrossRef CAS PubMed.
- A. Bellahcene, M. J. Nokin, V. Castronovo and C. Schalkwijk, Semin. Cancer Biol., 2018, 49, 64–74 CrossRef CAS PubMed.
- C. J. Chao, J. S. Shin, W. C. Hsu and P. M. Wang, Endoscopy, 2013, 45, E280–E281 CrossRef PubMed.
- K. Sugano, J. Tack, E. J. Kuipers, D. Y. Graham, E. M. El-Omar, S. Miura, K. Haruma, M. Asaka, N. Uemura and P. Malfertheiner, Gut, 2020, 70, 431–432 Search PubMed.
- I. L. P. Beales, Gut, 2020, 70, 431–432 Search PubMed.
- Y. Wu, J. Gu, S. Zhang, Y. Gu, J. Ma, Y. Wang, L. W. Zhang and Y. Wang, Anal. Chem., 2021, 93, 6414–6420 CrossRef CAS PubMed.
- S. Brighina, C. P. Turrado, C. Restuccia, G. Walton, B. Fallico, M. J. Oruna-Concha and E. Arena, Food Chem., 2021, 341, 128237 CrossRef CAS PubMed.
- G. Liu, Q. Xia, Y. Lu, T. Zheng, S. Sang and L. Lv, J. Agric. Food Chem., 2017, 65, 2233–2239 CrossRef CAS PubMed.
- M. Y. Wu, B. G. Chen, C. D. Chang, M. H. Huang, T. G. Wu, D. M. Chang, Y. J. Lee, H. C. Wang, C. I. Lee, C. L. Chern and R. H. Liu, J. Chromatogr. A, 2008, 1204, 81–86 CrossRef CAS PubMed.
- S. Liu, Y. Zhu, P. Wu and H. Xiong, Anal. Chem., 2021, 93, 4975–4983 CrossRef CAS PubMed.
- P. Wu, Y. Zhu, S. Liu and H. Xiong, ACS Cent. Sci., 2021, 7, 2039–2048 CrossRef CAS PubMed.
- W. Xu, S. Liu, Z. Chen, F. Wu, W. Cao, Y. Tian and H. Xiong, Anal. Chem., 2022, 94, 13556–13565 CrossRef CAS PubMed.
- S. Liu, W. Xu, X. Li, D.-W. Pang and H. Xiong, ACS Nano, 2022, 16, 17424–17434 CrossRef CAS PubMed.
- W.-X. Wang, W.-L. Jiang, G.-J. Mao, M. Tan, J. Fei, Y. Li and C.-Y. Li, Anal. Chem., 2021, 93, 3301–3307 CrossRef CAS PubMed.
- L. Yan, Q.-S. Gu, W.-L. Jiang, M. Tan, Z.-K. Tan, G.-J. Mao, F. Xu and C.-Y. Li, Anal. Chem., 2022, 94, 5514–5520 CrossRef CAS PubMed.
- S. T. Wang, Y. Lin, C. D. Spicer and M. M. Stevens, Chem. Commun., 2015, 51, 11026–11029 RSC.
- T. Wang, E. F. Douglass, K. J. Fitzgerald and D. A. Spiege, J. Am. Chem. Soc., 2013, 135, 12429–12433 CrossRef CAS PubMed.
- H. Xu, Q. Liu, X. Song, C. Wang, X. Wang, S. Ma, X. Wang, Y. Feng, X. Meng, X. Liu, W. Wang and K. Lou, Anal. Chem., 2020, 92, 13829–13838 CrossRef CAS PubMed.
- W. Zhang, F. Zhang, Y. L. Wang, B. Song, R. Zhang and J. Yuan, Inorg. Chem., 2017, 56, 1309–1318 CrossRef CAS PubMed.
- Y. Dang, F. Wang, L. Li, Y. Lai, Z. Xu, Z. Xiong, A. Zhang, Y. Tian, C. Ding and W. Zhang, Chem. Commun., 2020, 56, 707–710 RSC.
- Z. Wang, Y. Bian, C. Liu, S. He, L. Zhao and X. Zeng, Chem. Commun., 2022, 58, 6453–6456 RSC.
- A. Ballabio and J. S. Bonifacino, Nat. Rev. Mol. Cell Biol., 2020, 21, 101–118 CrossRef CAS PubMed.
- Z. Zeng, S. S. Liew, X. Wei and K. Pu, Angew. Chem., Int. Ed., 2021, 60, 26454–26475 CrossRef CAS PubMed.
- M. Lv, Y. Yu, M. E. Sandoval-Salinas, J. Xu, Z. Lei, D. Casanova, Y. Yang and J. Chen, Angew. Chem., Int. Ed., 2020, 59, 22179–22184 CrossRef CAS PubMed.
- Y. Tian, Z. Chen, S. Liu, F. Wu, W. Cao, D.-W. Pang and H. Xiong, Angew. Chem., Int. Ed., 2023, 62, e202309768 CrossRef CAS PubMed.
Footnotes |
| † Electronic supplementary information (ESI) available. See DOI: https://doi.org/10.1039/d3sd00228d |
| ‡ These authors contributed equally to this work. |
| This journal is © The Royal Society of Chemistry 2024 |