 Open Access Article
Blood pressure measurement techniques, standards, technologies, and the latest futuristic wearable cuff-less know-how
Shubham
Kumar
 ab,
Sanjay
Yadav
ab and
Ashok
Kumar
*ab
aCSIR-National Physical Laboratory, Dr. K. S. Krishnan Marg, New Delhi 110012, India. E-mail: ashok553@nplindia.org
bAcademy of Scientific and Innovative Research (AcSIR), Ghaziabad-201002, India
First published on 3rd January 2024
Abstract
Regular blood pressure (BP) monitoring is the keystone to early prevention of hypertension, a major factor of heart-related disease and the leading cause of mortality worldwide. As human health is of the utmost concern, tremendous efforts have been made to advance health monitoring devices over time. At present, various techniques, broadly classified as invasive, cuff-based, and cuff-less non-invasive techniques, are used to measure human BP. In the past few years, flexible and wearable healthcare technologies have attracted great attention toward continuous BP monitoring and enabling long-term human health surveillance. To keep all this in mind, we have reviewed the literature and present a comprehensive survey of various types of BP measurement techniques and their algorithms. This review also focused on flexible and wearable continuous BP monitoring technologies and their validation according to the universal standard. Furthermore, recently developed state-of-the-art wearable devices are also discussed, which show a great potential to estimate BP in the future. Eventually, this review will provide a better understanding of BP measurement techniques and wearable technologies and expose the reader to new perspectives on continuous BP monitoring.
1. Introduction
Blood pressure (BP) is one of the most important measurable physiological parameters, indicating how well the cardiovascular system functions. High blood pressure or hypertension is a leading cause of heart attack, stroke, and early death.1 Global Burden of Disease (GBD) reported that hypertension causes more than one million deaths in India annually and more than 10 million deaths worldwide.2–4 Thus, the prevention of hypertension is the most important challenge for public healthcare globally. However, hypertension is an asymptomatic disease, and we cannot figure it out without measuring it. Fortunately, it can be controlled through medications and lifestyle changes if detected in the early stages.5 A survey reported that 25% of the rural and 33% of the urban population in India are hypertensive, and less than 3% of the rural and less than 7% of the urban population have their BP under control.6 Therefore, in order to prevent and diagnose hypertension, BP measurement is necessary to be done on a regular basis.Around the end of the 20th century, BP was measured either invasively using a catheter, which is painful and uncomfortable for patients/volunteers, or via auscultation, which needs an expert with good hearing capability.7 This motivated the development of new automated techniques to measure BP non-invasively. Although Marey first introduced the oscillometric method at the end of the nineteenth century, measuring systolic and diastolic pressures took nearly a hundred years.8 The oscillometric method provides expert-free, self-BP monitoring and also provides healthcare professionals with accurate, real-time healthcare data so they can choose the optimal treatment plans. Additionally, this kind of surveillance can save millions of lives all across the world. At present, these oscillometric-based automated BP devices are the best choice for monitoring BP at home as well as in the clinic.9 Since these devices mainly rely on cuff-based measurement and measure the BP intermittently, this limits their utilization for portable and wearable applications in our day-to-day life.
In the past few years, interest in wearable sensor devices has increased and attracted more attention toward continuous health monitoring technologies. Early efforts in this field focused on physical sensors such as pressure and strain sensors that can monitor the signal from different locations (Fig. 1). Wearable sensors hold considerable promise for non-invasive biomedical applications due to their low-cost development, portability, and low power consumption. Furthermore, good interfacing with the skin and body also helps in the adoption of wearable sensor devices.10 The increasing number of recently published proof-of-concept studies demonstrates the potential of wearable sensors.
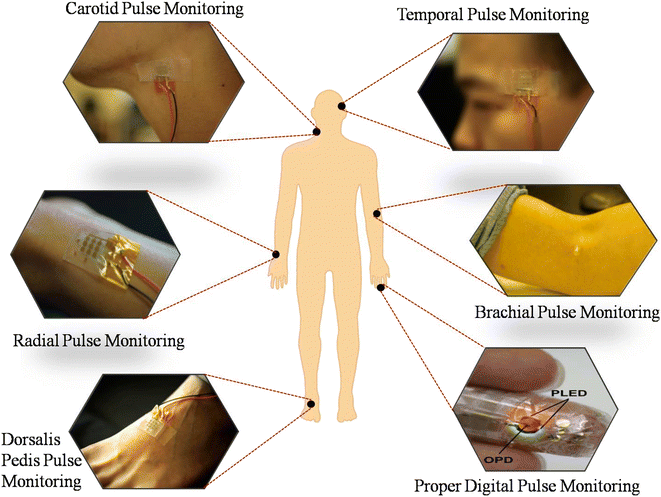 | ||
| Fig. 1 Representative examples of wearable sensors for pulse monitoring. Anticlockwise from the top right: temporal pulse monitoring, carotid arterial pulse monitoring, radial pulse monitoring, doralis pedis pulse monitoring using a soft iontronic capacitive pressure sensor (adapted from P. R. et al.15), proper digital pulse monitoring using an organic photodetector (adapted from T. Y. et al.30), and brachial pulse monitoring using a strain sensor (adapted from Y. C. et al.31). | ||
The dimension of wearable device applications has exponentially increased with the branching out from tracking physical activities, muscle movement during exercise, and health monitoring.11,12 To execute these goals, exceptional efforts to the development of wearable devices have been made by the researchers. The wearable sensor devices provide portable strategies and enable people to observe long-term changes in health. Recently, wearable devices that can quickly and accurately measure BP have gained great attention towards early detection of hypertension.13,14 In contrast to the conventional method, which records the information about blood pressure via auscultation or a sensor by applying external pressure, the wearable sensor network or device employs passive measurement and provides continuous beat-to-beat measurement as no external stimuli are applied. However, several of these technologies are under clinical validation and their commercialization is underway. This advancement in technologies follows the paradigm of miniaturization of existing cuff-based devices with reasonable accuracy. Modern flexible pressure sensors based on different mechanisms, such as a piezocapacitive, piezoresistive, piezoelectric, triboelectric, and organic photodetector, and integration with digital health ecosystems are just a few examples of technological advancements in BP monitoring.15–20 Moreover, integration with the ‘internet of things’ can strengthen the future of the ‘internet of medical things’.21
Several studies emphasize this area's significance and suggest that a timely assessment is required. Previously, several review articles have been published that focused on the historical evolution of BP measurement techniques, instruments, and their calibration,7 systematic approach in invasive techniques,22 oscillometric BP measurement,23 cuff-less measurement techniques,24,25 advances in non-invasive BP monitoring,26,27 piezoelectric approach for BP monitoring,28 and wearable two- and three-dimensional sensors for BP measurements.13,14,29 Still, a comprehensive systematic study of the BP measurement techniques and the recently developed flexible and wearable technologies using these techniques is missing in the literature. Additionally, the validation of these developed wearable technologies from the universal standard is not discussed in the literature. Therefore, in this study, we have reviewed the various techniques and algorithms used for BP measurement and also focused on flexible and wearable technologies for BP monitoring. Furthermore, the accuracy and validation of the developed devices are also discussed. Additionally, this study summarizes the new technology proposed for the detection of biosignals that may be used for BP monitoring in the future.
This review has been organized by dividing it into five sections as follows. In section 1, we have already discussed the necessity of BP measurement and a brief of advanced technologies towards wearable devices. Section 2 and its subsections discuss the techniques and their algorithms used to calculate BP. The history of the validation protocol and the current standard for BP measurement are discussed in section 3, in which the acceptable accuracy of any device is highlighted. In section 4, recent advances in BP measurement using new miniaturized and wearable technology are reviewed. In section 5, we discuss the advantages and disadvantages of traditional and new measurement technologies and their validation. The review ends with a summary in section 6.
2. Blood pressure measurement techniques
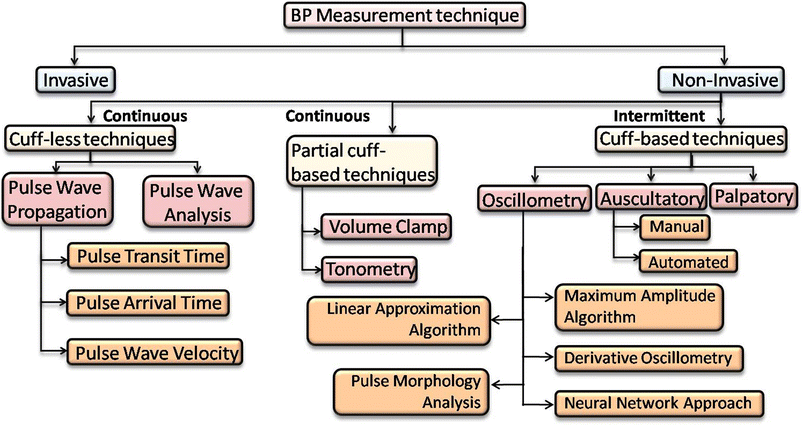
Understanding the impact of diverse methodologies for BP measurement is crucial for designing accurate sensing devices suited for healthcare. The heart pumps the blood and circulates it in the arterial network, which creates a pressure gradient on the arterial wall. That amount of pressure applied by the blood onto the arterial wall is known as blood pressure. Systolic blood pressure (SBP) is produced during the cardiac cycle as blood is pumped by the heart, and diastolic blood pressure (DBP) is produced while the heart is at rest in between heartbeats. The term pulse pressure (PP) is sometimes used to evaluate heart function and is defined as the difference between SBP and DBP during a cardiac cycle. The mean arterial pressure (MAP) or mean blood pressure (MBP) is the average pressure during one cardiac cycle and is calculated by dividing the area of the cardiac cycle by the cycle duration. Generally, a healthy person's SBP and DBP are less than 120 mmHg and 80 mmHg, respectively.32 An abnormal BP reading may be linked to the occurrence of numerous cardiovascular problems (e.g., stroke and heart failure). Since arterial pressure changes continuously during the cardiac cycle, the morphological characteristics of many blood pressure-related signals also change.There are several techniques to measure BP, which are broadly classified into two categories: invasive and non-invasive techniques (Fig. 2). Further, the non-invasive category is divided into two groups: intermittent techniques, which can monitor the BP in intervals, and continuous techniques, which can monitor the BP in continuous mode. The intermittent technique includes cuff-based techniques such as palpatory, auscultatory, and oscillometry. In contrast, the continuous technique includes partial cuff-based techniques such as volume clamp and tonometry as well as complete cuffless techniques such as pulse wave propagation and pulse wave analysis techniques. All these techniques and their algorithms are discussed in the next section (Table 1).
| S. no. | Measurement technique | Advantage | Disadvantage | Level of accuracy |
|---|---|---|---|---|
| 1 | Invasive (intra-arterial) | Provides the exact BP value | Performed only in the ICU | Most accurate |
| 2 | Palpatory | For estimation of BP in emergencies | Generally only measures SBP and requires an expert | Very less accurate |
| 3 | Manual auscultatory | |||
| (i) Mercury sphygmomanometer | Considered as the gold standard in non-invasive techniques | Contains mercury, which is hazardous to human health | High accuracy | |
| Also requires an expert with good hearing capability | ||||
| (ii) Aneroid sphygmomanometer | Mercury free | Prone to malfunction due to its inherent mechanical design | High inaccuracy | |
| (iii) Hybrid sphygmomanometer | Mercury free, minimizes the error by dial gauge | Requires an expert with good hearing capability | High accuracy | |
| Automated auscultatory | Digital display | Sensitive to noise and motion artifacts | Relatively accurate | |
| 4 | Oscillometry | Easy to operate, no expert required | Depends on the algorithm, intermittent and inconvenient | Relatively accurate |
| 5 | Volume-clamp | Continuous BP monitoring | Uncomfortable for long time monitoring | Low accuracy |
| 6 | Tonometry | Continuous BP monitoring | Calibration required for individuals | Low accuracy |
| 7 | Photoplethysmography | Continuous, can be integrated with a wearable device | Calibration required for individuals | Low accuracy |
2.1 Invasive techniques
In the invasive technique, an intravascular catheter is inserted into the artery. The catheter comprises (i) an intra-arterial cannula, (ii) an infusion tube, and (iii) a pressure transducer. The artery is accessed by the cannula made of Teflon, Vialon, PU, and PVC to lessen the chance of arterial thrombus development.33–36 Between the artery system and the pressure transducer, a column of non-compressible fluid is provided by the infusion tube, which is connected to the cannula. The fluid in the tube is directly connected to the flexible diaphragm, which produces a waveform in the transducer. Utilizing silicon- or non-silicon-based MEMS, the pressure transducer transforms this pressure wave into an electrical signal.37–39 Some anatomical sites are commonly used for catheter insertion, such as radial, femoral, and brachial arteries.22 Other than this, ulnar, axillary, temporal, and dorsal pedis arteries are used less frequently.40 However, this technique is usually restricted to the intensive care unit (ICU) due to its complexity and inconvenience for the patient. Still, it is the most accurate way for BP measurement and is considered a gold standard compared to all other techniques.292.2 Cuff-based non-invasive techniques
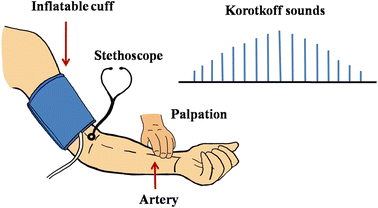
Several non-invasive BP measurement methods have been developed which require less expertise and are safer than invasive techniques. These non-invasive techniques are divided into two groups: manual and automated. The manual BP measurement technique comprises a mercury-based manometer and an inflatable cuff. The cuff is placed on the subject's upper arm to occlude the brachial artery by applying suprasystolic pressure, and then the cuff is deflated at a certain rate. The following techniques estimate the BP during deflation.(a) Manual auscultatory technique. In 1905, Nikolai Korotkoff developed the auscultatory technique to measure BP.42 In this technique, the brachial artery is occluded by an inflatable cuff, as in the case of the palpatory method. As the cuff pressure is gradually deflated, sounds originate from a turbulent flow of blood. These sounds become louder as the cuff pressure decreases. When the artery is completely open, the sounds disappear due to the laminar flow of blood (Fig. 3). In this process, the observed sounds, known as the Korotkoff sounds, have been divided into five phases: phase I, clear tapping sound; phase II, softer and longer sound; phase III, crisper and louder sound; phase IV, muffled and softer sound; phase V, no sound. The BP is measured by listening to these Korotkoff sounds with the stethoscope and a mercury sphygmomanometer. The pressure corresponding to the first Korotkoff sound (phase I) is the SBP, and the pressure corresponding to the disappearance of the Korotkoff sound (phase V) is the DBP.43 Although this method is a hundred years old, it is still the gold standard.7,29
Since mercury is hazardous to humans and the environment, the aneroid and hybrid sphygmomanometer is utilized instead of the mercury-based manometer. In the aneroid manometer, the cuff pressure is observed using a mechanical system of bellows that expand with the cuff pressure. Since the aneroid manometer has less stability over time and requires regular calibration, therefore its accuracy decreases over time.44–46 In a hybrid sphygmomanometer, an electronic pressure gauge is used in place of a mercury column. In this version, the deflation knob is pressured when the systolic and diastolic pulse is heard, and the electronic pressure gauge shows the systolic and diastolic blood pressure on the digital display.47
(b) Automated auscultatory technique. Instead of the Korotkoff sound which comprises only the audible portion of the pulse, the Korotkoff vibration comprises the audible as well as the inaudible portion of the pulse. In the automated auscultatory technique, these vibrations are detected by a microphone placed over the brachial artery, where the strongest pulse is felt. In a report, Xuegang X. replaced the mercury column with an electronic air transducer to read the pressure magnitude in the LCD monitor.48 In another report, Li X. et al. utilized a microphone with a polyvinylidene fluoride film and air pressure transducer to record the pulse.49 The systolic and diastolic pressures were determined traditionally by the first appearance and disappearance of Korotkoff sound, respectively. Several novel deep learning-based algorithms have been also developed to determine blood pressure.50
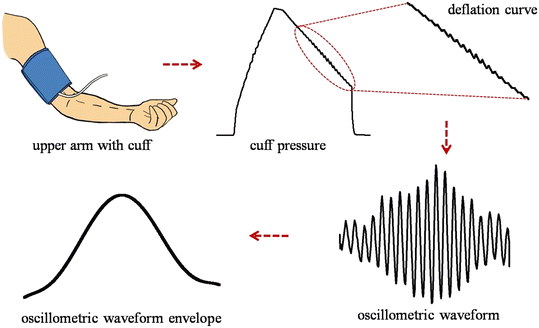
These superimposed oscillations are extracted by a filtering and a detrending approach. In the filtering approach, band-pass filters are used to remove the frequency components of cuff pressure,8,51–54 whereas in the detrending approach, a best-fit line or curve representing the deflation curve is subtracted from the parent deflation curve.55 The filtered or detrended pulse wave is known as the oscillometric waveform (OMW). In this OMW, the pulse's amplitude is increased up to a certain value and then decreases with deflation. These OMWs contain the BP information and different algorithms such as the maximum amplitude algorithm, linear approximation algorithm, derivative oscillometry approach, pulse morphology analysis, and neural network approach are reported to calculate BP.54,56 These algorithms are discussed in the following sub-sections.
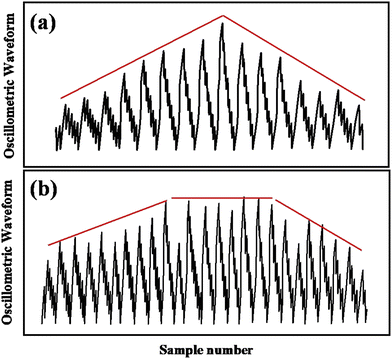
(a) Maximum amplitude algorithm (MAA). The maximum amplitude algorithm is the most often used algorithm for calculating BP. As determined by the MAA, the pressure corresponding to the upper envelope's global maximum is known as the MBP. The SBP and DBP are estimated by a pre-calculated ratio derived empirically from the MBP point, known as the characteristic ratio of the algorithm (Fig. 5a). In the MAA, the MBP can be measured more accurately due to the global maximum of the OMW envelope, but the OMW may vary with the pressure sensor, experimental set-up, environmental conditions, subject postures, and many other factors. Consequently, SBP and DBP cannot be measured precisely. Various publications report the ratio to be in the range of 0.30 to 0.75 and 0.60 to 0.90 for systolic and diastolic pressure, respectively.8,52,53,56–61 Moreover, it has also been observed that the OMW changes with various health conditions and age groups.62–65
 | ||
| Fig. 5 Graphical representation of the principle of (a) maximum amplitude algorithm, (b) linear approximation algorithm, and (c) derivative oscillometry algorithm. | ||
Since the MAA measures the BP by using only the upper envelope of the collected waveform and discarding the pulse's rich informational content, oscillometric algorithms that can assess the pulses during pressure deflation need to be developed. Besides, the estimation of SBP and DBP completely depends on the estimation of mean BP. Also, the MAA is extremely sensitive to motion artifacts and noise that could change the MBP's actual location, which can alter the systolic and diastolic values. In most of the publications, the characteristic ratio is derived empirically and kept constant throughout the study. Therefore, a new algorithm with a dynamic ratio or a characteristic ratio-free algorithm is needed.
(b) Linear approximation algorithm (LAA). The LAA is almost similar to the MAA except for the way to find the MBP.66 This algorithm approximates the OMW envelope by two best-fit lines; one for the rising side of the envelope and another for the falling side. These two lines form a triangle with the baseline. The pressure that corresponds to the intersection point of these best-fit lines is taken as the MBP (Fig. 5b). Compared to the MAA, this algorithm is less sensitive to erroneous points on the envelope, occurs due to noise or motion artifacts, and can also be used with a high deflation rate.67
(c) Derivative oscillometry. Since the characteristic ratios are derived empirically and vary from device to device and subject to subject, therefore a new trend of the characteristic ratio-free oscillometric method was discovered.68 Similar to the previous algorithms, derivative oscillometry also calculates the BP using the upper envelope of the oscillometric waveform (Fig. 5c). Instead of a characteristic ratio, this method calculates the BP by analyzing the slope of the oscillometric waveform envelope.69 It was reported that the derivative of the envelope is maximum at the diastolic pressure and minimum at the systolic pressure.58 However, the derivative oscillometry method provides the characteristic free measurement of SBP and DBP but it also depends on the envelope, which is sensitive to motion artifacts. Therefore, this algorithm also needs a high-quality signal to function properly.
(d) Pulse morphology analysis. All the previously discussed algorithms use the OMWE and ignore the inherent information of the oscillometric pulses; the pulse morphology method observes the variations in the nature of the oscillometric pulse and calculates the BP. To do this, various features are extracted from each pulse, and their variations are analyzed against the deflation curve.70–72
In this method, the MBP is derived by mapping the pulse with maximum amplitude (known as mean pulse) to the deflation curve. The SBP and DBP can be obtained by mapping the pulse (systolic pulse), whose amplitude is equal to the division of the integral of the mean pulse. At the same time, the DBP can be obtained by projection of the pulse whose amplitude is equal to the difference between the amplitude mean and the systolic pulse (Fig. 6a).
However, this method is capable of estimating the BP within the acceptable limit of error, but only under normal pulse rhythm conditions. On the other hand, in the case of irregular pulse rhythm, it is difficult to find the mean pulse. To overcome this, Song et al. proposed a new pulse morphological analysis method in which a straight line is drawn from peak to end for each pulse.73 The MBP is calculated by mapping the pulse at which the area between the straight line and the pulse is smaller than the previous one (Fig. 6b).
(e) Neural network approach (artificial intelligence technique). Similar to the previous algorithms, neural network (NN) algorithms can perform in two ways: (1) by extracting the feature of OMP (oscillometric pulse) and (2) by extracting the feature of OMWE. The OMWE-based algorithms include (i) a probabilistic method that finds the characteristic ratios based on Bayesian inference,74 (ii) a multiple linear regression method that estimates the characteristic ratios by using ten features of the envelope and area under the envelope before and after the maximum amplitude position,75 (iii) a support vector regression method establishes the relation between the characteristic ratios and extracted features using the Lagrangian theory,76 (iv) a feed-forward NN method estimates the BP by layered network named as input, output, and hidden layer with nodes,77 and (v) a deep learning regression method provides an advantage to the feed-forward NN method of an unsupervised learning step to initializing each layer in the network.78 Similarly, several algorithms such as (i) feed-forward NN classification method, (ii) hidden Markov model-based method, (iii) long–short-term-memory recurrent NN method, and (iv) deep belief network–deep NN classification model are also reported to estimate the BP.79–82 A detailed description of these algorithms can be found in a previously reported review.83
2.3 Partial cuff-based non-invasive techniques
Although this type of device was used for the first time in the 19th century, motion artifacts, unstable counter pressure, and misalignment make this technique difficult. Besides, calibration is required for individuals, due to which it cannot be considered suitable for regular users and is limited to the intensive care unit (ICU).
2.4 Cuff-less non-invasive techniques
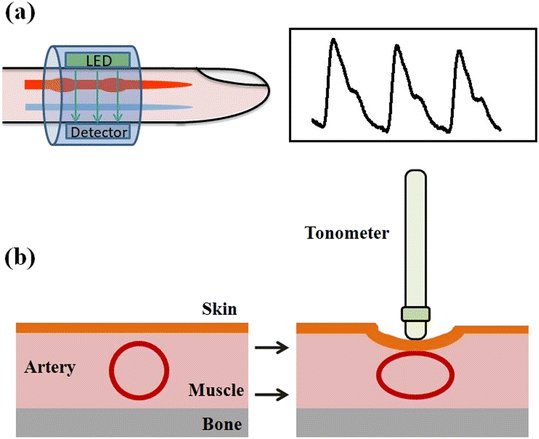
However, cuff-based techniques are safer and more convenient than invasive techniques and provide continuous blood pressure monitoring without any major side effects. Since these techniques utilize a cuff, they can only measure blood pressure intermittently. Additionally, interruptions in regular blood flow make these techniques uncomfortable for the patient, which are limited to the measurement for long-term BP monitoring. Consequently, these measurement techniques cannot be utilized for continuous blood pressure monitoring. This motivates us to replace cuff-based techniques with cuff-less techniques.Recently, the photoplethysmography (PPG) approach has shown great promise for continuous monitoring of BP. PPG is an optical technique that calculates the BP by measuring the change in blood volume per pulse. In addition to BP, PPG is frequently used in the healthcare industry to provide a prediction for critical health-related parameters such as blood oxygen saturation, heart rate, atrial stiffness, and blood glucose level.84–87
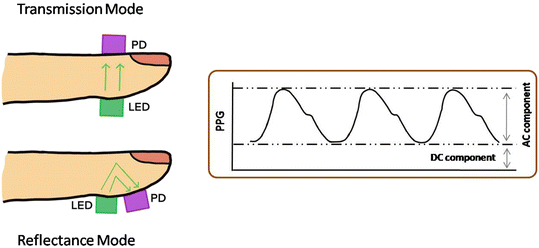
The PPG technique consists of two elements: a light-emitting diode (LED) for illumination and a photodiode to measure the absorption of incident light during measurement. Two different modes, (i) transmission and (ii) reflectance, are used to record the PPG waveform (Fig. 8). Similar to the deflation curve in oscillometry, PPG also consists of two components: first, the DC component arises due to the absorption from non-vascular tissue and respiration.24 Second is the AC component, superimposed on the DC component, and arising due to blood flow in the artery. This AC component is further processed through several methods employed for BP measurement and discussed in the next sections.
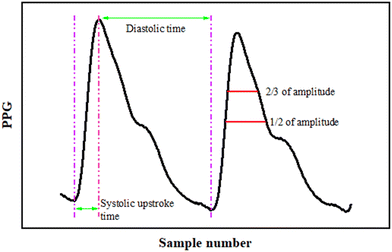
(a) Pulse transit time. The time taken by a pulse to transit between two arterial locations is known as the PTT. Two PPG sensors placed at two different locations on the arterial tree are used to measure PTT. The most popular sites for PTT are the toes and fingers.88,89 The BP parameters are derived by the time difference between the collected waveforms.90–93 Chen et al. reported a strong relationship between the PTT calculated by foot-to-foot time and DBP measured by an invasive method.94 Nevertheless, according to a different study, that is not always the case.88 Besides, PTT can also be calculated as foot-to-peak, foot-to-mid point, and peak-to-mid point time delay, as shown in Fig. 9.95
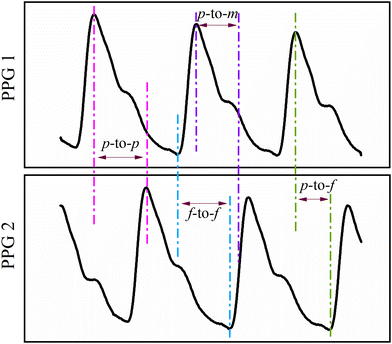 | ||
| Fig. 9 Graphical representation of PTT measurement using peak-to-peak (p-to-p), peak-to-mid-point (p-to-m), peak-to-foot (p-to-f), and foot-to-foot (f-to-f) time delay. | ||
The PTT technique usually has three operations: (i) two PPG sensors for two sites' waveform measurements, (ii) PTT parameter calculation, and (iii) calibration. Therefore, the PTT technique has several disadvantages in order to calculate the BP. Firstly, two PPG sensors are required. Since these sensors are very sensitive to the subject's movement, which creates an error in estimated BP, these waveform motion artifacts can be removed by smoothing or filtering. Secondly, the physiological parameters varied from person to person. Therefore it requires calibration for individuals.91
(b) Pulse arrival time (PAT). The PAT technique is similar to the PTT, except that in PAT an ECG sensor is used instead of the first PPG sensor. Therefore, the pulse arrival time is the amount of time the pulse takes to travel from the ECG to the PPG sensor, i.e., the time difference between the electrical signal activated by the heart and arterial sites such as the toes, fingers, and forehead.
PAT is calculated by the delay between the R peak of ECG and the rising edge of PPG. As shown in Fig. 10, three features are considered to be calculated for the time difference, such as peak-to-peak,96 peak-to-foot,97 and peak-to-mid point of PPG.98 A report suggests that the PAT reduces the accuracy of DBP but is still used due to its simplicity.99 Zhang et al. reported that the pulse arrival time is not a surrogate for PTT for SBP and DBP.100 However, some studies suggest that the PAT can measure SBP more accurately.101 Like PTT, PAT has the same disadvantage, such as it is measured by two sensors. Both sensors are sensitive to physiological movement and require smoothening and other filtering approaches, which is not simple, particularly if continuous or intermittent BP monitoring is desired. Similar to PTT, it also needs calibration for every individual.
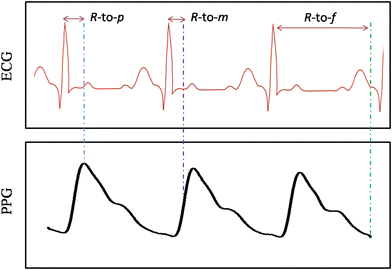 | ||
| Fig. 10 Graphical representation of PAT measurement using the R-peak of the ECG to peak (R-to-p), mid-point on the rising edge (R-to-m), and the foot (R-to-f) of the PPG. | ||
(c) Pulse wave velocity. The PWV is another cuff-less approach for blood pressure measurement. The PWV is a measure of the pressure wave's speed that travels in the artery. The rationale behind this method is that the speed of the beating pulse can be used to calculate blood pressure. During systole and diastole, the blood is forced via central arteries down to smaller arteries.102 This phenomenon changes arterial elasticity and affects the speed of the pulse. Basically, arterial elasticity determines the velocity at which the pulse travels.103 Two PPG sensors at a known distance apart are used to detect PWV on the same artery branch. By using the artery distance (D) between the two measurements and PTT, PWV can be calculated as follows:
| PWV = D/PTT |
3. Validation protocol
Since BP is a hemodynamically variable phenomenon and a vital sign of heart functioning, therefore its accurate measurement is the key element in identifying a patient's hypertension. Instead of true measurement, which is measured by the direct invasive technique, non-invasive techniques provide only the estimation of BP. Unfortunately, clinical validation is not mandatory for marketing BP monitoring devices in all countries at present. Consequently, less than 20% of marketed devices have been subjected to validation using established protocols.3.1 History of validation protocol
3.2 Current validation protocol
4. Recent developments in BP measurement technologies
Since the new development aims to eliminate the need for a specialist, we can monitor blood pressure at home and even during exercise. Thus, in this section, we will not discuss the development of invasive techniques. The palpatory method has no sensor or algorithm and is only roughly used to measure blood pressure in emergency conditions. However, the auscultatory technique is over 100 years old and is still used as the gold standard, but due to its simplicity, this method has no scope for further development. At the same time, developing a mercury-free, expert-free monitoring device for future generations was also necessary.Various flexible and wearable sensors based on different mechanisms have been developed with time. Among them, flexible pressure sensors based on piezocapacitive, piezoresistive, piezoelectric, and triboelectric mechanisms show great potential to capture the biosignals as well as BP measurement (Fig. 12).15–18,120–127 In brief, piezocapacitive-based sensors are generally fabricated by sandwiching a dielectric material between the electrodes; as a result, the capacitance changes with the arterial pressure, whereas, if a conducting material and elastomer are sandwiched, piezoresistive sensors can be fabricated, and the output can be measured in the form of resistance. The piezoelectric sensor can be fabricated using a piezoelectric material integrated with any elastomer, and the output will be the potential difference between the electrodes. The triboelectric sensor is fabricated by sandwiching two different dielectric materials, and the friction of the materials generates voltage.
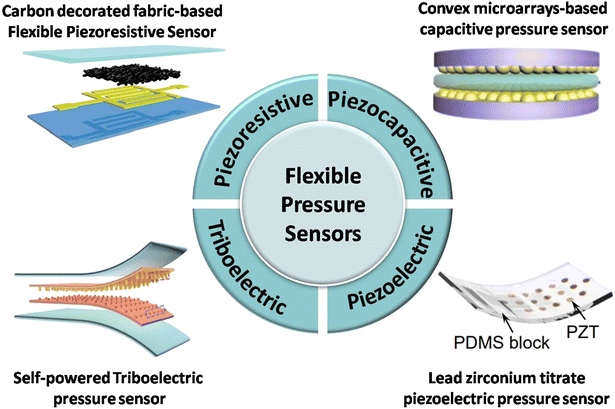 | ||
| Fig. 12 Schematic representation of flexible pressure sensors based on different sensing principles: piezoresistive (adapted from N. L. et al.16), piezocapacitive (adapted from Y. X. et al.120), piezoelectric (adapted from Z. Y. et al.17), and triboelectric (adapted from H. O. et al.127). | ||
However, these sensors are capable of detecting the pulse from different locations, but generally, they need a preload from the other side of the sensor. In contrast, wearable optoelectronic devices based on the photodetector and phototransistors overcome these limitations and provide the PPG signal without any preload. Therefore, we will discuss the developed technologies based on these mechanisms in this section. Similar to the measurement technique section, this section is also divided into parts, including cuff-based, partial cuff-based, and cuff-less technique development. In addition, we will also discuss the futuristic technologies based on the above-mentioned sensor mechanism that can measure arterial pulse and be used to monitor blood pressure in their future extended work.
4.1 In cuff-based techniques
To replace the manual techniques, researchers developed automated BP monitoring devices based on the oscillometric technique. Currently, many BP devices are available in the market, such as Omron Healthcare devices, DrTrust BP monitors, DrMorepeen BP monitors, etc., which work on the inflationary or deflationary oscillometry method.9,128 However, early digital devices had a microphone in the cuff and measured BP using Korotkoff sound.129 Over time the algorithm, sensor quality, and electronics were improved. Since these devices comprise a pressure sensor, usually a cavity-based resistive sensor, recently, a report has proposed a flexible sensor for the replacement of the cavity-based sensor.130 In this work, the sensor was fabricated using polydimethylsiloxane (PDMS) polymer and ITO-coated PET substrate (Fig. 13). The sensitivity was enhanced by patterning the micro-hyperboloid structure on the surface of the dielectric layer. The sensor is based on the capacitive principle, i.e., it shows the change in capacitance on externally applied pressure. The sensor was able to detect the OMW by integrating it with the inflatable cuff. The blood pressure was calculated using the MAA with a characteristic ratio of 0.487 and 0.658. The authors reported that the calculated accuracy was within the universal standard established by the AAMI/ESH/ISO.131 The same group also reported similar studies using a porous dielectric layered and a meso-structured capacitive sensor.132,133 Since these oscillometric-based devices have an inflatable upper arm cuff, which makes the device bulky and limits its operation, the oscillometric approach has been scaled down into various factors and implemented into wearable devices.129 Therefore companies are developing wrist cuff-type wearable BP monitors in which the radial artery is occluded.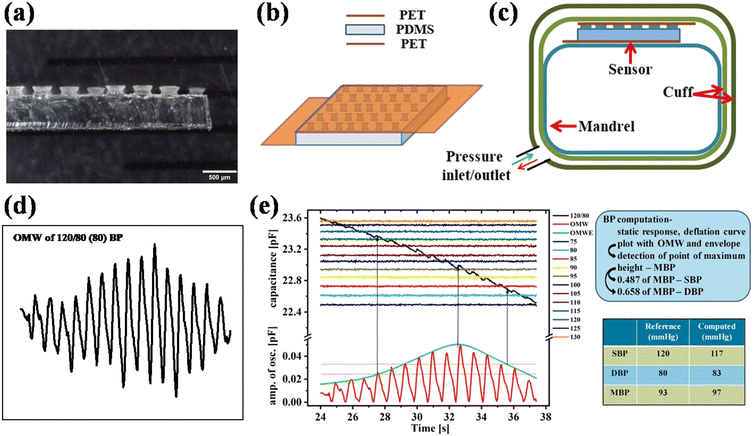 | ||
| Fig. 13 (a) Cross-sectional optical microscopic image of the fabricated micro-hyperboloid structure embedded dielectric layer. Schematics of (b) capacitive pressure sensor and (c) experimental set-up. (d) Collected OMW and (e) BP measurements using OMW and MAA with 0.487 and 0.658 characteristic ratios (adapted from S. K. et al.130,131). | ||
4.2 In partial cuff-based techniques
Recently, a new method was introduced known as the ‘oscillometric finger pressing method’, which comprises a PPG sensor and a pressure sensor.134,135 In this technique, an increasing pressure is applied on the pressure sensor by the finger, and the PPG sensor collects an oscillometric waveform. A smartphone application evaluates the systolic and diastolic BP from the recorded waveform and gives visual feedback to control the amount of pressure exerted over time by the finger. The device measures the SBP and DBP with a mean error of 3.3 and −5.6 mmHg and SD error of 8.8 and 7.7 mmHg, respectively, by performing the measurement on 30 volunteers. Although the sample size of the study was quite -small and the accuracy was close to the standard, still, this study shows that the developed technology can measure BP even after being integrated with a smartphone.An instrument based on the tono-oscillometric method is also developed to measure central blood pressure from the fingertip (Fig. 14a).136 The sensor of the proposed instrument, finger artery non-invasive tono-oscillometric monitor (FANTOM), was constructed using a standard barometric MEMS pressure sensor. The SBP was calculated using a 0.70 systolic ratio of the MBP, while DBP was estimated using a standard relation (DBP = 1/2(3MBP − SBP)). This device calculates the SBP and DBP with an error of −0.9 ± 7.3 (mean ± SD) mmHg and −3.3 ± 6.6 mmHg, respectively, by performing the measurement on 33 volunteers. The advantage of this technology is that it can be integrated into a pulse oximeter probe for patient comfort. The technology shows the potential for developing new wearable or portable BP monitors.
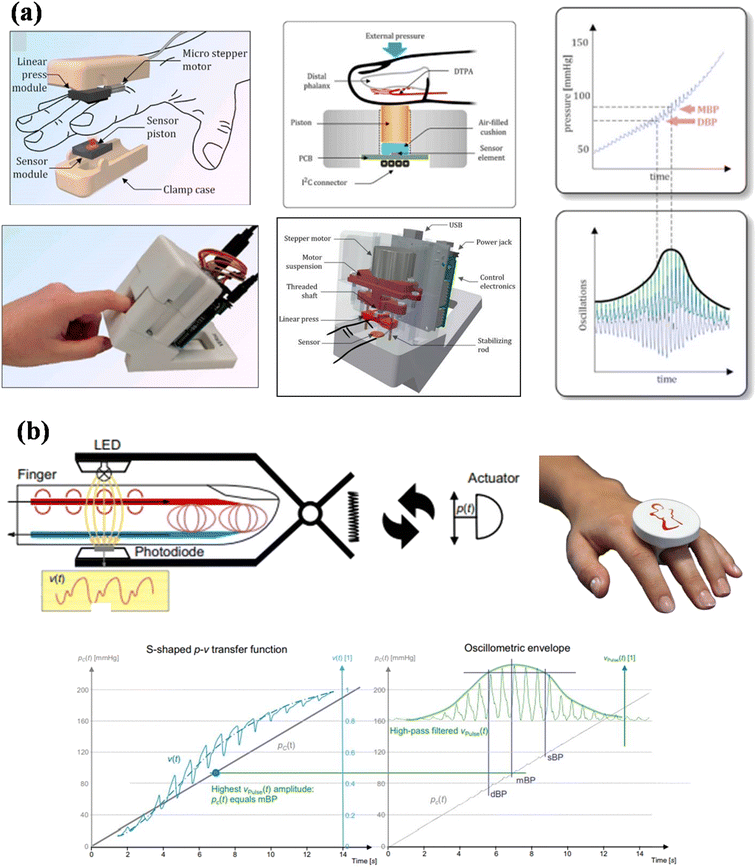 | ||
| Fig. 14 Schematic representation of BP monitoring (a) via a tono-oscillometric-based instrument FANTOM with recorded oscillometric waveform (adapted from T. P. et al.136). (b) CNAP2GO device mechanism and collected OMW (adapted from J. F. et al.137). | ||
In another report, Fortin et al. proposed an innovative CNAP2GO device based on the vascular control technique (VCT).137 In contrast to VUT, in which the blood volume needed to be constant for a time interval, the VCT keeps the volume constant with the heartbeats. The CNAP2GO device is a PPG probe that consists of a light source and a photodetector. A slow-moving actuator applies the contact pressure (Fig. 14b). The device provides the mean BP with an accuracy of −1 ± 7 mmHg against the invasive method when tested on 46 volunteers. The device can be integrated into a finger ring and has a self-calibrating system which shows that it is a potential breakthrough for wearable devices.
4.3 In cuff-less techniques
Previously discussed devices partially or completely block the artery to estimate BP, which limits their applications. Therefore they cannot be used for continuous monitoring of BP. Several devices based on optical techniques are proposed to measure BP in continuous mode to overcome these limitations. Xu et al. proposed a flexible organic/inorganic hybrid NIR PPG sensor for BP measurement.19 In this report, an organic phototransistor is fabricated to detect light. The PPG is recorded in transmission as well as in reflectance mode. The PTT technique is used to determine the BP (Fig. 15). The authors defined the error in terms of pulse pressure instead of SBP and DBP, which was 2.5 and 4.2 mmHg for transmission and reflectance mode, respectively, when tested against the commercial Omron BP monitor.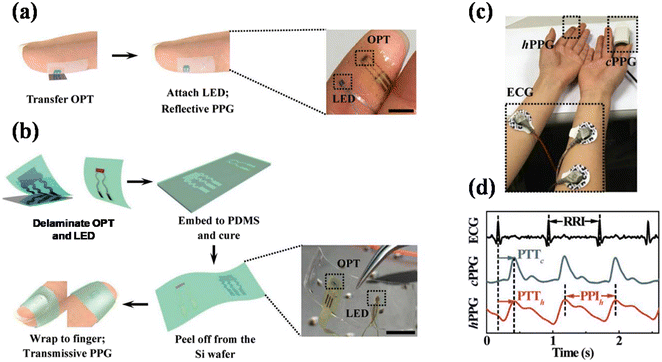 | ||
| Fig. 15 Flexible organic/inorganic hybrid NIR PPG sensor in (a) reflectance and (b) transmission mode. (c) Sensor and ECG attachment, and (d) BP measurement using PTT with R-to-p time delay (adapted from. H. X. et al.19). | ||
Another report based on a piezoresistive mechanism using the PTT approach is presented by Luo et al.16 In this report, a wearable sensor patch system that integrates the fabricated carbon black-decorated fabric piezoresistive sensor device and epidermal ECG electrodes is presented (Fig. 16a). In comparison with the optoelectronic devices, the sensor patch allows ultra-low power consumption of 3 nW. The device provides an error of less than 4 mmHg in the systolic and diastolic pressures when compared with the commercially available cuff-based Omron device. Based on the simplicity of the sensor fabrication, it can be easily implemented and integrated into various medical devices.
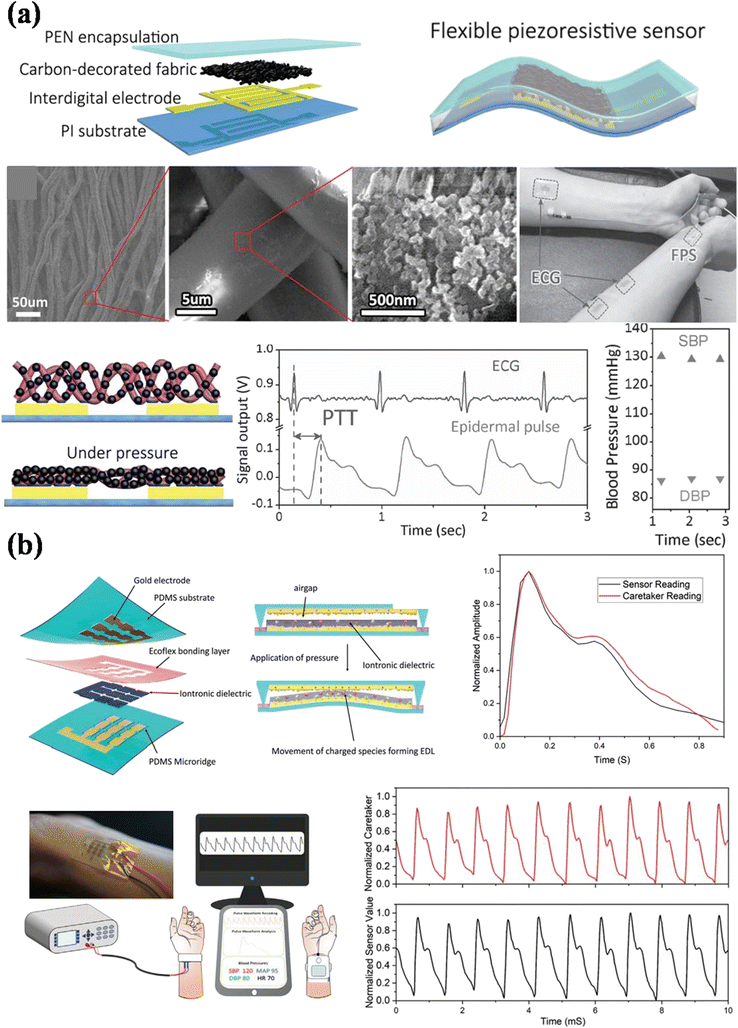 | ||
| Fig. 16 (a) Schematic representation of material and device structure of fabricated carbon black-decorated fabric piezoresistive sensor. The BP was measured using PTT with R-to-p time delay (adapted from N. L. et al.16). (b) Schematic representation of materials and fabrication of soft iontronic capacitive sensor; experimental set-up with the real image of the sensor integrated with the wrist (adapted from P. R. et al.15). | ||
Rwei et al. presented a capacitive mechanism-based soft iontronic sensor for beat-to-beat BP monitoring.15 The sensor is fabricated by sandwiching an ionic gel between PDMS substrates (Fig. 16b). The PWA method estimates the BP, in which the systolic and diastolic pressures correspond to the peaks and valleys of the signal. The MBP is calculated by the traditional formula. The error was found to be 0.48 ± 5.57, 1.43 ± 3.66, and 1.59 ± 2.96 mmHg in SBP, DBP, and MBP, respectively. Similarly, Kim et al., from the same group, report a soft capacitive sensor for beat-to-beat BP monitoring.138 The error was found to be 0.08 ± 2.86, −0.03 ± 1.26, and 0.06 ± 1.84 mmHg, in SBP, DBP, and MBP, respectively. These capacitive sensors show that the blood pressure readings can be recorded continuously and exhibit excellent systolic, diastolic, and mean BP correlations.
4.4 In artificial intelligence or machine learning
Artificial intelligence is currently gaining attention in BP monitoring due to its ability to self-learn from past experiences and tremendous potential for early prediction of hypertension intervention treatment.139 The PPG signal, either raw or pre-processed (to minimize the noise and motion artifact), is generally used as input data to produce machine learning models.140 The easiness of implementation of these models with wearable devices facilitates continuous BP monitoring through adequate processing.Recently, several reports reviewed the possibility of predicting BP and hypertension by using machine learning techniques. Hajj et al. and Elgendi et al. analyzed the PPG signal to assess hypertension and medical conditions.24,141 Koshimizu et al. and Krittanawong et al. reviewed future possibilities to predict and manage hypertension.142,143 The detection of BP and hypertension has been studied in two different approaches: (i) the problem of BP monitoring as a regression task, i.e. the model generates continuous values and (ii) the problem of detecting hypertension as a classification task, i.e., the model generates continuous values.144 However, in summary, these machine learning models can be used to predict BP and hypertension, but there is a lack of open datasets containing a large number of data requirements to build a machine learning model. This represents the opportunity for future studies in which the relevant variable could be sampled.
4.5 Technologies towards BP measurement
Since cuff-less devices have shown the ability to continuously measure BP and provide promising results towards it, therefore the researcher turned to them for further development. Besides BP estimation, various devices using flexible piezoresistive sensors,145–147 capacitive sensors,120,148 and optoelectronic sensors30,149–152 have also been fabricated to detect the PPG signal, which can be used for cuff-less BP measurement. In a report, Yokota et al. proposed an ultra-flexible (3-micron) organic photonic skin to record the arterial pulse (Fig. 17a).30 The organic photodetector was fabricated using a PCBM![[thin space (1/6-em)]](https://www.rsc.org/images/entities/char_2009.gif) :
:![[thin space (1/6-em)]](https://www.rsc.org/images/entities/char_2009.gif) P3HT polymer blend with ITO and Au electrodes. A three-color polymer LED was also manufactured for the light source. The pulse is measured in reflection mode using green and red LED. Signal amplitude of 1 mV is captured using a red polymer LED for up to five consecutive days. The results have demonstrated a flexible reflective pulse oximeter that can further be used for BP and pulse rate estimation.
P3HT polymer blend with ITO and Au electrodes. A three-color polymer LED was also manufactured for the light source. The pulse is measured in reflection mode using green and red LED. Signal amplitude of 1 mV is captured using a red polymer LED for up to five consecutive days. The results have demonstrated a flexible reflective pulse oximeter that can further be used for BP and pulse rate estimation.
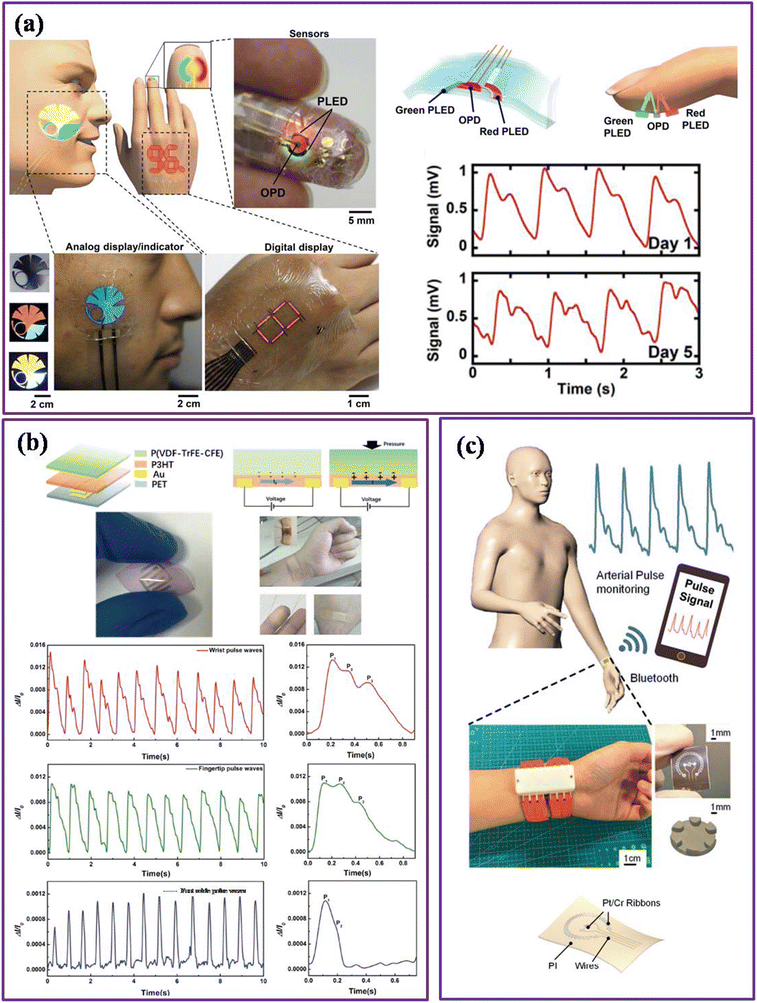 | ||
| Fig. 17 (a) Schematic representation of ultra-flexible organic photonic skin and recorded PPG signal via reflectance mode (adapted from T. Y. et al.30). (b) Flexible polymer sensor for dynamic physiological signal, the device fabrication, performance, and signal acquisition from the wrist, fingertip, and foot ankle (adapted from X. H. et al.147). (c) Silver particle reinforced PDMS wearable sensor for radial pulse monitoring (adapted from Y. F. et al.145). | ||
In another report, Lochner et al. proposed an organic optoelectronic sensor for pulse oximetry, in which an organic photodetector was fabricated using PTB7![[thin space (1/6-em)]](https://www.rsc.org/images/entities/char_2009.gif) :
:![[thin space (1/6-em)]](https://www.rsc.org/images/entities/char_2009.gif) PCBM as an active layer and PEN substrate via spin-coating and printing techniques.149 The pulse response was measured in red (626 nm) and green (532 nm) organic and inorganic LEDs. The PPG signal of around 3 mV was acquired for the combination of OLED and OPD. Although the signal magnitude is reduced compared to the inorganic LED and OPD combination and inorganic PD and OLED, the signal is sufficient to estimate the arterial pulse information. The fabricated device demonstrates the potential for arterial pulse monitoring and will allow blood pressure estimation and better patient care. Similar kinds of photonic devices based on organic and inorganic and visible to infrared photodetectors are also reported to measure arterial pulse wave.151–157
PCBM as an active layer and PEN substrate via spin-coating and printing techniques.149 The pulse response was measured in red (626 nm) and green (532 nm) organic and inorganic LEDs. The PPG signal of around 3 mV was acquired for the combination of OLED and OPD. Although the signal magnitude is reduced compared to the inorganic LED and OPD combination and inorganic PD and OLED, the signal is sufficient to estimate the arterial pulse information. The fabricated device demonstrates the potential for arterial pulse monitoring and will allow blood pressure estimation and better patient care. Similar kinds of photonic devices based on organic and inorganic and visible to infrared photodetectors are also reported to measure arterial pulse wave.151–157
Han et al. presented a flexible polymer sensor for dynamic physiological signals.147 The sensor was fabricated using P(VDF-TrFE-CFE) copolymer and PET substrate via a spin-coating technique (Fig. 17b). P(VDF-TrFE-CFE) is a ferroelectric material that can change its polarization under external stimulation and convert tiny changes in arterial pressure into an electrical signal. Also, P(VDF-TrFE-CFE) exhibits low remnant polarization, which provides a fast change in polarization state under applied and removal pressure. Besides, the semiconducting layer of P3HT helps to increase the sensitivity and provide a signal read-out through a simple circuit without any extra driving voltage on gate dielectrics. Moreover, the elastic modulus of P(VDF-TrFE-CFE) is equivalent to that of the human skin, enabling easy integration to the skin and reducing signal loss. Ultimately, the device can monitor the dynamic pulse under different conditions, such as health conditions, drug conditions, and physical exercise, and estimates the pulse rate from the different locations such as wrist, fingertip, and foot ankle.
Fu et al. presented a wearable sensor using silver particles for radial pulse monitoring.145 The sensor was fabricated using a silver particle-reinforced PDMS layer with an air gap, platinum ribbons, and polyimide substrate (Fig. 17c). When an external pressure is applied, the PDMS membrane is compressed; consequently, thermal conductivity is increased and enhances the heat transfer from the central ribbon to the surroundings. As a result, the output voltage changes with a constant temperature difference in the ribbon. The signal was processed using a homemade conditioning circuit and displayed on a graphical user interface via Bluetooth. The developed device shows potential for homecare pulse monitoring and can be used for blood pressure and pulse rate monitoring in future work.
5. Discussion
We have reviewed the BP measurement techniques, algorithms, wearable devices, most recent developments, and the ideas behind them. The invasive technique cannot perform on a regular basis for BP monitoring. Although the manual technique provides a non-invasive solution, it contains mercury and requires an expert every time, which limits its application for home BP monitoring. Automatic oscillometric techniques solve this problem to some extent and get rid of the expert. Currently, oscillometric BP monitors are used more often in home and clinical settings. The merits and demerits of the oscillometric algorithms were analyzed and addressed in section 2.2 (iii). The main emphasis was on the core algorithms of oscillometric estimation and attempted to improve its accuracy and reduce its reliance on empirical methods. Additionally, a variety of methods for correcting automated blood pressure monitors and eliminating artifacts and interferences were examined.Furthermore, the most recent validation requirements for automated blood pressure monitors were provided. The current universal protocol states that any device that has no more than 5 and 8 mmHg error in the mean and standard deviation, respectively, will be considered acceptable.116 Many reports are available on the accuracy of oscillometric devices in various patient conditions.158–161 However, the error in most oscillometric devices is found acceptable by universal standards, but only in the case of sinus rhythm, where the beat-to-beat BP value is stable. On the contrary, if the beat-to-beat BP value is unstable, such as in atrial contraction and atrial fibrillation, the accuracy of these devices is controversial.162–166 Due to the short-term physiological variability, the evaluation of accuracy with human subjects is not well suited, which limits the performance of such devices under conditions such as obesity and exercise. Although a new guideline includes atrial fibrillation, one of the many causes of irregular pulse, as a special population, there are no specific pass/fail criteria for atrial fibrillation. Therefore, a new algorithm should be developed to improve the accuracy of the device in the case of irregular waveform.
Still, the automated oscillometric technique has several disadvantages, such as it consists of an inflatable cuff, which is quite uncomfortable for the patient or subject and can provide the BP in intermittent mode. Therefore, most efforts have gone toward continuous and cuff-free technologies and discovering novel algorithms to improve accuracy and robustness. The rapid development of flexible and wearable sensors demonstrates a bright future for sensor utilization in continuous health monitoring. We found that developed devices based on the pressure sensor can easily trace the blood pulse wave in the form of a plethysmograph or oscillometric measurement, but generally these pressure sensors require a preload to trace the pulse wave more accurately. On the other hand, optical sensor-based devices provide a preload-free arterial mapping and BP measurement. Furthermore, the optical sensor approach offers an advantage over the pressure sensors to allow the fabrication of very small-scale BP devices. However, the correct position of the sensor at the measurement site is of great importance. A wrong positioning of the sensor can cause inaccuracy in BP measurement.
The accuracy of continuous BP monitoring has been improved in several studies using models and machine learning methods. Despite the fact that significant progress has been made, the majority of research lack standardized study protocols, has a small number of participants, and has a restricted range of BP. Although a universal standard has been established, it has not been widely adopted, and some questions have been raised about the adequacy of the validation of cuffless monitors. It requires the technology, a validation of the calibration, and the capacity to track changes in BP over time after the calibration. As a result, manufacturers are under pressure to validate products in accordance with standards, even if those standards may not be appropriate for all devices. In fact, compared to a more appropriate standard created for this specific type of BP monitor, it might be simpler for the monitor to pass the usual standard criteria. However, the advantages of a truly continuous blood pressure monitor have not yet been proven; continuous BP devices show the feasibility of becoming a widely utilized technology with further research and more extensive validation.
6. Summary
We thoroughly surveyed the various technique and algorithms to estimate the BP with the current universal standard. We have also reviewed the recently developed wearable BP monitoring devices and futuristic technologies for them. This study highlights the importance of BP measurement and its evolution towards accurate, reliable, and user-friendly measurement. Automated oscillometric-based inflationary and deflationary BP monitors are mostly used for home and office BP monitoring due to their reliable accuracy and easy operation. The limitations of the cuff-based technique motivate the development of wearable technologies for continuous monitoring, even in exercising. Cuffless solutions provide several advantages, including skin-attachable, pocket-size, and portability. In the end, some futuristic arterial pulse monitoring devices were also discussed. We hope that the review provided a better understanding of BP measurement techniques, flexible and wearable sensors for developing new healthcare devices, and a new approach for continuous BP monitoring.Conflicts of interest
There are no conflicts to declare.Acknowledgements
The authors would like to thank Dr. Venugopal Achanta, Director, CSIR-National Physical Laboratory, and Dr. Nita Dilawar, Head of Physico Mechanical Metrology Division, for their support and for the use of the necessary facilities. Shubham Kumar would like to thank AcSIR for the Ph.D. program and CSIR for providing the student research fellowship.References
- R. Gupta and D. Xavier, Indian Heart J., 2018, 70, 565 CrossRef PubMed
.
- R. Gupta, K. Gaur and C. V. S. Ram, J. Hum. Hypertens., 2019, 33, 575 CAS
.
- Y. Huang, W. Huang, W. Mai, X. Cai, D. An, Z. Liu, H. Huang, J. Zeng, Y. Hu and D. Xu, J. Hypertens., 2017, 35, 677 CrossRef CAS PubMed
.
- R. Pranata, M. A. Lim, I. Huang, S. B. Raharjo and A. A. Lukito, JRAAS, 2020, 21, 1470320320926899 CAS
.
- N. Campbell, E. R. Young, D. Drouin, B. Legowski, M. A. Adams, J. Farrell, J. Kaczorowski, R. Lewanczuk, M. M. Lum-Kwong and S. Tobe, Can. J. Cardiol., 2012, 28, 262 CrossRef
.
- R. Anchala, N. K. Kannuri, H. Pant, H. Khan, O. H. Franco, E. Di Angelantonio and D. Prabhakaran, J. Hypertens., 2014, 32, 1170 CrossRef CAS PubMed
.
- R. Kumar, P. K. Dubey, A. Zafer, A. Kumar and S. Yadav, Meas.: J. Int. Meas. Confed., 2021, 172, 108845 CrossRef
.
- L. A. Geddes, M. Voelz, C. Combs, D. Reiner and C. F. Babbs, Ann. Biomed. Eng., 1982, 10, 271 CrossRef CAS PubMed
.
- D. S. Picone, R. A. Deshpande, M. G. Schultz, R. Fonseca, N. R. C. Campbell, C. Delles, M. Hecht Olsen, A. E. Schutte, G. Stergiou, R. Padwal, X. H. Zhang and J. E. Sharman, Hypertension, 2020, 75, 1593 CrossRef CAS
.
- Y. Liu, M. Pharr and G. A. Salvatore, ACS Nano, 2017, 11, 9614 CrossRef CAS
.
- Y. Khan, A. E. Ostfeld, C. M. Lochner, A. Pierre and A. C. Arias, Adv. Mater., 2016, 28, 4373 CrossRef CAS PubMed
.
- S. Nasiri and M. R. Khosravani, Sens. Actuators, A, 2020, 312, 112105 CrossRef CAS
.
- T. Arakawa, Sensors, 2018, 18, 2772 CrossRef
.
- S. N. A. Ismail, N. A. Nayan, M. A. S. Mohammad Haniff, R. Jaafar and Z. May, Nanomaterials, 2023, 13, 852 CrossRef CAS PubMed
.
- P. Rwei, C. Qian, A. Abiri, Y. Zhou, E.-F. Chou, M. K. William and C. Tang, Adv. Mater. Interfaces, 2022, 9, 2200294 CrossRef
.
- N. Luo, W. Dai, C. Li, Z. Zhou, L. Lu, C. C. Y. Poon, S. C. Chen, Y. Zhang and N. Zhao, Adv. Funct. Mater., 2016, 26, 1178 CrossRef CAS
.
- Z. Yi, Z. Liu, W. Li, T. Ruan, X. Chen, J. Liu, B. Yang and W. Zhang, Adv. Mater., 2022, 34, 2110291 CrossRef CAS PubMed
.
- X. Ran, F. Luo, Z. Lin, Z. Zhu, C. Liu and B. Chen, Nano Res., 2022, 15, 5500 CrossRef
.
- H. Xu, J. Liu, J. Zhang, G. Zhou, N. Luo and N. Zhao, Adv. Mater., 2017, 29, 1700975 CrossRef PubMed
.
- V. N. Thakur, B. P. Singh, S. Yadav and A. Kumar, RSC Adv., 2020, 10, 9140 RSC
.
- N. Surantha, P. Atmaja, David and M. Wicaksono, Procedia Comput. Sci., 2021, 179, 936 CrossRef
.
- B. Saugel, K. Kouz, A. S. Meidert, L. Schulte-Uentrop and S. Romagnoli, Crit. Care, 2020, 24, 172 CrossRef
.
- M. Forouzanfar, H. R. Dajani, V. Z. Groza, M. Bolic, S. Rajan and I. Batkin, IEEE Rev. Biomed. Eng., 2015, 8, 44 Search PubMed
.
- C. El-Hajj and P. A. Kyriacou, Biomed. Signal Process. Control, 2020, 58, 101870 CrossRef
.
- G. Wang, M. Atef and Y. Lian, IEEE Circuits Syst. Mag., 2018, 18, 6 Search PubMed
.
- T. Panula, J. P. Sirkia, D. Wong and M. Kaisti, IEEE Rev. Biomed. Eng., 2022, 16, 424–438 Search PubMed
.
- X. Quan, J. Liu, T. Roxlo, S. Siddharth, W. Leong, A. Muir, S. M. Cheong and A. Rao, Sensors, 2021, 21, 4273 CrossRef
.
- Z. Yi, W. Zhang and B. Yang, J. Micromech. Microeng., 2022, 32, 103003 CrossRef
.
- A. Al-Qatatsheh, Y. Morsi, A. Zavabeti, A. Zolfagharian, N. Salim, A. Z. Kouzani, B. Mosadegh and S. Gharaie, Sensors, 2020, 20, 4484 CrossRef CAS
.
- T. Yokota, P. Zalar, M. Kaltenbrunner, H. Jinno, N. Matsuhisa, H. Kitanosako, Y. Tachibana, W. Yukita, M. Koizumi and T. Someya, Sci. Adv., 2016, 2, e1501856 CrossRef
.
- Y. Chen, B. Lu, Y. Chen and X. Feng, IEEE Electron Device Lett., 2016, 37, 496 CAS
.
- K. Gupta, V. Jain, A. Qamar, A. K. Singal, S. Ramakrishnan, R. Gupta and N. S. Bajaj, Indian Heart J., 2021, 73, 481 CrossRef
.
- P. B. Gaukroger, J. G. Roberts and T. A. Manners, Anaesth., Pain Intensive Care, 1988, 16, 265 CrossRef CAS
.
- J. M. Lambert, M.-S. Lee, R. A. Taller and D. D. Solomon, J. Vinyl Technol., 1991, 13, 204 CrossRef CAS
.
- A. Pizzoferrato, C. R. Arciola, E. Cenni, G. Ciapetti and S. Sassi, Biomaterials, 1995, 16, 361 CrossRef CAS PubMed
.
- L. Zhang, S. Cao, N. Marsh, G. Ray-Barruel, J. Flynn, E. Larsen and C. M. Rickard, J. Infect. Prev., 2016, 17, 207 CrossRef
.
- K. V. Meena, R. Mathew and A. R. Sankar, Biomed. Phys. Eng. Express, 2017, 3, 045003 CrossRef
.
- W. Hasenkamp, D. Forchelet, K. Pataky, J. Villard, H. Van Lintel, A. Bertsch, Q. Wang and P. Renaud, Biomed. Microdevices, 2012, 14, 819 CrossRef CAS
.
- H. Allen, K. Ramzan, J. Knutti and S. Withers, MRS Online Proc. Libr., 2001, 681, 74 CrossRef
.
- G. Nuttall, J. Burckhardt, A. Hadley, S. Kane, D. Kor, M. S. Marienau, D. R. Schroeder, K. Handlogten, G. Wilson and W. C. Oliver, Anesthesiology, 2016, 124, 590 CrossRef PubMed
.
- S. Dinesh and M. Bhaskaran, J. Anaesthesiol., Clin. Pharmacol., 2010, 26, 528 CrossRef
.
- D. Paskalev, A. Kircheva and S. Krivoshiev, Kidney Blood Pressure Res., 2005, 28, 259 CrossRef PubMed
.
- T. G. Pickering, J. E. Hall, L. J. Appel, B. E. Falkner, J. Graves, M. N. Hill, D. W. Jones, T. Kurtz, S. G. Sheps and E. J. Roccella, Hypertension, 2005, 45, 142 CrossRef CAS
.
- S. A. Yarows and K. Qian, Blood Press. Monit., 2001, 6, 101 CrossRef CAS PubMed
.
- D. Mion and A. M. G. Pierin, J. Hum. Hypertens., 1998, 12, 245 CAS
.
- V. J. Canzanello, P. L. Jensen and G. L. Schwartz, Arch. Intern. Med., 2001, 161, 729 CrossRef CAS
.
- J. W. Graves, M. Tibor, B. Murtagh, L. Klein and S. G. Sheps, Blood Press. Monit., 2004, 9, 13 CrossRef
.
- X. Xuegang, J. Med. Coll. PLA, 2010, 25(1), 19–23 CrossRef
.
- X. Li, G. V. Panicker and J. J. Im, Proc. Annu. Int. Conf. IEEE Eng. Med. Biol. Soc. EMBS, 2016, 255–258 CAS
.
- A. Argha, B. G. Celler and N. H. Lovell, IEEE Journal of Biomedical and Health Informatics, 2020, 25, 1257 Search PubMed
.
- M. Ramsey, Med. Biol. Eng. Comput., 1979, 17, 11 CrossRef
.
- J. C. T. B. Moraes, M. Cerulli and P. S. Ng, Comput. Cardiol., 1999, 26, 467 Search PubMed
.
- H. Sorvoja and R. Myllylä, Molecular and Quantum Acoustics, 2005, 26, 235–260 Search PubMed
.
- V. Jazbinsek, J. Luznik and Z. Trontelj, 3rd Eur. Med. Biomed. Eng. Conf. EMBEC'05, 2005, vol. 11, p. 3 Search PubMed.
- J. N. Amoore, Blood Press. Monit., 2006, 11, 269 CrossRef PubMed
.
- M. Ursino and C. Cristalli, IEEE Trans. Biomed. Eng., 1996, 43, 761 CrossRef CAS
.
- A. Ball-Llovera, R. Del Rey, R. Ruso, J. Ramos, O. Batista and I. Niubo, Annu. Int. Conf. IEEE Eng. Med. Biol. – Proc., 2003, 4, 3173 Search PubMed
.
- G. Drzewiecki, R. Hood and H. Apple, Ann. Biomed. Eng., 1994, 22, 88 CrossRef CAS PubMed
.
- G. Geršak, V. Batagelj and J. Drnovšek, 18th IMEKO World Congr. 2006 Metrol. a Sustain. Dev., 2006, vol. 1, p. 665 Search PubMed.
- G. W. Mauck, C. R. Smith, L. A. Geddes and J. D. Bourl, J. Biomech. Eng., 1980, 102, 28 CrossRef CAS PubMed
.
- A. Soni, S. Kumar and A. Kumar, Mapan – J. Metrol. Soc. India, 2023 DOI:10.1007/s12647-023-00686-2
.
- J. Liu, J. O. Hahn and R. Mukkamala, Proc. Annu. Int. Conf. IEEE Eng. Med. Biol. Soc. EMBS, 2012, p. 633 Search PubMed.
- J. Talts, R. Raamat, K. Jagomägi and J. Kivastik, IFMBE Proc., 2011, 34, 73 Search PubMed
.
- J. Liu, J. O. Hahn and R. Mukkamala, Ann. Biomed. Eng., 2013, 41, 587 CrossRef
.
- R. Raamat, K. Jagomägi, J. Talts and J. Kivastik, 13th IEEE Int. Conf. Bioinforma. Bioeng. IEEE BIBE 2013, 2013, p. 7 Search PubMed.
- S. Chen, V. Z. Groza, M. Bolic and H. R. Dajani, 2009 IEEE Intrumentation Meas. Technol. Conf. I2MTC 2009, 2009, p. 1763 Search PubMed.
-
R. Medero, US Pat., 5577508, 1996 Search PubMed
.
-
B. Leschinnky, US Pat., US8114026B2, 2012 Search PubMed
.
- A. Chandrasekhar, M. Yavarimanesh, J. O. Hahn, S. H. Sung, C. H. Chen, H. M. Cheng and R. Mukkamala, Front. Physiol., 2019, 10, 1 Search PubMed
.
- M. Mafi, M. Bolic, V. Z. Groza, H. R. Dajani and S. Rajan, MeMeA 2011–2011 IEEE Int. Symp. Med. Meas. Appl. Proc., 2011, p. 413 Search PubMed.
- M. Mafi, S. Rajan, M. Bolic, V. Z. Groza and H. R. Dajani, Proc. Annu. Int. Conf. IEEE Eng. Med. Biol. Soc. EMBS, 2011, p. 2492 Search PubMed.
- A. Sapinski, Med. Biol. Eng. Comput., 1994, 32, 599 CrossRef CAS
.
- S. H. Song, D. K. Kim, J. S. Lee, Y. J. Chee and I. Y. Kim, Comput. Cardiol., 2009, 36, 737 Search PubMed
.
- S. Lee, S. Rajan, H. R. Dajani, V. Z. Groza and M. Bolic, Conf. Rec. – IEEE Instrum. Meas. Technol. Conf., 2011, 213 Search PubMed
.
- P. K. Lim, S. C. Ng, W. A. Jassim, S. J. Redmond, M. Zilany, A. Avolio, E. Lim, M. P. Tan and N. H. Lovell, Sensors, 2015, 15, 14142 CrossRef PubMed
.
- S. Lee, A. Ahmad and G. Jeon, J. Med. Syst., 2018, 42, 1 CrossRef
.
- M. Forouzanfar, H. R. Dajani, V. Z. Groza, M. Bolic and S. Rajan, SOFA 2010 - 4th Int. Work. Soft Comput. Appl. Proc., 2010, p. 119 Search PubMed.
- S. Lee and J. H. Chang, IEEE Access, 2017, 5, 9962 Search PubMed
.
- A. Argha, J. Wu, S. W. Su and B. G. Celler, IEEE Access, 2019, 7, 113427 Search PubMed
.
- A. Argha and B. G. Celler, IEEE Trans. Instrum. Meas., 2020, 69, 3614 Search PubMed
.
- B. G. Celler, P. N. Le, A. Argha and E. Ambikairajah, IEEE Trans. Instrum. Meas., 2020, 69, 3631 Search PubMed
.
- H. C. Lin, A. Lowe and A. Al-Jumaily, Artif. Intell. Res., 2014, 3(2), 16–23 Search PubMed
.
- A. Argha, B. G. Celler and N. H. Lovell, IEEE Rev. Biomed. Eng., 2022, 15, 152 Search PubMed
.
- M. Liu, L.-M. Po and H. Fu, Int. J. Comput. Theory Eng., 2017, 9, 202 CrossRef
.
- X. F. Teng and Y. T. Zhang, Annu. Int. Conf. IEEE Eng. Med. Biol. – Proc., 2003, 4, 3153 Search PubMed
.
- J. Allen, Physiol. Meas., 2007, 28(3), 1–39 CrossRef
.
- Y. Kurylyak, F. Lamonaca and D. Grimaldi, Conf. Rec. – IEEE Instrum. Meas. Technol. Conf., 2013, 280 Search PubMed
.
- M. Nitzan, B. Khanokh and Y. Slovik, Physiol. Meas., 2002, 23, 85 CrossRef CAS
.
- J. Allen and A. Murray, J. Hum. Hypertens., 2002, 16, 711 CAS
.
- L. A. Geddes, M. H. Voelz, C. F. Babbs, J. D. Bourland and W. A. Tacker, Psychophysiology, 1981, 18, 71 CrossRef CAS
.
- R. Mukkamala, J. O. Hahn, O. T. Inan, L. K. Mestha, C. S. Kim, H. Toreyin and S. Kyal, IEEE Trans. Biomed. Eng., 2015, 62, 1879 Search PubMed
.
- A. Hennig and A. Patzak, Somnologie, 2013, 17, 104 CrossRef
.
- H. Gesche, D. Grosskurth, G. Küchler and A. Patzak, Eur. J. Appl. Physiol., 2012, 112, 309 CrossRef PubMed
.
- Y. Chen, C. Wen, G. Tao, M. Bi and G. Li, Ann. Biomed. Eng., 2009, 37, 2222 CrossRef PubMed
.
- Y. Chen, C. Wen, G. Tao and M. Bi, Ann. Biomed. Eng., 2012, 40, 871 CrossRef
.
- H. J. Baek, K. K. Kim, J. S. Kim, B. Lee and K. S. Park, Physiol. Meas., 2010, 31, 145 CrossRef PubMed
.
- Q. Zhang, X. Chen, Z. Fang, Y. Xue, Q. Zhan, T. Yang and S. Xia, J. Micromech. Microeng., 2017, 27(2), 1–6 Search PubMed
.
- Y. Zheng, C. C. Y. Poon, B. P. Yan and J. Y. W. Lau, J. Med. Syst., 2016, 40(195), 1–11 Search PubMed
.
- C. S. Kim, A. M. Carek, R. Mukkamala, O. T. Inan and J. O. Hahn, IEEE Trans. Biomed. Eng., 2015, 62, 2657 Search PubMed
.
- G. Zhang, M. Gao, D. Xu, N. B. Olivier and R. Mukkamala, J. Appl. Physiol., 2011, 111, 1681 CrossRef PubMed
.
-
A. Noordergraaf, Circulatory System Dynamics, Academic Press Inc., 1978 Search PubMed
.
- J. E. Wagenseil and R. P. Mecham, J. Cardiovasc. Transl. Res., 2012, 5, 264 CrossRef
.
- M. Sharma, K. Barbosa, V. Ho, D. Griggs, T. Ghirmai, S. Krishnan, T. Hsiai, J.-C. Chiao and H. Cao, Technologies, 2017, 5, 21 CrossRef
.
- D. B. McCombie, A. T. Reisner and H. H. Asada, 2006 International Conference of the IEEE Engineering in Medicine and Biology Society, New York, NY, USA, 2006, pp. 3521–3524, DOI:10.1109/IEMBS.2006.260590.
- M. Kachuee, M. M. Kiani, H. Mohammadzade and M. Shabany, Proc. – IEEE Int. Symp. Circuits Syst., 2015, 1006–1009 Search PubMed
.
- M. Kachuee, M. M. Kiani, H. Mohammadzade and M. Shabany, IEEE Trans. Biomed. Eng., 2017, 64, 859 Search PubMed
.
- M. F. O'Rourke and A. P. X. J. Jiang, Br. J. Clin. Pharmacol., 2001, 51, 507 CrossRef PubMed
.
- A. P. Avolio, M. Butlin and A. Walsh, Physiol. Meas., 2010, 31, R1 CrossRef
.
- S. Suzuki and K. Oguri, Proc. 31st Annu. Int. Conf. IEEE Eng. Med. Biol. Soc. Eng. Futur. Biomed. EMBC 2009, 2009, p. 6765 Search PubMed.
- J. C. Ruiz-Rodríguez, A. Ruiz-Sanmartín, V. Ribas, J. Caballero, A. García-Roche, J. Riera, X. Nuvials, M. De Nadal, O. De Sola-Morales, J. Serra and J. Rello, Intensive Care Med., 2013, 39, 1618 CrossRef PubMed
.
- M. Elgendi, Curr. Cardiol. Rev., 2012, 8, 14 CrossRef PubMed
.
- J. I. Davies and A. D. Struthers, J. Hypertens., 2003, 21, 463 CrossRef CAS
.
- K. Hirata, M. Kawakami and M. F. O'Rourke, Circ. J., 2006, 70, 1231 CrossRef
.
- G. S. Stergiou, J. Wang, B. S. Alpert, S. Mieke and E. O. Brien, J. Clin. Hypertens., 2018, 20, 1096 CrossRef
.
- IEEE, IEEE Standard for Wearable Cuffless Blood Pressure Measuring Devices, IEEE Std 1708–2014, 2014 Search PubMed.
- G. S. Stergiou, B. Alpert, S. Mieke, R. Asmar, N. Atkins, S. Eckert, G. Frick, B. Friedman, T. Gra, T. Ichikawa, J. P. Ioannidis, P. Lacy, R. Mcmanus, A. Murray, M. Myers, P. Palatini, G. Parati, D. Quinn, J. Sarkis, A. Shennan, T. Usuda, J. Wang, C. O. Wu and E. O. Brien, Hypertesion, 2018, 71, 1 CrossRef
.
- IEEE Engineering in Medicine and Biology Society, IEEE Standard for Wearable, Cuffless Blood Pressure Measuring Devices IEEE Engineering in Medicine and Biology Society, 2019 Search PubMed.
- Non-Invasive Sphygmomanometers — Part 3: Clinical Investigation of Continuous Automated Measurement Type, 2022 Search PubMed.
- G. S. Stergiou, A. P. Avolio, P. Palatini, K. G. Kyriakoulis, A. E. Schutte, S. Mieke, A. Kollias, G. Parati, R. Asmar, N. Pantazis, A. Stamoulopoulos, K. Asayama, P. Castiglioni, A. De La Sierra, J. O. Hahn, K. Kario, R. J. McManus, M. Myers, T. Ohkubo, S. G. Shroff, I. Tan, J. Wang, Y. Zhang, R. Kreutz, E. O'Brien and R. Mukkamala, J. Hypertens., 2023, 41, 2074 CrossRef CAS PubMed
.
- Y. Xiong, Y. Shen, L. Tian, Y. Hu, P. Zhu, R. Sun and C. P. Wong, Nano Energy, 2020, 70, 104436 CrossRef CAS
.
- Bijender and A. Kumar, Sens. Actuators, A, 2022, 344, 113770 CrossRef CAS
.
- Bijender and A. Kumar, ACS Omega, 2020, 5, 16944–16950 CrossRef CAS PubMed
.
- Bijender and A. Kumar, Mater. Chem. Phys., 2023, 304, 127872 CrossRef CAS
.
- Bijender and A. Kumar, Sens. Bio-Sens. Res., 2021, 33, 100434 CrossRef
.
- Bijender and A. Kumar, Biomedical Materials & Devices, 2023, 1, 1009–1021 Search PubMed
.
- V. N. Thakur, Polymers, 2022, 20, 4414 CrossRef
.
- H. Ouyang, J. Tian and G. Sun, Adv. Mater., 2017, 29(40), 1–10 CrossRef
.
- E. S. Vigato, M. C. de Souza, P. R. Dordetto and J. L. T. Lamas, Rev. Bras. Enferm., 2022, 75, e20210658 CrossRef
.
- J. Li and Y. Sawanoi, 2017 IEEE Hist. ELectrotechnolgy Conf. HISTELCON 2017, 2018, p. 82 Search PubMed.
- S. Kumar, Bijender, S. Yadav and A. Kumar, Sens. Actuators, A, 2021, 328, 112767 CrossRef CAS
.
- S. Kumar, S. Yadav and A. Kumar, Biomed. Eng. Adv., 2022, 4, 100046 CrossRef
.
- Bijender, S. Kumar, A. Soni and A. Kumar, RSC Adv., 2023, 13, 35397–35407 RSC
.
- S. Kumar, S. Yadav and A. Kumar, in 2023 IEEE SENSORS, IEEE, 2023, pp. 1–4 Search PubMed.
- A. Chandrasekhar, C. Kim, M. Naji, K. Natarajan, J. Hahn and R. Mukkamala, Sci. Transl. Med., 2018, 8674, 1 Search PubMed
.
- A. Chandrasekhar, K. Natarajan, M. Yavarimanesh and R. Mukkamala, Sci. Rep., 2018, 8, 18 CrossRef
.
- T. Panula, T. Koivisto, M. Pänkäälä, T. Niiranen, I. Kantola and M. Kaisti, Biosens. Bioelectron., 2020, 167, 112483 CrossRef CAS PubMed
.
- J. Fortin, D. E. Rogge, C. Fellner, D. Flotzinger, J. Grond, K. Lerche and B. Saugel, Nat. Commun., 2021, 12, 1387 CrossRef CAS PubMed
.
- J. Kim, E. F. Chou, J. Le, S. Wong, M. Chu and M. Khine, Adv. Healthcare Mater., 2019, 8, 1 CAS
.
- S. N. A. Ismail, N. A. Nayan, R. Jaafar and Z. May, Sensors, 2022, 22, 6195 CrossRef PubMed
.
- Z. Y. Luo, J. Cui, X. J. Hu, L. P. Tu, H. D. Liu, W. Jiao, L. Z. Zeng, C. C. Jing, L. J. Qiao, X. X. Ma, Y. Wang, J. Wang, C. H. Pai, Z. Qi, Z. F. Zhang and J. T. Xu, BioMed Res. Int., 2018, 2018, 2964816 Search PubMed
.
- M. Elgendi, R. Fletcher, Y. Liang, N. Howard, N. H. Lovell, D. Abbott, K. Lim and R. Ward, NPJ Digit. Med., 2019, 2, 1 CrossRef
.
- H. Koshimizu, R. Kojima and Y. Okuno, Hypertens. Res., 2020, 43, 1327 CrossRef
.
- C. Krittanawong, A. S. Bomback, U. Baber, S. Bangalore, F. H. Messerli and W. H. Wilson Tang, Curr. Hypertens. Rep., 2018, 20, 75 CrossRef PubMed
.
- E. Martinez-Ríos, L. Montesinos, M. Alfaro-Ponce and L. Pecchia, Biomed. Signal Process. Control, 2021, 68, 102813 CrossRef
.
- Y. Fu, S. Zhao, L. Wang and R. Zhu, Adv. Healthcare Mater., 2019, 8, 1 Search PubMed
.
- Y. Chu, J. Zhong, H. Liu, Y. Ma, N. Liu, Y. Song, J. Liang, Z. Shao, Y. Sun, Y. Dong, X. Wang and L. Lin, Adv. Funct. Mater., 2018, 28, 1 Search PubMed
.
- X. Han, X. Chen, X. Tang, Y. L. Chen, J. H. Liu and Q. D. Shen, Adv. Funct. Mater., 2016, 26, 3640 CrossRef CAS
.
- S. R. A. Ruth, L. Beker, H. Tran, V. R. Feig, N. Matsuhisa and Z. Bao, Adv. Funct. Mater., 2020, 30, 1 Search PubMed
.
- C. M. Lochner, Y. Khan, A. Pierre and A. C. Arias, Nat. Commun., 2014, 5, 1 Search PubMed
.
- H. Jinno, T. Yokota, M. Koizumi, W. Yukita, M. Saito, I. Osaka, K. Fukuda and T. Someya, Nat. Commun., 2021, 12, 4 CrossRef
.
- A. Bilgaiyan, F. Elsamnah, H. Ishidai, C. H. Shim, M. A. Bin Misran, C. Adachi and R. Hattori, ACS Appl. Electron. Mater., 2020, 2, 1280 CrossRef CAS
.
- F. Elsamnah, A. Bilgaiyan, M. Affiq, C. H. Shim, H. Ishidai and R. Hattori, Biosensors, 2019, 9, 1 Search PubMed
.
- C. Li, H. Chen, S. Zhang, W. Yang, M. Gao, P. Huang, M. Wu, Z. Sun, J. Wang and X. Wei, ACS Appl. Electron. Mater., 2022, 4, 1583 CrossRef CAS
.
- A. Joseph, A. B. Pillai, V. K. Pulikodan, A. Alexander, R. Muhammed and M. A. G. Namboothiry, ACS Appl. Electron. Mater., 2022, 4, 1567 CrossRef CAS
.
- T. H. Kim, C. S. Lee, S. Kim, J. Hur, S. Lee, K. W. Shin, Y. Z. Yoon, M. K. Choi, J. Yang, D. H. Kim, T. Hyeon, S. Park and S. Hwang, ACS Nano, 2017, 11, 5992 CrossRef CAS
.
- J. Kim, N. Kim, M. Kwon and J. Lee, ACS Appl. Mater. Interfaces, 2017, 9, 25700 CrossRef CAS
.
- L. W. Lo, J. Zhao, H. Wan, Y. Wang, S. Chakrabartty and C. Wang, ACS Appl. Mater. Interfaces, 2021, 13, 21693 CrossRef CAS
.
- M. Ruzicka, A. Akbari, E. Bruketa, J. F. Kayibanda, C. Baril and S. Hiremath, PLoS One, 2016, 11, 1 CrossRef
.
- A. de Greeff, I. Lorde, A. Wilton, P. Seed, A. J. Coleman and A. H. Shennan, J. Hum. Hypertens., 2010, 24, 58 CAS
.
- R. Padwal, A. Jalali, D. McLean, S. Anwar, K. Smith, P. Raggi and J. S. Ringrose, Blood Press. Monit., 2019, 24, 33 CrossRef PubMed
.
- D. Nelson, B. Kennedy, C. Regnerus and A. Schweinle, J. Dent. Hyg., 2008, 82, 35 Search PubMed
.
- F. Xie, J. Xu, H. Liu, X. Li, Y. Wu and H. Su, J. Hum. Hypertens., 2021, 35, 785 CAS
.
- M. Halfon, G. Wuerzner, P. Marques-Vidal, P. Taffe, J. Vaucher, B. Waeber, L. Liaudet, Z. Ltaief, M. Popov and G. Waeber, Blood Press., 2018, 27, 48 CrossRef
.
- H. Su and Z. Guo, J. Hum. Hypertens., 2022, 36, 229 Search PubMed
.
- F. Xie, J. Xu, L. L. Xia, X. Luo, Z. Jiang, Y. Wu and H. Su, Hypertens. Res., 2020, 43, 518 CrossRef PubMed
.
- S. Kumar, S. Yadav and A. Kumar, J. Hum. Hypertens., 2023, 1 Search PubMed
.
| This journal is © The Royal Society of Chemistry 2024 |

